Abstract
Interaction of regulatory networks is a subject of great interest in systems biology of bacteria. Phosphate control of metabolism in Streptomyces is mediated by the two-component system PhoR–PhoP. Similarly, the utilization of different nitrogen sources is controlled by the regulator GlnR. Transcriptomic and biochemical analysis revealed that glnA (encoding a glutamine synthetase), glnR and other nitrogen metabolism genes are under PhoP control. DNA-binding experiments showed that PhoP binds to other nitrogen-regulated genes (SCO0255, SCO01863 and ureA). Using the glnA promoter as model, we observed that PhoP and GlnR compete for binding to the same promoter region, showing GlnR a higher affinity. Using a total of 14 GlnR-binding sites (50 direct repeat units) we established two information-based models that describe the GlnR box as consisting of two 11-nt direct repeats each with clear differences to PHO box. DNA-binding studies with different mutant sequences of glnA promoter revealed that the sequence recognized by GlnR is found in the coding strand whereas that recognized by PhoP is overlapping in the non-coding strand. In amtB promoter PhoP and GlnR boxes are not totally overlapping and both proteins bind simultaneously. PhoP control of nitrogen metabolism genes helps to balance the cellular P/N equilibrium.
INTRODUCTION
Soil-dwelling actinomycetes produce a large array of bioactive secondary metabolites (1). Biosynthesis of these secondary metabolites is controlled by the availability of carbon, nitrogen and phosphate sources (2,3). Particularly relevant is the concentration in the culture medium of easily utilizable nitrogen sources (4) and phosphate (5,6). Specific sets of genes, including those for secondary metabolite biosynthesis, are upregulated in response to phosphate deprivation (7,8) or ammonium limitation (4,9).
Phosphate control of metabolism in several Streptomyces species is mediated by the two-component PhoR–PhoP system (10–12). Expression of genes belonging to the pho regulon in Streptomyces coelicolor is positively regulated by binding of the phosphorylated response regulator PhoP (PhoP∼P) to operators which contain two or more 11-nt direct repeat units (DRus). Two DRus form the so-called PHO box (13,14). It should be noted that protein-binding sites are defined by the conservation of the sequence of one strand, but proteins interact with both strands of the DNA.
The number and organization of DRus has been determined in several PhoP-regulated promoters by directed mutagenesis of the nucleotides in the conserved positions of those DRus, by electrophoretic mobility shift assays (EMSA) and by footprinting assays (15,16). The regulatory mechanism involves cooperative binding of phosphorylated PhoP to the core (highly conserved) DRus followed by the binding of additional PhoP∼P monomers to adjacent less conserved DRus (15).
Nitrogen sources and phosphate control microbial growth through interconnected networks. The overall nitrogen metabolism is regulated in S. coelicolor by mechanisms that involve an apparent duplication of some structural and regulatory genes (4). A central role in nitrogen metabolism is played by the glutamine synthetase that assimilates ammonium into the cellular organic nitrogen.
There are five genes in S. coelicolor which encode glutamine synthetase-like proteins (17), two of these proteins have been shown to possess glutamine synthetase activity: GlnA (glutamine synthetase I, β-subtype) and GlnII (eukaryotic type glutamine synthetase II) (18). Three genes amtB, glnK, glnD form an operon (9) encoding three proteins that play an important role in ammonium transport and metabolism. amtB encodes a putative ammonium transporter and glnK codes for the protein PII (19), a signal transmitter protein which—in Enterobacteriaceae—is involved in modulating the activation/inactivation of the glutamine synthetase by adenylation/deadenylation (20). The third gene (glnD) in the amtB–glnK–glnD operon encodes an enzyme (PII nucleotidyl transferase) that modifies the protein PII post-translationally by adenylylation (19). In contrast to other bacteria, the adenylyltransferase GlnE which activates/inactivates GlnA in response to the nitrogen availability (21) is not controlled by the GlnD/PII system in S. coelicolor (19).
Two regulatory genes glnR (22,23) and glnRII control expression of the nitrogen metabolism genes at the transcriptional level (9,24). GlnR is the main nitrogen regulator in S. coelicolor and binds to so-called ‘GlnR-boxes’ in the promoter regions of glnA, glnII, amtB and other nitrogen metabolism genes. The GlnR box has been proposed to be formed by 22 nt with a consensus sequence gTnAc-n6-GaAAc-n6 (24). These sequences are formed by two direct repeats of different degree of conservation (the so-called a- and b-sites). GlnRII, a second response regulator similar to GlnR, is encoded by an ORF located downstream of glnII (9), although the exact nucleotide sequence recognized by this protein has not been described. When compared to PhoP binding the mechanism of GlnR interaction with the GlnR-boxes is not well-known.
Recently, we found that phosphate exerts a negative control over several genes involved in nitrogen metabolism in S. coelicolor (25,26). The response regulator (PhoP) of phosphate metabolism binds to the glnR promoter, encoding the major nitrogen regulator as shown by EMSA studies, but not to the glnRII promoter under identical experimental conditions. PhoP also binds to the promoters of glnA, glnII and to the amtB–glnK–glnD operon. Thus, the negative control is both direct and indirect through the glnR promoter binding. In vivo expression studies using luxAB as reporter showed that PhoP represses the above mentioned nitrogen metabolism genes (25).
Two-component regulatory systems consist of a sensor kinase and a cognate response regulator (27,28). PhoP and GlnR are related proteins belonging to the OmpR family of response regulators (29). PhoP is the response regulator of the two-component system PhoR–PhoP (10), whereas GlnR is an orphan response regulator (22). The response regulators have several residues that form the phosphorylation pocket near the N-end of the protein and an aspartic acid (the phosphorylated residue) at the middle of the N-terminal domain that defines the so-called ‘typical’ response regulators (30). GlnR is classified as a ‘typical’ orphan response regulator because it contains these motifs in its structure, but it is not linked to a cognate sensor kinase (29). Both PhoP and GlnR contain an HTH (helix-turn-helix) DNA-binding domain near their C-terminal ends (13,24).
Taking into account the similarity of PhoP and GlnR, it was of great interest to clarify the relationship existing between these two global regulators in Streptomyces. The purpose of this work was to determine whether these two regulatory proteins were competing for interaction with sequences that could be overlapping in the glnA and other nitrogen-regulated promoters, or if there is a cross-regulation, i.e. if there is a control by GlnR over PhoP-regulated genes in addition to the previously described binding of PhoP to GlnR-regulated promoters (25).
MATERIALS AND METHODS
Regulatory proteins expression and purification
The fusion protein GST-PhoPDBD was expressed in Escherichia coli DH5α and purified in an ÄKTA-FPLC using a Glutathione Sepharose 4B column (GE Healthcare) as described previously (13). The GST-PhoPDBD protein was eluted with 10 mM reduced glutathione (in 50 mM Tris–HCl, pH 8.0) and conserved in 40% glycerol at −80°C before use. GlnR was expressed in E. coli with an N-terminal StrepII-tag and purified with StrepTactin Superflow gravity-flow columns (IBA), as described previously (24). Protein was stored at −80°C in 50 mM Tris–HCl (pH 8.0), 100 mM NaCl and 10 mM β-mercaptoethanol.
DNA manipulations
Promoters of SCO0255 (from −315 to +32 with respect to translation start site), SCO1863 (from −340 to +13), SCO2195 (from −261 to +7) and ureA (from −278 to +19) for EMSA analyses were amplified by PCR and cloned into pGEM-T Easy (Promega). The phoRP, pstS, glnA, amtB and glnII promoters were obtained from pBS-PphoRP, pGEM-PpstS (13), pGEM-PglnA, pGEM-PamtB and pGEM-PglnII (25) plasmids, respectively. For analysis of the glnA promoter, different mutants were constructed with the QuickChange Site-Directed Mutagenesis Kit (Stratagene) using the pGEM-PglnA plasmid as template. The primers used in this work are listed in the Supplementary Table S1. The correct amplification was tested by sequencing using an ABI PRISM 3130 Genetic Analyzer (Applied Biosystems).
Electrophoretic mobility shift assays
DNA-protein interaction was tested by EMSA analysis. The promoters were excised from the corresponding plasmids by endonuclease digestion and labelled at both ends with digoxigenin using the DIG Oligonucleotide 3′-End Labeling Kit, 2nd Generation (Roche Applied Science). Binding reactions with GST-PhoPDBD protein were performed in 10 mM Tris–HCl (pH 8.0), 0.4 mM MgCl2, 10 mM KCl, 0.2 mM DTT, 1.6 mM reduced glutathione, 0.01% Nonidet P40 and 13% glycerol (named buffer B in this work), for 30 min at 30°C (13). Binding reactions with GlnR protein were performed in 50 mM Tris–HCl (pH 8.0), 100 mM NaCl and 10 mM β-mercaptoethanol (named buffer A), for 15 min at room temperature (24). Alternatively, competition experiments and binding reactions with mutated promoters were performed in 50 mM Tris–HCl (pH 8.0), 100 mM NaCl, 0.4 mM β-mercaptoethanol, 0.18 mM reduced glutathione and 5.76% glycerol, for 20 min at room temperature, both for GST-PhoPDBD and GlnR proteins. In competition experiments the two proteins were added simultaneously to avoid a preferential binding of the probe for one of the proteins. In any case an excess of 50 µg/ml of poly[d(I-C)] was added to every reaction mixture as internal control to avoid unspecific binding of protein to DNA. The samples were loaded onto a 5% polyacrylamide native gel (14 cm × 16 cm) in 0.5X TBE buffer, running the electrophoresis at 80 V for 5 h. DNA was electroblotted onto a nylon membrane in 0.5X TBE buffer (1 h, 200 mA), fixed by UV cross-linking and detected with anti-digoxigenin antibodies by chemiluminiscence with the CDP-Star™ reagent (Roche Applied Science).
DNase I footprinting assays
The sequences bound by the Strep-GlnR protein in the SCO0888 and SCO7155 genes were determined by the non-radioactive DNase I footprinting assay described previously (31,32). The promoter regions of both genes were obtained by PCR using primer pairs CAR87 and CAR88, and CAR89 and CAR90, respectively. PCR products were digested with SphI-MluI and inserted into the pGEM-5zf(+) vector (Promega) to yield pAR-N9 and pAR-N11, respectively. Cloned sequences comprised the region of the SCO0888 gene from −141 to +11 (positions numbered with respect to the translation start site), and the region −264 to −13 of the SCO7155 gene. Using these plasmids as templates, DNA probes were obtained by PCR using one 6-FAM-modified primer for labelling only one strand. Labelled and unlabelled primer pairs correspond to the T7 and SP6 promoter sequences of the pGEM-5zf(+) vector. The corresponding labelled primers were used also for sequencing with the Thermo Sequenase Primer Cycle Sequencing Kit (GE Healthcare).
Reaction mixtures contained 9.3 nM of labelled DNA probes. Two reaction buffers were assayed yielding the same results. One buffer is based on the one used by Tiffert et al. (24) and it is characterized by the high salt concentration: 50 mM Tris·HCl pH 8, 100 mM NaCl, 6% glycerol, 0.4 mM MgCl2, 1.0 mM DTT and 50 μg/ml poly[d(I-C)]. The other had the usual composition of footprinting buffers: 50 mM Tris·HCl pH 8, 50 mM KCl, 6% glycerol, 1.0 mM MgCl2, 0.2 mM DTT and 10 μg/ml poly[d(I-C)]. Control reactions without protein were supplemented with the protein solution buffer. After binding of the Strep-GlnR protein to DNA (30°C, 20 min), DNase I (Roche) digestion was carried out during 1 min at 30°C (from 0.5 10−1 to 2.0 10−1 units/ml).
Reactions were phenolized, ethanol precipitated and loaded into an ABI PRISM 3130 sequencer together with the molecular standard Gene-Scan® 500 LIZ™ (Applied Biosystems). Electropherograms were analysed with PeakScanner v1.0 software (Applied Biosystems) to determine the protected sequence.
The binding sites of PhoP in the SCO0255, SCO1863 and ureA promoters were determined by the footprinting procedure described above. The plasmids that contained the promoters cloned in pGEM-T Easy were used as PCR templates for labelling. The reaction conditions were those of Santos-Beneit et al. (32) and 4 μM of the GST-PhoPDBD protein.
‘Information theory’ analysis of binding sites
The Delila package programs (makebk, encode, rseq, dalvec, makelogo, ri and lister) were used to calculate the information content (Ri value) of individual sequences (33), and to obtain logos and walkers for the analysis of binding sites (34,35). To calculate the information content a weight matrix from the frequencies of each nucleotide at each position of the aligned sequences is generated and applied to the sequences themselves to determine the conservation of each individual sequence (33). The logo is a representation made by the alignment of different sequences where the height of each letter is proportional to the frequency of that base in the alignment, and the height of the letter stack is the conservation in bits at that position (33). The positive or negative height of each letter in a walker shows the contribution of that base to the average sequence conservation of the binding site (35). Promoter sequences were scanned for binding sites using the RSA tools server (36) and information score matrices.
RESULTS
PhoP binds to the promoter region of several additional genes of nitrogen metabolism
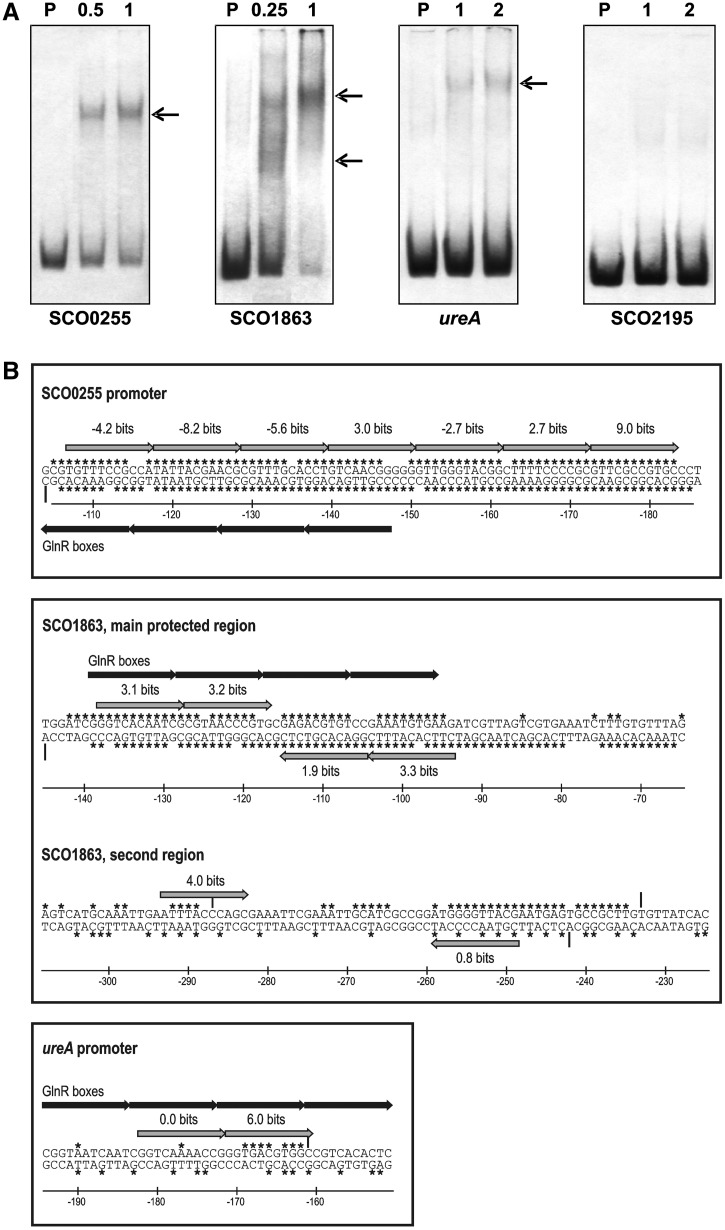
Since we have shown in a previous article that PhoP binds to the promoters of glnR, glnA, glnII and amtB (25), we decided to analyse all the promoters described to be regulated by GlnR (24) looking for the presence of PHO boxes using the matrix model version 2 of PhoP operator. Sola-Landa et al. (15) described the structure of PhoP operators (named model 1 operator). This model relies in an information content matrix calculated from the alignment of 11-nt sequences using the Delila programs (33). These sequences are DRus that form the PhoP-binding sites. In this work, we updated the PhoP-binding site model (named model 2 operator) taking into account the sequences of the SCO2878 operator (15), and the recently experimentally confirmed operators found in the afsS promoter (32), in the glnR, glnA, glnII, amtB promoter regions (25), and those in the glpQ1 and glpQ2 promoters (37). As with model 1, model 2 matrix included only type C (core) DRus (54 DRUs in model 2, 17 more than in model 1). We found four new N metabolism candidates to be regulated by PhoP namely: SCO0255 (coding for a putative transcriptional regulator), SCO1863 (a hypothetical protein), SCO2195 (another hypothetical protein) and ureA (encoding the urease gamma subunit). These promoters were analysed by EMSA, obtaining a positive PhoP binding with SCO0255, SCO1863 and ureA, although in this last case the binding was detected only with a high concentration of protein (Figure 1A). The PhoP-binding sites in these promoters were determined by footprinting (see Supplementary Figure S1). The SCO0255 promoter was protected from DNase I digestion by the GST-PhoPDBD protein on 80 nt in the coding strand and 79 on the complementary strand. This large protected region contains 7 DRus of 11 nt with different degree of conservation (located between positions −183 to −108 from the start codon). These consecutive sequences which form the PhoP-binding sites are located on the non-coding strand. The four first DRus overlap with the two putative GlnR boxes which are located in the coding strand (24) (Figure 1B and Supplementary Figure S1A).
Figure 1.
(A) Analysis by EMSA of binding of PhoP to different promoters regulated by GlnR. P, probe without protein. Numbers indicate the GST-PhoPDBD concentration (µM). The conditions of binding reaction were the usual for PhoP (13). (B) Summary of the DNase I footprints of SCO0255, SCO1863 and ureA genes with GST-PhoPDBD protein. The protected nucleotides are indicated by asterisks and the hypersensitive sites created by protein binding are highlighted by vertical arrows. Coordinates are relative to the translation start codons. The 11-nt direct repeats that form the PhoP-binding sites are indicated by grey arrows; the direct repeats that constitute the GlnR boxes according to Tiffert et al. (24) are indicated by black arrows. The Ri values above each arrow (information content) of the PhoP repeats were calculated using model 2.
The SCO1863 promoter was protected in both strands in two large regions (Supplementary Figure S1B). The first region was clearly protected, as shown by the lowered electropherogram peaks, and comprised 2 DRus in the coding strand (positions −138 to −117), and 2 DRus in the non-coding strand (positions −116 to −94) (Figure 1B). This configuration of two opposite PHO boxes has not been described previously. Interestingly, the two putative GlnR boxes located previously (24) overlap this region (Figure 1B). A second region of the SCO1863 promoter contained several protected peaks intertwined with some unprotected ones across 70 base pairs (−304 to −235) (Supplementary Figure S1C). The bioinformatics analysis of this sequence using PhoP model 2 revealed only two separated DRus with positive information content (Figure 1B). These results can be explained taking into account the EMSA results. As shown in Figure 1A, at lower protein concentrations one DNA–protein complex of faster migration is formed (lane 0,25); but higher protein concentrations result in the DNA–protein complex of slower migration only (lane 1). It is proposed that the first complex is due to the occupancy of the PHO boxes identified in the main protected region that would act as the site core; higher protein concentrations allow PhoP to bind also the second region of low conservation in a cooperative fashion. The promoter of the urease gamma subunit gene, ureA, was poorly protected from DNase I digestion (Supplementary Figure S1D), what is in agreement with the need of high protein concentrations to obtain gel retardation (Figure 1A). The protected sequences were located at positions −186 to −162 in the coding strand, and from −150 to −190 in the complementary strand. There are two DRus in the coding strand sequence of low information content values (0 and 6 bits, respectively). These low values account for the poor PhoP-binding affinity. As occurs with the other promoters, the proposed GlnR-binding site [two boxes located from −194 to −151; see (24)] overlaps the PhoP-binding site of this gene (Figure 1B).
GlnR does not bind to PhoP-dependent promoters
Additionally, it was of interest to study if there is a reciprocal cross-regulation of both response regulators, i.e. if GlnR binds to well-known PhoP-dependent promoters. The possible binding of GlnR to the promoters of phoRP and pstS (encoding the high affinity phosphate transporter) was tested using EMSA. Results (Supplementary Figure S2) showed that PhoP binds and forms two DNA–PhoP complexes (arrows) with both the phoRP (Supplementary Figure S2, lanes 2–3) and pstS (lanes 7–8) promoters. However, purified GlnR did not form any discrete retarded bands (Supplementary Figure S2, lanes 4–5 and 9–10), even at high protein concentration (the gel in Supplementary Figure S2 was overexposed to detect any possible DNA–protein complex).
These results indicate that there is no affinity of GlnR for the PhoP-dependent promoters and it is consistent with the lack of authentic GlnR boxes in these promoters. Interestingly, the opposite reaction, i.e. binding of PhoP to several promoters of nitrogen metabolism genes occurs with high affinity (25).
PhoP and GlnR compete for binding to the glnA promoter
In previous experiments GlnR binding has been made in buffer A (24), and PhoP binding in buffer B (13) (see composition in Materials and Methods section). In order to perform competition experiments, binding of both PhoP and GlnR to glnA, glnII and amtB promoters was tested in both buffers A and B; a better binding was observed in the three cases in buffer A (data not shown). A slightly modified buffer A, hereafter named buffer MA (for modified A), was thereafter used, containing a reduced concentration (0.4 mM) of β-mercaptoethanol (instead of 10 mM in the normal buffer A), a small amount of reduced glutathione (0.18 mM) and glycerol (5.76%), both coming from the GST-PhoPDBD stock solution.
As shown in Supplementary Figure S3, both DNA-binding proteins (PhoP and GlnR) formed discrete complexes with the glnAp probe in buffer MA. At low protein concentrations, the glnAp–PhoP and glnAp–GlnR complexes can be easily separated due to their different molecular weight. The GST-PhoPDBD (39 kDa) fusion protein is larger than GlnR with the Strep-tag (29 kDa). At increasing concentrations, GlnR showed higher affinity than PhoP for the glnA promoter and retards completely the probe. Moreover, the probe is shifted to a second complex (incorporating other two GlnR molecules, see Discussion section) that migrates very close to that formed by PhoP with this promoter (lanes 4–5).
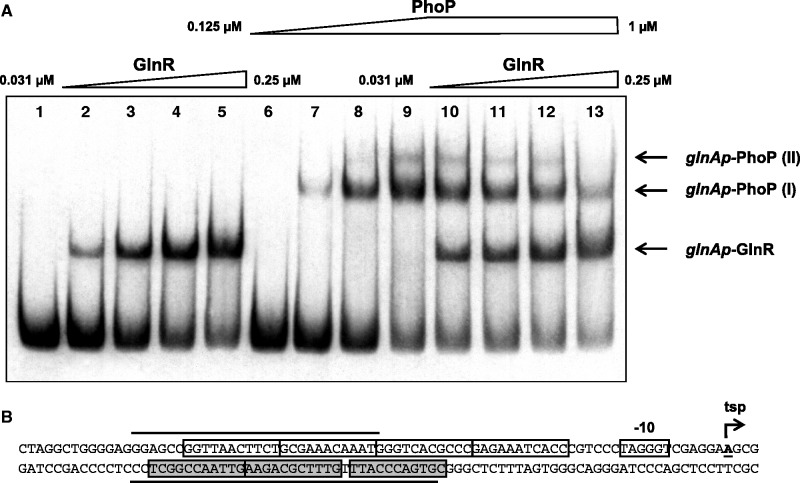
To clarify the possible competition or cooperation between both regulatory proteins a new experiment was made using reduced GlnR concentrations (4-fold dilution with respect to the previous experiment) to avoid the formation of this second shifted band. With the reduced protein concentrations used in the new experiment, only a shifted band was detected with GlnR (Figure 2A, lanes 2–5), and two different bands (I and II) were detected with the highest concentration of PhoP (lane 9), as described previously (25). When PhoP was mixed with GlnR and added simultaneously to the DNA probe there was a competition between both proteins and both types of complexes glnAp–GlnR and glnAp–PhoP were seen (Figure 2, lane 10). When increasing concentrations of GlnR were used in the presence of PhoP, the largest PhoP–DNA complex (glnAp–PhoP II) was not formed (lane 13) and the intensity of the small complex (glnAp–PhoP I) clearly decreased. The glnAp–GlnR complex became the predominant one. No new supershift complex corresponding to the binding of both proteins at the same time was detected, indicating that both proteins compete for the promoter and only one can be bound in a certain moment.
Figure 2.
(A) Competition between GlnR and PhoP to bind to the glnA promoter. Lane 1, probe without proteins; lanes 2–5, increasing concentrations of GlnR protein (from 0.03125 µM to 0.25 µM); lanes 6–9, increasing concentrations of GST-PhoPDBD protein (from 0.125 µM to 1 µM); lanes 10–13, increasing concentrations of GlnR protein (from 0.03125 µM to 0.25 µM) mixed with GST-PhoPDBD protein at a constant concentration of 1 µM. Shifted bands are indicated by arrows. Complexes glnAp–PhoP I and II refer to those described previously (25). (B) Overview of the glnA promoter showing the PhoP DRus (boxed and shadowed) and GlnR-boxes (boxed). The protected regions by PhoP of the upper and bottom strands are indicated by solid lines (25). The −10 box and the transcription start point (tsp) according to Fisher and Wray (38) are also shown.
PhoP and GlnR bind to non-overlapping sequences in the amtB promoter
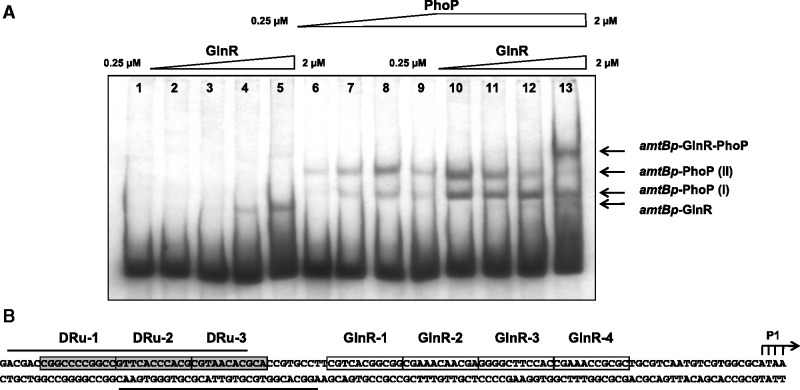
In a similar way a competition experiment was performed with amtB promoter. With increasing concentrations of GlnR only one shifted band can be detected (Figure 3A, lanes 2–5) and two bands are obtained with PhoP (Figure 3, lanes 6–9). When both proteins were present at high concentrations a new different (supershifted) band was detected (lane 13). Unlike the glnA promoter, where GlnR- and PHO boxes are mostly overlapping (Figure 2B), in the amtB promoter the different boxes are adjacent (Figure 3B) and both proteins can be bound simultaneously to the promoter.
Figure 3.
(A) Competition between GlnR and PhoP to bind to the amtB promoter. Lane 1, probe without proteins; lanes 2–5, increasing concentrations of GlnR protein (from 0.25 µM to 2 µM); lanes 6–9, increasing concentrations of GST-PhoPDBD protein (from 0.25 µM to 2 µM); lanes 10–13, increasing concentrations of GlnR protein (from 0.25 µM to 2 µM) mixed with GST-PhoPDBD protein at a constant concentration of 2 µM. Shifted bands are indicated by arrows. (B) Overview of the amtB promoter showing the PhoP DRus (boxed and shadowed) and GlnR-boxes (boxed). The protected regions by PhoP of the upper and bottom strands are indicated by solid lines (25). The PhoP and GlnR DRus have been numbered for an easier explanation of the text. The tsp P1 previously described (9) is shown.
Models of the GlnR and PhoP-binding sites and footprinting validation of the GlnR model operator
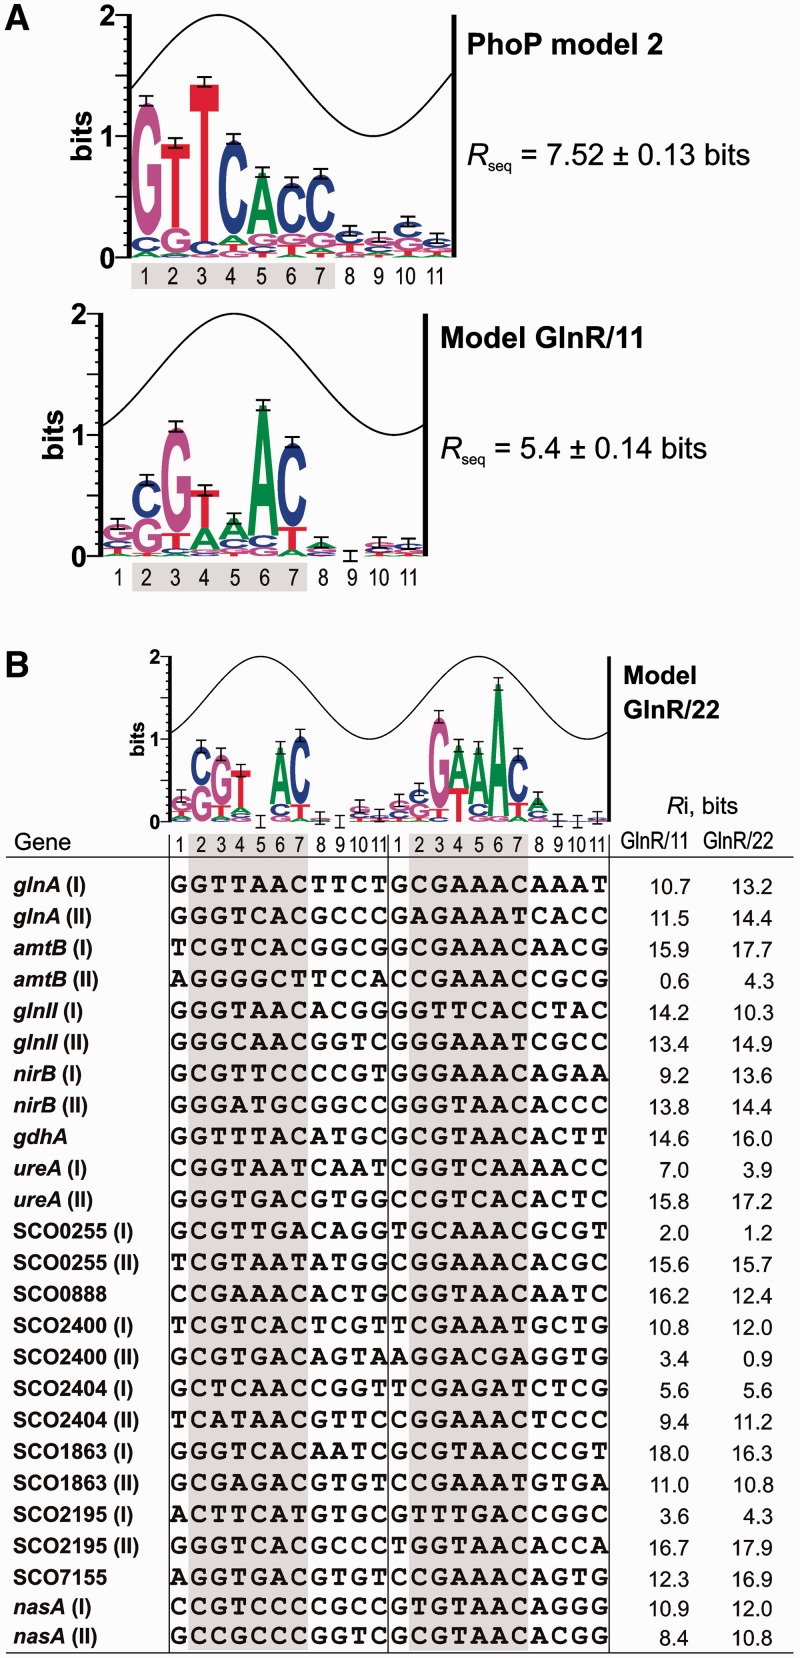
Models of the protein-binding sites on DNA help to characterize known operators and to predict new binding sites. According to the model of Sola-Landa et al. (15) the simplest PhoP operator is formed by two consecutive DRus (also called a PHO box). Each protein monomer binds a DRu; two or three conserved DRus are bound simultaneously and form the core of the site (type C DRu). Following the core occupancy, other protein monomers can bind to adjacent DRus that are poorly conserved (type E, for extension, DRu). As indicated above in this article, we introduced the matrix model 2 and its logo is shown in Figure 4A. The sequences of the new nitrogen metabolism promoters regulated by PhoP described in this work (SCO0255, SCO1863 and ureA) were not included in model 2 because it was not possible to define which DRus form the core of the binding sites (Supplementary Data S1).
Figure 4.
(A) Sequence logos of the model GlnR/11 and of the PhoP model 2. The sine wave represents the accessibility of a face of the DNA (B-form, 11 bases of helical pitch). The height of each letter is proportional to the frequency of that base in the aligned sequences used to build the model, and the height of the letter stack is the conservation in bits at that position (33). Error bars are shown at the top of the stacks. (B) Sequence logo of the model GlnR/22 and alignment of the 25 sequences that form the GlnR boxes included in this model. When two boxes are present, they are consecutive except in nasA. In this promoter the second box, i.e. the 3rd and 4th repeats, is separated by 1 nt from the first one. The clearly conserved positions are indicated by a grey shade.
Tiffert et al. (24) determined the binding of the GlnR protein to the upstream regions of 13 genes by EMSA. Using the alignment of the coding-strand sequences, a GlnR box was defined as composed of two partially conserved direct repeats of 11 nt. All the binding sites appeared to contain two consecutive GlnR boxes. Positive retardation in EMSA assays of a synthetic 22-nt fragment (corresponding to the sequence of the glnA promoter) proved that a single box (22 nt) can be bound by GlnR. Footprinting assays confirmed protection of two GlnR boxes in the glnA- and nirB-binding sites, but only one box was protected in the gdhA upstream sequence (24).
We created an initial information content matrix of the GlnR-binding site using the 26 GlnR boxes (two from each promoter region) proposed by Tiffert et al. (24). The matrix scan on the 13 promoter regions recognized by GlnR identified the same reported boxes except in the gdhA, SCO0888 (coding for a putative NADPH-dependent FMN reductase) and SCO7155 (a hypothetical protein) upstream sequences. In the case of gdhA, the matrix yielded a positive value of information content (Ri value) for the DNase I-protected box, and a negative value for the adjacent sequence. Within the accuracy of the matrix, it has been demonstrated that the Ri value of true binding sites should be positive (35).
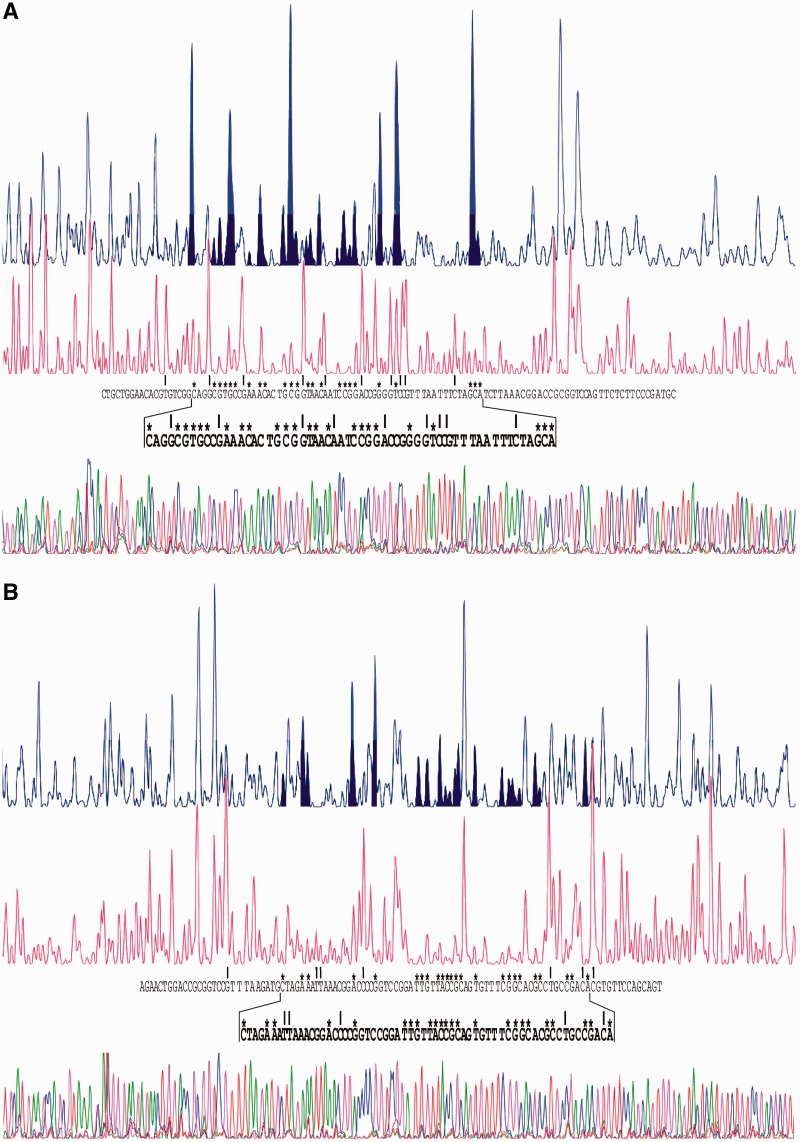
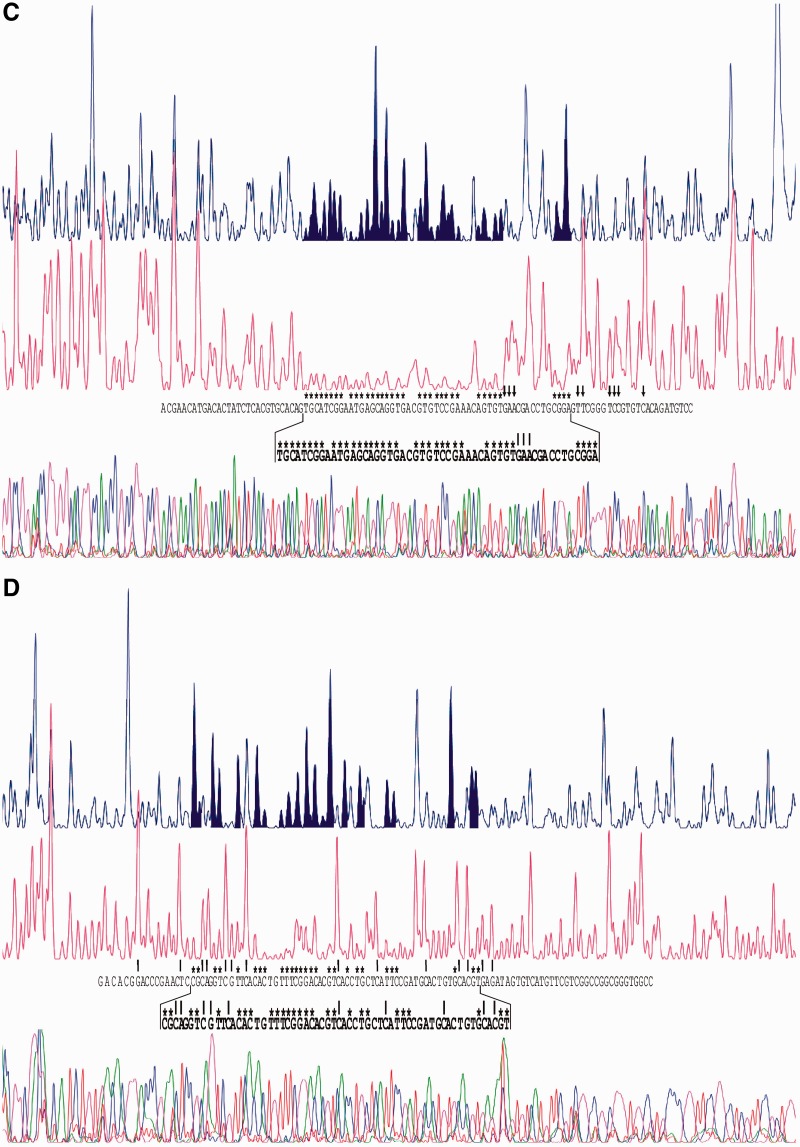
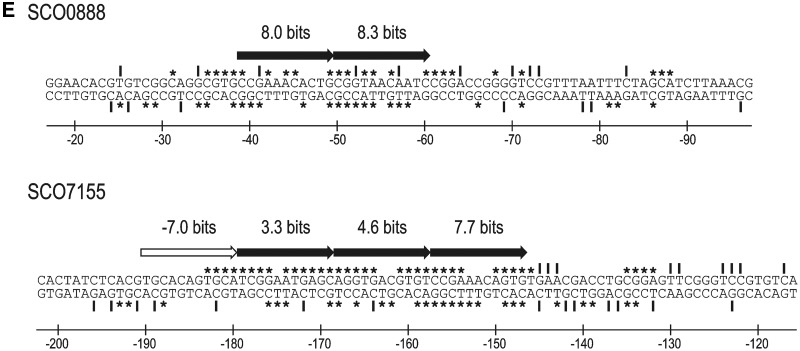
In the SCO7155 sequence only one of the two reported GlnR boxes showed a positive Ri value. Instead of the GlnR boxes previously proposed in the coding strand of the SCO0888 promoter (24), the matrix identified a putative GlnR box in the non-coding strand (Figure 4B). We decided to confirm both predictions with footprinting assays. The promoter regions of SCO0888 and SCO7155 genes were cloned as detailed in Materials and Methods section. Coding and non-coding strands were separately labelled to determine the protected nucleotides from DNase I digestion in each strand (Figure 5). When comparing the electropherograms of control reactions with those of the fragments with the GlnR protein bound, it was evident that the Strep-GlnR protein, in addition to protecting the binding sequence, altered the pattern of peaks flanking the binding site; this alteration is a well-known phenomenon and indicates a spatial rearrangement of the DNA chain. The accumulations of protected nucleotides served to locate the region corresponding to the binding site. The GlnR protected region in the SCO0888 promoter was located between nucleotides −35 and −63 in the non-coding strand (Figure 5A), and between −58 and −34 in the coding strand (Figure 5B). This region comprised the predicted GlnR box, located at positions −39 to −60 (Figure 5E). In the SCO7155 gene, almost all the nucleotides in the coding strand between −183 and −154 were protected (Figure 5C). The opposite strand was protected at several positions between −184 and −153 (Figure 5D). Of the four direct repeats in this promoter that form the GlnR boxes proposed by Tiffert et al. (24) the first direct repeat was not protected by GlnR (Figure 5E). In fact, the information content of this repeat was negative (see below).
Figure 5.
DNase I footprints of the Strep-GlnR protein bound to the promoter regions of SCO0888 [(A), non-coding strand; (B), coding strand], and SCO7155 [(C), coding strand; (D), non-coding strand]. The same protection patterns were obtained with protein concentrations ranging from 2 µM to 8 µM. In each panel, the upper electropherogram is the control reaction without protein. The protected nucleotides are indicated by asterisks and the peak shadowed areas. Hypersensitive sites created by the protein binding, located on the sides of the protected sequence, are highlighted by vertical arrows. The correspondence between fluorescence peaks and nucleotide bases was determined using sequencing reactions. (E) Summary of the protection results. Coordinates are relative to the translation start codons. The 11-nt direct repeats that form the GlnR boxes are indicated by horizontal solid arrows over the non-coding sequence of SCO0888 and over the coding sequence of SCO7155. The Ri value of the repeat, calculated using model GlnR/11 is shown above each arrow (see text). The first arrow over the SCO7155 sequence is open to indicate that the repeat, which was previously proposed as part of the binding site (24), is not protected.
Taking into account the results of these footprinting experiments and those of Wang and Zhao (39), who have recently reported a GlnR-binding site in the nasA promoter, we built two new information models named GlnR/22 and GlnR/11 to analyse the GlnR-binding sites by means of sequence logos and walkers (see Materials and Methods section). The models were built from the set of GlnR-binding sequences shown in Figure 4B. Two GlnR boxes for each gene were included except for the gdhA, SCO0888 and SCO7155 upstream sequences, where, as indicated, only one GlnR box was identified. The model GlnR/22 was created from the full sequences of 22 nt that form the GlnR boxes. This model best reflected the higher conservation of the second repeat in each GlnR box (Figure 4B), which corresponds to the so-called ‘b-site’ identified by Tiffert et al. (24).
In contrast, model GlnR/11 comprised the same set of sequences, but decomposed in 11-nt repeats (Figure 4B). This last model served to calculate separately the information content of each 11-nt repeat, e.g. the first repeat in the SCO7155 GlnR-binding site. This 11-nt repeat had a negative Ri value and was not protected, whereas the second one showed a clear positive value (Figure 5E). These results indicate that GlnR can bind three consecutive direct repeats of 11-nt each.
Dissection of the GlnR/PhoP recognition sequences by directed mutagenesis
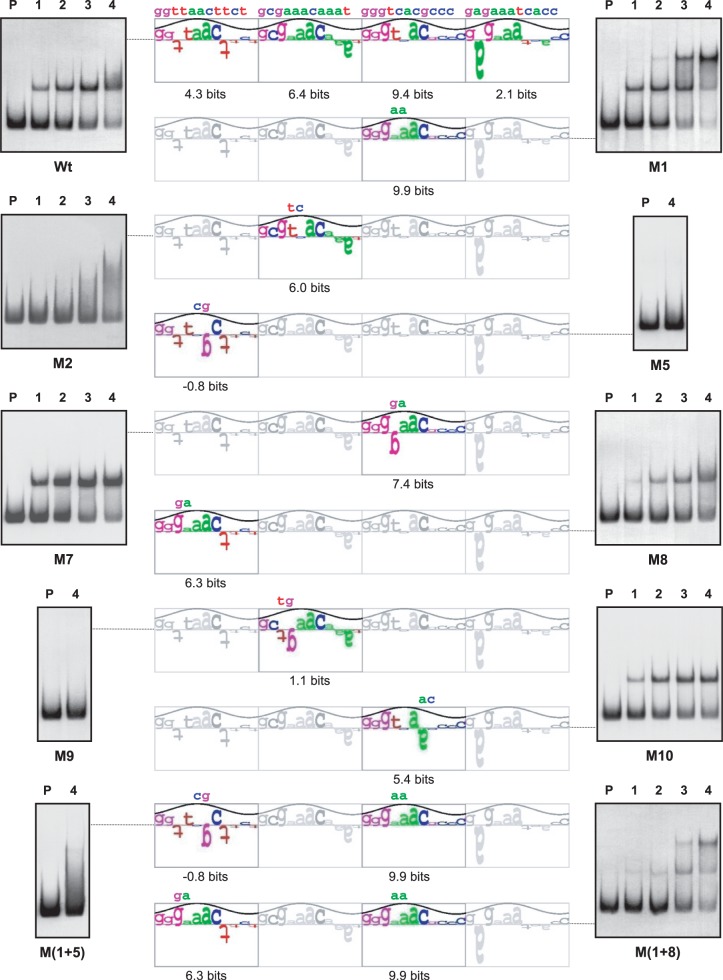
In order to determine whether PhoP and GlnR could bind to the same region (although recognizing different sequences) and to discriminate two putative PHO sites located in the sense or in the antisense strands of the glnA promoter, nine new promoters containing point mutations named M1, M2, M5, M7, M8, M9, M10, M(1 + 5) and M(1 + 8) (the last two contain double mutations) were constructed by directed mutagenesis of the glnA promoter and used for EMSA analyses. The PhoP information matrix 2 and the GlnR/11 model were used to calculate the Ri values of wild-type and mutant sequences, and also to create sequence walkers as described previously (25). The binding of PhoP and GlnR to those new promoters was compared to that of the original glnA promoter.
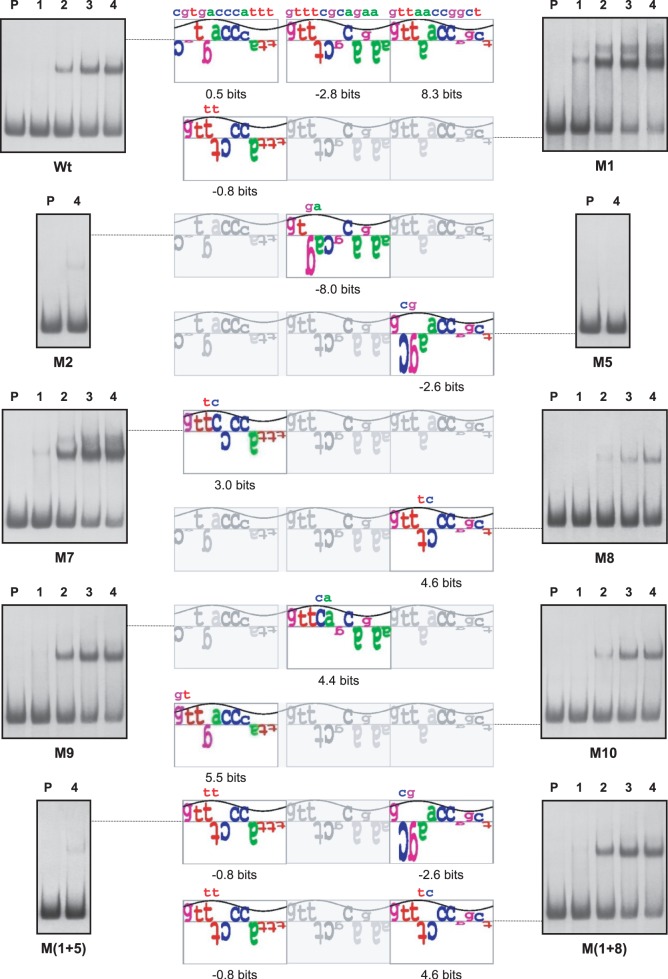
The previous footprinting assays using the GST-PhoPDBD protein revealed a protected region in the glnA promoter of 29 nt and 35 nt in the coding and non-coding strands, respectively. The structure of this binding site showed two possible interpretations. The site might be composed of three consecutive core DRus (a CCC structure) located in the coding strand or, alternatively, composed of two consecutive core DRus and an upstream extension DRu separated by 1 nt (a E[1]CC structure) located in the non-coding strand (25). The Ri values of the DRu of the CCC structure are 3.0, −11.0 and 9.0 bits, respectively. The high negative value of the second DRu would hamper the formation of stable PhoP–glnAp complexes suggesting that the actual structure is that of the non-coding strand (E[1]CC), with Ri values of 0.5, −2.8 and 8.3 bits, respectively (Figure 6). To determine the actual binding site structure the nucleotides GGTCAC of the third DRu located in the coding strand (positions 3 and 4 of the 11-nt DRu) were changed to GGGAAC (new promoter glnA–M7p). If the actual structure is the sense strand CCC, this change should decrease the affinity for PhoP (from 9.0 of the wild-type sequence to −0.1 of the M7p sequence) but analysis by EMSA showed a higher affinity of M7p for PhoP than that of the wild type (as shown by the strong retardation of the labelled probe resulting in the formation of two retarded bands) (Figure 6). However, interestingly the M7 mutation leads to the creation in the non-coding strand of a new first DRu without any separation from the others with a higher Ri value (3.0 bits) and without penalty by the separation (15). These positive changes in the Ri value agreed with the observed increased binding of PhoP to the M7 promoter and indicate that the structure should be defined in the non-coding strand. This was confirmed with the other mutations (a summary of the different mutations showing the values obtained for the new DRus and the results obtained by EMSA is depicted in Figure 6). For example, conversion of GTTAAC in the third DRu of the non-coding strand (with a value of 8.3 bits) to GCGAAC (−2.6 bits), leads, as expected, to a total lack of binding of PhoP to the new promoter glnA–M5p. These results confirmed that the PhoP-binding site structure (E[1]CC) is defined by the DRus present in the complementary strand of glnA.
Figure 6.
Sequence walker analysis of the PhoP-binding sites in the non-coding strand of glnA promoters. Sequence walkers (35) serve, for individual sequences, to show the contribution of each base to the conservation of the DRu. The full-length sequence walker (top) corresponds to the wild-type promoter; only the modified DRus are shown for the mutants, with the changed nucleotides over the walker. Analyses by EMSA of the promoters are shown in both sides. P, probe without protein; 1–4, increasing concentrations of GST-PhoPDBD protein (from 0.125 µM to 1 µM). For M2, M5 and M(1 + 5) promoters only the highest concentration (1 µM) is shown.
Analysing all the results we observed that negative mutations in the second or third DRu drastically reduced the binding of PhoP [promoters M2, M5, M8 and M(1 + 5)], supporting the conclusion that these two DRus form the core of the PhoP-binding site. Moreover, the modifications in the first DRu show the importance of the separation of 1 nt between this DRu and the core. Thus, a mutation increasing the Ri value (from 0.5 to 5.5 bits in the M10 promoter) but keeping the 1-nt separation, barely affects the affinity of PhoP in EMSA studies, whereas modifications resulting in a new DRu with a small Ri increase (to 3.0 bits in M7p) or even a slightly negative value (−0.8 in M1p) but without any gap (nucleotide separation) clearly increased the binding of PhoP (Figure 6).
Changes in GlnR interaction in the mutant glnA promoters confirm the DRu of this promoter
Similarly, the same promoters were analysed by EMSA with the Strep-GlnR protein (Figure 7). The GlnR operator of glnA is composed of two consecutive GlnR boxes (24). Our results indicated that the most important GlnR box is the first one (in the sense strand of glnA), and that this is the first sequence bound by GlnR. First, it was in this box that the negative mutations had a more drastic effect [M2, M5, M9 and M(1 + 5)]. Indeed, in cases where mutated DRu had negative Ri values (M5 and M9 promoters) these mutations lead to a complete loss of GlnR binding. Second, negative mutations in the first repeat of the second GlnR box that showed moderate decreases of the Ri values did not affect the GlnR binding (M10 promoter) or even resulted in an apparent higher affinity (M7 promoter). Third, the most significant result was obtained with the M1 promoter, detecting two shifted bands with the diluted protein concentration used (two bands can be detected with the wild-type promoter, but at higher concentrations; see Supplementary Figure S3). The unretained probe M1 decreased clearly as compared to the wild-type promoter (top left EMSA in Figure 7). These results suggest that the M1 mutation increased the GlnR affinity. The second band formed by GlnR in the M1 promoter can also be seen in the double mutant M(1 + 8). In summary, the mutation in the M1 promoter enhanced binding of GlnR whereas it affects moderately the binding of PhoP.
Figure 7.
Sequence walker analysis of the GlnR-binding sites in the coding strand of glnA promoters. The full-length sequence walker (top) corresponds to the wild-type promoter; only the modified repetitions are shown for the mutants, with the changed nucleotides over the walkers. Analyses by EMSA of the promoters are shown in both sides. P, probe without protein; 1–4, increasing concentrations of GlnR protein (from 0.03125 µM to 0.25 µM). For M5, M9 and M(1 + 5) promoters only the highest concentration (0.25 µM) is shown.
DISCUSSION
GlnR binds to the glnA promoter with higher affinity than PhoP
From the initial experiments described in this article it is clear that both GlnR and PhoP bind to the glnA promoter, used in this work as a model of nitrogen-regulated promoters. Both DNA strands are protected in DNaseI footprinting experiments. The nucleotide sequences recognized by both proteins are overlapping, although in different strands, as shown in the present study. When both regulatory proteins were mixed the glnA promoter interacted preferentially with GlnR (Figure 2). When low concentrations of GlnR were used in presence of large concentrations of PhoP (up to 32-fold higher concentration of PhoP), it was clearly observed that GlnR showed a higher affinity than PhoP for the glnA promoter and the GlnR–glnAp complex was mostly predominant.
This preference of the glnA promoter by GlnR is logic because GlnA is clearly related with the nitrogen assimilation and, therefore, GlnR is its main regulator (22). In addition, the presence of GlnR is required for glnA expression since a deletion mutant in the glnR gene is glutamine auxotrophic (22). However, PhoP is able to bind the glnA promoter even in the presence of low concentrations of GlnR, affecting its expression. This negative effect of PhoP has been shown in vivo previously by microarray studies using a ΔphoP mutant. In this mutant the expression of glnA and other nitrogen-related genes is higher than in the wild-type strain in phosphate-limiting conditions (7). In the case of glnA the negative role of PhoP over its expression is by direct competition with GlnR, since the sequences recognized by these proteins are overlapping (Figure 2) and only one of the two regulatory proteins can be bound to the promoter in a certain moment.
A different situation has been found in the amtB promoter that is also regulated by PhoP and GlnR. In this case, the PHO box and the GlnR box do not overlap and the binding of both proteins occurs resulting in a large DNA–PhoP–GlnR complex observed in the supershift (Figure 3). Although PHO and GlnR boxes are not overlapping they are very close and the binding of PhoP can disturb the correct binding of GlnR. In fact, footprinting analysis showed that the protected region by PhoP extends the limits of the boxes [Figure 3B, according to (25)]. This extended protection is usual with most proteins since they cover a stretch of DNA on both sides of the core recognition sequences, and it also happens with GlnR (Figure 5C). The negative effect of PhoP over amtB expression was supported by in vivo experiments using a ΔphoP mutant (7) and is explained by a hindrance effect resulting from PhoP binding to DRu-3 that disturbs GlnR binding to GlnR-1 (Figure 3B).
New insights into the GlnR box
Based on 13 promoters recognized by GlnR (24), we have built two information-based models to describe the GlnR operators that were corroborated by new footprinting results (Figures 4 and 5). The model GlnR/22 was built from 22-nt sequences (GlnR boxes) and reflects the higher conservation of the second 11-nt repeat (Figure 4B). In a recent article on GlnR of Streptomyces venezuelae published during the elaboration of the present article the authors describe a GlnR box of 16 nt (40) corresponding to the 11 nt of the a-site and the 5 well-conserved nucleotides of the b-site. This model does not differ so much of our model GlnR/22. Tiffert et al. (24) proposed that the GlnR protein binds the complete box as a dimer. The GlnR-binding site of SCO7155, however, is composed of three direct repeats of 11 nt, instead of only two. Recent protection analyses and directed mutagenesis studies of PhoP in S. coelicolor (15) and the structure of the DNA-binding domain of the E. coli homologous protein (41) show that the binding sites of these response regulators are composed of two, three or more DRus of 11-nt each (corresponding to a full turn of DNA double helix in the B-configuration).
The alignment of the sequences of the 13 promoters recognized by GlnR (24) suggested that two consecutive GlnR boxes were always present in the coding strand of the GlnR-regulated promoters. In contrast, the footprinting results of the gdhA gene (24), and of SCO0888 (this work) indicate that a single GlnR box can constitute an operator. Moreover, the GlnR box of SCO0888 was found on the promoter non-coding strand. The rule that proposes that when two boxes are present, they are structurally consecutive does not hold strictly true in the binding site of the nasA promoter. Although it was reported that GlnR binds to non-consensus sequences in the nasA promoter (39) our analysis revealed the presence of GlnR box. The protected sequences reported by Wang and Zhao (39) clearly contain two boxes separated by 1 nt (Figure 4B). These observations indicate that the GlnR-binding features are more flexible than previously expected.
Biological significance of global regulators interaction
There is increasing evidence of genes regulated by more than one regulatory protein (42). We reported recently that both AfsR and PhoP bind and compete in the regulation of the afsS promoter in S. coelicolor (32). In this case, there is a reciprocal cross-talk of both regulators, since AfsR also shows affinity for several other phosphate-regulated promoters, unlike GlnR.
The binding of two different regulators to the same promoter region, allows the cell to modulate the expression of the target gene in response to two different stress signals, namely phosphate and nitrogen limitation.
This work provides an interesting example of non-reciprocal regulation of the GlnR-regulated glnA model promoter by the master PhoP protein. PhoP binds directly to the promoter of at least seven nitrogen metabolism-related genes (25; this work), whereas GlnR does not bind to the main phosphate regulon genes. These findings open the way for a better understanding of interactions between major regulation networks, what will contribute to the progress in the systems biology of actinomycetes (42).
ADDED IN PROOF
When this article was under final revision a report was published on the regulation of amtB promoter (Wang et al., 2012; J. Bacteriol., 194, 5237–5244) that supports our results on the interaction of PhoP and GlnR on the regulation of this promoter.
SUPPLEMENTARY DATA
Supplementary Data are available at NAR Online: Supplementary Table 1 and Supplementary Figures 1–3.
FUNDING
ERA-NET SysMO Project (STREAM) [GEN2006-27745-E/SYS to J.F.M. and FKZ 0315003 to W.W.]; Spanish Comisión Interministerial de Ciencia y Tecnología (CICYT) [BIO2010-16094]. Funding for open access charge: CICYT [BIO2010-16094].
Conflict of interest statement. None declared.
Supplementary Material
ACKNOWLEDGEMENTS
W.W. and R.A. gratefully acknowledge the Higher Education Commission of the Pakistan Government for funding a scholarship. We acknowledge the excellent technical assistance of B. Martín, J. Merino, A. Casenave and A. Mulero.
REFERENCES
- 1.Berdy J. Bioactive microbial metabolites. J. Antibiot. 2005;58:1–26. doi: 10.1038/ja.2005.1. [DOI] [PubMed] [Google Scholar]
- 2.Martín JF, Demain AL. Control of antibiotic synthesis. Microbiol. Rev. 1980;44:230–251. doi: 10.1128/mr.44.2.230-251.1980. [DOI] [PMC free article] [PubMed] [Google Scholar]
- 3.Hobbs G, Frazer CM, Gardner DCJ, Flett F, Oliver SG. Pigmented antibiotic production by Streptomyces coelicolor A3(2): kinetics and the influence of nutrients. J. Gen. Microbiol. 1990;136:2291–2296. [Google Scholar]
- 4.Reuther J, Wohlleben W. Nitrogen metabolism in Streptomyces coelicolor: transcriptional and post-translational regulation. J. Mol. Microbiol. Biotechnol. 2007;12:139–146. doi: 10.1159/000096469. [DOI] [PubMed] [Google Scholar]
- 5.Lounes A, Lebrihi A, Benslimane C, Lefebvre G, Germain P. Regulation of spiramycin synthesis in Streptomyces ambofaciens: effects of glucose and inorganic phosphate. Appl. Microbiol. Biotechnol. 1996;45:204–211. doi: 10.1007/s002530050671. [DOI] [PubMed] [Google Scholar]
- 6.Martín JF. Phosphate control of the biosynthesis of antibiotics and other secondary metabolites is mediated by the PhoR-PhoP system: an unfinished story. J. Bacteriol. 2004;186:5197–5201. doi: 10.1128/JB.186.16.5197-5201.2004. [DOI] [PMC free article] [PubMed] [Google Scholar]
- 7.Rodríguez-García A, Barreiro C, Santos-Beneit F, Sola-Landa A, Martín JF. Genome-wide transcriptomic and proteomic analysis of the primary response to phosphate limitation in Streptomyces coelicolor M145 and in a ΔphoP mutant. Proteomics. 2007;7:2410–2429. doi: 10.1002/pmic.200600883. [DOI] [PubMed] [Google Scholar]
- 8.Nieselt K, Battke F, Herbig A, Bruheim P, Wentzel A, Jakobsen OM, Sletta H, Alam MT, Merlo ME, Moore J, et al. The dynamic architecture of the metabolic switch in Streptomyces coelicolor. BMC Genomics. 2010;11:10–29. doi: 10.1186/1471-2164-11-10. [DOI] [PMC free article] [PubMed] [Google Scholar]
- 9.Fink D, Weißschuh N, Reuther J, Wohlleben W, Engels A. Two transcriptional regulators GlnR and GlnRII are involved in regulation of nitrogen metabolism in Streptomyces coelicolor A3(2) Mol. Microbiol. 2002;46:331–347. doi: 10.1046/j.1365-2958.2002.03150.x. [DOI] [PubMed] [Google Scholar]
- 10.Sola-Landa A, Moura RS, Martín JF. The two-component PhoR-PhoP system controls both primary metabolism and secondary metabolite biosynthesis in Streptomyces lividans. Proc. Natl Acad. Sci. USA. 2003;100:6133–6138. doi: 10.1073/pnas.0931429100. [DOI] [PMC free article] [PubMed] [Google Scholar]
- 11.Ghorbel S, Kormanec J, Artus A, Virolle MJ. Transcriptional studies and regulatory interactions between the phoR-phoP operon and the phoU, mtpA, and ppk genes of Streptomyces lividans TK24. J. Bacteriol. 2006;188:677–686. doi: 10.1128/JB.188.2.677-686.2006. [DOI] [PMC free article] [PubMed] [Google Scholar]
- 12.Mendes MV, Tunca S, Antón N, Recio E, Sola-Landa A, Aparicio JF, Martín JF. The two-component phoR-phoP system of Streptomyces natalensis: inactivation or deletion of phoP reduces the negative phosphate regulation of pimaricin biosynthesis. Metab. Eng. 2007;9:217–227. doi: 10.1016/j.ymben.2006.10.003. [DOI] [PubMed] [Google Scholar]
- 13.Sola-Landa A, Rodríguez-García A, Franco-Domínguez E, Martín JF. Binding of PhoP to promoters of phosphate-regulated genes in Streptomyces coelicolor: identification of PHO boxes. Mol. Microbiol. 2005;56:1373–1385. doi: 10.1111/j.1365-2958.2005.04631.x. [DOI] [PubMed] [Google Scholar]
- 14.Apel AK, Sola-Landa A, Rodríguez-García A, Martín JF. Phosphate control of phoA, phoC and phoD gene expression in Streptomyces coelicolor reveals significant differences in binding of PhoP to their promoter regions. Microbiology. 2007;153:3527–3537. doi: 10.1099/mic.0.2007/007070-0. [DOI] [PubMed] [Google Scholar]
- 15.Sola-Landa A, Rodríguez-García A, Apel AK, Martín JF. Target genes and structure of the direct repeats in the DNA-binding sequences of the response regulator PhoP in Streptomyces coelicolor. Nucleic Acids Res. 2008;36:1358–1368. doi: 10.1093/nar/gkm1150. [DOI] [PMC free article] [PubMed] [Google Scholar]
- 16.Santos-Beneit F, Rodríguez-García A, Franco-Domínguez E, Martín JF. Phosphate-dependent regulation of the low and high-affinity transport systems in the model actinomycete Streptomyces coelicolor. Microbiology. 2008;154:2356–2370. doi: 10.1099/mic.0.2008/019539-0. [DOI] [PubMed] [Google Scholar]
- 17.Rexer HU, Schäberle T, Wohlleben W, Engels A. Investigation of the functional properties and regulation of three glutamine synthetase-like genes in Streptomyces coelicolor A3(2) Arch. Microbiol. 2006;186:447–458. doi: 10.1007/s00203-006-0159-8. [DOI] [PubMed] [Google Scholar]
- 18.Weißschuh N, Fink D, Vierling S, Bibb MJ, Wohlleben W, Engels A. Transcriptional analysis of the gene for glutamine synthetase II and two upstream genes in Streptomyces coelicolor A3(2) Mol. Gen. Genet. 2000;264:461–469. doi: 10.1007/s004380000315. [DOI] [PubMed] [Google Scholar]
- 19.Hesketh A, Fink D, Gust B, Rexer H-U, Scheel B, Chater K, Wohlleben W, Engels A. The GlnD and GlnK homologues of Streptomyces coelicolor A3(2) are functionally dissimilar to their nitrogen regulatory system counterparts from enteric bacteria. Mol. Microbiol. 2002;46:319–330. doi: 10.1046/j.1365-2958.2002.03149.x. [DOI] [PubMed] [Google Scholar]
- 20.Merrick MJ, Edwards RA. Nitrogen control in bacteria. Microbiol. Rev. 1995;59:604–622. doi: 10.1128/mr.59.4.604-622.1995. [DOI] [PMC free article] [PubMed] [Google Scholar]
- 21.Fink D, Falke D, Wohlleben W, Engels A. Nitrogen metabolism in Streptomyces coelicolor A3(2): modification of glutamine synthetase I by an adenylyltransferase. Microbiology. 1999;145:2313–2322. doi: 10.1099/00221287-145-9-2313. [DOI] [PubMed] [Google Scholar]
- 22.Wray LV, Atkinson MR, Fisher SH. Identification and cloning of the glnR locus, which is required for transcription of the glnA gene in Streptomyces coelicolor A3(2) J. Bacteriol. 1991;173:7351–7360. doi: 10.1128/jb.173.22.7351-7360.1991. [DOI] [PMC free article] [PubMed] [Google Scholar]
- 23.Wray LV, Fisher SH. The Streptomyces coelicolor glnR gene encodes a protein similar to other bacterial response regulators. Gene. 1993;130:145–150. doi: 10.1016/0378-1119(93)90359-b. [DOI] [PubMed] [Google Scholar]
- 24.Tiffert Y, Supra P, Wurm R, Wohlleben W, Wagner R, Reuther J. The Streptomyces coelicolor GlnR regulon: identification of new GlnR targets and evidence for a central role of GlnR in nitrogen metabolism in actinomycetes. Mol. Microbiol. 2008;67:861–880. doi: 10.1111/j.1365-2958.2007.06092.x. [DOI] [PubMed] [Google Scholar]
- 25.Rodríguez-García A, Sola-Landa A, Apel K, Santos-Beneit F, Martín JF. Phosphate control over nitrogen metabolism in Streptomyces coelicolor: direct and indirect negative control of glnR, glnA, glnII and amtB expression by the response regulator PhoP. Nucleic Acids Res. 2009;37:3230–3242. doi: 10.1093/nar/gkp162. [DOI] [PMC free article] [PubMed] [Google Scholar]
- 26.Thomas L, Hodgson DA, Wentzel A, Nieselt K, Ellingsen TE, Moore J, Morrissey ER, Legaie R, STREAM Consortium, Wohlleben W, et al. Metabolic switches and adaptations deduced from the proteomes of Streptomyces coelicolor wild type and phoP mutant grown in batch culture. Mol. Cell. Proteomics. 2012;11 doi: 10.1074/mcp.M111.013797. M111.013797. [DOI] [PMC free article] [PubMed] [Google Scholar]
- 27.Hakenbeck R, Stock JB. Analysis of two-component signal transduction systems involved in transcriptional regulation. Methods Enzymol. 1996;273:281–300. doi: 10.1016/s0076-6879(96)73026-4. [DOI] [PubMed] [Google Scholar]
- 28.Martín JF, Sola-Landa A, Rodríguez-García A. Two component systems in Streptomyces. In: Gross R, Beier D, editors. Two-Component Systems in Bacteria. Caister Academic Press; 2012. pp. 315–331. [Google Scholar]
- 29.Hutchings MI, Hoskisson PA, Chandra G, Buttner MJ. Sensing and responding to diverse extracellular signals? Analysis of the sensor kinases and response regulators of Streptomyces coelicolor A3(2) Microbiology. 2004;150:2795–2806. doi: 10.1099/mic.0.27181-0. [DOI] [PubMed] [Google Scholar]
- 30.Bourret RB, Hess JF, Simon MI. Conserved aspartate residues and phosphorylation in signal transduction by the chemotaxis protein CheY. Proc. Natl Acad. Sci. USA. 1990;87:41–45. doi: 10.1073/pnas.87.1.41. [DOI] [PMC free article] [PubMed] [Google Scholar]
- 31.Rodríguez-García A, Ludovice M, Martín JF, Liras P. Arginine boxes and the argR gene in Streptomyces clavuligerus: evidence for a clear regulation of the arginine pathway. Mol. Microbiol. 1997;25:219–228. doi: 10.1046/j.1365-2958.1997.4511815.x. [DOI] [PubMed] [Google Scholar]
- 32.Santos-Beneit F, Rodríguez-García A, Sola-Landa A, Martín JF. Cross-talk between two global regulators in Streptomyces: PhoP and AfsR interact in the control of afsS, pstS and phoRP transcription. Mol. Microbiol. 2009;72:53–68. doi: 10.1111/j.1365-2958.2009.06624.x. [DOI] [PubMed] [Google Scholar]
- 33.Schneider TD. Information content of individual genetic sequences. J. Theor. Biol. 1997;189:427–441. doi: 10.1006/jtbi.1997.0540. [DOI] [PubMed] [Google Scholar]
- 34.Schneider TD. Reading of DNA sequence logos: prediction of major groove binding by information theory. Methods Enzymol. 1996;274:445–455. doi: 10.1016/s0076-6879(96)74036-3. [DOI] [PubMed] [Google Scholar]
- 35.Schneider TD. Sequence walkers: a graphical method to display how binding proteins interact with DNA or RNA sequences. Nucleic Acids Res. 1997;25:4408–4415. doi: 10.1093/nar/25.21.4408. [DOI] [PMC free article] [PubMed] [Google Scholar]
- 36.van Helden J. Regulatory sequence analysis tools. Nucleic Acids Res. 2003;31:3593–3596. doi: 10.1093/nar/gkg567. [DOI] [PMC free article] [PubMed] [Google Scholar]
- 37.Santos-Beneit F, Rodríguez-García A, Apel AK, Martín JF. Phosphate and carbon source regulation of two PhoP-dependent glycerophosphodiester phosphodiesterase genes of Streptomyces coelicolor. Microbiology. 2009;155:1800–1811. doi: 10.1099/mic.0.026799-0. [DOI] [PubMed] [Google Scholar]
- 38.Fisher SH, Wray LV., Jr Regulation of glutamine synthetase in Streptomyces coelicolor. J. Bacteriol. 1989;171:2378–2383. doi: 10.1128/jb.171.5.2378-2383.1989. [DOI] [PMC free article] [PubMed] [Google Scholar]
- 39.Wang J, Zhao G-P. GlnR positively regulates nasA transcription in Streptomyces coelicolor. Biochem. Biophys. Res. Commun. 2009;386:77–81. doi: 10.1016/j.bbrc.2009.05.147. [DOI] [PubMed] [Google Scholar]
- 40.Pullan ST, Chandra G, Bibb MJ, Merrick M. Genome-wide analysis of the role of GlnR in Streptomyces venezuelae provides new insights into global nitrogen regulation in actinomycetes. BMC Genomics. 2011;12:175–189. doi: 10.1186/1471-2164-12-175. [DOI] [PMC free article] [PubMed] [Google Scholar]
- 41.Blanco AG, Solá M, Gomis-Ruth FX, Coll M. Tandem DNA recognition by PhoB, a two-component signal transduction transcriptional activator. Structure. 2002;10:701–713. doi: 10.1016/s0969-2126(02)00761-x. [DOI] [PubMed] [Google Scholar]
- 42.Martín JF, Liras P. Engineering of regulatory cascades controlling antibiotic biosynthesis in Streptomyces signaling genes. Curr. Opin. Microbiol. 2010;13:263–273. doi: 10.1016/j.mib.2010.02.008. [DOI] [PubMed] [Google Scholar]
Associated Data
This section collects any data citations, data availability statements, or supplementary materials included in this article.


