Abstract
Human brain functional networks contain a few densely connected hubs that play a vital role in transferring information across regions during resting and task states. However, the relationship of these functional hubs to measures of brain physiology, such as regional cerebral blood flow (rCBF), remains incompletely understood. Here, we used functional MRI data of blood-oxygenation-level–dependent and arterial-spin–labeling perfusion contrasts to investigate the relationship between functional connectivity strength (FCS) and rCBF during resting and an N-back working-memory task. During resting state, functional brain hubs with higher FCS were identified, primarily in the default-mode, insula, and visual regions. The FCS showed a striking spatial correlation with rCBF, and the correlation was stronger in the default-mode network (DMN; including medial frontal-parietal cortices) and executive control network (ECN; including lateral frontal-parietal cortices) compared with visual and sensorimotor networks. Moreover, the relationship was connection–distance dependent; i.e., rCBF correlated stronger with long-range hubs than short-range ones. It is notable that several DMN and ECN regions exhibited higher rCBF per unit connectivity strength (rCBF/FCS ratio); whereas, this index was lower in posterior visual areas. During the working-memory experiment, both FCS–rCBF coupling and rCBF/FCS ratio were modulated by task load in the ECN and/or DMN regions. Finally, task-induced changes of FCS and rCBF in the lateral-parietal lobe positively correlated with behavioral performance. Together, our results indicate a tight coupling between blood supply and brain functional topology during rest and its modulation in response to task demands, which may shed light on the physiological basis of human brain functional connectome.
Keywords: fMRI, connectomics, graph theory, modularity, metabolism
The human brain is a complex network that supports efficient communication through a collection of interconnected brain units, i.e., nodes (1, 2). Within the brain network, most nodes have few connections, but a few so-called hub nodes have a large number of connections (3–5). Graph-theory analysis of both human structural and functional connectivity data has revealed that these brain hubs are located predominantly in the posterior cingulate cortex/precuneus (PCC/PCu), medial-prefrontal cortex (mPFC), and lateral temporal and parietal cortices (4–8). Most of these brain regions constitute the putative default-mode network (DMN) that exhibits a high level of metabolism at rest (9). The spatial similarity between connectivity hubs and metabolism distribution suggests a relationship between intrinsic network connectivity and metabolic demands of the human brain.
Brain metabolism includes oxidative phosphorylation, which consumes most of the glucose and produces most of the energy, and aerobic glycolysis, which accounts for a much smaller portion of the consumed glucose but is critical to a number of cellular functions (10). It has been shown that regional cerebral blood flow (rCBF) is closely coupled with glucose utilization, oxygen consumption, and aerobic glycolysis in resting brains (9, 10). During task states, rCBF and glucose metabolism generally change in proportion (11, 12); whereas, oxygen metabolism changes to a lesser degree (13, 14). However, changes in rCBF and oxygen consumption were found to be linearly related in graded tasks (15). As a whole, rCBF may be used as a reasonable surrogate of metabolism in both resting and task-activated brain states.
Previous studies have shown that brain’s structural hubs, detected from human diffusion MRI data, positively correlated with aerobic glycolysis (16) and rCBF metabolism (6, 17), suggesting that the central embedding of structural hubs is associated with the constraint of metabolic demands. In contrast to the brain’s structural networks, functional networks may capture dynamic changes under different brain states. However, very few studies have directly examined the relationship between functional network hubs and the brain’s metabolism in humans. Therefore, the first goal of this study is to investigate whether intrinsic functional network connectivity is closely related to rCBF in resting human brains. If so, given that both functional network connectivity (7, 18) and rCBF (19, 20) undergo changes in response to varying cognitive tasks, the second goal is to examine whether this connectivity–rCBF relationship is preserved during a working-memory task and modulated by changes in cognitive task load.
To address these issues, we collected functional MRI (fMRI) data of blood-oxygenation-level–dependent (BOLD) and arterial-spin–labeling (ASL) perfusion contrasts in 48 healthy adults during rest, and, in a subset of 39 subjects during an N-back working-memory task. BOLD data were used to identify hubs of functional networks, and ASL perfusion data were exploited to measure rCBF of the brain. The relationship between regional brain network properties (including functional connectivity strength, nodal efficiency, and betweenness) and rCBF during resting and task states was investigated (see Materials and Methods for details).
Results
Resting-State Functional Networks and rCBF.
Overall relationship between functional network connectivity and rCBF.
To demonstrate that rCBF is an adequate surrogate for cerebral metabolism, we first correlated rCBF from our ASL data with the cerebral metabolic rate for oxygen (CMRO2) and the cerebral metabolic rate for glucose (CMRGlu) derived from a previous PET study (10). The results showed high correlations of rCBF with CMRglu (r = 0.54, P < 0.0001) and CMRO2 (r = 0.31, P = 0.005) across Brodmann areas (Fig. S1A), indicating that rCBF is tightly coupled with resting oxygen and glucose metabolism, and thus an adequate surrogate for metabolism to be used in the following analyses.
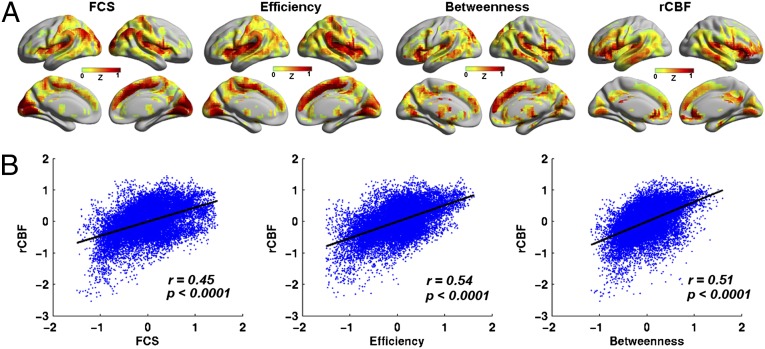
BOLD data were used to identify functional hubs of human brain networks by computing the functional connectivity strength (FCS) at a voxel level, i.e., the average functional connectivity between a given voxel and all other voxels in the brain. Functional hubs were found mainly in the DMN regions, including the PCC/PCu, mPFC, and lateral temporal and parietal cortices. The insula and visual cortices were also among the functional hubs (Fig. 1A). Other than FCS, we computed two centrality measures, nodal efficiency and nodal betweenness, to identify brain network hubs. Nodal efficiency measures the ability of a node to propagate information to other nodes in a network, and nodal betweenness captures the influence that a node has over the information flow between all other nodes in a network. Functional hubs with high nodal efficiency or betweenness were found to be similar to those with high FCS (Fig. 1A). We also computed structural connectivity strength (SCS) (21, 22) at a voxel level, which measured the average of correlations of gray matter (GM) volume between a given voxel and all other voxels across subjects. Structural hubs with higher SCS were mainly distributed in the PCC/PCu, mPFC, anterior cingulate cortex (ACC), medial temporal lobe, and lateral temporal and parietal cortices that comprise the DMN, insula, lateral-prefrontal cortex (lPFC), and visual cortex (Fig. S2A), showing a large overlap with the functional hubs. The spatial pattern of brain regions with high rCBF was also similar to the distribution of functional and structural hubs (Fig. 1A). The correlation analysis across voxels showed a striking spatial overlap between rCBF and FCS (r = 0.45, P < 0.0001, effective degree of freedom dfeff = 1,488; see details in Materials and Methods), rCBF and efficiency (r = 0.54, P < 0.0001, dfeff = 1,488), and rCBF and betweenness (r = 0.51, P < 0.0001, dfeff = 1,488) (Fig. 1B). Given that all of the three network measures were highly coupled with rCBF, we used only FCS in the following analyses. It was notable that we found that rCBF was also linearly correlated with both GM volume (r = 0.29, P < 0.0001, dfeff = 1,488) and SCS (r = 0.24, P < 0.0001, dfeff = 1,488) (Fig. S2). However, the FCS–rCBF relationship remained significant after controlling for GM volume (r = 0.41, P < 0.0001, dfeff = 1,488), or SCS (r = 0.44, P < 0.0001, dfeff = 1,488) (Fig. S2), or both (r = 0.40, P < 0.0001, dfeff = 1,488). Furthermore, we noticed that many brain regions showed positive correlations between FCS and rCBF across subjects (P < 0.05, corrected), including the PCC/PCu; mPFC; and lateral-frontal, temporal, parietal and visual cortices (Fig. S3). It is notable that the association between FCS and rCBF remained little changed under different preprocessing strategies and connection-inclusion criteria (SI Text, Fig. S3, and Tables S1–S3).
Fig. 1.
Maps of functional hubs and rCBF at resting state. (A) Maps of functional hubs with high FCS, efficiency and betweenness, and map of regions with high rCBF. FCS and rCBF maps were normalized to z scores and averaged across subjects. The results were mapped on cortical surfaces using the BrainNet viewer (www.nitrc.org/projects/bnv). (B) Scatterplot of the spatial correlations across voxels between rCBF and FCS, efficiency and betweenness.
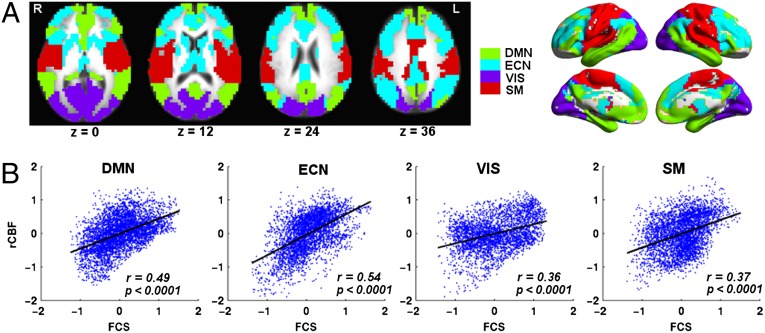
We also performed a modular analysis to decompose the whole-brain network into functional modules associated with different functions, and to characterize the FCS–rCBF relationship within each module. Modules were determined on the weighted brain network averaged across subjects (SI Text). Fig. 2A illustrates that the brain network was decomposed into four major functional modules: the DMN, executive control network (ECN), visual, and sensorimotor modules. In each module, we computed the within-module FCS as the average functional connectivity between a given voxel and all other voxels within its own module. The FCS was highly correlated with rCBF in all four modules, with a more tightly coupled FCS–rCBF relationship within DMN (r = 0.49, P < 0.0001, dfeff = 404) and ECN (r = 0.54, P < 0.0001, dfeff = 331) modules than visual (r = 0.36, P < 0.0001, dfeff = 301) and sensorimotor (r = 0.37, P < 0.0001, dfeff = 336) modules (Fig. 2B). These observations suggest that in segregated modules, the distribution of blood supply is associated with the topological roles of brain regions within their own modules. Brain regions with high within-module FCS tend to have high rCBF, possibly due to the facilitation of information exchange and integration within segregated individual modules.
Fig. 2.
FCS–rCBF relationship in different modules at resting state. (A) Module analysis identified four major modules, including DMN, ECN, visual (VIS), and sensorimotor (SM) modules. (B) Scatterplot of the spatial correlations across voxels between rCBF and FCS in each of the four modules. R, right. L, left.
Distance-dependent relationship between functional network connectivity and rCBF.
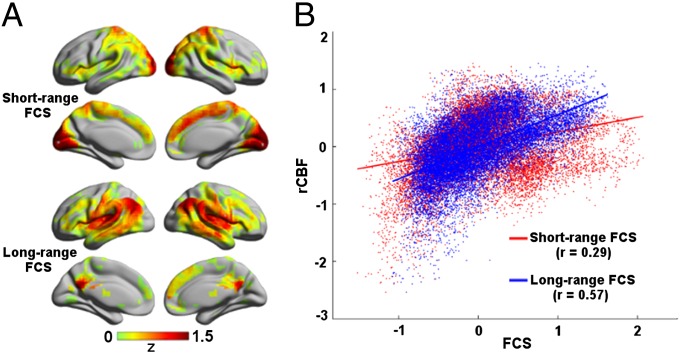
To further explore the influence of connection distance (i.e., Euclidean distance) on FCS–rCBF relationship, we computed short-range and long-range FCS (SI Text). We observed a distinct spatial pattern between short-range and long-range hubs. Short-range hubs were prominently located in the mPFC, lPFC, insula, sensorimotor, and visual cortices (Fig. 3A). In contrast, long-range hubs were mainly located in the PCC/PCu, mPFC, lPFC, insula, and lateral temporal and parietal cortices (Fig. 3A). After averaging data across subjects, we observed that rCBF significantly correlated with both short-range (r = 0.29, P < 0.0001, dfeff = 1,488) and long-range FCS (r = 0.57, P < 0.0001, dfeff = 1,488) across voxels (Fig. 3B). It is interesting to note that the long-range FCS–rCBF correlation was significantly higher than the short-range FCS–rCBF correlation (P = 0.00018). Across-subject correlation analysis revealed that both short-range and long-range FCS was significantly correlated with rCBF in the PCC/PCu and lateral frontal, temporal, and parietal cortices (Fig. S4).
Fig. 3.
Distance-dependent relationship between FCS and rCBF at resting state. (A) Long-range and short-range FCS maps. (B) Scatterplot showing the across-voxel relationship between rCBF and short-range or long-range FCS.
To further validate our observation of the tight coupling between connectivity and metabolism, we computed correlation of FCS and distance-dependent FCS with PET-derived metabolism indices from Vaishnavi et al. (10) across Brodmann areas. The results showed that long-rang FCS was significantly correlated with CMRglu (r = 0.49, P < 0.0001) and CMRO2 (r = 0.45, P < 0.0001), and short-range FCS was also tightly correlated with CMRglu (r = 0.52, P < 0.0001) and CMRO2 (r = 0.64, P < 0.0001) (Fig. S1B).
rCBF/FCS ratio.
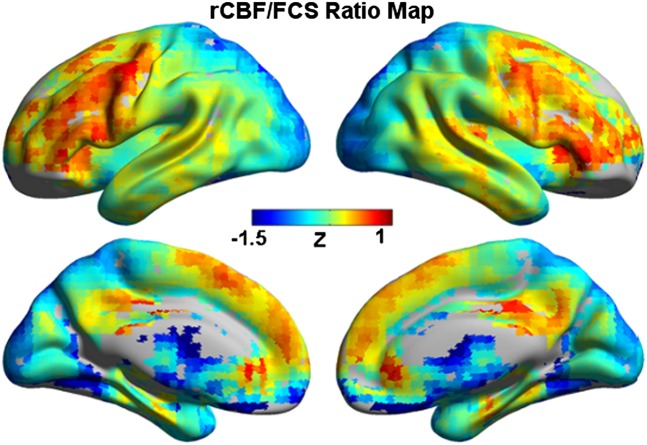
We defined the ratio of rCBF to FCS to quantify the amount of blood flow or metabolic energy per unit of connectivity strength. Brain regions with higher rCBF/FCS ratio were mainly distributed in the PCC/PCu, mPFC/ACC, lPFC, and medial and lateral temporal cortices. In comparison, the regions with lower rCBF/FCS were mainly located in posterior visual cortices and several subcortical regions (Fig. 4). Similar patterns were also observed for short-range and long-range rCBF/FCS ratio maps (Fig. S5).
Fig. 4.
rCBF/FCS ratio map at resting state. rCBF/FCS values were normalized to z scores and averaged across subjects.
Task-State Functional Networks and rCBF.
The tightly coupled FCS and rCBF at rest, as shown above, suggests an important metabolic correlate of intrinsic functional hubs of the human brain. However, both FCS and rCBF could undergo changes at a task state. We next explored whether the FCS–rCBF relationship would be preserved during a working-memory task, and be modulated by increasing task load.
Relationship between functional network connectivity and rCBF.
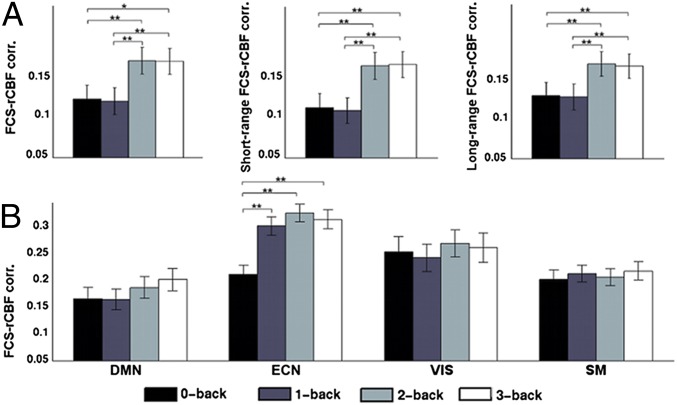
Functional hubs of DMN regions at rest were largely preserved during task performance (Fig. S6). Furthermore, typical working-memory-related regions, including the middle frontal- and posterior-parietal cortices, showed high FCS during task engagement (Fig. S6). Similar influence of task engagement was also observed in rCBF (Fig. S6). We further observed that FCS remained highly correlated with rCBF across voxels during working-memory task. Across-voxel correlation between FCS and rCBF was r = 0.29 (P < 0.0001, dfeff = 1,488) at 0-back, r = 0.28 (P < 0.0001, dfeff = 1,488) at 1-back, r = 0.38 (P < 0.0001, dfeff = 1,488) at 2-back, and r = 0.41 (P < 0.0001, dfeff = 1,488) at 3-back. After a Fisher’s transform of correlation values to z scores, paired t tests revealed significant increases in FCS–rCBF correlations from 0-back to 2-back (P = 0.002) and 3-back (P = 0.0005), and from 1-back to 2-back (P = 0.0013) and 3-back (P = 0.001) (Fig. 5A). What is more interesting is that the FCS–rCBF relationship increased from 0-back to 1-back (P = 0.00002), 2-back (P = 0.0000001), and 3-back (P = 0.000007) within the ECN module, but stayed relatively unaffected with increasing task load within the other three modules (Fig. 5B). Across-subject correlation analyses revealed significant FCS–rCBF associations in lateral-frontal and parietal cortices, PCC/PCu, mPFC, and sensorimotor and visual areas (Fig. S7).
Fig. 5.
Strengthened FCS–rCBF relationship with increasing working-memory load. (A) Spatial correlation across gray matter voxels between rCBF and FCS, short-range and long-range FCS with increasing WM load. (B) Spatial correlation in different modules between rCBF and within-module FCS with increasing WM load. Paired t tests were performed between different loads on normalized correlation values by Fisher’s z transform. *Pcorreced < 0.05. **Pcorrected < 0.01. Error bars refer to SE.
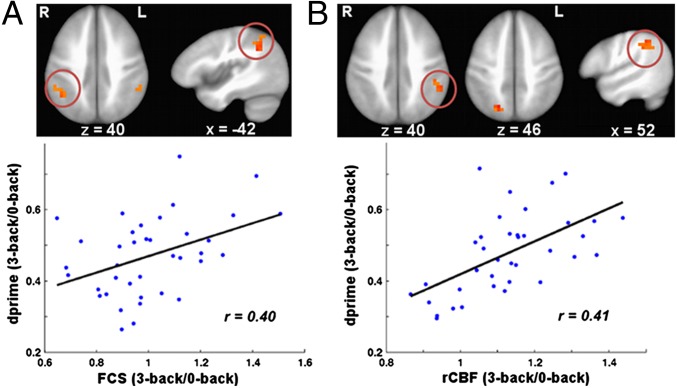
To test whether task-related changes in rCBF and FCS might relate to behavioral performance, we conducted a voxel-wise correlation analysis between the changes in rCBF or FCS and task performance, dprime, which is a measurement of hit rate and penalizing for the false alarm rate (23). As expected, we found that the behavioral performance positively correlated with working-memory task-related changes in FCS in the right inferior-parietal lobule (Pcorrected < 0.05), and task-related changes in rCBF in the left inferior-parietal lobule at the 3-back level (Pcorrected < 0.05; Fig. 6).
Fig. 6.
Brain–behavior relationship at working-memory states. (A) Correlation map between task-related changes in FCS and the corresponding task performance (dprime) at 3-back. The region in the right IPL (red circled) showed significant positive correlation between FCS (3-back/0-back) and dprime (3-back/0-back) (Pcorrected <0.05). (Lower) Plots of the average changes in FCS (3-back/0-back) in the right IPL against dprime (3-back/0-back). (B) Correlation map between task-related changes in rCBF and the corresponding dprime at 3-back. The region in the left IPL (red circled) showed significant positive correlation between rCBF (3-back/0-back) and dprime (3-back/0-back) (Pcorrected <0.05). (Lower) Plots of the average changes in rCBF (3-back/0-back) in the left IPL against dprime (3-back/0-back). Regions (left IPL in A and right SPL/PCu in B) that present a trend of brain–behavior relationship (Puncorrected < 0.05) were also shown.
Distance-dependent relationship between functional network connectivity and rCBF.
The spatial patterns of both short-range and long-range hubs were considerably preserved during task performance, although high connectivity was shown in brain regions located within the frontal-parietal system (Fig. S6). Two observations emerged for the across-voxel relationship between rCBF and the distance-dependent FCS during task performance. First, the relationship between rCBF and both long-range and short-range FCS remained significant during the working-memory task (Table 1), and strengthened with increasing task load (Fig. 5A). Second, at lower task loads, the long-range FCS–rCBF relationship significantly exceeded the short-range FCS–rCBF relationship at 0-back (P = 0.00005) and 1-back (P = 0.00004). However, with increasing task load, no significant difference was found. In addition, several brain regions, including the PCC/PCu, mPFC/ACC, lateral frontal and parietal, sensorimotor and visual cortices, showed significant across-subject correlations between rCBF and both short-range and long-range FCS (Fig. S7).
Table 1.
Across-voxel correlation between FCS and rCBF under task states
| 0-back |
1-back |
2-back |
3-back |
|||||
| r | P | r | P | r | P | r | P | |
| FCS vs. rCBF | 0.29 | <0.0001 | 0.28 | <0.0001 | 0.38 | <0.0001 | 0.41 | <0.0001 |
| Short-range FCS vs. rCBF | 0.26 | <0.0001 | 0.25 | <0.0001 | 0.37 | <0.0001 | 0.40 | <0.0001 |
| Long-range FCS vs. rCBF | 0.34 | <0.0001 | 0.33 | <0.0001 | 0.42 | <0.0001 | 0.44 | <0.0001 |
rCBF/FCS ratio.
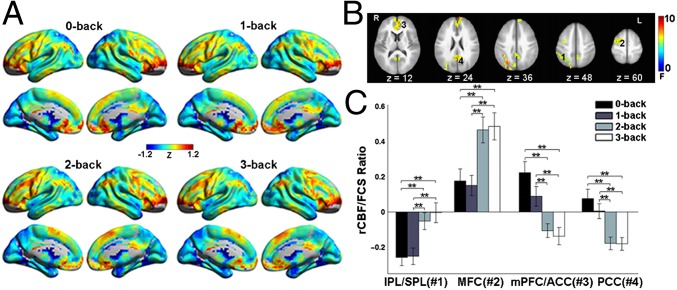
Another interesting finding was the modulation of rCBF/FCS ratio by working-memory task load. Visual examination indicates highly similar rCBF/FCS pattern at different working-memory loads (Fig. 7A). However, a repeated-measures analysis of variable (ANOVA) with task load (0-back, 1-back, 2-back, and 3-back) as the fixed effect revealed that rCBF/FCS ratio was significantly modulated by task load in several task-positive regions, including the left inferior- and superior-parietal lobe (IPL/SPL) and middle frontal cortex (MFC), and several task-negative regions, including the PCC/PCu and mPFC/ACC (Fig. 7B). Post hoc paired t tests further revealed that rCBF/FCS significantly increased in the left IPL/SPL and MFC, and decreased in mPFC/ACC and PCC/PCu as the task difficulty increased (Fig. 7C). Similar effects were observed for both short-range and long-range rCBF/FCS patterns (Fig. S5).
Fig. 7.
The effects of increasing task load on rCBF/FCS ratio. (A) The rCBF/FCS map at 0-back, 1-back, 2-back, and 3-back. (B) Repeated-measures ANOVA revealed significantly modulated rCBF/FCS values by task load in the left IPL/SPL (1) and MFC (2), bilateral ACC/mPFC (3), and PCC (4). (C) Significant differences in rCBF/FCS across the four task loads in the four regions. Error bars refer to SE. **Pcorrected < 0.01.
Discussion
This study revealed a close relationship between functional brain hubs and blood flow supply. First, high FCS at rest was found primarily in the DMN, insula, and visual cortices, and showed a strong spatial correlation with the distribution of rCBF. The correlation was stronger in the DMN and ECN modules than in the visual and sensorimotor modules, and was distance dependent; i.e., rCBF correlated stronger with long-range connectivity strength than short-range one. Second, higher rCBF/FCS ratio was found in the PCC/PCu, mPFC/ACC, and lPFC, but lower in posterior visual areas. Third, a strengthened relationship between FCS and rCBF was shown at high loads of the N-back working-memory task. Finally, task-induced changes of FCS and rCBF in the inferior parietal lobule significantly predicted individual behavioral performance.
Resting-State Functional Hubs Correlate to Brain Metabolism.
During rest, we found that functional hubs were located primarily in the DMN and visual areas, which was approximately in accordance with previous functional (7, 8, 24) and structural network studies (5, 6). These hub regions largely overlapped with the brain regions that have high rCBF during rest as observed in previous PET (9) and ASL (25) studies. Our across-voxel correlation analysis demonstrated that rCBF was significantly correlated with three nodal centrality measures (FCS, efficiency, and betweenness), complementing the previous findings of high correlation between structural connectivity and rCBF (17). Given that resting-state rCBF is closely related to basal cerebral metabolism (9, 10), the tight relationship between nodal centrality measures and rCBF suggests an underlying metabolic basis for highly connected and/or highly centralized functional hubs, and thus provides direct evidence for the physiological significance of network topological measures. This finding was further complemented by the across-subject correlation analysis between FCS and rCBF. Regions including the PCC/PCu, mPFC; cuneus; and lateral frontal, temporal, parietal, and visual cortices showed a significant correlation of FCS with rCBF, most of which were identified as functional hubs or of high rCBF. Previous studies have found that the spatial pattern of typical hub regions in the DMN strongly overlaps with high amyloid-β deposition in Alzheimer’s disease (7, 26), suggesting that sustained activation of the DMN may render the brain system vulnerable to this disease (27). The robust FCS–rCBF relation shown here might provide insights into the mechanisms of hub disruptions in brain disorders (7, 26, 28). We also observed higher FCS–rCBF coupling in DMN and ECN modules than in visual and sensorimotor ones. Because the DMN and ECN are higher-order brain systems involving internal and external cognitive processes, the greater variety of neural dynamics compared with primary sensory and motor systems may be related to greater association between blood supply and functional connectivity organization.
Consistent with previous studies (6, 17), our results revealed that both GM volume and SCS were significantly correlated with rCBF, indicating that brain areas with greater GM volume or structural connections tend to be more metabolically active. After controlling for GM volume or SCS, we found that functional hubs were still in need of higher proportion of rCBF. These observations confirmed that the relationship between FCS and rCBF was not solely the result of structural covariates. A growing number of empirical (6, 29) and computational (30, 31) studies support the hypothesis that spontaneous neural activity is shaped, but not limited, by the underlying anatomy. Our observations suggest that metabolic demands also have a close relationship with intrinsic functional organization of the brain networks.
FCS–rCBF Relationship Is Distance Dependent.
Disparate spatial patterns of the number of short- versus long-range functional connections have been reported previously (18), suggesting disproportionate metabolic demands of the two measures. In the present study, brain regions with high long-range FCS were mainly located in association cortical areas including mPFC/lPFC, paralimbic regions of PCC/PCu, and temporal and parietal cortices, showing a high spatial overlap with the rCBF map. Because these association regions are actively involved in high-level cognitive functions (32), the predominance of long-range connections could provide quick links to other brain regions in the network (3), and thus enable efficient information processing. Long-range connections might also travel across multiple modules to allow the distant hubs act as connectors to integrate information between segregated modules (4). Stronger FCS–rCBF correlation was found in long-range connectivity in the current study, suggesting that brain hubs with abundant long-range connections couple more closely with blood/energy supply to facilitate their greater participation in neural processes (16). High short-range connectivity was observed in mPFC, lPFC, and primary sensorimotor and visual cortices, which corresponds well with a previous study (18). However, the spatial distribution of short-range hubs showed a relative lower correlation with the rCBF map, probably due to the mismatch between short-range FCS and rCBF in the primary sensory and motor areas. Sensorimotor areas were among the most pronounced short-range hubs, but showed relatively low level of rCBF although the underlying physiology is unclear.
Another interesting finding was the nonuniform distribution of rCBF/FCS ratio across the brain. Brain areas in the PCC/PCu, mPFC/ACC, and lPFC appeared to have high rCBF/FCS ratio, indicating high metabolic requirements to maintain their connections to the rest of the brain. Distant connections were prominent across these regions, which have been implicated to be important for high-level cognitive functions such as attention and control processes, suggesting that the organization of functional connectivity in these brain regions is optimized to perform efficient information processing at the cost of high energy consumption. In comparison, regions with low rCBF/FCS ratio overlapped with the pronounced short-range hubs in primary visual cortices. These local functional hubs may be abundant in short-range connections to coordinate information flow within an individual community. The low rCBF/FCS ratio indicates that the existence of local hubs may serve to help the brain conserve its metabolic energy.
Relationship Between FCS and rCBF at Task and the Effects of Increasing Task Load.
Previous studies have demonstrated that both FCS (7, 18, 33) and rCBF (19, 20) undergo modulations in response to cognitive, effort-demanding tasks. However, whether this relationship between FCS and rCBF would still be present during task performance was hitherto unknown. We found, in the current study, that coupled changes of FCS and rCBF during a working-memory task, indicating a stable, tightly coupled relationship between functional connectivity and metabolic supply is present independent of brain states—whether at rest or while performing an active task. More important, we found that the correlation between FCS and rCBF strengthened significantly as working-memory load increases, especially within the task-related ECN module, indicating a specific modulation effect of the task load on the relationship between FCS and blood supply. Engaging greater cognitive effort in task performance has been shown to be associated with a more efficient network topology (34); our findings of increased blood supply at high task loads suggest that extra metabolism would be needed to support the reorganized functional connectivity architecture. Performing the task also increased rCBF/FCS ratio in task-positive regions, including right IPL/SPL and MFC, and decreased in the task-negative DMN regions, such as the mPFC/ACC and PCC/PCu. This observation is generally consistent with previous studies showing the modulation effects of working memory on rCBF (19, 20) and FCS (33). Modulated (increased and decreased) rCBF/FCS ratio during the working-memory task suggests that rCBF is biased to task-positive regions to maintain elevated metabolic efficacy to ensure that these regions are well connected to the rest of the brain at increased task loads. What is also interesting is that we identified a significant FCS–behavior relationship in the right IPL, showing that the changes in FCS at the 3-back level were related to individual differences in task performance. This suggests that in addition to task-evoked blood supply observed here, and BOLD activation in previous studies (35), connectivity organization also plays a role in behavioral variability.
Limitations and Future Directions.
First, in the present study, we adopted rCBF obtained from perfusion imaging as a surrogate measure of metabolism. Although we showed that rCBF from our ASL perfusion data correlated highly with PET-derived metabolism measures, including CMRO2 and CMRGlu, the findings will be validated in future studies by direct comparisons of FCS and metabolic measures in the same subjects. Second, although we have shown interactions between functional connectivity architecture and blood supply, beyond its underlying structural constraints, it should be noted that, rather than being optimal for any single factor, brain connectivity jointly satisfies multiple demands such as low wiring and metabolic cost, highly efficient information processing and high robustness. Future work is required for a full consideration of these factors. Finally, aberrant functional connectivity has been found to be related to hypometabolism in certain neuropsychiatric disorders, such as Alzheimer’s disease (26); it would be interesting to explore the changes in the relationship between functional connectivity and brain’s energy metabolism in such diseased populations.
Materials and Methods
Participants.
Forty-eight healthy adults (27.4 ± 7.1 y old, 25 females) participated in the study. All participants were screened to ensure they had no history of neurological/psychiatric conditions or drug abuse. Informed consent was obtained from all subjects in accordance with the guidelines and approval of the Institutional Review Board of the Intramural Research Program of the National Institute on Drug Abuse.
Data Acquisition.
Scanning was performed on a 3 Tesla MR Scanner (Siemens). All participants first underwent a resting-state BOLD and a resting-state ASL scan. In addition, 39 of the participants also underwent a BOLD and an ASL scan while performing an N-back working-memory task. Experiment design and MR parameters are detailed in SI Materials and Methods.
Data Analysis.
Both BOLD and ASL images were preprocessed using the Analysis of Functional Neuroimaging (AFNI) software package. After preprocessing, these functional images were subject to the following analysis. (i) To identify functional hubs, we computed FCS and two other centrality measures, nodal efficiency and betweenness, at a voxel level. (ii) To study the FCS–rCBF relationship within different functional systems, we performed a voxelwise modular analysis to decompose the whole-brain network into different modules. (iii) To explore the influence of connection distance on FCS–rCBF relationship, we computed short-range and long-range FCS. (iv) To evaluate the metabolic consumption per unit connectivity strength, we calculated the ratio of rCBF to FCS in a voxelwise manner. Regions with higher rCBF/FCS ratio tend to have higher metabolic demands to connect them to the rest of the brain. (v) To evaluate the task effects of increasing working-memory load on the FCS–rCBF relationship, across-voxel correlations were converted to z scores using Fisher’s transformation, and paired t tests were performed in z scores between every two pairs of task states. (vi) To test whether task-related changes in rCBF and FCS might relate to behavioral performance, we conducted voxelwise correlation between the changes in rCBF or FCS and task performance (dprime). All of the results were corrected for multiple comparisons. Because the neighboring voxels could be highly dependent due to physiological correlations and spatial preprocessing such as registration and spatial smoothing, the effective degree of freedom dfeff in across-voxel correlation analyses would be much smaller than the number of voxels used in the analyses. When the spatial smoothness (modeled as FWHM of the Gaussian kernel using the “3dFWHMx” implemented in AFNI here, FWHMx = 8.84 mm, FWHMy = 8.81 mm, and FWHMz = 9.15 mm) is much larger than the volume of the voxel (v = 4 × 4 × 4 mm3), the spatial correlations would be dominated by the spatial smoothing (36). Therefore, we only consider the dependence between voxels induced by spatial smoothing. The dfeff of across-voxel correlations was then estimated by the following approximation:
 |
where v is the nominal volume of the voxel and N is the number of voxels used in the analyses. The dfeff was subsequently used to compute corrected P values for across-voxel correlations. Detailed data analysis is further described in SI Materials and Methods.
Supplementary Material
Acknowledgments
We thank Dr. Marcus E. Raichle for his important suggestions and comments on this study. We also thank Dr. Vani Pariyadath for linguistic editing of the manuscript. This work was supported by the Intramural Research Program of the National Institute on Drug Abuse, Natural Science Foundation of China Grants 81030028 and 31221003, National Science Fund for Distinguished Young Scholars Grant 81225012, National Basic Research Program of China (973) Grant 2013CB531004, and Beijing Natural Science Foundation Grant Z111107067311036.
Footnotes
The authors declare no conflict of interest.
*This Direct Submission article had a prearranged editor.
This article contains supporting information online at www.pnas.org/lookup/suppl/doi:10.1073/pnas.1214900110/-/DCSupplemental.
References
- 1.Bullmore E, Sporns O. Complex brain networks: Graph theoretical analysis of structural and functional systems. Nat Rev Neurosci. 2009;10(3):186–198. doi: 10.1038/nrn2575. [DOI] [PubMed] [Google Scholar]
- 2.He Y, Evans A. Graph theoretical modeling of brain connectivity. Curr Opin Neurol. 2010;23(4):341–350. doi: 10.1097/WCO.0b013e32833aa567. [DOI] [PubMed] [Google Scholar]
- 3.Achard S, Salvador R, Whitcher B, Suckling J, Bullmore E. A resilient, low-frequency, small-world human brain functional network with highly connected association cortical hubs. J Neurosci. 2006;26(1):63–72. doi: 10.1523/JNEUROSCI.3874-05.2006. [DOI] [PMC free article] [PubMed] [Google Scholar]
- 4.He Y, et al. Uncovering intrinsic modular organization of spontaneous brain activity in humans. PLoS ONE. 2009;4(4):e5226. doi: 10.1371/journal.pone.0005226. [DOI] [PMC free article] [PubMed] [Google Scholar]
- 5.Gong G, et al. Mapping anatomical connectivity patterns of human cerebral cortex using in vivo diffusion tensor imaging tractography. Cereb Cortex. 2009;19(3):524–536. doi: 10.1093/cercor/bhn102. [DOI] [PMC free article] [PubMed] [Google Scholar]
- 6.Hagmann PC, et al. Mapping the structural core of human cerebral cortex. PLoS Biol. 2008;6(7):e159. doi: 10.1371/journal.pbio.0060159. [DOI] [PMC free article] [PubMed] [Google Scholar]
- 7.Buckner RL, et al. Cortical hubs revealed by intrinsic functional connectivity: Mapping, assessment of stability, and relation to Alzheimer’s disease. J Neurosci. 2009;29(6):1860–1873. doi: 10.1523/JNEUROSCI.5062-08.2009. [DOI] [PMC free article] [PubMed] [Google Scholar]
- 8.Tomasi D, Volkow ND. Functional connectivity density mapping. Proc Natl Acad Sci USA. 2010;107(21):9885–9890. doi: 10.1073/pnas.1001414107. [DOI] [PMC free article] [PubMed] [Google Scholar]
- 9.Raichle ME, et al. A default mode of brain function. Proc Natl Acad Sci USA. 2001;98(2):676–682. doi: 10.1073/pnas.98.2.676. [DOI] [PMC free article] [PubMed] [Google Scholar]
- 10.Vaishnavi SN, et al. Regional aerobic glycolysis in the human brain. Proc Natl Acad Sci USA. 2010;107(41):17757–17762. doi: 10.1073/pnas.1010459107. [DOI] [PMC free article] [PubMed] [Google Scholar]
- 11.Paulson OB, Hasselbalch SG, Rostrup E, Knudsen GM, Pelligrino D. Cerebral blood flow response to functional activation. J Cereb Blood Flow Metab. 2010;30(1):2–14. doi: 10.1038/jcbfm.2009.188. [DOI] [PMC free article] [PubMed] [Google Scholar]
- 12.Newberg AB, et al. Concurrent CBF and CMRGlc changes during human brain activation by combined fMRI-PET scanning. Neuroimage. 2005;28(2):500–506. doi: 10.1016/j.neuroimage.2005.06.040. [DOI] [PubMed] [Google Scholar]
- 13.Fox PT, Raichle ME. Focal physiological uncoupling of cerebral blood flow and oxidative metabolism during somatosensory stimulation in human subjects. Proc Natl Acad Sci USA. 1986;83(4):1140–1144. doi: 10.1073/pnas.83.4.1140. [DOI] [PMC free article] [PubMed] [Google Scholar]
- 14.Fox PT, Raichle ME, Mintun MA, Dence C. Nonoxidative glucose consumption during focal physiologic neural activity. Science. 1988;241(4864):462–464. doi: 10.1126/science.3260686. [DOI] [PubMed] [Google Scholar]
- 15.Hoge RD, et al. Linear coupling between cerebral blood flow and oxygen consumption in activated human cortex. Proc Natl Acad Sci USA. 1999;96(16):9403–9408. doi: 10.1073/pnas.96.16.9403. [DOI] [PMC free article] [PubMed] [Google Scholar]
- 16.Bullmore E, Sporns O. The economy of brain network organization. Nat Rev Neurosci. 2012;13(5):336–349. doi: 10.1038/nrn3214. [DOI] [PubMed] [Google Scholar]
- 17.Várkuti B, et al. Quantifying the link between anatomical connectivity, gray matter volume and regional cerebral blood flow: An integrative MRI study. PLoS ONE. 2011;6(4):e14801. doi: 10.1371/journal.pone.0014801. [DOI] [PMC free article] [PubMed] [Google Scholar]
- 18.Sepulcre J, et al. The organization of local and distant functional connectivity in the human brain. PLOS Comput Biol. 2010;6(6):e1000808. doi: 10.1371/journal.pcbi.1000808. [DOI] [PMC free article] [PubMed] [Google Scholar]
- 19.Kim J, et al. Continuous ASL perfusion fMRI investigation of higher cognition: Quantification of tonic CBF changes during sustained attention and working memory tasks. Neuroimage. 2006;31(1):376–385. doi: 10.1016/j.neuroimage.2005.11.035. [DOI] [PMC free article] [PubMed] [Google Scholar]
- 20.Petrides M, Alivisatos B, Meyer E, Evans AC. Functional activation of the human frontal cortex during the performance of verbal working memory tasks. Proc Natl Acad Sci USA. 1993;90(3):878–882. doi: 10.1073/pnas.90.3.878. [DOI] [PMC free article] [PubMed] [Google Scholar]
- 21.Lerch JP, et al. Mapping anatomical correlations across cerebral cortex (MACACC) using cortical thickness from MRI. Neuroimage. 2006;31(3):993–1003. doi: 10.1016/j.neuroimage.2006.01.042. [DOI] [PubMed] [Google Scholar]
- 22.He Y, et al. Impaired small-world efficiency in structural cortical networks in multiple sclerosis associated with white matter lesion load. Brain. 2009;132(Pt 12):3366–3379. doi: 10.1093/brain/awp089. [DOI] [PMC free article] [PubMed] [Google Scholar]
- 23.Haatveit BC, et al. The validity of d prime as a working memory index: Results from the “Bergen n-back task”. J Clin Exp Neuropsychol. 2010;32(8):871–880. doi: 10.1080/13803391003596421. [DOI] [PubMed] [Google Scholar]
- 24.Zuo XN, et al. Network centrality in the human functional connectome. Cereb Cortex. 2012;22(8):1862–1875. doi: 10.1093/cercor/bhr269. [DOI] [PubMed] [Google Scholar]
- 25.Zou Q, Wu CW, Stein EA, Zang Y, Yang Y. Static and dynamic characteristics of cerebral blood flow during the resting state. Neuroimage. 2009;48(3):515–524. doi: 10.1016/j.neuroimage.2009.07.006. [DOI] [PMC free article] [PubMed] [Google Scholar]
- 26.Drzezga A, et al. Neuronal dysfunction and disconnection of cortical hubs in non-demented subjects with elevated amyloid burden. Brain. 2011;134(Pt 6):1635–1646. doi: 10.1093/brain/awr066. [DOI] [PMC free article] [PubMed] [Google Scholar]
- 27.Walker LC, Jucker M. Amyloid by default. Nat Neurosci. 2011;14(6):669–670. doi: 10.1038/nn.2853. [DOI] [PMC free article] [PubMed] [Google Scholar]
- 28.Wang J, et al. Disrupted functional brain connectome in individuals at risk for Alzheimer’s disease. Biol Psychiatry. 2012 doi: 10.1016/j.biopsych.2012.03.026. [DOI] [PubMed] [Google Scholar]
- 29.Honey CJS, et al. Predicting human resting-state functional connectivity from structural connectivity. Proc Natl Acad Sci USA. 2009;106(6):2035–2040. doi: 10.1073/pnas.0811168106. [DOI] [PMC free article] [PubMed] [Google Scholar]
- 30.Honey CJK, Kötter R, Breakspear M, Sporns O. Network structure of cerebral cortex shapes functional connectivity on multiple time scales. Proc Natl Acad Sci USA. 2007;104(24):10240–10245. doi: 10.1073/pnas.0701519104. [DOI] [PMC free article] [PubMed] [Google Scholar]
- 31.Rubinov M, Sporns O, van Leeuwen C, Breakspear M. Symbiotic relationship between brain structure and dynamics. BMC Neurosci. 2009;10(1):55. doi: 10.1186/1471-2202-10-55. [DOI] [PMC free article] [PubMed] [Google Scholar]
- 32.Mesulam M-M. From sensation to cognition. Brain. 1998;121(Pt 6):1013–1052. doi: 10.1093/brain/121.6.1013. [DOI] [PubMed] [Google Scholar]
- 33.Salomon R, et al. Global functional connectivity deficits in schizophrenia depend on behavioral state. J Neurosci. 2011;31(36):12972–12981. doi: 10.1523/JNEUROSCI.2987-11.2011. [DOI] [PMC free article] [PubMed] [Google Scholar]
- 34.Kitzbichler MG, Henson RN, Smith ML, Nathan PJ, Bullmore ET. Cognitive effort drives workspace configuration of human brain functional networks. J Neurosci. 2011;31(22):8259–8270. doi: 10.1523/JNEUROSCI.0440-11.2011. [DOI] [PMC free article] [PubMed] [Google Scholar]
- 35.DeYoung CG, Shamosh NA, Green AE, Braver TS, Gray JR. Intellect as distinct from openness: Differences revealed by fMRI of working memory. J Pers Soc Psychol. 2009;97(5):883–892. doi: 10.1037/a0016615. [DOI] [PMC free article] [PubMed] [Google Scholar]
- 36.Xiong J, Gao J-H, Lancaster JL, Fox PT. Clustered pixels analysis for functional MRI activation studies of the human brain. Hum Brain Mapp. 1995;3(4):287–301. [Google Scholar]
Associated Data
This section collects any data citations, data availability statements, or supplementary materials included in this article.


