

Abstract
A reciprocal association between bone marrow fat and bone mass has been reported in ovariectomized rodents, suggesting that bone marrow adipogenesis has a negative effect on bone growth and turnover balance. Mice with loss of function mutations in kit receptor (kitW/W-v) have no bone marrow adipocytes in tibia or lumbar vertebra. We therefore tested the hypothesis that marrow fat contributes to development of osteopenia by comparing the skeletal response to ovariectomy (ovx) in growing wild type (WT) and bone marrow adipocyte-deficient kitW/W-v mice. Mice were ovx at 4 weeks of age and sacrificed 4 or 10 weeks post-surgery. Body composition was measured at necropsy by dual-energy X-ray absorptiometry. Cortical (tibia) and cancellous (tibia and lumbar vertebra) bone architecture were evaluated by microcomputed tomography. Bone marrow adipocyte size and density, osteoblast- and osteoclast-lined bone perimeters, and bone formation were determined by histomorphometry. Ovx resulted in an increase in total body fat mass at 10 weeks post-ovx in both genotypes, but the response was attenuated in the in kitW/W-v mice. Adipocytes were present in bone marrow of tibia and lumbar vertebra in WT mice and bone marrow adiposity increased following ovx. In contrast, marrow adipocytes were not detected in either intact or ovx kitW/W-v mice. However, ovx in WT and kitW/W-v mice resulted in statistically indistinguishable changes in cortical and cancellous bone mass, cortical and cancellous bone formation rate, and cancellous osteoblast and osteoclast-lined bone perimeters. In conclusion, our findings do not support a causal role for increased bone marrow fat as a mediator of ovx-induced osteopenia in mice.
Keywords: osteoblast, osteoclast, menopause, osteoporosis, adipokines
1. INTRODUCTION
The physiological significance of bone marrow fat is currently a topic of debate [1–4]. Bone marrow fat is an important depot for storage of triglycerides. Fat depots generally act as energy reserves in which fatty acids are taken up by adipocytes from lipoproteins and subsequently released into the general circulation following lipolysis. Although bone marrow fat is highly labile [5], bone marrow adipocytes increase in number and sequester and esterify fatty acids during severe caloric restriction, suggesting that the bone marrow fat depot does not function as a typical energy reservoir for peripheral tissues [6].
Age-related reciprocal changes in bone marrow adiposity and bone mass are accelerated in humans following menopause, during disuse, and during treatment with glucocorticoids, and in animal models for pathological bone loss [7–12]. These findings have fueled speculation that increased marrow fat may lead to bone loss. Proposed mechanisms for the putative detrimental effects of marrow fat on bone metabolism fall into two general, though non-mutually exclusive, categories: 1) differentiation of stromal cells into adipocytes occurring at the expense of osteoblast differentiation, and 2) adipocyte production of factors (adipokines) which antagonize bone formation and/or increase bone resorption [13].
It is well established that osteoblasts and adipocytes are derived from a common bone marrow progenitor [14]. A deficiency in the transcription factor PPARγ reduces marrow fat and enhances osteogenesis in mice [15]. In contrast, osteoblast-targeted overexpression of PPARγ exaggerates ovariectomy (ovx)-induced osteopenia in mice [16], while PPARγ agonists are associated with bone loss in insulin-resistant humans [17]. Taken together, these findings suggest increased adipocyte differentiation curtails the differentiation of osteoblasts.
Estrogen plays a key role in skeletal growth and maturation and in the maintenance of bone balance in adults [18]. As in humans, gonadal insufficiency in female rodents is associated with increased peripheral fat accumulation, increased bone marrow adiposity, accelerated bone turnover, and osteopenia [19–23]. However, in spite of a strong inverse association between bone marrow fat and bone mass, it has proven difficult to directly test the hypothesis that excess fat accumulation in bone marrow is responsible for ovx-induced osteopenia. In this regard, we recently reported that kit receptor-deficient kitW/W-v mice have no bone marrow adipocytes [24] but are able to produce osteoblasts and osteoclasts. We therefore reasoned that if bone marrow adipose tissue contributes to the detrimental skeletal effects of estrogen deficiency, kitW/W-v mice would be resistant to ovx-induced osteopenia. We tested this hypothesis by determining the effect of ovx on body composition, bone mass and architecture, and dynamic and cellular indices of bone turnover in growing WT and kitW/W-v mice.
2. MATERIALS AND METHODS
The experimental protocol was approved by the Institutional Animal Care and Use Committee. Animals were maintained under standard conditions with a 12-h light, 12-h dark cycle in accordance with the NIH Guide for the Care and Use of Laboratory Animals. Food (standard chow) and water were provided ad libitum.
Two experiments were conducted in 4-week-old ovary-intact and ovx female WBB6F1/J-kitW/kitW-v (kitW/W-v) and wild type (WT) WBB6F1/J littermates purchased from the Jackson Laboratory (Bar Harbor, ME, USA). In the first experiment, WT and kitW/W-v mice were maintained for 10 weeks following surgery and sacrificed at 14 weeks of age to evaluate the long-term skeletal response to ovx. In the second, follow-up experiment, the mice were maintained for 4 weeks following surgery and sacrificed at 8 weeks of age to assess short-term skeletal response to ovx. Specifically, the follow up study was designed to evaluate whether lack of adipocytes influences the effects of ovx on cancellous bone formation. The fluorochrome calcein (Sigma, St Louis, MO) was administered at 20 mg/kg 7 and 1 days prior to sacrifice (14-week-old mice) or 4 and 1 days prior to sacrifice (8-week-old mice). The mice were anesthetized with 2–3% isofluorane delivered in oxygen and body composition determined via dual energy x-ray absorptiometry (DXA) using a PIXImus small animal densitometer (Lunar Corp., Madison, WI, USA). Death was induced by cardiac excision, and tibiae (both experiments) and lumbar vertebrae (experiment 2 only) were removed and stored in 70% ethanol for micro-computed tomography (μCT) and histomorphometric analysis. Tibial length was measured using digital calipers (Little Machine Shop, Pasadena, CA).
2.1 Micro-computed Tomography
μCT was used for nondestructive three-dimensional evaluation of bone architecture. Tibiae and lumbar vertebrae were scanned using a Scanco μCT40 scanner (Scanco Medical AG, Basserdorf, Switzerland) at a voxel size of 12 × 12 × 12 μm and evaluated at a threshold of 265 (gray scale, 0–1000). The threshold value was determined empirically. Total tibia (cancellous plus cortical bone) was evaluated followed by evaluation of cortical bone in the tibial diaphysis and cancellous bone in the proximal tibial metaphysis. For cortical bone, 20 slices (0.24 mm) of bone 0.7 mm proximal to the tibio-fibular junction were measured and cross-sectional tissue volume (cortical and marrow volume, mm3), cortical volume (mm3), marrow volume (mm3), and cortical thickness (μm) determined [25]. For the tibial metaphysis, 60 slices (0.72 mm) of bone beginning 0.75 mm distal to the growth plate were measured. Analysis of the lumbar vertebra included the entire region of secondary spongiosa between the cranial and caudal growth plates. Cancellous bone measurements in tibia and lumbar vertebra included cancellous bone volume/tissue volume (%), connectivity density (1/mm3), trabecular number (mm−1), trabecular thickness (μm) and trabecular separation (μm) [26].
2.2 Histomorphometry
The histological methods used here have been described in detail [27]. In brief, the proximal tibial metaphysis and lumbar vertebra were dehydrated in graded increases of ethanol and xylene and embedded undecalcified in methyl methacrylate. Sections (4 μm thick) were cut with vertical bed microtomes (Leica/Jung 2065 and 2165) and affixed to slides precoated with a 1% gelatin solution. Sections were stained with toluidine blue or acid phosphatase with a toluidine blue counterstain for cellular measurements or mounted unstained for measurement of fluorochromes. Osteoblasts and adipocytes were measured in the toluidine blue-stained sections and osteoclasts were measured in acid phosphatase/toluidine blue-stained sections. All cell data were collected under visible light and all fluorochrome data were collected under ultraviolet light using the OsteoMeasure System (OsteoMetrics, Inc., Atlanta, GA). The sampling site for the proximal tibial metaphysis was located 0.25–1.25 mm distal to the growth plate, included secondary spongiosa only, and averaged 1.2 ± 0.1 mm2 (mean ± SE). The sampling site in lumbar vertebra included the entire cancellous compartment and averaged 1.75 ± 0.05 mm2. Both sampling sites excluded cortical margins.
Tissue area, bone area, osteoblast perimeter (osteoblast perimeter/bone perimeter, %) and osteoclast perimeter (osteoclast perimeter/bone perimeter, %) were measured. Adipocyte number and area were also measured and expressed as bone marrow adiposity (% tissue area occupied by adipocytes), adipocyte density (number/mm2) and mean adipocyte size (μm2). Adipocytes were identified morphologically as large circular or oval-shaped cells bordered by a prominent cell membrane and lacking cytoplasmic staining due to alcohol extraction of intracellular lipids during processing. This method was previously validated by fat extraction and analysis [5]. Fluorochrome-based indices of bone formation included: 1) mineralizing perimeter (cancellous bone perimeter covered with double plus half single fluorochrome label normalized to bone perimeter, %), 2) mineral apposition rate (the distance between two fluorochrome markers that comprise a double label divided by interval (3 days for cancellous bone) between label administration, μm/day), and 3) bone formation rate (calculated by multiplying mineralizing perimeter by mineral apposition rate normalized to bone perimeter, μm2/μm/yr).
For cortical bone measurements in the tibia, undecalcified cross-sections (150 μm) were cut at the tibiofibular synostosis using a low-speed diamond-edge saw (Isomet; Buehler, Lake Bluff, IL, USA) and ground on a roughened glass plate to ~20 μm. Fluorochrome-based indices of cortical bone formation were measured in the diaphysis (periosteal or endocortical perimeters) on one cross section/bone and included: 1) mineralizing perimeter, 2) mineral apposition rate (6 day labeling interval for cortical bone), and 3) bone formation rate. Mineralizing perimeter, mineral apposition rate and bone formation rate were calculated as for cancellous bone.
2.3 Statistics
Two-way ANOVA was used to evaluate the respective effects of genotype, surgery and genotype x surgery interactions (SPSS 19.0, SPSS Inc., Chicago, IL). Differences were considered significant at P < 0.05. All data are reported as mean ± SE.
3. RESULTS
3.1 Long-term Effects of Ovx on the Skeleton of WT and Bone Marrow Adipocyte-Deficient Mice
The effects of genotype (WT vs. kitW/W-v) and surgery (sham-operated ovary-intact vs. ovx) on body composition in 14-week-old mice 10 weeks following surgery are shown in Figure 1. Total body mass, fat mass, and fat expressed as % body mass was higher in WT than kitW/W-v mice, and higher in ovx than ovary-intact animals. A significant genotype by surgery interaction was not detected for total body weight. However, the interaction was significant for fat mass and % fat mass. Specifically, compared to WT mice, kitW/W-v mice exhibited a reduced increment in fat mass following ovx.
Figure 1.
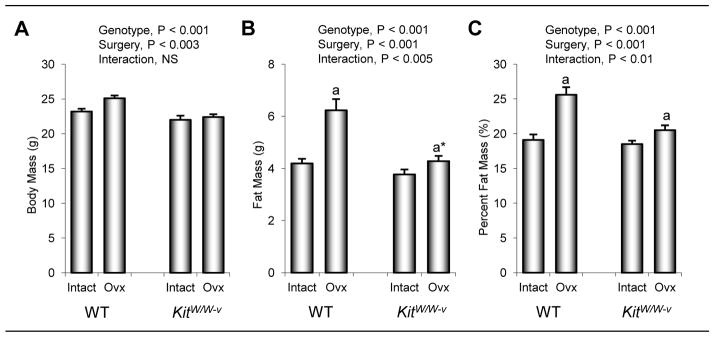
The effects of genotype (WT vs. kitW/W-v) and surgery (ovary-intact vs. ovx) on total body mass (a), fat mass (b), and fat mass expressed as % body mass (c) in 14-week-old mice 10 weeks following surgery. Values are mean ± SE. aP<0.05 compared to ovary-intact within genotype, a*P<0.1 compared to ovary-intact within genotype.
The effects of genotype and surgery on total tibia bone volume, tibial length, and cortical bone architecture in the tibial diaphysis are shown in Table 1. Tibiae were longer in WT than kitW/W-v mice and longer in ovx mice than in ovary-intact mice. Tibial bone volume was also higher in WT than kitW/W-v mice but lower in ovx mice than in ovary-intact mice. Significant genotype by surgery interactions were not detected for either tibial length or total tibial bone volume. Cross-sectional tissue volume, cortical volume, marrow volume, and cortical thickness were higher in WT mice than in kitW/W-v mice. Surgery had no effect on cross-sectional tissue volume. However, cortical volume and thickness were lower and medullary volume was higher in ovx mice compared to ovary-intact mice. A significant genotype by surgery interaction was not detected for any of the cortical endpoints evaluated.
Table 1.
The effect of kit receptor deficiency and ovariectomy on total tibia bone volume and length and cortical bone architecture proximal to the tibio-fibular junction in 14-week-old mice at 10 weeks following surgery.
| WT | Kit W/W-v | ANOVA (P<) | |||||
|---|---|---|---|---|---|---|---|
|
|
|||||||
| Intact | Ovx | Intact | Ovx | Genotype | Surgery | Interaction | |
|
|
|
|
|||||
| Total Tibia | |||||||
| Bone length (mm) | 17.56 ± 0.10 | 17.96 ± 0.04 | 17.31 ± 0.12 | 17.73 ± 0.08 | 0.003 | 0.001 | NS |
| Bone volume (mm3) | 16.35 ± 0.24 | 14.82 ± 0.23 | 13.99 ± 0.39 | 12.93 ± 0.34 | 0.001 | 0.001 | NS |
| Tibial Diaphysis (cortical bone) | |||||||
| Tissue volume (mm3) | 0.181 ± 0.002 | 0.177 ± 0.002 | 0.162 ± 0.002 | 0.159 ± 0.002 | 0.001 | NS | NS |
| Cortical volume (mm3) | 0.137 ± 0.002 | 0.128 ± 0.002 | 0.123 ± 0.002 | 0.119 ± 0.002 | 0.001 | 0.001 | NS |
| Marrow volume (mm3) | 0.044 ± 0.001 | 0.048 ± 0.001 | 0.039 ± 0.001 | 0.041 ± 0.002 | 0.001 | 0.03 | NS |
| Cortical thickness (μm) | 257 ± 4 | 238 ± 2 | 241 ± 2 | 231 ± 4 | 0.001 | 0.001 | NS |
Data are mean ± SE
The effects of genotype and surgery on cancellous bone measurements in the proximal tibial metaphysis and dynamic cortical bone measurements in the tibial diaphysis are shown in Figure 2. Cancellous bone volume/tissue volume was higher in WT than kitW/W-v mice and lower in ovx mice than in ovary-intact mice. These differences can be readily appreciated in images depicted in Figure 3 (a–d). A significant genotype by surgery interaction was not detected for cancellous bone volume/tissue volume. Osteoblast and osteoclast perimeters were higher in kitW/W-v than WT mice and higher in ovx mice than in ovary-intact mice. However, significant genotype by surgery interactions were not detected for either endpoint evaluated.
Figure 2.

The effects of genotype (WT vs. kitW/W-v) and surgery (ovary-intact vs. ovx) on cancellous bone volume/tissue volume (BV/TV) (a), osteoblast perimeter (Ob.Pm/B.Pm) (b), osteoclast perimeter (Oc.Pm/B.Pm) (c), endocortical mineralizing perimeter/bone perimeter (M.Pm/B.Pm) (d), mineral apposition rate (MAR) (e), and bone formation rate/bone perimeter (BFR/B.Pm) (f), periosteal M.Pm/B.Pm (g), MAR (h), and BFR/B.Pm (i), and on bone marrow adiposity (j), adipocyte density (k), and adipocyte size (l) in the proximal tibial metaphysis of 14-week-old mice at 10 weeks following surgery. Values are mean ± SE. aP<0.05 compared to ovary-intact within genotype. a*P<0.1 compared to ovary-intact within genotype.
Figure 3.

Representative microcomputed tomography images of cancellous bone in the proximal tibial metaphyses from intact WT, ovx WT, intact kitW/W-v and ovx kitW/W-v mice (a–d). Please note the lower bone volume in ovx compared to intact mice. Also shown are photomicrographs of histological sections from intact WT, ovx WT, intact kitW/W-v and ovx kitW/W-v mice showing adipocytes demarcated by an asterisk (e–h) in toluidine blue-stained sections from the proximal tibial metaphysis. Please note the absence of adipocytes in the kitW/W-v mice.
Differences in endocortical and periosteal mineralizing perimeter, mineral apposition rate, or bone formation rate in the tibial diaphysis were not detected with genotype. Endocortical and periosteal bone formation rate was higher in ovx than ovary-intact mice. This increase was due predominantly to a greater increase in mineralizing perimeter at both envelopes. Significant genotype by surgery interactions were not detected for any endocortical or periosteal dynamic endpoints measured.
Bone marrow adipocytes were common in proximal tibia of WT mice. Bone marrow adiposity (% tissue area with fat) and adipocyte size were higher in ovx than in ovary-intact WT mice. Also, there was a strong tendency (P=0.1) for adipocyte density to be higher in ovx than ovary-intact WT mice. Adipocytes were not detected in either ovary-intact or ovx kitW/W-v mice. The genotype and ovx-induced differences in bone marrow adiposity can be appreciated in images depicted in Figure 3 (g–h).
3.2 Short-term Effects of Ovx on the Skeleton of WT and Bone Marrow Adipocyte-Deficient Mice
The effects of genotype and surgery on body composition in 8-week-old mice 4 weeks following surgery are shown in Figure 4. Total body mass, fat mass, and fat expressed as % body mass was higher in WT than kitW/W-v mice. Total body mass was higher in ovx compared to ovary-intact animals. While differences in fat mass were not detected with surgery, fat expressed as % body mass was lower in ovx compared to intact mice at 4 weeks post-surgery. Significant genotype by surgery interactions were not detected for total body mass, fat mass or fat expressed as % body mass.
Figure 4.
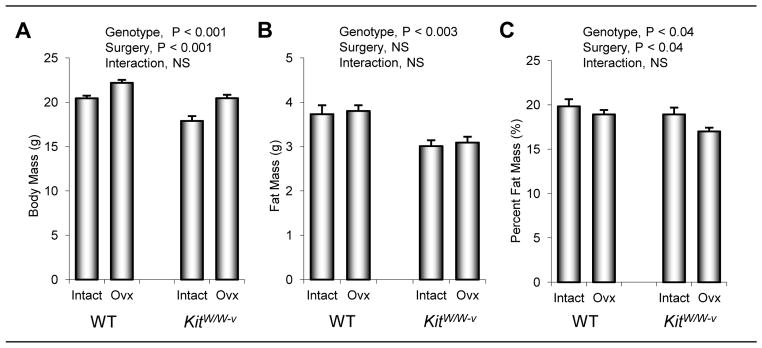
The effects of genotype (WT vs. kitW/W-v) and surgery (ovary-intact vs. ovx) on total body mass (a), fat mass (b), and fat mass expressed as % body mass (c) in 8-week-old mice 4 weeks following surgery. Values are mean ± SE.
The effects of genotype and ovx on tibial length, total tibial bone volume, and tibial cortical and cancellous bone architecture are shown in Table 2. Tibial length did not differ between WT and kitW/W-v mice. Tibiae were longer in ovx mice than in ovary-intact mice. Tibial bone volume was greater in WT than kitW/W-v mice and lower in ovx mice than in ovary-intact mice. A significant genotype by surgery interaction was not detected for either tibial length or total tibial bone volume. Diaphyseal cross-sectional tissue volume, cortical volume, and marrow volume were higher in WT mice than in kitW/W-v mice. Differences in cortical thickness were not detected with genotype. Cortical bone volume and cortical thickness were lower and medullary volume was higher in ovx mice compared to ovary-intact mice. Significant genotype by surgery interactions were not detected for any of the cortical endpoints evaluated.
Table 2.
The effect of kit receptor deficiency and ovariectomy on total tibia bone volume and length, cortical bone architecture proximal to the tibio-fibular junction, and cancellous bone volume and architecture in the proximal tibial metaphysis and 3rd lumbar vertebra in 8-week-old mice at 4 weeks following surgery.
| WT | Kit W/W-v | ANOVA (P<) | |||||
|---|---|---|---|---|---|---|---|
|
|
|||||||
| Intact | Ovx | Intact | Ovx | Genotype | Surgery | Interaction | |
|
|
|
|
|||||
| Total Tibia | |||||||
| Bone length (mm) | 17.10 ± 0.08 | 17.58 ± 0.10 | 17.00 ± 0.09 | 17.37 ± 0.14 | NS | 0.001 | NS |
| Bone volume (mm3) | 14.78 ± 0.42 | 12.80 ± 0.26 | 13.23 ± 0.29 | 12.51 ± 0.29 | 0.01 | 0.001 | NS |
| Tibial Diaphysis (cortical bone) | |||||||
| Tissue volume (mm3) | 0.154 ± 0.004 | 0.156 ± 0.002 | 0.140 ± 0.002 | 0.138 ± 0.002 | 0.001 | NS | NS |
| Cortical volume (mm3) | 0.118 ± 0.002 | 0.114 ± 0.002 | 0.110 ± 0.002 | 0.102 ± 0.002 | 0.001 | 0.01 | NS |
| Marrow volume (mm3) | 0.036 ± 0.002 | 0.042 ± 0.002 | 0.030 ± 0.002 | 0.036 ± 0.002 | 0.001 | 0.001 | NS |
| Cortical thickness (μm) | 260 ± 5 | 245 ± 2 | 259 ± 4 | 235 ± 6 | NS | 0.001 | NS |
| Proximal Tibial Metaphysis (cancellous bone) | |||||||
| Bone volume/Tissue volume (%) | 6.75 ± 0.35 | 1.99 ± 0.21 | 6.74 ± 1.28 | 1.94 ± 0.30 | NS | 0.001 | NS |
| Connectivity density (1/mm3) | 50.62 ± 7.40 | 6.48 ± 1.29 | 43.66 ± 15.85 | 5.05 ± 1.31 | NS | 0.001 | NS |
| Trabecular number (1/mm) | 3.69 ± 0.07 | 2.87 ± 0.13 | 3.93± 0.32 | 2.68 ± 0.10 | NS | 0.001 | NS |
| Trabecular thickness (μm) | 40 ± 1 | 35 ± 2 | 37 ± 2 | 30 ± 2 | 0.04 | 0.001 | NS |
| Trabecular spacing (μm) | 276 ± 6 | 366 ± 16 | 263 ± 18 | 380 ± 16 | NS | 0.001 | NS |
| 3rd Lumbar Vertebra (cancellous bone) | |||||||
| Bone volume/Tissue volume (%) | 12.36 ± 0.74 | 8.20 ± 0.31 | 13.68 ± 0.43 | 8.93 ± 0.42 | 0.05 | 0.001 | NS |
| Connectivity density (1/mm3) | 156.70 ± 13.90 | 90.73 ± 5.91 | 147.63 ± 7.70 | 90.82 ± 7.01 | NS | 0.001 | NS |
| Trabecular number (1/mm) | 4.47 ± 0.18 | 3.92 ± 0.06 | 4.37 ± 0.08 | 3.68 ± 0.06 | NS | 0.001 | NS |
| Trabecular thickness (μm) | 40 ± 1 | 36 ± 0 | 44 ± 1 | 38 ± 1 | 0.001 | 0.001 | NS |
| Trabecular spacing (μm) | 228 ± 9 | 259 ± 4 | 235 ± 4 | 277 ± 4 | 0.04 | 0.001 | NS |
Data are mean ± SE
Genotype had minimal effect on cancellous bone architecture in the proximal tibial metaphysis, with only trabecular thickness being higher in the 8-week-old WT compared to kitW/W-v mice. Ovx resulted in lower bone volume/tissue volume, connectivity density, trabecular number and trabecular thickness, and higher trabecular spacing. Significant genotype by surgery interactions were not detected for any of the cancellous endpoints evaluated.
The effects of genotype and ovx on dynamic histomorphometry in proximal tibial metaphysis are shown in Figure 5. Significant differences between WT and kitW/W-v mice were not observed. Ovx resulted in greater mineralizing perimeter, mineral apposition rate, and bone formation rate. Significant genotype by surgery interactions were not detected for any of the dynamic endpoints evaluated. Bone marrow adipocytes were common in proximal tibia of WT mice. Bone marrow adiposity was higher in ovx WT mice than in intact WT mice. The increase in marrow adiposity was due predominantly to an increase in adipocyte density. Adipocytes were not detected in either intact or ovx kitW/W-v mice.
Figure 5.

The effects of genotype (WT vs. kitW/W-v) and surgery (ovary-intact vs. ovx) on cancellous bone mineralizing perimeter/bone perimeter (M.Pm/B.Pm) (a), mineral apposition rate (MAR) (b), bone formation rate/bone perimeter (BFR/B.Pm) (c), bone marrow adiposity (d), adipocyte density (e), and adipocyte size (f) in the proximal tibial metaphysis and M.Pm/B.Pm (g), MAR (h), and BFR/B.Pm (i) in lumbar vertebra of 8-week-old mice 4 weeks following surgery. Values are mean ± SE. aP<0.05 compared to ovary-intact (intact) within genotype.
The effects of genotype and ovx on vertebral cancellous bone architecture and fluorochrome-based indices of bone turnover are shown in Table 2 and Figure 5, respectively. Vertebral cancellous bone volume/tissue volume, trabecular thickness, and trabecular spacing were greater in kitW/W-v mice than in WT mice (Table 2). Ovx resulted in lower bone volume/tissue volume, connectivity density, trabecular number, trabecular thickness, and greater trabecular spacing. Differences in dynamic bone measurements were not detected with genotype. Mineralizing perimeter and bone formation rate were higher in ovx compared to ovary-intact mice (Figure 5). Differences in mineral apposition rate were not detected with surgery, nor was there a genotype by surgery interaction for any of the endpoints measured. Adipocytes were rare in lumbar vertebrae of ovary-intact WT mice (0.2 ± 0.1 adipocytes/mm2) but more numerous in ovx WT mice (1.7 ± 0.2 adipocytes/mm2, P<0.001). Adipocytes were not present in lumbar vertebrae of either ovary-intact or ovx kitW/W-v mice.
4. DISCUSSION
Ovx in WT mice resulted in increased body mass and total body fat mass and decreased cancellous and cortical bone mass. The observed cortical and cancellous osteopenia was associated with increased bone marrow fat and increased cellular and dynamic indices of bone turnover. Similar ovx-induced changes in bone mass, architecture, and indices of bone turnover following ovx were observed in kitW/W-v mice in spite of absence of bone marrow adipocytes and an attenuated increase in total body fat mass.
Gonadal hormones, and in particular estrogen, are important physiological regulators of bone growth, maturation, and turnover balance. Changes in the circulating level of estrogen directly modulate the differentiation and activity of osteoblasts, osteoclasts, and chondrocytes [18]. Also, changes in estrogen levels have species-, skeletal compartment-, and age-specific effects on bone architecture and turnover. The normal increase in estrogen levels at puberty accelerates epiphyseal closure and promotes accumulation of cancellous bone at mechanically loaded skeletal sites [18]. Not surprisingly, estrogen acts in consort with anabolic hormones during growth to determine peak bone mass, and with reproductive hormones to regulate mineral availability during pregnancy and lactation [28, 29]. In humans, bone metabolism is disrupted by natural and surgery-induced menopause. The disruption results in accelerated but often unbalanced bone turnover which can lead to rapid local bone loss [18].
Osteoblasts and adipocytes are derived from stromal cell progenitors and it has been inferred that adipocyte differentiation within the bone marrow reduces, or even precludes, concurrent osteoblast differentiation leading to bone loss [7, 10, 30–36]. Our observation that bone marrow adipocyte-deficient kitW/W-v mice have increased osteoblast perimeter is consistent with the view that low levels of adipogenesis increase osteoblast differentiation. However, results from the current study showing cancellous osteopenia in 14-week-old kitW/W-v mice provide evidence that absence of bone marrow adipocytes is not sufficient to lead to a net increase in bone mass. In the case of kitW/W-v mice, increased osteoblast perimeter in the proximal tibia metaphysis of 14-week-old mice was accompanied by increased osteoclast perimeter and net bone loss.
The above observations do not exclude the possibility that factors produced by adipocytes contribute to the negative bone balance observed at some skeletal sites in ovx rodents. Adipocytes produce factors, including TNF α and IL-6, known to inhibit bone formation and increase bone resorption [37]. On the other hand, not all adipokines are antiosteogenic; adipocytes also produce factors such as leptin and IGF-I which can increase bone formation [5, 38–40].
In the present study, ovx resulted in an increase in tibia length but a reduction in overall tibial bone volume. In spite of increases in bone formation, marrow volume increased and cancellous bone volume decreased. It is well established that bone mass and architectural changes following ovx are not uniform throughout the skeleton. Specifically, osteopenia only occurs at sites where increases in bone formation are inadequate to match the increase in bone resorption [41]. For example, ovx results in increased bone turnover in both the proximal metaphysis and epiphysis of the tibia in rats yet rapid bone loss occurs in the metaphysis whereas cancellous bone in the epiphysis is spared. Even in the metaphysis, bone is selectively lost from sites experiencing low strain energy levels [41]. At the periosteum, a skeletal compartment with minimal bone resorption in rodents, bone formation predominates following ovx, at times leading to a net increase in cortical bone mass [42, 43]. Adipokines produced by bone marrow adipocytes could contribute to osteopenia by altering bone growth or the local balance between bone formation and resorption in favor of the latter. We evaluated these possibilities by investigating the skeletal response to ovx in kitW/W-v mice. KitW/W-v mice have no marrow adipocytes but exhibited ovx-induced skeletal changes strikingly similar to those in WT mice. We interpret this finding as strong evidence that an increase in bone marrow adiposity following ovx is not required for the dramatic skeletal responses to ovx.
In addition to an increase in bone marrow adiposity, ovx normally results in increases in body weight and peripheral fat. Rather than through local production, it is possible that the negative skeletal effects of ovx are mediated through adipokines produced in extramedullary fat depots that circulate to skeletal sites. However, ovx kitW/W-v mice, while exhibiting similar cancellous osteopenia as WT mice, exhibited a smaller long-term increase in total body fat mass. Also, cortical and cancellous osteopenia was well established during the initial 4 weeks following ovx with no corresponding increase in total body fat mass during this time. Thus, this possibility is not supported by our data.
Kit signaling is required for the ovx-induced increase in bone marrow adiposity in mice. In addition to an absence of bone marrow adipocytes, the kit receptor-deficient kitW/W-v mice have multiple abnormalities in fat metabolism. These abnormalities include hypertriglyceridemia and hypercholesterolemia [44, 45]. Chylomicrons, very low density lipoprotein, and intermediate density lipoprotein are also reported to be elevated. Additionally, the mutant mice have reduced lipoprotein lipase activity. Taken together, these findings suggest that kit signaling plays an important but not necessarily direct role in fat metabolism. Kit is required for differentiation and survival of mast cells and recent studies suggest that mast cells play an important role in obesity and diabetes by regulating adipocyte differentiation and function [46, 47]. Interestingly, receptor tyrosine kinase inhibitors targeting kit signaling have been reported to reduce blood glucose levels in patients with chronic myeloid leukemia and decrease body weight in rodents fed a high fat diet [48, 49].
Stem cell factor (kit ligand), the endogenous ligand for kit receptor, has long been recognized to regulate early hematopoietic linage decision [50]. KitW/W-v mice have a point mutation in the tyrosine kinase domain that inactivates the kit receptor in one allele and a mutation in the second allele that results in kit receptor deficiency at the cell surface [51]. As a consequence, activation of kit signaling by kit ligand is greatly reduced in kit receptor-expressing cells in kitW/W-v mice. The skeletal phenotype of kitW/W-v mice has not been described in detail. In the present study, growing mice and mice approaching skeletal maturity [52, 53] were evaluated. Our results suggest that kit receptor deficiency results in cortical as well as premature age-related cancellous osteopenia. The lower cortical bone mass in the mutant mice appears to be largely due to a reduction in bone growth. The lower cancellous bone volume in the proximal tibial metaphysis of 14-week-old mice was associated with increases in osteoblast and osteoclast perimeters, suggesting that kit signaling in mice also functions to regulate bone balance in adults.
The skeletal abnormalities observed in kitW/W-v mice are similar to those reported in kitSl/Sl-d mice [52]. KitSl/Sl-d mice produce a protein similar to secreted kit ligand but are unable to produce membrane-associated kit ligand. Secreted kit ligand binds to and activates kit receptor but is unable to duplicate all of the actions of the membrane-associated ligand [51, 54, 55]. As a consequence, kitSl/Sl-d mice are sterile, anemic, osteopenic, have elevated osteoclast perimeter and have no marrow adipocytes [24]. Thus, activation of kit signaling through kit receptor by membrane-associated kit ligand appears necessary for differentiation of a variety of marrow-derived cells, including adipocytes.
KitW/W-v mice are also mast cell-deficient [44]. Mast cells produce an impressive variety of factors capable of influencing bone metabolism, including histamine, TNF-α, serotonin, and platelet-derived growth factor alpha [56, 57]. Mastocytosis is associated with abnormal bone metabolism, decreased bone mineral density, and increased fracture risk [58–62]. Ovx results in increased mast cell density in bone marrow of rats, leading to speculation that mast cells may contribute to the etiology of osteoporosis [63]. The present study, demonstrating comparable changes in WT and kitW/W-v mice following ovx, does not support an important role for mast cells in mediating the skeletal response to ovx in mice. However, it should be noted that, in contrast to humans and rats, mast cells are rarely present in bone marrow of mice. Furthermore, there is evidence that the presence of mast cells within bone marrow contributes to species differences in bone metabolism [64].
5. CONCLUSIONS
In summary, we replicated the previously reported inverse relationship between changes in bone mass and bone marrow adiposity in WT mice following ovx. Specifically, cortical and cancellous bone mass was decreased in ovx compared to ovary-intact WT mice while bone marrow adiposity was increased. We confirmed the absence of adipocytes in bone marrow of kitW/W-v mice and showed that marrow adipocytes were not induced by ovx in the kit-deficient animals. Ovx resulted in increases in bone turnover and statistically indistinguishable changes in bone architecture in WT and bone marrow adipocyte-deficient kitW/W-v mice. These findings suggest that bone marrow adipose tissue is not required for development of cortical or cancellous osteopenia following ovx in growing mice.
*HIGHLIGHTS.
Compared to WT mice, kit receptor-deficient kitW/W-v mice had lower body fat and lacked bone marrow adipocytes.
Adipocytes were present in bone marrow of WT mice and bone marrow adiposity increased following ovariectomy.
Adipocytes were not detected in ovariectomized kitW/W-v mice.
Significant differences in bone response to ovariectomy were not detected between WT and kitW/W-v mice.
Our findings do not support a causal role for increased bone marrow fat as a mediator of ovariectomy-induced osteopenia in mice.
Acknowledgments
The authors thank Ms. Dawn Olson for performing DXA analysis of WT and kit receptor-deficient kitW/W-v mice. This work was supported by the National Institutes of Health grant AR060913 (to UT Iwaniec) and NASA grant NNX12AL24G (to RT Turner).
Footnotes
Conflict of Interest: The authors have no conflicts of interest.
Publisher's Disclaimer: This is a PDF file of an unedited manuscript that has been accepted for publication. As a service to our customers we are providing this early version of the manuscript. The manuscript will undergo copyediting, typesetting, and review of the resulting proof before it is published in its final citable form. Please note that during the production process errors may be discovered which could affect the content, and all legal disclaimers that apply to the journal pertain.
References Cited
- 1.Devlin MJ. Why does starvation make bones fat? Am J Hum Biol. 2011;23:577–85. doi: 10.1002/ajhb.21202. [DOI] [PMC free article] [PubMed] [Google Scholar]
- 2.Duque G. Bone and fat connection in aging bone. Curr Opin Rheumatol. 2008;20:429–34. doi: 10.1097/BOR.0b013e3283025e9c. [DOI] [PubMed] [Google Scholar]
- 3.Motyl KJ, Rosen CJ. Temperatures rising: brown fat and bone. Discov Med. 2011;11:179–185. [PMC free article] [PubMed] [Google Scholar]
- 4.Sheu Y, Cauley JA. The role of bone marrow and visceral fat on bone metabolism. Curr Osteoporos Rep. 2011;9:67–75. doi: 10.1007/s11914-011-0051-6. [DOI] [PMC free article] [PubMed] [Google Scholar]
- 5.Menagh PJ, Turner RT, Jump DB, Wong CP, Lowry MB, Yakar S, Rosen CJ, Iwaniec UT. Growth hormone regulates the balance between bone formation and bone marrow adiposity. J Bone Miner Res. 2010;25:757–68. doi: 10.1359/jbmr.091015. [DOI] [PMC free article] [PubMed] [Google Scholar]
- 6.Bathija A, Davis S, Trubowitz S. Bone marrow adipose tissue: response to acute starvation. Am J Hematol. 1979;6:191–8. doi: 10.1002/ajh.2830060303. [DOI] [PubMed] [Google Scholar]
- 7.Duque G, Li W, Adams M, Xu S, Phipps R. Effects of risedronate on bone marrow adipocytes in postmenopausal women. Osteoporos Int. 2011;22:1547–53. doi: 10.1007/s00198-010-1353-8. [DOI] [PubMed] [Google Scholar]
- 8.Jackson MA, Iwaniec UT, Turner RT, Wronski TJ, Kalra SP. Effects of increased hypothalamic leptin gene expression on ovariectomy-induced bone loss in rats. Peptides. 2011;32:1575–80. doi: 10.1016/j.peptides.2011.04.029. [DOI] [PMC free article] [PubMed] [Google Scholar]
- 9.Maddalozzo GF, Turner RT, Edwards CH, Howe KS, Widrick JJ, Rosen CJ, Iwaniec UT. Alcohol alters whole body composition, inhibits bone formation, and increases bone marrow adiposity in rats. Osteoporos Int. 2009;20:1529–38. doi: 10.1007/s00198-009-0836-y. [DOI] [PubMed] [Google Scholar]
- 10.Martin RB, Zissimos SL. Relationships between marrow fat and bone turnover in ovariectomized and intact rats. Bone. 1991;12:123–31. doi: 10.1016/8756-3282(91)90011-7. [DOI] [PubMed] [Google Scholar]
- 11.Morita Y, Iwamoto I, Mizuma N, Kuwahata T, Matsuo T, Yoshinaga M, Douchi T. Precedence of the shift of body-fat distribution over the change in body composition after menopause. J Obstet Gynaecol Res. 2006;32:513–6. doi: 10.1111/j.1447-0756.2006.00437.x. [DOI] [PubMed] [Google Scholar]
- 12.Trudel G, Payne M, Madler B, Ramachandran N, Lecompte M, Wade C, Biolo G, Blanc S, Hughson R, Bear L, Uhthoff HK. Bone marrow fat accumulation after 60 days of bed rest persisted 1 year after activities were resumed along with hemopoietic stimulation: the Women International Space Simulation for Exploration study. J Appl Physiol. 2009;107:540–8. doi: 10.1152/japplphysiol.91530.2008. [DOI] [PubMed] [Google Scholar]
- 13.Kilroy GE, Foster SJ, Wu X, Ruiz J, Sherwood S, Heifetz A, Ludlow JW, Stricker DM, Potiny S, Green P, Halvorsen YD, Cheatham B, Storms RW, Gimble JM. Cytokine profile of human adipose-derived stem cells: expression of angiogenic, hematopoietic, and pro-inflammatory factors. J Cell Physiol. 2007;212:702–9. doi: 10.1002/jcp.21068. [DOI] [PubMed] [Google Scholar]
- 14.Prockop DJ. Marrow stromal cells as stem cells for nonhematopoietic tissues. Science. 1997;276:71–4. doi: 10.1126/science.276.5309.71. [DOI] [PubMed] [Google Scholar]
- 15.Akune T, Ohba S, Kamekura S, Yamaguchi M, Chung UI, Kubota N, Terauchi Y, Harada Y, Azuma Y, Nakamura K, Kadowaki T, Kawaguchi H. PPARgamma insufficiency enhances osteogenesis through osteoblast formation from bone marrow progenitors. J Clin Invest. 2004;113:846–55. doi: 10.1172/JCI19900. [DOI] [PMC free article] [PubMed] [Google Scholar]
- 16.Cho SW, Yang JY, Her SJ, Choi HJ, Jung JY, Sun HJ, An JH, Cho HY, Kim SW, Park KS, Kim SY, Baek WY, Kim JE, Yim M, Shin CS. Osteoblast-targeted overexpression of PPARgamma inhibited bone mass gain in male mice and accelerated ovariectomy-induced bone loss in female mice. J Bone Miner Res. 2011;26:1939–52. doi: 10.1002/jbmr.366. [DOI] [PubMed] [Google Scholar]
- 17.Grey A. Skeletal consequences of thiazolidinedione therapy. Osteoporos Int. 2008;19:129–37. doi: 10.1007/s00198-007-0477-y. [DOI] [PubMed] [Google Scholar]
- 18.Turner RT, Riggs BL, Spelsberg TC. Skeletal effects of estrogen. Endocr Rev. 1994;15:275–300. doi: 10.1210/edrv-15-3-275. [DOI] [PubMed] [Google Scholar]
- 19.Elbaz A, Rivas D, Duque G. Effect of estrogens on bone marrow adipogenesis and Sirt1 in aging C57BL/6J mice. Biogerontology. 2009;10:747–55. doi: 10.1007/s10522-009-9221-7. [DOI] [PubMed] [Google Scholar]
- 20.Kim YY, Kim SH, Oh S, Sul OJ, Lee HY, Kim HJ, Kim SY, Choi HS. Increased fat due to estrogen deficiency induces bone loss by elevating monocyte chemoattractant protein-1 (MCP-1) production. Mol Cells. 2010;29:277–82. doi: 10.1007/s10059-010-0027-x. [DOI] [PubMed] [Google Scholar]
- 21.Liu Y, Tang GY, Tang RB, Peng YF, Li W. Assessment of bone marrow changes in postmenopausal women with varying bone densities: magnetic resonance spectroscopy and diffusion magnetic resonance imaging. Chin Med J (Engl) 2010;123:1524–7. [PubMed] [Google Scholar]
- 22.Martin RB, Chow BD, Lucas PA. Bone marrow fat content in relation to bone remodeling and serum chemistry in intact and ovariectomized dogs. Calcif Tissue Int. 1990;46:189–94. doi: 10.1007/BF02555043. [DOI] [PubMed] [Google Scholar]
- 23.Sharp JC, Copps JC, Liu Q, Ryner LN, Sebastian RA, Zeng GQ, Smith S, Niere JO, Tomanek B, Sato M. Analysis of ovariectomy and estrogen effects on body composition in rats by X-ray and magnetic resonance imaging techniques. J Bone Miner Res. 2000;15:138–46. doi: 10.1359/jbmr.2000.15.1.138. [DOI] [PubMed] [Google Scholar]
- 24.Turner RT, Wong CP, Iwaniec UT. Effect of reduced c-Kit signaling on bone marrow adiposity. Anat Rec (Hoboken) 2011;294:1126–34. doi: 10.1002/ar.21409. [DOI] [PubMed] [Google Scholar]
- 25.Bagi CM, Hanson N, Andresen C, Pero R, Lariviere R, Turner CH, Laib A. The use of micro-CT to evaluate cortical bone geometry and strength in nude rats: correlation with mechanical testing, pQCT and DXA. Bone. 2006;38:136–44. doi: 10.1016/j.bone.2005.07.028. [DOI] [PubMed] [Google Scholar]
- 26.Thomsen JS, Laib A, Koller B, Prohaska S, Mosekilde L, Gowin W. Stereological measures of trabecular bone structure: comparison of 3D micro computed tomography with 2D histological sections in human proximal tibial bone biopsies. J Microsc. 2005;218:171–9. doi: 10.1111/j.1365-2818.2005.01469.x. [DOI] [PubMed] [Google Scholar]
- 27.Iwaniec UT, Wronski TJ, Turner RT. Histological analysis of bone. Methods Mol Biol. 2008;447:325–41. doi: 10.1007/978-1-59745-242-7_21. [DOI] [PubMed] [Google Scholar]
- 28.Miller SC, Shupe JG, Redd EH, Miller MA, Omura TH. Changes in bone mineral and bone formation rates during pregnancy and lactation in rats. Bone. 1986;7:283–7. doi: 10.1016/8756-3282(86)90209-7. [DOI] [PubMed] [Google Scholar]
- 29.Nicks KM, Fowler TW, Gaddy D. Reproductive hormones and bone. Curr Osteoporos Rep. 2010;8:60–7. doi: 10.1007/s11914-010-0014-3. [DOI] [PubMed] [Google Scholar]
- 30.Benayahu D, Shur I, Ben-Eliyahu S. Hormonal changes affect the bone and bone marrow cells in a rat model. J Cell Biochem. 2000;79:407–15. doi: 10.1002/1097-4644(20001201)79:3<407::aid-jcb60>3.0.co;2-8. [DOI] [PubMed] [Google Scholar]
- 31.Qiu W, Andersen TE, Bollerslev J, Mandrup S, Abdallah BM, Kassem M. Patients with high bone mass phenotype exhibit enhanced osteoblast differentiation and inhibition of adipogenesis of human mesenchymal stem cells. J Bone Miner Res. 2007;22:1720–31. doi: 10.1359/jbmr.070721. [DOI] [PubMed] [Google Scholar]
- 32.Rosen CJ, Ackert-Bicknell C, Rodriguez JP, Pino AM. Marrow fat and the bone microenvironment: developmental, functional, and pathological implications. Crit Rev Eukaryot Gene Expr. 2009;19:109–24. doi: 10.1615/critreveukargeneexpr.v19.i2.20. [DOI] [PMC free article] [PubMed] [Google Scholar]
- 33.Somjen D, Katzburg S, Kohen F, Gayer B, Posner GH, Yoles I, Livne E. The effects of native and synthetic estrogenic compounds as well as vitamin D less-calcemic analogs on adipocytes content in rat bone marrow. J Endocrinol Invest. 2011;34:106–10. doi: 10.1007/BF03347039. [DOI] [PubMed] [Google Scholar]
- 34.Songlin P, Ge Z, Yixin H, Xinluan W, Pingchung L, Kwoksui L, Ling Q. Epimedium-derived flavonoids promote osteoblastogenesis and suppress adipogenesis in bone marrow stromal cells while exerting an anabolic effect on osteoporotic bone. Bone. 2009;45:534–44. doi: 10.1016/j.bone.2009.05.022. [DOI] [PubMed] [Google Scholar]
- 35.Sottile V, Seuwen K, Kneissel M. Enhanced marrow adipogenesis and bone resorption in estrogen-deprived rats treated with the PPARgamma agonist BRL49653 (rosiglitazone) Calcif Tissue Int. 2004;75:329–37. doi: 10.1007/s00223-004-0224-8. [DOI] [PubMed] [Google Scholar]
- 36.Zhang H, Lu W, Zhao Y, Rong P, Cao R, Gu W, Xiao J, Miao D, Lappe J, Recker R, Xiao GG. Adipocytes derived from human bone marrow mesenchymal stem cells exert inhibitory effects on osteoblastogenesis. Curr Mol Med. 2011;11:489–502. doi: 10.2174/156652411796268704. [DOI] [PubMed] [Google Scholar]
- 37.Galic S, Oakhill JS, Steinberg GR. Adipose tissue as an endocrine organ. Mol Cell Endocrinol. 2010;316:129–39. doi: 10.1016/j.mce.2009.08.018. [DOI] [PubMed] [Google Scholar]
- 38.Bartell SM, Rayalam S, Ambati S, Gaddam DR, Hartzell DL, Hamrick M, She JX, Della-Fera MA, Baile CA. Central (ICV) leptin injection increases bone formation, bone mineral density, muscle mass, serum IGF-1, and the expression of osteogenic genes in leptin-deficient ob/ob mice. J Bone Miner Res. 2011;26:1710–20. doi: 10.1002/jbmr.406. [DOI] [PubMed] [Google Scholar]
- 39.Turner RT, Kalra SP, Wong CP, Philbrick KA, Lindenmaier LB, Boghossian S, Iwaniec UT. Peripheral leptin regulates bone formation. J Bone Miner Res. doi: 10.1002/jbmr.1734. [DOI] [PMC free article] [PubMed] [Google Scholar]
- 40.Wabitsch M, Braun S, Hauner H, Heinze E, Ilondo MM, Shymko R, De Meyts P, Teller WM. Mitogenic and antiadipogenic properties of human growth hormone in differentiating human adipocyte precursor cells in primary culture. Pediatr Res. 1996;40:450–6. doi: 10.1203/00006450-199609000-00014. [DOI] [PubMed] [Google Scholar]
- 41.Westerlind KC, Wronski TJ, Ritman EL, Luo ZP, An KN, Bell NH, Turner RT. Estrogen regulates the rate of bone turnover but bone balance in ovariectomized rats is modulated by prevailing mechanical strain. Proc Natl Acad Sci U S A. 1997;94:4199–204. doi: 10.1073/pnas.94.8.4199. [DOI] [PMC free article] [PubMed] [Google Scholar]
- 42.Turner RT, Backup P, Sherman PJ, Hill E, Evans GL, Spelsberg TC. Mechanism of action of estrogen on intramembranous bone formation: regulation of osteoblast differentiation and activity. Endocrinology. 1992;131:883–9. doi: 10.1210/endo.131.2.1639030. [DOI] [PubMed] [Google Scholar]
- 43.Turner RT, Hannon KS, Demers LM, Buchanan J, Bell NH. Differential effects of gonadal function on bone histomorphometry in male and female rats. J Bone Miner Res. 1989;4:557–63. doi: 10.1002/jbmr.5650040415. [DOI] [PubMed] [Google Scholar]
- 44.Hatanaka K, Tanishita H, Ishibashi-Ueda H, Yamamoto A. Hyperlipidemia in mast cell-deficient W/WV mice. Biochim Biophys Acta. 1986;878:440–5. doi: 10.1016/0005-2760(86)90254-7. [DOI] [PubMed] [Google Scholar]
- 45.Potter JE, Wright EG. Bone marrow lipids in normal and anemic mice. Am J Hematol. 1980;8:361–7. doi: 10.1002/ajh.2830080404. [DOI] [PubMed] [Google Scholar]
- 46.Altintas MM, Nayer B, Walford EC, Johnson KB, Gaidosh G, Reiser J, De La Cruz-Munoz N, Ortega LM, Nayer A. Leptin deficiency-induced obesity affects the density of mast cells in abdominal fat depots and lymph nodes in mice. Lipids Health Dis. 2011;11:21. doi: 10.1186/1476-511X-11-21. [DOI] [PMC free article] [PubMed] [Google Scholar]
- 47.Wang J, Shi GP. Mast cell stabilization: novel medication for obesity and diabetes. Diabetes Metab Res Rev. 2011;27:919–24. doi: 10.1002/dmrr.1272. [DOI] [PMC free article] [PubMed] [Google Scholar]
- 48.Agostino NM, Chinchilli VM, Lynch CJ, Koszyk-Szewczyk A, Gingrich R, Sivik J, Drabick JJ. Effect of the tyrosine kinase inhibitors (sunitinib, sorafenib, dasatinib, and imatinib) on blood glucose levels in diabetic and nondiabetic patients in general clinical practice. J Oncol Pharm Pract. 2012;17:197–202. doi: 10.1177/1078155210378913. [DOI] [PubMed] [Google Scholar]
- 49.Hagerkvist R, Jansson L, Welsh N. Imatinib mesylate improves insulin sensitivity and glucose disposal rates in rats fed a high-fat diet. Clin Sci (Lond) 2008;114:65–71. doi: 10.1042/CS20070122. [DOI] [PubMed] [Google Scholar]
- 50.Miettinen M, Lasota J. KIT (CD117): a review on expression in normal and neoplastic tissues, and mutations and their clinicopathologic correlation. Appl Immunohistochem Mol Morphol. 2005;13:205–20. doi: 10.1097/01.pai.0000173054.83414.22. [DOI] [PubMed] [Google Scholar]
- 51.Zsebo KM, Williams DA, Geissler EN, Broudy VC, Martin FH, Atkins HL, Hsu RY, Birkett NC, Okino KH, Murdock DC, et al. Stem cell factor is encoded at the Sl locus of the mouse and is the ligand for the c-kit tyrosine kinase receptor. Cell. 1990;63:213–24. doi: 10.1016/0092-8674(90)90302-u. [DOI] [PubMed] [Google Scholar]
- 52.Lotinun S, Evans GL, Turner RT, Oursler MJ. Deletion of membrane-bound steel factor results in osteopenia in mice. J Bone Miner Res. 2005;20:644–52. doi: 10.1359/JBMR.041209. [DOI] [PubMed] [Google Scholar]
- 53.Somerville JM, Aspden RM, Armour KE, Armour KJ, Reid DM. Growth of C57BL/6 mice and the material and mechanical properties of cortical bone from the tibia. Calcif Tissue Int. 2004;74:469–75. doi: 10.1007/s00223-003-0101-x. [DOI] [PubMed] [Google Scholar]
- 54.Kuroda H, Terada N, Nakayama H, Matsumoto K, Kitamura Y. Infertility due to growth arrest of ovarian follicles in Sl/Slt mice. Dev Biol. 1988;126:71–9. doi: 10.1016/0012-1606(88)90240-0. [DOI] [PubMed] [Google Scholar]
- 55.Nakano T, Waki N, Yoshiyasu S, Kanamaru A, Kitamura Y. The cause of anemia in mutant mice of Sl/Slt genotype: hypoplasia in bone marrow and restricted hyperplasia in spleen. Exp Hematol. 1988;16:117–21. [PubMed] [Google Scholar]
- 56.Lotinun S, Sibonga JD, Turner RT. Triazolopyrimidine (trapidil), a platelet-derived growth factor antagonist, inhibits parathyroid bone disease in an animal model for chronic hyperparathyroidism. Endocrinology. 2003;144:2000–7. doi: 10.1210/en.2002-221000. [DOI] [PubMed] [Google Scholar]
- 57.Puri N, Roche PA. Mast cells possess distinct secretory granule subsets whose exocytosis is regulated by different SNARE isoforms. Proc Natl Acad Sci U S A. 2008;105:2580–5. doi: 10.1073/pnas.0707854105. [DOI] [PMC free article] [PubMed] [Google Scholar]
- 58.Brumsen C, Papapoulos SE, Lentjes EG, Kluin PM, Hamdy NA. A potential role for the mast cell in the pathogenesis of idiopathic osteoporosis in men. Bone. 2002;31:556–61. doi: 10.1016/s8756-3282(02)00875-x. [DOI] [PubMed] [Google Scholar]
- 59.Chiappetta N, Gruber B. The role of mast cells in osteoporosis. Semin Arthritis Rheum. 2006;36:32–6. doi: 10.1016/j.semarthrit.2006.03.004. [DOI] [PubMed] [Google Scholar]
- 60.Kim MS, Chae HJ, Shin TY, Kim HM, Kim HR. Estrogen regulates cytokine release in human mast cells. Immunopharmacol Immunotoxicol. 2001;23:495–504. doi: 10.1081/iph-100108596. [DOI] [PubMed] [Google Scholar]
- 61.Rossini M, Zanotti R, Bonadonna P, Artuso A, Caruso B, Schena D, Vecchiato D, Bonifacio M, Viapiana O, Gatti D, Senna G, Riccio A, Passalacqua G, Pizzolo G, Adami S. Bone mineral density, bone turnover markers and fractures in patients with indolent systemic mastocytosis. Bone. 2011;49:880–5. doi: 10.1016/j.bone.2011.07.004. [DOI] [PubMed] [Google Scholar]
- 62.van der Veer E, van der Goot W, de Monchy JG, Kluin-Nelemans HC, van Doormaal JJ. High prevalence of fractures and osteoporosis in patients with indolent systemic mastocytosis. Allergy. 2012;67:431–8. doi: 10.1111/j.1398-9995.2011.02780.x. [DOI] [PubMed] [Google Scholar]
- 63.Lesclous P, Saffar JL. Mast cells accumulate in rat bone marrow after ovariectomy. Cells Tissues Organs. 1999;164:23–9. doi: 10.1159/000016639. [DOI] [PubMed] [Google Scholar]
- 64.Turner RT, Iwaniec UT, Marley K, Sibonga JD. The role of mast cells in parathyroid bone disease. J Bone Miner Res. 2010;25:1637–49. doi: 10.1002/jbmr.49. [DOI] [PMC free article] [PubMed] [Google Scholar]