

Abstract
Background
Activation of blood coagulation and fibrinolysis may be associated with increased risk of coronary heart disease. We aimed to assess associations of circulating tissue plasminogen activator (t-PA) antigen, D-dimer and von Willebrand factor (VWF) with coronary heart disease risk.
Design
Prospective case-control study, systematic review and meta-analyses.
Methods
Measurements were made in 1925 people who had a first-ever nonfatal myocardial infarction or died of coronary heart disease during follow-up (median 19.4 years) and in 3616 controls nested within the prospective population-based Reykjavik Study.
Results
Age and sex-adjusted odds ratios for coronary heart disease per 1 standard deviation higher baseline level were 1.25 (1.18, 1.33) for t-PA antigen, 1.01 (0.95, 1.07) for D-dimer and 1.11 (1.05, 1.18) for VWF. After additional adjustment for conventional cardiovascular risk factors, corresponding odds ratios were 1.07 (0.99, 1.14) for t-PA antigen, 1.06 (1.00, 1.13) for D-dimer and 1.08 (1.02, 1.15) for VWF. When combined with the results from previous prospective studies in a random-effects meta-analysis, overall adjusted odds ratios were 1.13 (1.06, 1.21) for t-PA antigen (13 studies, 5494 cases), 1.23 (1.16, 1.32) with D-dimer (18 studies, 6799 cases) and 1.16 (1.10, 1.22) with VWF (15 studies, 6556 cases).
Conclusions
Concentrations of t-PA antigen, D-dimer and VWF may be more modestly associated with first-ever CHD events than previously reported. More detailed analysis is required to clarify whether these markers are causal risk factors or simply correlates of coronary heart disease.
Introduction
Because myocardial infarction usually results from occlusive thrombosis of atherosclerotic plaque, it has been proposed that circulating levels of markers that reflect activated coagulation and fibrinolysis may be associated with coronary heart disease (CHD) risk [1], [2]. Three such markers are tissue plasminogen activator (t-PA) antigen, D-dimer and von Willebrand factor (VWF). t-PA is the principal regulator of endogenous fibrinolysis catalyzing the conversion of plasminogen to plasmin [3]. In circulation, however, most of t-PA is bound to its inhibitor PAI-1 (plasminogen activator inhibitor type 1) and this complex can be measured as t-PA antigen [4], with high levels indicating biologically inactive t-PA and hence tendency to clot formation. D-dimer is a marker of activated coagulation and fibrinolysis and its levels reflect active fibrin mesh formation and degradation [5]. VWF is an important cofactor in platelet adhesion and platelet aggregation, key steps in primary hemostasis [6]. Previous studies have suggested significant and moderately strong associations of these markers with CHD risk in essentially general and secondary prevention populations [7]–[9], with perhaps stronger associations for myocardial infarction or fatal CHD than for incident stable angina, consistent with potential roles for activation of coagulation and fibrinolysis in coronary artery thrombosis, rather than atherogenesis [10]. To date, however, the available evidence for t-PA antigen and D-dimer has been limited to studies with only a few hundred CHD cases; insufficient to examine potentially important aspects such as the shape of dose-response relationships and the magnitude of these associations both overall and in clinically relevant subgroups with appropriate power.
To help clarify these uncertainties, we report new data on t-PA antigen and D-dimer involving 5541 participants in a prospective case-control comparison nested within the population-based Reykjavik Study of almost 19,000 middle aged Icelandic men and women monitored for a mean duration of about 20 years (results for VWF are presented here for comparison and have been reported previously [11], [12]). Context for our new data was provided by conducting a systematic review and updated meta-analyses of published reports on t-PA antigen, D-dimer and VWF and incident CHD.
Methods
Study Population
The Reykjavik Study, initiated in 1967, has been described in detail elsewhere [13]. All men born between 1907 and 1934 and all women born between 1908 and 1935 who were registered to live in Reykjavik, Iceland, or its adjacent communities on December 1st 1966 were invited to participate in the study (Figure S1). During five stages of recruitment between 1967 and 1991, a total of 9139 men and 9773 women were enrolled (response rate = 72%). Nurses administered questionnaires, made physical measurements, recorded electrocardiograms and collected fasting venous blood samples for preparation of aliquots of serum, which were stored at –20°C for subsequent analysis. All participants were monitored by central registries for occurrence of major coronary events (based on MONICA criteria [14]) or cause-specific mortality (based on a death certificate with International Classification of Diseases), with a loss to follow-up of only about 0.6% to date. Cause-specific mortality was coded using ICD-9 and ICD-10. CHD deaths were pre-defined as those allocated ICD-9 codes 410–414 and ICD-10 codes I20–I25. We selected 1925 participants who suffered a first-ever non-fatal MI or coronary death between study entry and the censoring date (median duration of follow-up, 19.4 years) and without evidence of cardiovascular disease at baseline, in whom baseline serum was available for measurement of t-PA antigen, D-dimer and VWF. We selected a random subset of 3616 controls from among the participants who had survived to the end of the study period without developing CHD, frequency matched to cases by recruitment year, age (in five-year age bands) and sex. Baseline characteristics of selected controls were broadly comparable to those of the overall Reykjavik cohort (Table S1). The National Bioethics Committee and the Data Protection Authority of Iceland approved the study protocol. All participants gave informed written consent and the study complies with the Declaration of Helsinki.
Laboratory Methods
All measurements were made in serum samples, by laboratory staff unaware of participants’ disease status. Enzyme immunoassays were used to determine levels of t-PA antigen (Biopool AB, Umea, Sweden), D-dimer (Hyphen, Paris, France) and VWF (in-house assay using reagents from DAKO, Copenhagen, Denmark). All intra- and inter-assay coefficients of variation were <5%. Lipid and other biochemical measurements have been described previously [11]–[13].
Statistical Analyses
All analyses were restricted to participants with complete information on t-PA antigen, D-dimer and VWF. Normal distributions were achieved by taking natural logarithms (loge) of positively skewed variables. Odds ratios (ORs) per 1 standard deviation (SD) higher loge t-PA antigen, loge D-dimer and loge VWF were calculated using unconditional logistic regression. The SDs for baseline levels of loge t-PA antigen, loge D-dimer and loge VWF were 0.5, 1.0 and 0.4, corresponding to 1.6-, 2.7- and 1.5-fold differences on the original scale (ie, e 0.5, e 1.0 and e 0.4). To assess the independence of associations from conventional cardiovascular risk factors, ORs were adjusted progressively for age, sex, period of recruitment, smoking, body mass index, history of diabetes, systolic blood pressure, total cholesterol and loge triglycerides. To assess shapes of associations, adjusted ORs were calculated across fifths of the baseline levels of t-PA antigen, D-dimer and VWF in controls and 95% confidence intervals (CIs) were estimated from the floated variances [15]. Subgroup analyses were pre-specified and investigated by formal tests of interaction. Linear regression was used to assess the association between t-PA antigen, D-dimer and VWF and baseline characteristics among controls. To minimize biases resulting from measurement error, we corrected for regression dilution in supplementary analyses. Regression dilution ratios (RDR), as a measure of long-term within-person variability, were calculated for each characteristic by regressing its serial measurements on baseline levels, adjusted for potential confounding factors [16]. Based on these regression models, predictions of long-term average levels (“usual levels”) of t-PA antigen, D-dimer and VWF for each participant were then used to estimate ORs corrected for within-person variability, as described previously [16]. An updated meta-analysis was conducted of prospective studies, published before October 19th 2012, with more than one year of follow-up in essentially general populations (ie, in cohorts not selected on the basis of pre-existing disease) ( Figure 1 , Methods S1, Figure S2 and Table S2). To enable comparability between study reports, risk estimates and 95% CIs were transformed to a common scale (ie, per 1 SD higher levels of the population’s baseline distribution of the respective marker) using methods previously described [11]. Study-specific risk estimates were pooled by random-effects meta-analyses. Odds and hazard ratios were assumed to approximate the same underlying measure of relative risk (RR). Consistency of findings across studies was assessed with standard χ 2 tests and the I 2 statistic [17]. Subgroup analyses were conducted using meta-regression across pre-specified study-level characteristics [18]. Evidence of publication bias was assessed with funnel plots, Egger’s test [19], and by comparing pooled results from studies involving at least 500 CHD cases with pooled results from smaller studies. All analyses were performed using Stata release 12.1 (StataCorp, College Station, Texas). Statistical tests were two-sided and used a significance level of P<0.05.
Figure 1. Study flow diagram of the updated meta-analyses.
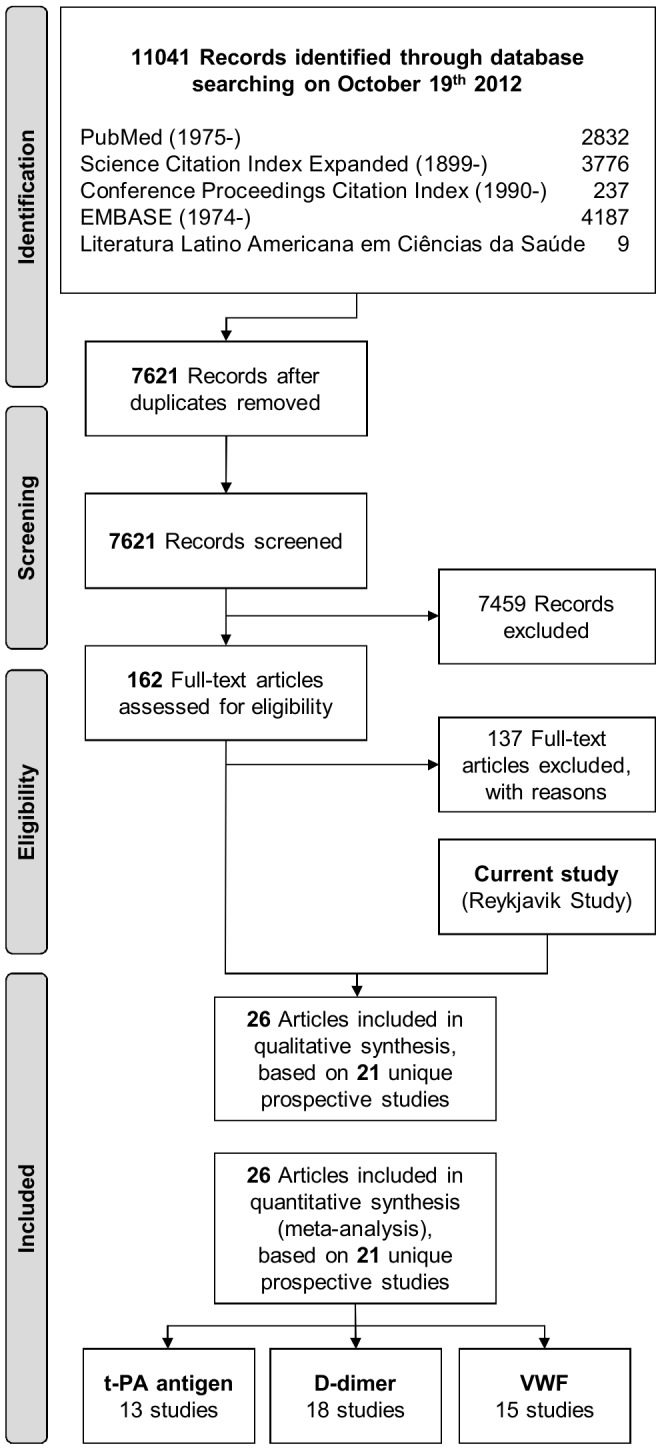
The figure was designed based on the 2009 PRISMA flow diagram template (available from http://www.prisma-statement.org/statement.htm).
Results
Baseline Characteristics and Cross-sectional Associations in the Reykjavik Study
In addition to significant differences between cases and controls with respect to conventional risk factors in the Reykjavik Study, baseline concentrations of t-PA antigen and VWF were significantly higher in cases than in controls, while there were no significant differences in D-dimer concentration ( Table 1 ). Baseline levels of t-PA antigen, D-dimer and VWF were significantly correlated with each other, with t-PA antigen and D-dimer being inversely associated ( Table 1 and Figures S3 to S5). All three markers were positively associated with age, smoking and inflammatory markers. Male sex and baseline measurements of body mass index, blood pressure, total cholesterol, loge triglycerides, hematocrit, hemoglobin and loge erythrocyte sedimentation rate showed positive correlations with levels of t-PA antigen, but negative correlations with D-dimer. In comparison, age- and sex-adjusted cross-sectional correlations of VWF were generally weaker.
Table 1. Baseline characteristics of coronary heart disease cases and matched controls in the Reykjavik Study, and correlations with t-PA antigen, D-dimer and VWF.
| Variable | Summary of baseline values | Cross-sectional correlation with hemostatic markers | ||||||
| Cases | Controls | P value | Adjusted percentage difference (95% CI)† | |||||
| n | Mean (SD), median (IQR),or n (%) | n | Mean (SD), median (IQR),or n (%) | t-PA antigen | D-dimer | VWF | ||
| Questionnaire-based | ||||||||
| Age, years | 1925 | 54.2 (8.7) | 3616 | 55.2 (9.0) | Matched | 8% (6 to 11) | 24% (19 to 29) | 9% (7 to 11) |
| Male sex | 1925 | 1347 (70%) | 3616 | 2441 (68%) | Matched | 23% (19 to 27) | −28% (−33 to −23) | 3% (1 to 6) |
| Current smoker | 1925 | 1153 (60%) | 3616 | 1751 (48%) | <0.0001 | 4% (1 to 7) | 7% (0 to 14) | 5% (3 to 8) |
| History of diabetes | 1925 | 51 (3%) | 3616 | 58 (2%) | 0.011 | −3% (−15 to 10) | −10% (−30 to 15) | 6% (−5 to 17) |
| Physical measurements | ||||||||
| Body mass index, kg/m2 | 1925 | 26.0 (3.9) | 3616 | 25.4 (3.7) | <0.0001 | 20% (18 to 21) | −16% (−18 to −13) | 1% (0 to 2) |
| Systolic blood pressure, mmHg | 1925 | 146.7 (21.7) | 3616 | 141.9 (20.1) | <0.0001 | 11% (9 to 13) | −6% (−9 to −3) | 1% (0 to 3) |
| Diastolic blood pressure, mmHg | 1924 | 90.2 (11.0) | 3615 | 87.5 (10.8) | <0.0001 | 13% (12 to 15) | −8% (−11 to −5) | 1% (−1 to 2) |
| Lipid markers | ||||||||
| Total cholesterol, mmol/L | 1925 | 6.9 (1.2) | 3616 | 6.4 (1.1) | <0.0001 | 7% (5 to 9) | −5% (−8 to −2) | 0% (−1 to 1) |
| Triglycerides, mmol/L* | 1925 | 1.1 (0.9−1.5) | 3616 | 1.0 (0.8−1.4) | <0.0001 | 21% (19 to 23) | −14% (−17 to −11) | 2% (0 to 3) |
| Lipoprotein(a), mg/L* | 1917 | 115 (39−283) | 3612 | 82 (25−199) | <0.0001 | −3% (−5 to −2) | 1% (−2 to 4) | 0% (−1 to 1) |
| Inflammatory markers | ||||||||
| Interleukin 6, ng/L* | 1658 | 2.1 (1.4–3.4) | 3060 | 1.9 (1.2–2.9) | <0.0001 | 5% (4 to 7) | 13% (9 to 17) | 5% (4 to 6) |
| C-reactive protein, mg/L* | 1906 | 1.7 (0.8–3.5) | 3573 | 1.2 (0.6–2.7) | <0.0001 | 13% (11 to 14) | 6% (3 to 9) | 8% (7 to 9) |
| Rheological markers | ||||||||
| Hematocrit, % | 1925 | 44.7 (4.7) | 3616 | 44.1 (4.5) | <0.0001 | 10% (9 to 12) | −8% (−12 to −5) | 0% (−2 to 1) |
| Hemoglobin, g/L | 1917 | 148.3 (13.1) | 3599 | 145.9 (13.1) | <0.0001 | 16% (14 to 18) | −14% (−17 to −11) | 1% (−1 to 2) |
| ESR, mm/hr* | 1838 | 8.0 (4.0–15.0) | 3427 | 7.0 (3.0–13.0.) | <0.0001 | 3% (1 to 5) | 16% (12 to 20) | 9% (7 to 10) |
| Hemostatic markers | ||||||||
| t-PA antigen, ng/mL* | 1925 | 13.9 (9.9–18.8) | 3616 | 12.6 (8.8–17.2) | <0.0001 | – | −15% (−18 to −12) | 6% (5 to 8) |
| D-dimer, ng/mL* | 1925 | 115 (60–246) | 3616 | 121 (64–241) | 0.280 | −8% (−10 to −7) | – | 7% (6 to 8) |
| VWF, IU/dL* | 1925 | 107 (81–141) | 3616 | 106 (78–136) | 0.008 | 7% (6 to 9) | 17% (14 to 21) | – |
| Others | ||||||||
| Serum creatinine (µmol/L) | 1907 | 77 (20) | 3587 | 75 (13) | <0.001 | 7% (5 to 9) | 0% (−4 to 3) | 3% (1 to 5) |
Abbreviations: ESR, erythrocyte sedimentation rate; IQR, inter-quartile range.
Means (SDs) of loge transformed values in cases and controls were 0.2 (0.5) and 0.0 (0.4) for triglycerides; 4.4 (1.6) and 4.0 (1.7) for lipoprotein (a); 0.8 (0.8) and 0.7 (0.8) for interleukin 6; 0.5 (1.1) and 0.2 (1.1) for C-reactive protein; 2.0 (1.0) and 1.9 (1.0) for erythrocyte sedimentation rate; 2.6 (0.5) and 2.5 (0.5) for t-PA antigen; 4.8 (1.0) and 4.8 (1.0) for D-dimer; and 4.7 (0.4) and 4.6 (0.4) for VWF.
Percentage differences and 95% CIs were calculated per 1 SD higher level or compared to the reference category of variables shown in the left column (adjusted for age, sex and period of recruitment).
Associations with Incident CHD in the Reykjavik Study
After adjustment for age, sex and period of recruitment, baseline levels of t-PA antigen were apparently log-linearly related to CHD risk ( Figure 2 ), yielding an OR of 1.25 (1.18, 1.33) per 1 SD higher level ( Table 2 ). This OR fell to 1.07 (0.99, 1.14) after further adjustment for several non-lipid and lipid risk factors. VWF was also log-linearly associated with CHD risk (OR = 1.11 [1.05, 1.18] minimally adjusted; 1.08 [1.02, 1.15] further adjusted). However, there was no evidence of a significant association between baseline levels of D-dimer and CHD risk (OR = 1.01 [0.95, 1.07] minimally adjusted; 1.06 [1.00, 1.13] further adjusted). In a head-to-head comparison, t-PA antigen, D-dimer and VWF were more weakly associated with incident CHD than several established and emerging markers ( Figure 3 ). ORs did not vary substantially when further adjustment was made for C-reactive protein ( Table 2 ). Apart from a possibly weaker association of t-PA antigen in current smokers compared with non-smokers (P = 0.003), ORs for CHD did not vary in clinically relevant subgroups defined by diabetes status, lipids, obesity, or other individual-level characteristics (Figure S6).
Figure 2. Associations of baseline t-PA antigen, D-dimer and VWF with coronary heart disease risk (Reykjavik Study).

Odds ratios (95% CI) for coronary heart disease are shown by fifths of baseline t-PA antigen, D-dimer and VWF, plotted against the geometric mean level in each category on a log-doubling scale. *Adjusted for age, sex, period of recruitment, smoking status, body mass index, systolic blood pressure, history of diabetes, total cholesterol and loge triglycerides.
Table 2. Association of baseline levels of t-PA antigen, D-dimer and VWF with coronary heart disease in the Reykjavik Study (1925 cases, 3616 controls).
| Adjustment | Odds ratios for coronary heart disease (95% CI) per 1 SD higher level | ||
| t-PA antigen | D-dimer | VWF | |
| Adjusted for age, sex and period of recruitment | 1.25 (1.18, 1.33) | 1.01 (0.95, 1.07) | 1.11 (1.05, 1.18) |
| + non-lipid risk factors* | 1.14 (1.07, 1.22) | 1.04 (0.98, 1.10) | 1.08 (1.02, 1.15) |
| + lipid risk factors† | 1.07 (0.99, 1.14) | 1.06 (1.00, 1.13) | 1.08 (1.02, 1.15) |
Smoking status, body mass index, systolic blood pressure and any history of diabetes mellitus at baseline.
Total cholesterol and loge triglycerides.
When analyses were restricted to participants with complete information on C-reactive protein (1906 cases, 3573 controls), the odds ratios (95% CI) per 1 SD higher value of t-PA antigen were 1.26 (1.18, 1.33) when adjusting for age, sex and period of recruitment, 1.15 (1.07, 1.22) when additionally adjusting for non-lipid risk factors, 1.07 (0.99, 1.14) when additionally adjusting for lipid risk factors and 1.04 (0.97, 1.11) when additionally adjusting for C-reactive protein. Corresponding odds ratios were 1.01 (0.95, 1.07), 1.04 (0.98, 1.11), 1.07 (1.00, 1.14) and 1.05 (0.99, 1.12) for D-dimer and 1.12 (1.05, 1.18), 1.09 (1.02, 1.15), 1.09 (1.03, 1.16) and 1.06 (1.00, 1.13) for VWF.
Figure 3. Head-to-head comparison of associations of various baseline variables with coronary heart disease risk (Reykjavik Study).

*Values were loge transformed for analysis. †Adjusted for age, sex, period of recruitment, smoking status, body mass index, systolic blood pressure, history of diabetes, total cholesterol and loge triglycerides.
Correction for Long-term within-person Variability
In up to 371 participants who provided paired measurements at baseline and a mean (SD) of 11.6 (1.3) years later, age- and sex-adjusted RDRs were 0.47 (95% CI 0.38, 0.56) for t-PA antigen, 0.30 (0.22, 0.38) for D-dimer and 0.55 (0.47, 0.63) for VWF (Table S3). The within-person variability over 11.6 years in the current study was somewhat greater than reported in previous studies with measurements taken 5 or fewer years apart (p≤0.007 for trend with time, Figure S7). After correction for within-person variability in levels of the exposures, the ORs per 1 SD higher level were 1.15 (1.01, 1.32) for t-PA antigen, 1.11 (0.99, 1.25) for D-dimer 1.10 (1.03, 1.19) for VWF.
Systematic Review and Updated Meta-analyses
Together with the current study, 21 relevant published prospective studies were identified (13 with t-PA antigen, 18 with D-dimer and 15 with VWF measurement) [7]–[10], [20]–[40]. Study characteristics and references are provided in Table 3 . All but one were based in the United States or Europe. Most identified participants in population registers or in occupational settings and reported on incident MI or CHD death outcomes (mean follow-up ranged from about 2.4 to 19.4 years). Measurements generally involved enzymatic immunoassays, performed in plasma (17 studies) or serum (4 studies), thawed after long-term storage at −20°C (4 studies), −40°C (1 study), −70 or −80°C (14 studies) or in liquid nitrogen (2 studies). Reported levels of t-PA antigen and VWF were consistent across studies, while levels of D-dimer varied substantially (ranging from around 10 to over 600 IU/dL). A combined analysis of available data yielded adjusted RRs of 1.13 (1.06, 1.21), 1.23 (1.16, 1.32) and 1.16 (1.10, 1.22) per 1 SD higher baseline levels of t-PA antigen (5494 CHD cases), D-dimer (6799 CHD cases) and VWF (6556 CHD cases), respectively ( Figure 4 ). There was some evidence of heterogeneity in RRs, but little of it was explained by recorded study-level characteristics (Figure S9). There was some evidence that smaller studies of D-dimer reported more striking findings (Egger’s test, P = 0.004; Figure S10), but this trend was not apparent when results from studies with 500 CHD cases or more were compared with those from smaller studies in the pre-specified subgroup analyses (Figure S9).
Table 3. Characteristics of 21 published prospective studies of t-PA antigen, D-dimer and VWF.
| Blood sample | Assay manufacturer | Mean level | ||||||||||||||||
| Study [Reference] | Location | Population source | Year of baseline | Age range at baseline | Male, % | Mean follow-up, years | Endpoint definition | Fasted | Specimen type | Storage temp | No. of cases | No. of controls | t-PA antigen | D-Dimer | VWF | t-PA antigen, ng/mL | D-Dimer, ng/mL | VWF, IU/dL or % |
| Current study | ||||||||||||||||||
| Reykjavik | Iceland | Population register | 1969–96 | 33–86 | 70 | 19.4† | CHD | Yes | Serum | −20 | 1925 | 3616 | Biopool | Hyphen | Dako | 13.7 | 198 | 112 |
| Previously published | ||||||||||||||||||
| ARIC [20] | USA | Household listings | 1987–89 | 45–64 | 43 | 4.3 | CHD, CS | Yes | Plasma | −70 | 326 | 692 | Diagnostica | Diagnostica | 7.6|| | 303|| | ||
| ARIC [21] | USA | Household listings | 1987–89 | 45–64 | 43 | 12.4 | Nonfatal MI | Yes | Plasma | −70 | 737 | 13272 | AmB | NR | ||||
| BRHS* [9] | UK | GP lists | 1978–80 | 40–59 | 100 | 18‡ | CHD | No | Serum | −20 | 606 | 1227 | Biopool | 10.4|| | ||||
| BRHS* [7] | UK | GP lists | 1978–80 | 40–59 | 100 | 18‡ | CHD | No | Serum | −20 | 630 | 1269 | AGEN | 130 | ||||
| BRHS* [8] | UK | GP lists | 1978–80 | 40–59 | 100 | 18‡ | CHD | No | Serum | −20 | 625 | 1266 | Dako | 113 | ||||
| BRHS* [10] | UK | GP lists | 1998–00 | 60–79 | 100 | 7 | CHD | Yes | Plasma | −70 | 198 | 2809 | Biopool | Biopool | Dako | 10.8 | 80 | 137 |
| BWHHS [22] | UK | Population register | 1999–01 | 60–79 | 0 | 4.7† | CHD, CS, AP | Yes | Plasma | −80 | 198 | 3384 | Biopool | Biopool | Dako | 7.9|| | 88|| | 139|| |
| Caerphilly [23] | UK | Electoral rolls | 1984–88 | 49–65 | 100 | 13.4† | CHD | Yes | Plasma | −70 | 316 | 1665 | Biopool | Dako | 10.9|| | 113|| | ||
| Caerphilly [23] | UK | Electoral rolls | 1984–88 | 49–65 | 100 | 13.4† | CHD | Yes | Plasma | −70 | 310 | 1621 | AGEN | 12|| | ||||
| CHS [24] | USA | Medicare lists | 1989–90 | 65+ | 61 | 2.4 | CHD | Yes | Plasma | −70 | 70 | 70 | In-house | NR | ||||
| EAS [25] | UK | GP lists | 1988 | 55–74 | 53 | 17 | CHD | Yes | Plasma | −40 | 248 | 1177 | Biopool | AGEN | Dako | 7.0† | 80† | 105† |
| Fletcher [26] | NZ | Occupational/electoral | 1992–94 | 19–86 | 72 | 5.5† | CHD | No | Plasma | −70 | 194 | 399 | Hyphen | Dako | 4.7 | 127 | ||
| Fletcher [26] | NZ | Occupational/electoral | 1992–94 | 19–86 | 72 | 5.5† | CHD | No | Plasma | −70 | 190 | 387 | R&D Sys | 253 | ||||
| Glostrup [27] | Denmark | Population register | 1976–84 | 30–60 | 73 | 7–15§ | CHD | Yes | Serum | −20 | 133 | 258 | Biopool | 7.8 | ||||
| MESA [28] | USA | General population | 2000–02 | 45–84 | 47 | 4.6† | CHD | Yes | Plasma | −70 | 207 | 6184 | DStago | 205† | ||||
| NPHS-I [29] | UK | Occupational register | 1978–84 | 40–64 | 100 | 10.1 | CHD | Yes | Serum | −196 | 84 | 933 | In-house | 77% | ||||
| NSHDS [30] | Sweden | General population | 1985–99 | 25–74 | 79 | 14 | CHD | Yes | Plasma | −80 | 467 | 893 | Biopool | 8.0 | ||||
| NSHDS [30] | Sweden | General population | 1985–99 | 25–74 | 79 | 14 | CHD | Yes | Plasma | −80 | 458 | 882 | Hyphen | 174 | ||||
| NSHDS [30] | Sweden | General population | 1985–99 | 25–74 | 79 | 14 | CHD | Yes | Plasma | −80 | 469 | 895 | Dako | 141 | ||||
| PHS [31] | USA | Occupational register | 1982–84 | 40–84 | 100 | 5 | CHD | No | Plasma | −80 | 231 | 231 | Biopool | 9.2 | ||||
| PHS [32] | USA | Occupational register | 1982–84 | 40–84 | 100 | 5 | CHD | No | Plasma | −80 | 296 | 296 | Biopool | 49 | ||||
| PRIME [33] | France/NI | General population | 1991–93 | 50−59 | 100 | 5‡ | CHD | Yes | Plasma | –196 | 162 | 324 | DStago | DStago | 255† | 114† | ||
| PROSPER [34] | SCO/IRE/NL | Primary care screening | 1998 | 70–82 | 48 | 3.2 | CHD | Yes | Plasma | −80 | 372 | 2750 | Hyphen | 11.0 | ||||
| PROSPER [34] | SCO/IRE/NL | Primary care screening | 1998 | 70–82 | 48 | 3.2 | CHD | Yes | Plasma | −80 | 373 | 2806 | Hyphen | 270 | ||||
| PROSPER [34] | SCO/IRE/NL | Primary care screening | 1998 | 70–82 | 48 | 3.2 | CHD | Yes | Plasma | −80 | 369 | 2739 | Dako | 139 | ||||
| Rotterdam [35] | NL | Population register | 1989–93 | 55+ | 39.8 | 6.4 | CHD, CS | Yes | Plasma | −80 | 473 | 5328 | Dako | 130 | ||||
| Speedwell [36] | UK | GP list | 1982–85 | 49–67 | 100 | 6.25 | CHD | No | Plasma | −20 | 165 | 1554 | Biopool | 41|| | ||||
| Three-City [37] | France | Electoral rolls | 1999–01 | 65+ | 39.5 | 4‡ | CHD, CS, AP | Yes | Plasma | −80 | 199 | 1053 | DStago | DStago | 576|| | 130%|| | ||
| WHI [38] | USA | Population register | 1993–98 | 50–79 | 0 | 2.9 | CHD | Yes | Plasma | −70 | 280 | 280 | AmD | 7.4† | ||||
| WHI [39] | USA | Population register | 1993–98 | 50–79 | 0 | 4‡ | CHD | Yes | Plasma | −70 | 359 | 820 | AmD | AmD | 300† | 93%† | ||
| WOSCOPS [40] | UK | Heart screening clinic | 1989–91 | 45–64 | 100 | 6‡ | CHD, CS | Yes | Plasma | −70 | 485 | 934 | Biopool | 60 | ||||
Abbreviations: AmB, American Bioproducts; AmD, American Diagnostica; AP, angina pectoris; ARIC, Atherosclerosis Risk in Communities Study; BRHS, British Regional Heart Study; BWHHS, British Women’s Heart and Health Study; Caerphilly, Caerphilly Prospective Study; CHD, coronary heart disease endpoint (composed of nonfatal myocardial infarction and coronary death); CHS, Cardiovascular Health Study; CS, coronary surgery; DStago, Diagnostica Stago; EAS, Edinburgh Artery Study; ELISA, enzyme-linked immunosorbent assay; FHS, Framingham Heart Study; Fletcher, Fletcher Challenge Study; Glostrup, Glostrup population studies; IRE, Ireland; IT, immunoturbidometry; MESA, Multi-Ethnic Study of Atherosclerosis; MI, myocardial infarction; NPHS-I, Northwick Park Heart Study I; NSHDS, Northern Sweden Health and Diseases Study cohort; PHS, Physicians’ Health Study; PRIME, Prospective Epidemiological Study of Myocardial Infarction; PROSPER, Prospective Study of Pravastatin in the Elderly at Risk; NI, Northern Ireland; NL, Netherlands; NR, not reported; NZ, New Zealand; R&D Sys, R&S Systems; RE, rocket electrophoresis; Rotterdam, Rotterdam Study; SCO, Scotland; Speedwell, Speedwell Study; Three-City, Three-City cohort study; WHI, Women’s Health Initiative; WOSCOPS, The West of Scotland Coronary Prevention Study.
Reports with two different study baselines and non-overlapping follow-up periods are available.
Median.
Maximum.
Range.
Geometric mean.
Figure 4. Meta-analyses of reported associations of t-PA antigen, D-dimer and VWF with coronary heart disease risk in prospective population-based studies.

Study acronyms are explained in the legend of Table 3 . Summary estimates were calculated using random effects models. *Degree of adjustment:+minimally adjusted (typically adjusted for age and sex only);++plus adjustment for at least one non-lipid marker;+++plus adjustment for at least one lipid marker;++++plus adjustment for at least one inflammatory marker. Where studies reported relative risks with more than one level of statistical adjustment, the most adjusted estimate was used (least adjusted estimates are reported in Figure S8).
Discussion
In the Reykjavik Study, the largest population-based study of t-PA antigen, D-dimer and VWF to date, we observed at most weak associations of these markers with the risk of CHD, when adjusting for a panel of conventional cardiovascular risk factors. However, in the context of the updated meta-analyses that involved up to ten times as much data as previously reported [7]–[9], higher levels of t-PA antigen, D-dimer and VWF at baseline were compatible with modest increases in risk. As suggested by previous reports, while t-PA antigen was positive associated with various risk factors, including male sex, blood pressure, body mass index, triglycerides, inflammatory markers and rheological markers [9], [20], D-dimer was inversely associated with these risk factors and also inversely associated with t-PA antigen levels [7]. This inverse association could arise because t-PA antigen levels largely reflect circulating t-PA/PAI-1 complexes, and higher PAI-1 levels reduce endogenous fibrinolysis and hence D-dimer levels. Finally, baseline VWF levels were largely independent from other cardiovascular risk factors (with weak correlations with C-reactive protein and smoking status).
Although the combined estimates from the current study and previous reports were compatible with modest increases in risk, the relationships of these three markers with CHD risk remain uncertain, as evidenced by: the comparatively wide confidence intervals around the pooled RRs; a tendency for more extreme associations in smaller studies suggesting the likelihood of some exaggeration in the overall estimates; and most importantly, potential residual confounding, as the meta-analyses pooled associations adjusted for baseline levels of confounders only [41]. The associations of t-PA antigen, D-dimer and VWF with first-ever MI or CHD death may therefore be more modest than previously reported, but the current findings do not, of course, preclude stronger associations in high-risk populations [42], [43] or with different vascular outcomes [44], [45].
To help clarify whether activated coagulation and fibrinolysis play an etiological role in the development of CHD, future investigations should involve complementary approaches to help judge causality, such as study of potential interrelations with ABO(H) blood groups [46], [47]; investigation of more direct markers such as t-PA activity or VWF multimer patterns [6]; and mendelian randomization studies using genetic variants as potentially unconfounded proxies for circulating levels of these markers [48]–[51]. In particular, VWF levels may be a plausible mediator of the association of non-O blood groups with CHD and other thrombotic disorders [52].
Furthermore, the within-person variability of these hemostatic markers is greater than previously reported and highlights the importance of correction for variability in long-term prospective studies and the potential advantages of identifying genetic variants as proxies for these error-prone biomarkers [53]. While literature-based data indicate a declining self-correlation over time, suggesting that single “snapshot” baseline measurements do not perfectly capture long-term “usual” levels, the magnitude of this remains to be determined in detail. Information on the repeatability of such measurements over time is currently available on only around 2000 individuals in aggregate and is based predominantly on summary findings from published reports and not individual data.
The strengths and limitations of the current report merit careful consideration. Our new data from the Reykjavik Study involve more than three times as many cases of first-ever CHD as in the previous largest reports [7]–[9]. Participants were identified in population registers, had high response and follow-up rates, used robust methods to ascertain CHD outcomes and minimized potential biases by exclusion of participants with prevalent cardiovascular disease. Concomitant measurements of several factors enabled direct comparisons with different markers and allowed adjustment for a range of possible confounders, although we acknowledge that data on some biological factors was lacking [54], [55]. Repeat measurements several years apart enabled assessment of and allowance for long-term within-person variability, but no data were available to account for short-term variability, such as diurnal or seasonal fluctuations [53], [56]. Although the current study involved blood storage at −20°C for a median time of 29 years (range 4 to 33 years), the distributions of t-PA antigen, D-dimer and VWF were broadly in keeping with those reported previously, as exemplified by the WHO-MONICA optional Haemostasis Study of 11 centers across Europe that also included Iceland [57]. Furthermore, the generally similar correlations at baseline with cardiovascular risk factors in this and other studies, plus the lack of any significant heterogeneity in associations with CHD risk across studies with different lengths of follow-up or sample storage conditions in the updated meta-analyses, argues against sample degradation as an explanation for our findings. Finally, although the updated meta-analyses included in our report represent the most comprehensive synthesis of the available data to date, they rely on published reports only. Access to individual participant data would permit more consistent comparisons across studies (such as in the outcomes, covariates and subgroups considered).
Conclusions
Concentrations of t-PA antigen, D-dimer and VWF may be more modestly associated with first-ever CHD events than previously reported. More detailed analysis is required to clarify whether these markers are causal risk factors or simply correlates of coronary heart disease.
Supporting Information
Flow-chart of the Reykjavik Study.
(PDF)
Search strategy used in the updated meta-analyses.
(PDF)
Cross-sectional correlates of baseline levels of t-PA antigen.
(PDF)
Cross-sectional correlates of baseline levels of D-dimer.
(PDF)
Cross-sectional correlates of baseline levels of VWF.
(PDF)
Explorative analysis of effect modification of the associations of baseline levels of t-PA antigen, D-dimer and VWF with coronary heart disease risk in the Reykjavik study. Continuous variables were categorized based on tertile cut-offs in controls. All models are adjusted for age, sex, period of recruitment, smoking status, body mass index, systolic blood pressure, history of diabetes at baseline, total cholesterol, and loge triglycerides. *P values were calculated using likelihood ratio tests comparing models with and without interaction terms.
(PDF)
Estimated within-person variability of t-PA antigen, D-dimer and VWF by time since baseline measurement in the published literature. Abbreviations: ARIC, Atherosclerosis Risk in Communities Study; BRHS, British Regional Heart Study; EAS, Edinburgh Artery Study; Fletcher, Fletcher Challenge Study; Reykjavik, Reykjavik Study. Each point represents unadjusted study- and time-specific estimates of within-person variability (eg, reported correlation coefficients or regression dilution ratios) in paired samples taken some time apart. Grey boxes represent unadjusted estimates. The relative sizes of the boxes are proportional to the inverse of the standard errors.
(PDF)
Meta-analyses of reported associations of t-PA antigen, D-dimer and VWF with coronary heart disease risk in population-based prospective studies. Where studies reported more than one odds ratio, the least adjusted estimate was used. Study acronyms are explained in the legend of Table 3. Summary estimates were calculated using random effects models. *Degree of adjustment:+minimally adjusted (typically adjusted for age and sex only);++plus adjustment for at least one non-lipid marker;+++plus adjustment for at least one lipid marker;++++plus adjustment for at least one inflammatory marker. Where studies reported relative risks with more than one level of statistical adjustment, the least adjusted estimate was used (most adjusted estimates are reported in Figure 4).
(PDF)
Investigation of sources of possible heterogeneity in reported associations of t-PA antigen, D-dimer and VWF with coronary heart disease risk, according to various study-level characteristics. Summary estimates were calculated using random effects models. *P values are from meta-regression for differences in odds ratios across studies in different groups.
(PDF)
Funnel plots of reported associations of t-PA antigen, D-dimer and VWF with coronary heart disease risk. The dotted lines show 95% confidence intervals around the overall summary estimate calculated using fixed effect models. Egger’s test for regression asymmetry: t-PA antigen, P = 0.086; D-dimer, P = 0.004; VWF, P = 0.290.
(PDF)
Comparison of baseline characteristics of coronary heart disease cases, randomly selected controls and the overall Reykjavik cohort. *Controls were matched to coronary heart disease cases by sex and age (in five-year age bands) and therefore differ from the remainder of the Reykjavik cohort.
(PDF)
PRISMA 2009 Checklist. From: Moher D, Liberati A, Tetzlaff J, Altman DG, The PRISMA Group (2009). Preferred Reporting Items for Systematic Reviews and Meta-Analyses: The PRISMA Statement. PLoS Med 6(6): e1000097. doi:10.1371/journal.pmed1000097. For more information, visit: www.prisma-statement.org.
(PDF)
Within-person variability of t-PA antigen, D-dimer and VWF plus other measured markers (mean time between repeated measurements, 11.6 years).
(PDF)
Systematic review and updated meta-analysis.
(PDF)
Funding Statement
This study was underpinned by a program grant from the British Heart Foundation (RG/08/014) and an unrestricted educational grant from GlaxoSmithKline. PW was supported by a British Heart Foundation 3-year PhD Studentship (FS/10/37/28413). The funders had no role in study design, data collection and analysis, decision to publish or preparation of the manuscript.
References
- 1. Borissoff JI, Spronk HMH, ten Cate H (2011) The hemostatic system as a modulator of atherosclerosis. N Engl J Med 364: 1746–1760. [DOI] [PubMed] [Google Scholar]
- 2. Lowe GDO (2006) Can haematological tests predict cardiovascular risk? The 2005 Kettle Lecture. Br J Haematol 133: 232–250. [DOI] [PubMed] [Google Scholar]
- 3. Plow EF, Felez J, Miles LA (1991) Cellular regulation of fibrinolysis. Thromb Haemost 66: 32–36. [PubMed] [Google Scholar]
- 4. Nordenhem A, Wiman B (1998) Tissue plasminogen activator (tPA) antigen in plasma: correlation with different tPA/inhibitor complexes. Scand J Clin Lab Invest 58: 475–483. [DOI] [PubMed] [Google Scholar]
- 5. Lip GY, Lowe GD (1995) Fibrin D-dimer: a useful clinical marker of thrombogenesis? Clin Sci (Lond) 89: 205–214. [DOI] [PubMed] [Google Scholar]
- 6. Vischer UM (2006) von Willebrand factor, endothelial dysfunction, and cardiovascular disease. J Thromb Haemost 4: 1186–1193. [DOI] [PubMed] [Google Scholar]
- 7. Danesh J, Whincup P, Walker M, Lennon L, Thomson A, et al. (2001) Fibrin D-dimer and coronary heart disease: prospective study and meta-analysis. Circulation 103: 2323–2327. [DOI] [PubMed] [Google Scholar]
- 8. Whincup PH, Danesh J, Walker M, Lennon L, Thomson A, et al. (2002) von Willebrand factor and coronary heart disease: prospective study and meta-analysis. Eur Heart J 23: 1764–1770. [DOI] [PubMed] [Google Scholar]
- 9. Lowe GDO, Danesh J, Lewington S, Walker M, Lennon L, et al. (2004) Tissue plasminogen activator antigen and coronary heart disease. Prospective study and meta-analysis. Eur Heart J 25: 252–259. [DOI] [PubMed] [Google Scholar]
- 10. Wannamethee SG, Whincup PH, Shaper AG, Rumley A, Lennon L, et al. (2009) Circulating inflammatory and hemostatic biomarkers are associated with risk of myocardial infarction and coronary death, but not angina pectoris, in older men. J Thromb Haemost 7: 1605–1611. [DOI] [PMC free article] [PubMed] [Google Scholar]
- 11. Danesh J, Wheeler JG, Hirschfield GM, Eda S, Eiriksdottir G, et al. (2004) C-reactive protein and other circulating markers of inflammation in the prediction of coronary heart disease. N Engl J Med 350: 1387–1397. [DOI] [PubMed] [Google Scholar]
- 12. Danesh J, Kaptoge S, Mann AG, Sarwar N, Wood A, et al. (2008) Long-term interleukin-6 levels and subsequent risk of coronary heart disease: two new prospective studies and a systematic review. PLoS Med 5: e78. [DOI] [PMC free article] [PubMed] [Google Scholar]
- 13. Jónsdóttir LS, Sigfússon N, Gudnason V, Sigvaldason H, Thorgeirsson G (2002) Do lipids, blood pressure, diabetes, and smoking confer equal risk of myocardial infarction in women as in men? The Reykjavik Study. J Cardiovasc Risk 9: 67–76. [PubMed] [Google Scholar]
- 14. Tunstall-Pedoe H, Kuulasmaa K, Amouyel P, Arveiler D, Rajakangas AM, et al. (1994) Myocardial infarction and coronary deaths in the World Health Organization MONICA Project. Registration procedures, event rates, and case-fatality rates in 38 populations from 21 countries in four continents. Circulation 90: 583–612. [DOI] [PubMed] [Google Scholar]
- 15. Plummer M (2004) Improved estimates of floating absolute risk. Stat Med 23: 93–104. [DOI] [PubMed] [Google Scholar]
- 16. Fibrinogen Studies Collaboration (2009) Correcting for multivariate measurement error by regression calibration in meta-analyses of epidemiological studies. Stat Med 28: 1067–1092. [DOI] [PMC free article] [PubMed] [Google Scholar]
- 17. Higgins JPT, Thompson SG, Deeks JJ, Altman DG (2003) Measuring inconsistency in meta-analyses. BMJ 327: 557–560. [DOI] [PMC free article] [PubMed] [Google Scholar]
- 18. Thompson SG, Sharp SJ (1999) Explaining heterogeneity in meta-analysis: a comparison of methods. Stat Med 18: 2693–2708. [DOI] [PubMed] [Google Scholar]
- 19. Egger M, Smith GD, Schneider M, Minder C (1997) Bias in meta-analysis detected by a simple, graphical test. BMJ 315: 629–634. [DOI] [PMC free article] [PubMed] [Google Scholar]
- 20. Folsom AR, Aleksic N, Park E, Salomaa V, Juneja H, et al. (2001) Prospective study of fibrinolytic factors and incident coronary heart disease: the Atherosclerosis Risk in Communities (ARIC) Study. Arterioscler Thromb Vasc Biol 21: 611–617. [DOI] [PubMed] [Google Scholar]
- 21. Kucharska-Newton AM, Couper DJ, Pankow JS, Prineas RJ, Rea TD, et al. (2009) Hemostasis, inflammation, and fatal and nonfatal coronary heart disease: long-term follow-up of the atherosclerosis risk in communities (ARIC) cohort. Arterioscler Thromb Vasc Biol 29: 2182–2190. [DOI] [PMC free article] [PubMed] [Google Scholar]
- 22. May M, Lawlor DA, Patel R, Rumley A, Lowe G, et al. (2007) Associations of von Willebrand factor, fibrin D-dimer and tissue plasminogen activator with incident coronary heart disease: British Women’s Heart and Health cohort study. Eur J Cardiovasc Prev Rehabil 14: 638–645. [DOI] [PubMed] [Google Scholar]
- 23. Smith A, Patterson C, Yarnell J, Rumley A, Ben-Shlomo Y, et al. (2005) Which hemostatic markers add to the predictive value of conventional risk factors for coronary heart disease and ischemic stroke? The Caerphilly Study. Circulation 112: 3080–3087. [DOI] [PubMed] [Google Scholar]
- 24. Cushman M, Lemaitre RN, Kuller LH, Psaty BM, Macy EM, et al. (1999) Fibrinolytic activation markers predict myocardial infarction in the elderly. The Cardiovascular Health Study. Arterioscler Thromb Vasc Biol 19: 493–498. [DOI] [PubMed] [Google Scholar]
- 25. Tzoulaki I, Murray GD, Lee AJ, Rumley A, Lowe GDO, et al. (2007) Relative value of inflammatory, hemostatic, and rheological factors for incident myocardial infarction and stroke: the Edinburgh Artery Study. Circulation 115: 2119–2127. [DOI] [PubMed] [Google Scholar]
- 26. Woodward M, Rumley A, Welsh P, MacMahon S, Lowe G (2007) A comparison of the associations between seven hemostatic or inflammatory variables and coronary heart disease. J Thromb Haemost 5: 1795–1800. [DOI] [PubMed] [Google Scholar]
- 27. Gram J, Bladbjerg EM, Møller L, Sjøl A, Jespersen J (2000) Tissue-type plasminogen activator and C-reactive protein in acute coronary heart disease. A nested case-control study. J Intern Med 247: 205–212. [DOI] [PubMed] [Google Scholar]
- 28. Folsom AR, Delaney JAC, Lutsey PL, Zakai NA, Jenny NS, et al. (2009) Associations of factor VIIIc, D-dimer, and plasmin-antiplasmin with incident cardiovascular disease and all-cause mortality. Am J Hematol 84: 349–353. [DOI] [PMC free article] [PubMed] [Google Scholar]
- 29. Meade TW, Cooper JA, Stirling Y, Howarth DJ, Ruddock V, et al. (1994) Factor VIII, ABO blood group and the incidence of ischaemic heart disease. Br J Haematol 88: 601–607. [DOI] [PubMed] [Google Scholar]
- 30. Wennberg P, Wensley F, Di Angelantonio E, Johansson L, Boman K, et al. (2012) Haemostatic and inflammatory markers are independently associated with myocardial infarction in men and women. Thromb Res 129: 68–73. [DOI] [PubMed] [Google Scholar]
- 31. Ridker PM, Vaughan DE, Stampfer MJ, Manson JE, Hennekens CH (1993) Endogenous tissue-type plasminogen activator and risk of myocardial infarction. Lancet 341: 1165–1168. [DOI] [PubMed] [Google Scholar]
- 32. Ridker PM, Hennekens CH, Cerskus A, Stampfer MJ (1994) Plasma concentration of cross-linked fibrin degradation product (D-dimer) and the risk of future myocardial infarction among apparently healthy men. Circulation 90: 2236–2240. [DOI] [PubMed] [Google Scholar]
- 33. Empana JP, Canoui-Poitrine F, Luc G, Juhan-Vague I, Morange P, et al. (2008) Contribution of novel biomarkers to incident stable angina and acute coronary syndrome: the PRIME Study. Eur Heart J 29: 1966–1974. [DOI] [PubMed] [Google Scholar]
- 34. Rumley A, Lowe G, Stott D, Welsh P, Robertson M, et al. (2009) Coagulation activation markers are associated with cardiovascular events and death in the elderly at risk: prosper study cohort. J Thromb Haemost 7 Suppl 2214–215.19630803 [Google Scholar]
- 35. van Loon JE, de Maat MPM, Hofman A, Witteman JCM, Leebeek FWG (2011) Relationship between thrombospondin gene variations, von Willebrand factor levels and the risk of coronary heart disease in an older population. J Thromb Haemost 9: 1415–1417. [DOI] [PubMed] [Google Scholar]
- 36. Lowe GD, Yarnell JW, Rumley A, Bainton D, Sweetnam PM (2001) C-reactive protein, fibrin D-dimer, and incident ischemic heart disease in the Speedwell study: are inflammation and fibrin turnover linked in pathogenesis? Arterioscler Thromb Vasc Biol 21: 603–610. [DOI] [PubMed] [Google Scholar]
- 37. Carcaillon L, Gaussem P, Ducimetière P, Giroud M, Ritchie K, et al. (2009) Elevated plasma fibrin D-dimer as a risk factor for vascular dementia: the Three-City cohort study. J Thromb Haemost 7: 1972–1978. [DOI] [PubMed] [Google Scholar]
- 38. Pradhan AD, LaCroix AZ, Langer RD, Trevisan M, Lewis CE, et al. (2004) Tissue plasminogen activator antigen and D-dimer as markers for atherothrombotic risk among healthy postmenopausal women. Circulation 110: 292–300. [DOI] [PubMed] [Google Scholar]
- 39. Kim HC, Greenland P, Rossouw JE, Manson JE, Cochrane BB, et al. (2010) Multimarker prediction of coronary heart disease risk: the Women’s Health Initiative. J Am Coll Cardiol 55: 2080–2091. [DOI] [PubMed] [Google Scholar]
- 40. Lowe GDO, Rumley A, McMahon AD, Ford I, O’Reilly DSJ, et al. (2004) Interleukin-6, fibrin D-dimer, and coagulation factors VII and XIIa in prediction of coronary heart disease. Arterioscler Thromb Vasc Biol 24: 1529–1534. [DOI] [PubMed] [Google Scholar]
- 41. Clarke R, Shipley M, Lewington S, Youngman L, Collins R, et al. (1999) Underestimation of risk associations due to regression dilution in long-term follow-up of prospective studies. Am J Epidemiol 150: 341–353. [DOI] [PubMed] [Google Scholar]
- 42. McCann CJ, Glover BM, Menown IBA, Moore MJ, McEneny J, et al. (2009) Prognostic value of a multimarker approach for patients presenting to hospital with acute chest pain. Am J Cardiol 103: 22–28. [DOI] [PubMed] [Google Scholar]
- 43. Spiel AO, Gilbert JC, Jilma B (2008) von Willebrand factor in cardiovascular disease: focus on acute coronary syndromes. Circulation 117: 1449–1459. [DOI] [PubMed] [Google Scholar]
- 44. Eichinger S, Hron G, Kollars M, Kyrle PA (2008) Prediction of recurrent venous thromboembolism by endogenous thrombin potential and D-dimer. Clin Chem 54: 2042–2048. [DOI] [PubMed] [Google Scholar]
- 45. Lowe GDO (2005) Circulating inflammatory markers and risks of cardiovascular and non-cardiovascular disease. J Thromb Haemost 3: 1618–1627. [DOI] [PubMed] [Google Scholar]
- 46. Smith NL, Chen MH, Dehghan A, Strachan DP, Basu S, et al. (2010) Novel associations of multiple genetic loci with plasma levels of factor VII, factor VIII, and von Willebrand factor: The CHARGE (Cohorts for Heart and Aging Research in Genome Epidemiology) Consortium. Circulation 121: 1382–1392. [DOI] [PMC free article] [PubMed] [Google Scholar]
- 47. Smith NL, Huffman JE, Strachan DP, Huang J, Dehghan A, et al. (2011) Genetic predictors of fibrin D-dimer levels in healthy adults. Circulation 123: 1864–1872. [DOI] [PMC free article] [PubMed] [Google Scholar]
- 48. van Schie MC, de Maat MPM, Isaacs A, van Duijn CM, Deckers JW, et al. (2011) Variation in the von Willebrand factor gene is associated with von Willebrand factor levels and with the risk for cardiovascular disease. Blood 117: 1393–1399. [DOI] [PubMed] [Google Scholar]
- 49. van Loon JE, Kavousi M, Leebeek FWG, Felix JF, Hofman A, et al. (2012) von Willebrand factor plasma levels, genetic variations and coronary heart disease in an older population. J Thromb Haemost 10: 1262–1269. [DOI] [PubMed] [Google Scholar]
- 50. Gong LL, Peng JH, Han FF, Zhu J, Fang LH, et al. (2012) Association of tissue plasminogen activator and plasminogen activator inhibitor polymorphism with myocardial infarction: a meta-analysis. Thromb Res 130: e43–e51. [DOI] [PubMed] [Google Scholar]
- 51.Huang J, Sabater-Lleal M, Asselbergs FW, Tregouet D, Shin SY, et al.. (2012) Genome-wide association study for circulating levels of plasminogen activator inhibitor-1 (PAI-1) provides novel insights into the regulation of PAI-1. Blood [Epub ahead of print]. [DOI] [PMC free article] [PubMed]
- 52. Wu O, Bayoumi N, Vickers MA, Clark P (2008) ABO(H) blood groups and vascular disease: a systematic review and meta-analysis. J Thromb Haemost 6: 62–69. [DOI] [PubMed] [Google Scholar]
- 53. Rudnicka AR, Rumley A, Lowe GDO, Strachan DP (2007) Diurnal, seasonal, and blood-processing patterns in levels of circulating fibrinogen, fibrin D-dimer, C-reactive protein, tissue plasminogen activator, and von Willebrand factor in a 45-year-old population. Circulation 115: 996–1003. [DOI] [PubMed] [Google Scholar]
- 54. Arnett DK, McClelland RL, Bank A, Bluemke DA, Cushman M, et al. (2011) Biomarkers of inflammation and hemostasis associated with left ventricular mass: The Multiethnic Study of Atherosclerosis (MESA). Int J Mol Epidemiol Genet 2: 391–400. [PMC free article] [PubMed] [Google Scholar]
- 55. Wennberg P, Wensley F, Johansson L, Boman K, Di Angelantonio E, et al. (2010) Reduced risk of myocardial infarction related to active commuting: inflammatory and haemostatic effects are potential major mediating mechanisms. Eur J Cardiovasc Prev Rehabil 17: 56–62. [DOI] [PubMed] [Google Scholar]
- 56. Ghebre MA, Wannamethee SG, Rumley A, Whincup PH, Lowe GDO, et al. (2012) Prospective study of seasonal patterns in hemostatic factors in older men and their relation to excess winter coronary heart disease deaths. J Thromb Haemost 10: 352–358. [DOI] [PubMed] [Google Scholar]
- 57. Yarnell J, McCrum E, Rumley A, Patterson C, Salomaa V, et al. (2005) Association of European population levels of thrombotic and inflammatory factors with risk of coronary heart disease: the MONICA Optional Haemostasis Study. Eur Heart J 26: 332–342. [DOI] [PubMed] [Google Scholar]
Associated Data
This section collects any data citations, data availability statements, or supplementary materials included in this article.
Supplementary Materials
Flow-chart of the Reykjavik Study.
(PDF)
Search strategy used in the updated meta-analyses.
(PDF)
Cross-sectional correlates of baseline levels of t-PA antigen.
(PDF)
Cross-sectional correlates of baseline levels of D-dimer.
(PDF)
Cross-sectional correlates of baseline levels of VWF.
(PDF)
Explorative analysis of effect modification of the associations of baseline levels of t-PA antigen, D-dimer and VWF with coronary heart disease risk in the Reykjavik study. Continuous variables were categorized based on tertile cut-offs in controls. All models are adjusted for age, sex, period of recruitment, smoking status, body mass index, systolic blood pressure, history of diabetes at baseline, total cholesterol, and loge triglycerides. *P values were calculated using likelihood ratio tests comparing models with and without interaction terms.
(PDF)
Estimated within-person variability of t-PA antigen, D-dimer and VWF by time since baseline measurement in the published literature. Abbreviations: ARIC, Atherosclerosis Risk in Communities Study; BRHS, British Regional Heart Study; EAS, Edinburgh Artery Study; Fletcher, Fletcher Challenge Study; Reykjavik, Reykjavik Study. Each point represents unadjusted study- and time-specific estimates of within-person variability (eg, reported correlation coefficients or regression dilution ratios) in paired samples taken some time apart. Grey boxes represent unadjusted estimates. The relative sizes of the boxes are proportional to the inverse of the standard errors.
(PDF)
Meta-analyses of reported associations of t-PA antigen, D-dimer and VWF with coronary heart disease risk in population-based prospective studies. Where studies reported more than one odds ratio, the least adjusted estimate was used. Study acronyms are explained in the legend of Table 3. Summary estimates were calculated using random effects models. *Degree of adjustment:+minimally adjusted (typically adjusted for age and sex only);++plus adjustment for at least one non-lipid marker;+++plus adjustment for at least one lipid marker;++++plus adjustment for at least one inflammatory marker. Where studies reported relative risks with more than one level of statistical adjustment, the least adjusted estimate was used (most adjusted estimates are reported in Figure 4).
(PDF)
Investigation of sources of possible heterogeneity in reported associations of t-PA antigen, D-dimer and VWF with coronary heart disease risk, according to various study-level characteristics. Summary estimates were calculated using random effects models. *P values are from meta-regression for differences in odds ratios across studies in different groups.
(PDF)
Funnel plots of reported associations of t-PA antigen, D-dimer and VWF with coronary heart disease risk. The dotted lines show 95% confidence intervals around the overall summary estimate calculated using fixed effect models. Egger’s test for regression asymmetry: t-PA antigen, P = 0.086; D-dimer, P = 0.004; VWF, P = 0.290.
(PDF)
Comparison of baseline characteristics of coronary heart disease cases, randomly selected controls and the overall Reykjavik cohort. *Controls were matched to coronary heart disease cases by sex and age (in five-year age bands) and therefore differ from the remainder of the Reykjavik cohort.
(PDF)
PRISMA 2009 Checklist. From: Moher D, Liberati A, Tetzlaff J, Altman DG, The PRISMA Group (2009). Preferred Reporting Items for Systematic Reviews and Meta-Analyses: The PRISMA Statement. PLoS Med 6(6): e1000097. doi:10.1371/journal.pmed1000097. For more information, visit: www.prisma-statement.org.
(PDF)
Within-person variability of t-PA antigen, D-dimer and VWF plus other measured markers (mean time between repeated measurements, 11.6 years).
(PDF)
Systematic review and updated meta-analysis.
(PDF)