

Abstract
Feedback connections to early-level sensory neurons have been shown to affect many characteristics of their neural response. Because selectivity for stimulus size is a fundamental property of visual neurons, we examined the summation tuning and discretely mapped receptive field (RF) properties of cells in the lateral geniculate nucleus (LGN) both with and without feedback from visual cortex. Using extracellular recording in halothane-anesthetized cats, we used small luminance probes displaced in Cartesian coordinates to measure discrete response area, and optimal sinusoidal gratings of varying diameter to estimate preferred optimal summation size and level of center-surround antagonism. In conditions where most cortical feedback was pharmacologically removed, discretely mapped RF response areas showed an overall significant enlargement for the population compared with control conditions. A switch to increased levels of burst firing, spatially displaced from the RF center, suggested this was mediated by changes in excitatory-inhibitory balance across visual space. With the use of coextensive stimulation, there were overall highly significant increases in the optimal summation size and reduction of surround antagonism with removal of cortical feedback in the LGN. When fitted with a difference-of-Gaussian (DOG) model, changes in the center size, center amplitude, and surround amplitude parameters were most significantly related to the removal of cortical feedback. In summary, corticothalamic innervation of the visual thalamus can modify spatial summation properties in LGN relay cells, an effect most parsimoniously explained by changes in the excitatory-inhibitory balance.
Keywords: summation, receptive field, visual cortex, corticothalamic, corticofugal
one of the earliest identified characteristics of receptive fields (RFs) in the visual system is selectivity for stimulus size. When a light disc is centered over a RF and enlarged, cells show first an increase in response magnitude (summation) and then, in many cases, a reduction (suppression) beyond a certain diameter (Barlow 1953; Hartline 1940 Fig. 3; Hubel and Wiesel 1962). The interaction of increasing diameter is broadly antagonistic, and a general model of the RF consisting of a central Gaussian excitatory zone and a coextensive Gaussian suppressive zone was first proposed by Rodieck (1965) for retinal ganglion cells. This difference-of-Gaussian (DOG) model and its derivatives have since been used across species to successfully model responses in visual neurons from retina to visual cortex for a range of stimuli (Alitto and Usrey 2008; Cai et al. 1997; DeAngelis et al. 1994; Einevoll and Plesser 2005, 2012; Enroth-Cugell and Robson 1966; Kremers et al. 2001; Nolt et al. 2004, 2007; Norton et al. 1989; Sceniak et al. 1999, 2001; Wielaard and Sajda 2006).
Fig. 3.
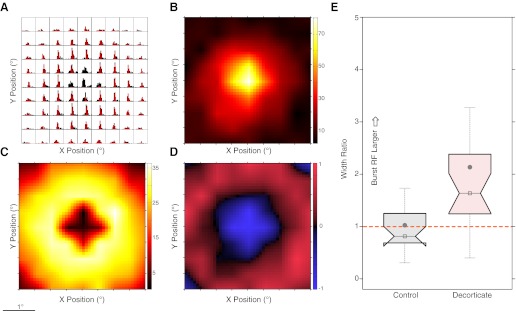
Decorticate burst-tonic differences across visual space. A: peristimulus time histograms (PSTH), each position representing steps of 0.5° across visual space, with red-to-black ratio showing the proportion of burst to tonic spikes for each bin. Y-axis maximum = 280 Hz. B: response surface for tonic spikes alone. Color bar represents firing rate in Hz. C: response surface for burst spikes alone. Color bar represents firing rate in Hz. D: normalized burst-tonic surface where −1 (blue) is tonic spikes only and + 1 (red) is burst spikes only. E: population box-notch plots of the width (Gaussian σ) ratio derived from burst-tonic RF fits. Gray filled circle, mean; open box/horizontal line, median. Notch limits signify the 95% CI of the median; box limits signify 25th and 75th percentiles of the data. Dashed orange line signifies unity (no difference between tonic and burst).
There is also growing consensus that the numerically dense feedback connections clearly modulate information transfer occurring at many levels of the visual system. In the cat dorsal lateral geniculate nucleus (dLGN) of the visual thalamus, this has been most clearly shown for changes in both temporal and spatial parameters (Sillito et al. 2006; Wörgötter et al. 2002). Cortical feedback synapses from primary visual cortices contribute up to 30% of the input to the LGN, influencing it directly and indirectly via inputs to relay cells, intrinsic inhibitory interneurons, and the inhibitory interneurons of the overlying perigeniculate component of the thalamic reticular nucleus (TRN) (Budd 2004; Erişir et al. 1997; Liu and Jones 1999; Murphy et al. 1999, 2000; Murphy and Sillito 1996; Van Horn et al. 2000). This suggests that the feedback connections have the capacity to influence both the center and surround characteristics of the RFs of dLGN relay cells. It is already known that the thalamic inhibitory mechanisms increase the strength of the surround antagonism of the center responses of dLGN cells (Hubel and Wiesel 1961; Sillito and Kemp 1983; Singer et al. 1972). We have previously shown that cortical feedback to the dLGN influences the length summation properties of relay cells tested with moving bars of varying length in cat (Murphy and Sillito 1987); in the absence of feedback there was a clear loss of the suppression normally evoked by long bars. However, there was little corresponding change in the spatial summation properties assessed with flashing spots of varying diameter. It was unclear whether this difference reflected differences in the spatial structure of the stimuli or a difference between moving and flashing stimuli. We have addressed this issue by comparing the responses to moving gratings of varying diameter both with and without cortical feedback, and have analyzed these using our previously published procedures (Jones et al. 2000). In addition, we fitted the data using a difference-of-Gaussian (DOG) model (Rodieck 1965; Sceniak et al. 1999). In the course of the initial mapping of the RF, we also found a surprising difference with and without cortical feedback in the area of visual space that could evoke responses.
METHODS
Experiments were performed on anesthetized (70% N2O, 30% O2, 0.1–0.5% halothane), paralyzed (10 mg·kg−1·h−1 gallamine triethiodide) cats as described in detail elsewhere (Cudeiro and Sillito 1996). We took data from 12 control cats and 11 cats with cortical feedback to the LGN pharmacologically inactivated. All procedures were in accordance with British Home Office license requirements and were approved by the local ethics review committee at University College London's Institute of Ophthalmology.
Electrophysiological recording and stimuli.
We recorded extracellularly from assemblies of up to three gold + platinum-coated tungsten-in-glass electrodes for penetrations through laminae A and A1 of the cat LGN. The configuration and angle of entry of these electrodes were adjusted to minimize damage to the TRN overlying the area of the LGN sampled and the projection fibers back from the cortex. To test discrete RF responses and center our display over the receptive field, we displayed a small (between 0.25 and 0.5 times the optimal diameter) flashing circular luminance probe (mean luminance 60 cd/m2) over a range of X and Y Cartesian coordinates. The range was selected to cover an area greater than that directly eliciting driving, ranging from ±0.5° to ±2° across the RF, depending on its size. We invariably used a grid of 7 × 7 or 9 × 9 positions, except in a few cells with a small RF, where a 5 × 5 grid was sufficient. The stimulus flashed 3–5 times with an interflash interval (IFI) time of 200–300 ms, and this was routinely repeated (randomized and interleaved) at each location for at least 5 trials. We used physical micrometer adjustment on our display carriage to accurately center it on the RF such that maximal response was elicited at (0, 0) and residual responses away from the center were symmetrically equivalent. Such rigorous centering was maintained quantitatively during the course of data collection. We checked preferred spatial and temporal frequency as described elsewhere (Cudeiro and Sillito 1996) and determined the linearity of spatial summation using a phase-reversing sinusoidal grating to identify cells as either X or Y type (Enroth-Cugell and Robson 1966). To assess spatial summation, once carefully centered, a circular patch of sinusoidal grating was presented over a range of 9–10 interleaved diameters (tailored to the RF) on an isoluminant background (mean luminance 30 cd/m2). Stimuli were presented with a mean contrast of 0.36, mean spatial frequency of 0.66 cycles/deg, and mean drift of 2 Hz. We routinely used 5 cycles of the drifting grating repeated through 10 randomized and interleaved trials.
Removal of feedback.
We inactivated the feedback from cortex by a specially adapted method involving the surgical implantation of a gelatin matrix over areas 17, 18, and 19 of the visual cortex and subsequent infusion of the potent GABA agonist muscimol (Andolina et al. 2007). The size and folding of the cortical area subsuming 17, 18, and 19 (Tusa et al. 1978; Tusa et al. 1979) precludes cooling techniques in the cat from ever removing more than a portion of the feedback input to the LGN. Furthermore, cortical cooling is known to have undesired hyperexcitability effects at the edges of the cooled zones (Trevelyan and Jack 2002; Volgushev et al. 2000) and can drive a distorted feedback pattern at the probe edge rather than an absence of feedback. Visual cortical ablation does ensure complete removal of feedback from the cortex; however, there are substantial vascular and other physiological changes, as well as potential for injury discharge from damaged neurons across the remaining visual network.
To achieve the pharmacological blockade, a unilateral craniotomy was performed over the occipital pole and slits were made in the dura into which sterile presized gelatin sheets were carefully inserted. The gelatin sheets were targeted to overlie the splenial and posterior splenial gyri, the lateral and anterior/posterior lateral gyri and sulci, and portions of the middle and posterior suprasylvian gyri closest to the lateral sulcus. The arachnoid membrane was carefully partially dissected over the lateral sulcus to allow greater penetration of muscimol. Small bore infusion tubes were then fixed into positions overlying the gelatin sheets for muscimol delivery. The location of the areas targeted was defined with reference to well-documented retinotopic maps (Tusa et al. 1978, 1979) and confirmed with hand maps using a superficial search electrode. The locations were chosen to remove all feedback for at least the central 15° of visual space.
Once the triadic electrode was in position just above the LGN, an electrode was also placed in the cortex, to enable continuous monitoring of activity in layer 6. Muscimol was then infused over the segments of gelatin with a concentration of 8 or 16 mg/ml. Control experiments recording in layer 6 showed an absence of spiking activity from 30 min to at least 10 h. The electrode in layer 6 of the cortex was normally moved every 1–2 h to check for any spiking activity over the targeted areas. We paid particular attention to areas such as the lateral sulcus and the splenial gyrus, where drug diffusion could be considered to be less effective. However, we always sampled throughout the area covered by the gelatin sheets. For areas 17 and 18 we used the visually driven background noise from layer 4 to provide a reference for cortical depth. At the concentration of muscimol used to silence layer 6 over the areas targeted, the cortical blockade lasted for at least 8–12 h and the gradual loss of blockade after application was variable. Therefore, we regarded this technique as nonreversible, and we simply sought to sustain the level of blockade for the duration of the experiment (2–3 days) by carefully augmenting the infusion if there was any sign of spiking activity. If we observed spiking activity in any of the areas sampled, we stopped data collection, topped up the infusion, and only restarted data collection when spiking activity was silenced; however, this was rarely the case, and muscimol provided very effective cortical silencing. This suppression of firing was not generalized beyond the targeted areas; we observed spontaneous activity in nonvisual cortical areas, including those sampled in the more rostral aperture through which the angled triadic and search electrodes were inserted to target LGN. In a preliminary experiment when setting up the methods, we evaluated the effect of inserting the same area of gelatin sheets but displacing them from area 17/18. We observed that although muscimol infusion silenced activity under the sheets, it did not suppress area 17/18. We did not observe any evidence for the spread of direct muscimol effects from the cortex to thalamus. Cells in the overlying TRN were visually responsive, and if there was any general shift in LGN cell responses, it was to a slightly higher level than seen in control preparations. When changing electrodes, we always checked for new locations with a search electrode and took the opportunity to also check that the pulvinar was still visually responsive. We never observed loss of visual driving in either pulvinar or TRN. All this underlines the view that the effects follow from the loss of feedback from areas 17, 18, and 19. Although this technique did not allow us to demonstrate the effects of reversible blockade, it avoided the caveats of reversible techniques such as cooling and allowed for longer periods of data collection in the presence of a stable blockade of cortical activity.
Data analysis.
Statistical significance between cell populations with and without feedback was assessed using the nonparametric Wilcoxon rank-sum test for independent samples with the MATLAB statistics toolbox (The MathWorks). Medians and means are presented when the data significantly (Lilliefors test) deviate from being normally distributed. Confidence intervals (CI) at 95% are computed for all samples using the bias-corrected and accelerated bootstrap (Calmettes et al. 2012). We ensured that the mean eccentricity from the area centralis between all cells used in the two populations was the same [see Fig. 1D; with feedback: 4.76° (CI: 4.14–5.43°); without feedback: 5.01° (CI: 4.32–5.73°); P = 0.76] and further ensured that removal from the analysis of decorticate cells further from the area centralis than the 75th percentile of the control, or any control cells nearer to the area centralis than any decorticate cells, did not have any effect on the measurements made.
Fig. 1.
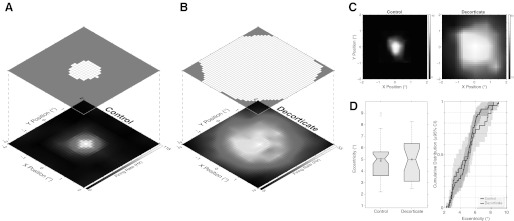
Example lateral geniculate nucleus (LGN) cell receptive field (RF) maps ±2° in 0.5° steps. A: control example Y-ON cell (5.6° eccentricity). B: decorticate example X-ON cell (3° eccentricity). A and B are plotted as both firing rate surface plots (bottom) and overlying significant response area surface plots (top). Grayscale bars represent firing rate in Hz. The area measurements are 1.4 deg2 for the control data in A and 14.8 deg2 for the decorticate example in B. C: second example pair of control (X-ON cell; 5.4° eccentricity; 0.88-deg2 area, mapped at ±1° and plotted on a ±2° axis) and decorticate (X-ON cell; 4.3° eccentricity; 10.3-deg2 area, mapped at ±2°) LGN cells. Grayscale bars represent firing rate in Hz. D: box-notch plot (left) and cumulative distribution function (CDF) plot (right) of eccentricity for control and decorticate populations. Gray filled circles indicate mean; open box/horizontal line indicate median. Notch limits signify the 95% confidence interval (CI) of the median; box limits signify 25th and 75th percentiles of the data. Shaded areas plot the 95% CI of the CDF.
Total RF area was measured by first linearly interpolating the Cartesian grid and then counting only those quadrants whose firing rate exceeded spontaneous 2 standard deviations (SD). Full width at half-height was computed through the center along both the abscissa and ordinate and was averaged.
Bursts were defined from the interspike intervals (ISI) as two or more spikes with an initial ≥100-ms pre-ISI and then ≤4-ms ISIs. Two-dimensional (2D) Gaussians were fit to the tonic and burst-derived RFs, respectively, through optimization of least squared error using FMINCON in the MATLAB optimization toolbox.
Summation tuning curves were first optimally fitted to mean neural responses with the use of a constrained DOG function in MATLAB by using FMINCON. The DOG model involved integrating the classical DOG equation over several diameters (Sceniak et al. 2001):
where the model parameters consisted of the following: cs = RF center size, ca = RF center strength, ss = RF surround size, sa = RF surround strength, and dc = spontaneous firing rate. Goodness of fit was assessed using the mean fractional error (MFE; Sceniak et al. 2001). The ratio of excitation to inhibition was calculated as
The model was constrained by making sure that the surround size was always larger than the center size. Each of the other model parameters was constrained with upper and lower bounds (no negative values, center size > 0). To assess the confidence intervals of model parameters on each fit, we refit the model using NLINFIT along with NPARCI functions to minimize CI ranges in MATLAB.
RESULTS
Quantitative measurements of RF area.
When we removed the cortical feedback, we qualitatively observed that by using hand positioning of a high-luminance probe, we could elicit transient responses over larger areas of visual space around the RF than usual for LGN relay cells. To estimate this difference quantitatively, we first measured RF area discretely, using a small circular flashing full-luminance probe displaced over a range of X and Y Cartesian coordinates. We chose to use forward correlation and a temporal IFI that allowed both direct and indirect excitatory and inhibitory mechanisms time to integrate. This is in contrast to reverse correlation methods that stimulate the RF for a fraction of a millisecond (1 or 2 frames convolved with the short phosphorus pulse response time) and will therefore tend to drive strongest inputs only. We also used only the same sign response component for analysis (ON vs. OFF depending on the center response sign).
An example of RFs with feedback (A) and with feedback removed (B) are shown in Fig. 1. The with-feedback (“control”) example is taken from a Y cell with an eccentricity of 5.6°, and the feedback-removed (“decorticate”) example is an X cell with an eccentricity of 3°. The interpolated RF firing rates are plotted at bottom, and the resultant significant response area measurement grids are plotted at top. It is clear that there is a significant increase in responsive surface area from comparison of the control and decorticate examples. For these cases, the surface area is 1.4 deg2 for the control example and 14.8 deg2 for the decorticate example (and because we measured significant responses up to the edge of the grid, it is possible we were underestimating the response area, cf. Fig. 3A). A second pair of control (left; 5.4° eccentricity, 0.88 deg2 area) and decorticate (right; 4.3° eccentricity; 10.3 deg2 area) example X cells is shown in Fig. 1C. A difference in response area was robustly maintained across our whole sample of cells. Our total population comprised 78 control and 45 decorticate cells. To perform the area measurement accurately, 29 control cells were measured with sufficient spatial resolution (see methods) for further analysis (control: 21 X cells, 8 Y cells; 25 ON, 4 OFF) and 27 cells with feedback eliminated (decorticate: 19 X cells, 3 Y cells, 5 unclassified cells; 24 ON, 3 OFF). The surface area rose from a bootstrapped median of 0.66 deg2 (CI: 0.4–0.78 deg2; mean: 0.93 deg2) to 4.29 deg2 (CI: 2.3–4.6 deg2; mean: 5.3 deg2), which was highly significantly different (P = 9.83 × 10⁻⁸). This distribution is graphically shown along the X-axis as a log scatter plot in Fig. 2A and as a cumulative distribution in Fig. 2B. There is a substantial shift to the right in the cumulative distribution of the decorticate cells such that the diameter at the 80th percentile of the control cells matches (approximately) the 30th percentile of the decorticate population.
Fig. 2.
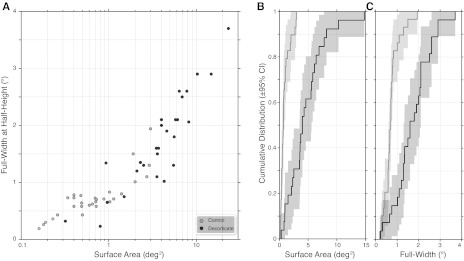
A: scatter plots for surface area (log x-axis) against full width at half-height (linear y-axis) for control (gray) and decorticate (black) LGN cells. B and C: CDF plots for surface area (B) and full width at half-height measurements (C). Shaded areas plot the 95% CI of the CDF.
An additional measure that takes into account the relative magnitude of the response is the full width at half-height, which we measured along both the abscissa and ordinate dimensions of the RF grid and then averaged. The full width at half-height is plotted along the linear Y-axis of the log scatter plot in Fig. 2A and as a cumulative distribution for full width at half-height in Fig. 2C. Comparing the control to decorticate group, we found the median full width at half-height increased from 0.68° (CI: 0.58–0.73°) to 1.69° (CI: 1.13–1.9°). This difference was also highly significantly different (P = 2.71 × 10⁻⁸).
Because it is well known that relay cells, especially X cells, receive retinal innervation from one or a few retinal ganglion cell afferents (Mastronarde 1987a, 1987b), this result is initially somewhat surprising. One of the more salient features of the responses across visual space for the decorticate cells when the firing pattern was examined was an increase in response transience away from the RF center. Because the switch from tonic to burst firing mode depends critically on hyperpolarizing input and cortical feedback synapses on intrinsic and TRN inhibitory cells, we chose to compare burst-tonic firing for the control and decorticate RFs. Raw peristimulus time histograms (PSTHs) for the example cell in Fig. 1B are shown in Fig. 3A. For each histogram bin, the proportion of burst spikes is plotted in red compared with all spikes, plotted in black. It is very clear that many of the responses for this cell are dominated by burst spikes, except in the center where almost all spikes are tonic (overall burst-tonic ratio for this cell = 0.6). One can separate just the tonic and the burst spikes and recompute the response grids, as shown in Fig. 3, B and C, respectively. Another way of representing this is to compute a firing mode index, from −1 (tonic only) to +1 (burst only), and this is represented in Fig. 3D. It is clear that there is a central response composed of tonically dominated spikes and a larger surrounding region of burst-dominated firing; it is the burst firing in this example that drives the enlargement of significant response area. To quantify this, we optimized best-fitting 2D Gaussian functions to the tonic and burst spikes separately (like those shown in Fig. 3, B and C) and used the Gaussian σ for each fit to calculate a burst-tonic width ratio: values >1 signify a burst field larger than tonic. The population summary is shown in Fig. 3E as a box plot. It is clear that for the control data, plotted in black, just over half the population lies below the unity line (tonic field larger than burst), whereas for the decorticate (plotted in red), almost the entire population is above the unity line. Numerically, the median σ ratio for decorticate burst fields was 1.7 times larger than tonic (CI: 1.25–2.1; mean: 2.21) compared with the control ratio of 0.87 (CI: 0.73–1.19; mean: 1.02). This difference was highly significantly different (P = 6.28×10⁻⁸), confirming that the decorticate population exhibited larger RFs for burst spikes compared with tonic spikes than the control population.
Spatial summation measurements.
A second metric for assessing the RF spatial dimension is to compute the spatial summation curve. For the spatial summation tuning we collected sufficient tuning curves from 52 control and 27 decorticate cells. We chose a contrast that elicited a nonsaturating response for each cell (range: 0.36–0.5). We took great care in quantitatively ensuring our stimulus display was carefully centered over the RF (see methods) and regularly confirmed centering was maintained consistently throughout data collection. Stimuli were circular drifting sine-wave gratings of randomly varying diameter on a mean-luminance background. The control sample for the spatial summation tuning comprised 33 X cells, 17 Y cells, and 2 uncategorized cells (33 ON and 19 OFF cells), and the decorticate sample comprised 21 X cells, 1 Y cell, and 5 uncategorized cells (22 ON and 5 OFF cells). We first subtracted spontaneous firing (derived from the 0° stimulus); the optimal diameter was determined as that which gave the greatest response, and the reduction in firing with larger diameters was quantified by measuring the reduction in response once a plateau had been reached (summary shown in Fig. 4A; cf. Jones et al. 2000). Two example single-cell responses are shown in Fig. 4, B (control) and C (decorticate). For the on-center control X cell, the maximal response was obtained with a 0.7° stimulus. Increasing the diameter of the stimulus further resulted in a sharp decrease in cell response with a response reduction of 74.6%. For the decorticate on-center X cell, the optimal diameter was 1.5°, and larger diameters caused only a 34.1% response reduction.
Fig. 4.
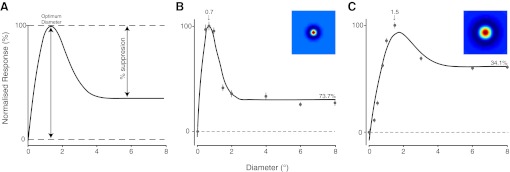
A: schematic of the tuning curve measurements used to quantify the grating summation curves. B: responses of an example X-ON cell with feedback (5.2° eccentricity). Data points are plotted ±SE. The optimal difference-of-Gaussian (DOG) model tuning curve is also shown. C: responses of an example X-ON cell without feedback (5° eccentricity). Conventions as for B. Inset surfaces in B and C are the resultant RFs calculated from the optimal DOG model parameters of the summation tuning curve fit.
This difference in spatial summation was maintained for the population as a whole. Figure 5A displays scatter plots of optimal diameter against surround suppression. There is a clear distribution of decorticate cells toward lower percent suppression and larger diameters. Figure 5, B and C, shows the box plots for surround suppression and optimal diameter, respectively. There was an increase in the optimal diameter with removal of feedback, increasing from a mean value of 0.83° (median: 0.7°; CI: 0.76–0.921°) for control cells to 1.26° (median: 1°; CI: 1.07–1.51°) for decorticate cells; this was significantly different (P = 5.62×10⁻⁵). The amount of suppression dropped from 71.2% (CI: 66.6–76.5%) to 39.6% (CI: 30.8–47%); this was again significantly different (P = 7.897×10⁻⁸). We found no significant difference in the firing rates of 20.8 Hz for the control cells (median: 21.2 Hz; CI: 18.6–23.1 Hz) and 17.7 Hz for the decorticate cells (median: 14.3 Hz; CI: 14–22.8 Hz) for the optimal diameter (P = 0.08). This was somewhat surprising, because previous studies removing feedback with the use of cortical ablation in marmoset (Webb et al. 2002) or cortical cooling in macaques (Przybyszewski et al. 2000) did show significant reductions in maximal response to an optimal diameter stimulus. Because there was a small but significant difference in the spontaneous firing rates (control mean/median: 5.4/3.5 Hz vs. decorticate mean/median: 3.28/2 Hz; P = 0.02), we re-ran the analysis without first removing the spontaneous firing rate, and we then found a significant reduction in the firing rates for the optimal stimulus (control mean/median: 26.7/27.1 Hz; CI: 24–29.5 Hz vs. decorticate mean/median: 21.1/17.8 Hz; CI: 17.2–27 Hz; P = 0.017). Along with our use of the F0 (Jones et al. 2000) vs. F1 Fourier component and the use of a low nonsaturating contrast for our optimal stimulus, species, cell type, and inactivation technique differences (see methods), we suggest these account for the magnitude differences observed between our work and that reported in primate. As expected, the maximal suppression firing rates did show significantly lower responses (6.14 vs. 11.2 Hz; P = 0.018).
Fig. 5.
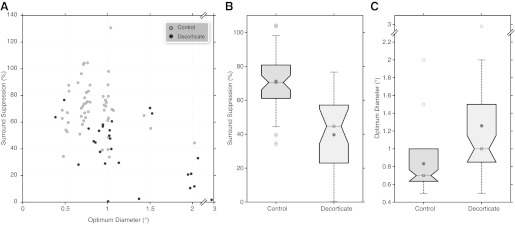
A: scatter plots for optimum diameter plotted against %suppression for control (gray) and decorticate (black) populations. Optimum diameter and %suppression are also plotted as box plots in B and C, respectively. Gray filled circle, mean; open box/horizontal line, median. Notch limits signify the 95% CI of the median; box limits signify 25th and 75th percentiles of the data.
There were not enough Y cells in the decorticate group to merit comparison, but for the control group we found there was a significant difference between X and Y cell optimal diameters, as we have previously shown (Jones et al. 2000). Optical diameter increased from 0.78° for X cells to 1.05° for Y cells, and this was significantly different (P = 0.004). There was no significant difference for plateau suppression between X and Y cells. Because the majority of our decorticate cells were X cells, and because Y cells on average have larger optimal diameters, we may have actually underestimated the increase in optimal diameter on removal of cortical feedback.
DOG model fits.
To further quantify the differences with removal of the cortical feedback, we utilized the integral of the DOG (Sceniak et al. 1999) to optimally fit the summation tuning curves. Our DOG model has five parameters: 1) center size, 2) center strength, 3) surround size, 4) surround strength, and 5) DC spontaneous firing rate. We used a standard constrained fitting algorithm where initial lower and upper bounds were confined (i.e., strength and spontaneous rates had to be in physiological ranges and nonnegative). Quality of fit was assessed using the mean fractional error (MFE; Sceniak et al. 1999). We also tested our fits using a nonlinear fitting algorithm that returns confidence intervals to assess the robustness of the fits and confirm the model fits were optimal.
We found that all but the surround size DOG model parameters between control and decorticate populations showed significant changes (Fig. 6). The center size parameter increased from a bootstrapped mean of 0.85° (CI: 0.78–0.95°) to 1.14° (CI: 0.99–1.32°), a change that was significant at P = 0.002 (Fig. 6A). Center amplitude decreased from 60.8 Hz (CI: 54.8–67 Hz) to 37.2 Hz (CI: 29.3–47.2 Hz), highly significant at P = 6.05×10⁻⁵. Surround amplitude dropped from 21.5 Hz (CI: 18.2–26 Hz) to 13 Hz (CI: 9.06–18.4 Hz), significant at P = 0.005. DC spontaneous firing rate decreased from 3.2 Hz (CI: 2.22–4.75 Hz) to 1.55 Hz (CI: 0.77–2.87 Hz), just significant at P = 0.03. The changes in these parameters caused the DOG model suppression index (SI) to decrease overall from 0.79 (CI: 0.76–0.82) in control cells to 0.58 (CI: 0.49–0.67) in decorticate cells, a change that was highly significantly different (P = 7×10⁻⁷).
Fig. 6.
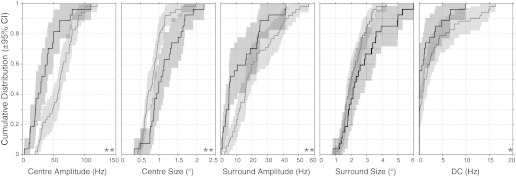
CDF plots for control (gray) and decorticate (black) populations along with the 95% CIs (shading) for the principal DOG model parameters. **P < 0.01, *P < 0.05, significant population difference between control and decorticate cells.
DISCUSSION
We have shown that cells in the dLGN exhibit clear changes in responses to discrete stimulation around the center of the RF with small displaced luminance probes and changes in their spatial summation responses to moving gratings of variable diameter when cortical feedback is removed. Over several levels of the neuronal pathways processing vision, the interaction between central and surrounding regions of visual space has been conceived in terms of a “classical” receptive field (CRF), in which visual stimulation elicits direct neural firing (ON, OFF, or mixed), and an “extended” modulatory surrounding area (extraclassical receptive field, ECRF). The ECRF is mostly antagonistic to the center (evidenced through suppression of center response), although it can also be facilitatory. Often coextensive throughout the CRF, ECRF phenomena with spatial profiles far removed from the CRF drive visual responses directly (periphery / shift effects; Derrington and Felisberti 1998; McIlwain 1966). In addition, the RF is temporally dynamic; its properties evolve over time, including its size (Allen and Freeman 2006; Ruksenas et al. 2007). Size is further dynamically dependent on the level of contrast/luminance present in the image (Kapadia et al. 1999; Sceniak et al. 1999). Stimulation of the CRF invariably coactivate parts of the ECRF, and even if the ECRF is isolated in one stimulus regime, spatial and temporal changes may alter this balance. Therefore, clear terminological distinctions of the CRF/ECRF are somewhat arbitrary and loosely defined. We know that anatomically, each level in the visual system from the retina forward contains laterally extensive excitatory and inhibitory mechanisms (including spatial extents of feedback-derived mechanisms from the thalamus onward). Thus a parsimonious description of the RF really rests on elaboration and layering of successive mechanisms of neural excitation and suppression, several of which may not always be easily separable.
With reference to the LGN, the RF surround that is the basis for the results presented in this article is most likely composed of several mechanisms. We know that LGN RFs appear closely matched to their retinal driving inputs, including surround features such as contrast-dependent summation (Nolt et al. 2004; Usrey et al. 1999). From this first synapse on, however, there is substantial anatomic and physiological basis for modulation of the sensory input (Sherman and Guillery 2002). It is broadly agreed that the transformation at the level of the thalamus modifies the center-surround interactions of relay cell RFs over and above their retinal inputs (Hubel and Wiesel 1961; Sillito et al. 2006; Sillito and Kemp 1983; Singer 1977; Webb et al. 2002). With regard to the cortical contribution, their terminals contact both relay cells and intrinsic inhibitory interneurons in a clearly spatially and functionally focused way (Angelucci and Sainsbury 2006; Briggs and Usrey 2009; Erişir et al. 1997; Murphy et al. 1999; Van Horn et al. 2000; Wang et al. 2006). In addition, the corticothalamic terminals, with a significant contribution of fast and potent glutamate receptor 4 (GluR4) synapses (Golshani et al. 2001; Mineff and Weinberg 2000), contact (as do en passant arbors from relay cell projections to visual cortex) cells in the TRN (Liu and Jones 1999). TRN inhibitory cells project their axons to contact both relay cells and intrinsic inhibitory cells and can strongly modulate relay cells they contact (Funke and Eysel 1998; Uhlrich and Cucchiaro 1992; Uhlrich et al. 1991, 2003). Within the TRN, cells have been shown to be both chemically (laterally inhibiting) and electrically (laterally excitatory) coupled (Deleuze and Huguenard 2006). Therefore, it is not surprising that small numbers of proximal retinal synapses can be substantially modulated by intrinsic thalamic/corticothalamic processes. We have previously shown that orientation-specific suppression in cat LGN cells appears to be partially inherited from cortical feedback (Cudeiro and Sillito 1996; Sillito et al. 1993). More recently, we observed that cortical feedback can modify the firing reliability of single, and firing correlation for pairs of, LGN cells (Andolina et al. 2007). This is consistent with numerous other studies showing the clear modification of spatiotemporal parameters of the relay cell response to visual stimuli (Marrocco et al. 1982; Wörgötter et al. 2002) and adds to the growing appreciation of the emergence of temporal features in the thalamus over and above the retinal input (Babadi et al. 2010; Rathbun et al. 2010; Wang et al. 2010).
Technical considerations.
We felt it was important to inactivate as much of the cortical feedback, which originates from at least areas 17, 18, and 19 in the cat (Kawamura et al. 1974; Updyke 1975) across at least 10–15° of the visual field. Cortical cooling, although partially reversible, suffers from methodological limits to the size and shaping to the target areas of the cooling probe. More importantly, Volgushev et al. (2000) found that above ∼10°C, although the action potential threshold remains constant, the input resistance and membrane potential change, resulting in cell hyperexcitability (see also Trevelyan and Jack 2002); this can lead to a ring of highly active cells around the inactivated region. We did not therefore think cooling would be suitable for the large-scale inactivation required. We have previously used cortical ablation (Murphy and Sillito 1987); however, this invasive methodology suffers from significant vascular and other physiological side effects. It was for these reasons we developed the large-scale use of the potent GABAA agonist muscimol to reliably inactivate the target areas of visual cortex. Because of the long-acting pharmacokinetic binding of muscimol to the GABAA receptor and the concentrations of muscimol used to ensure effective inactivation, we felt it was not possible to wait for a complete recovery and therefore couldn't use the same cells for comparison. This limits the potential for our study to probe more subtle differences in LGN relay cell responses with and without feedback and limits the statistical power that such independently grouped comparisons afford (i.e., cell-specific changes that are within the range of variance of the population as a whole). It is further relevant to understand that all methods that result in global inactivation will change the stimulus-driven dynamic interplay of facilitating and depressing synapses across direct and indirect excitatory and inhibitory cell types. This can lead to difficulties in unmasking particular excitatory and inhibitory mechanisms over the presentation of the stimulus, especially in topographically mapped systems driven by spatiotemporal varying stimuli. Nevertheless, we feel that global inactivation does provide a valuable experimental probe of a complex network and a useful baseline from which more focal and subtle experimental perturbations can then be assessed.
Effects on RF area.
We found a significant enlargement of the area of visual space over which the relay cell would respond to the dominant sign (ON vs. OFF) of visual stimulation. This was the case when we used either measures that characterized any area of significant responses independent of the magnitude of response (surface area) or measures that took account of the response magnitude across visual space (full width at half-height). This difference was striking (in terms of magnitude), robust (in terms of population percentiles), and unexpected. We know from anatomic evidence that many X cells in the dLGN receive only one or a few retinal ganglion cell (RGC) afferents (Mastronarde 1987a, 1987b). Physiological evidence from simultaneous recording of RGC afferents and dLGN cells shows dLGN RFs invariably smaller than their retinal afferents (Cleland and Lee 1985) or of similar size (Nolt et al. 2004). Simultaneous recordings from RGCs and LGN relay cells show a very precise spatial topography and specificity when assessed using cross-correlational analysis (Usrey et al. 1999). These factors point to the fact that LGN X cells receive most of their sign-dominant driving from a small number of RGC inputs and therefore should not show large changes in RF size with modulatory feedback from the cortex removed. We noted one clear difference across the extended area of visual driving, in that burst firing dominated around a central, more spatially restricted tonic response. In the control population, there was a tendency for burst responses to be smaller than tonic responses (Fig. 3B), in accord with previous results (Rivadulla et al. 2003). For the decorticate cells, in all cells but one, the burst field was larger than the tonic field.
There is clear evidence that burst mode firing seen extracellularly can depend on low-threshold calcium spikes activated after initial hyperpolarization of voltage-dependent calcium channels (Crunelli et al. 1989; Ramcharan et al. 2000), and firing mode changes in the LGN are strongly coupled to cortical state (Wörgötter et al. 2002), including very focal manipulations of corticothalamic feedback terminals (Wang et al. 2006). It is important to state that burstlike spiking patterns can also be inherited directly from the “push” of RGC inputs (Sincich et al. 2007) and/or the “pull” of feedforward inhibition (Wang et al. 2007) and that intracellular or dual recording of S potentials is needed to clearly identify the origin of burstlike spikes in LGN cells (Weyand 2007). For our data, it is unlikely the burst firing changes we have seen are dominantly retinal in origin because there is no evidence of such spatial convergence of retinal inputs on LGN cells anatomically or physiologically, and removal of cortical input cannot influence changes in retinal firing mode. It is therefore more likely that the changes in spatial distribution of burst responses are generated de novo in the LGN, due to hyperpolarization from a spatially extended input to the LGN cells. Our flashing stimuli are repeated several times at each presentation in sequence, and the reverse sign invariably precedes the preferred sign. Therefore, for an example ON cell, spatially displaced OFF cell inputs activating TRN fields with divergent connections back to that ON-center LGN cell drive a hyperpolarizing event outside the spatial extent of its retinal input. On the change of stimulus sign, the removal of the spatially focused hyperpolarization can result in a strong rebound response, eliciting burst firing (Destexhe and Sejnowski 2002). It is known that the TRN exerts a potent influence on visual stimulation (including the small discrete flashing stimuli we use in this study) of LGN cells (Funke and Eysel 1998). Anatomically, the distribution of terminals and the size of their dendritic arbors suggest TRN cells will receive inputs over significantly larger areas of visual space than relay cells (Sillito and Jones 2007). Along with the evidence that TRN cells are both chemically and electrically coupled, their inputs back to the LGN will engage a spatially extended (dis)inhibitory effect. Numerically, the TRN receives the largest single source of its inputs from cortical feedback terminals (Liu and Jones 1999) via potent ionotropic glutamate receptors (Golshani et al. 2001; Mineff and Weinberg 2000). Perturbation of this potent circuitry should have a strong effect in behaving animals. It was recently found in Gria4−/− mice that it is reduced cortical drive to TRN cells that leads to hyperexcitability of thalamocortical cells, resulting in seizures behaviorally; an effect driven by cortex-TRN mediated changes in the membrane state of the thalamic cells (Paz et al. 2011). Overall, therefore, there is substantial evidence that the cortex-TRN-LGN connectivity can significantly alter membrane state and resultant visual responses in a spatially specific manner.
Effects on spatial summation.
The changes in summation tuning with and without feedback from the visual cortex involved significant increases in the average smallest diameter eliciting maximal responses. In addition, highly significant reductions in the average level of plateau suppression at larger grating diameters were observed. To test the potential mechanisms driving the observed changes, we fitted the classical DOG model to the neural tuning curves. This model comprises four main parameters (plus a DC offset): the size and amplitude of a center, and the size and amplitude of a coextensive surround mechanism. Using optimized (least squares) fits, we found that the center size parameter increases and both the center and surround amplitude decrease.
There has been a recent reappreciation of the issues surrounding summation tuning from the retina onto higher visual cortical areas (Bonin et al. 2005; Britten and Heuer 1999; Heuer and Britten 2002; Nolt et al. 2004; Raiguel et al. 1995; Solomon et al. 2002; Xiao et al. 1997; Xu et al. 2002). Using the DOG model (in which the Gaussian fields can be thought of as classical and/or extraclassical), we found all but surround size were significantly changed. Several studies in LGN and cortex of intact preparations have previously found that the center size is the most significant parameter when fitting the DOG to summation data. (Kremers et al. 2001; Nolt et al. 2004; Sceniak et al. 1999; Solomon et al. 2002). However, in macaque V1, Cavanaugh et al. (2002) have suggested that it is not necessary to change spatial parameters and that ratios of center-surround strength when using a divisive (ratios of Gaussians; ROG) rather than a subtractive model can provide excellent data fits (although see Tailby et al. 2007). In a detailed neural network model of summation by Wielaard and Sajda (2006), the authors found that spatial changes alone were insufficient and that gain parameters were important to fully document the response. Bonin et al. (2005) used an additional (divisively) suppressive field composed of Gaussian subunits in addition to a (subtractively) antagonist DOG to model summation and other surround phenomena. Their data, based on the tuning characteristics, suggest the suppressive field is most consistent with a retinal and/or TRN origin. The fact that luminance disc summation suppression is largely unaffected (Murphy and Sillito 1987) whereas moving grating summation suppression is affected suggests parts of the suppressive field may indeed be separable into retinal and thalamic/cortical components. However, even in this stimulation paradigm that clearly engages significant retinal driving, recent studies using transcranial magnetic stimulation (TMS) inactivation have nevertheless shown changes to spot responses (de Labra et al. 2007). Furthermore, when assessing the direct (i.e., retinal) and indirect (i.e., thalamus onward) inputs via generalized linear models, Babadi et al. (2010) found that 5–25% of the inputs driven by larger spot diameter stimuli to cat LGN cells were potentially indirect. This reinforces the point that, even in stimuli that drive retinal afferents optimally, one cannot easily disentangle the modulatory mechanisms at the level of the visual thalamus.
Comparison of discrete and coextensive stimulation.
It is interesting to note that the large changes in size measured using the discrete stimuli do not drive such large changes in the spatial summation. The stimulation during spatial summation tests will always engage the strongly driven retinal afferents, unlike the discrete stimulation, where no stimulus is present at the center during peripheral stimulation. Although both the discrete and coextensive results show enlargement of the RF, we feel that these changes are not necessarily driven by the same mechanisms. The patterning of burst and tonic firing suggests that the discrete stimulation reveals an expanded surround area that under control conditions is not directly observable. However, even under removal of feedback, the DOG model results suggest that the only parameter that is not significantly different among the groups is the surround size. This therefore leads us to infer that the coextensive stimulation changes the membrane state in such a way that the cell is unaffected by the extended firing seen during discrete stimulation, when the center is not engaged.
Conclusion.
Our data show that removal of cortical feedback resulted in significant changes to the area of response and summation properties of LGN cells. We know there are several sources of contribution to spatial properties in the LGN, including primary components inherited from the retinal feedforward afferents (feedforward excitation and inhibition), extended inhibitory inputs driven by divergent LGN-TRN-LGN, cortex-LGN, and cortex-TRN-LGN loops, and finally, direct excitatory feedback from cortical terminals. We think that it is the change in the balance of antagonism between center and surround, predominantly via TRN (dis)inhibitory inputs, that is most parsimonious at explaining these data. The issues of whether cortical feedback can modify the spatial parameters depending on greater stimulus context, and defining with what temporal and spatial precision it may operate during attentional modulation, will be interesting avenues for further exploration.
GRANTS
This work was supported by Medical Research Council Grant G0701535.
DISCLOSURES
No conflicts of interest, financial or otherwise, are declared by the authors.
AUTHOR CONTRIBUTIONS
I.M.A., H.E.J., and A.M.S. conception and design of research; I.M.A. and H.E.J. performed experiments; I.M.A. analyzed data; I.M.A., H.E.J., and A.M.S. interpreted results of experiments; I.M.A. prepared figures; I.M.A. drafted manuscript; I.M.A., H.E.J., and A.M.S. edited and revised manuscript; I.M.A., H.E.J., and A.M.S. approved final version of manuscript.
REFERENCES
- Alitto HJ, Usrey WM. Origin and dynamics of extraclassical suppression in the lateral geniculate nucleus of the macaque monkey. Neuron 57: 135–146, 2008 [DOI] [PMC free article] [PubMed] [Google Scholar]
- Allen EA, Freeman RD. Dynamic spatial processing originates in early visual pathways. J Neurosci 26: 11763–11774, 2006 [DOI] [PMC free article] [PubMed] [Google Scholar]
- Andolina IM, Jones HE, Wang W, Sillito AM. Corticothalamic feedback enhances stimulus response precision in the visual system. Proc Natl Acad Sci USA 104: 1685–1690, 2007 [DOI] [PMC free article] [PubMed] [Google Scholar]
- Angelucci A, Sainsbury K. Contribution of feedforward thalamic afferents and corticogeniculate feedback to the spatial summation area of macaque V1 and LGN. J Comp Neurol 498: 330–351, 2006 [DOI] [PubMed] [Google Scholar]
- Babadi B, Casti A, Xiao Y, Kaplan E, Paninski L. A generalized linear model of the impact of direct and indirect inputs to the lateral geniculate nucleus. J Vis 10: 22, 2010 [DOI] [PMC free article] [PubMed] [Google Scholar]
- Barlow HB. Summation and inhibition in the frog's retina. J Physiol 119: 69–88, 1953 [DOI] [PMC free article] [PubMed] [Google Scholar]
- Bonin V, Mante V, Carandini M. The suppressive field of neurons in lateral geniculate nucleus. J Neurosci 25: 10844–10856, 2005 [DOI] [PMC free article] [PubMed] [Google Scholar]
- Briggs F, Usrey WM. Parallel processing in the corticogeniculate pathway of the macaque monkey. Neuron 62: 135–146, 2009 [DOI] [PMC free article] [PubMed] [Google Scholar]
- Britten KH, Heuer HW. Spatial summation in the receptive fields of MT neurons. J Neurosci 19: 5074–5084, 1999 [DOI] [PMC free article] [PubMed] [Google Scholar]
- Budd JML. How much feedback from visual cortex to lateral geniculate nucleus in cat: a perspective. Vis Neurosci 21: 487–500, 2004 [DOI] [PubMed] [Google Scholar]
- Cai D, DeAngelis GC, Freeman RD. Spatiotemporal receptive field organization in the lateral geniculate nucleus of cats and kittens. J Neurophysiol 78: 1045–1061, 1997 [DOI] [PubMed] [Google Scholar]
- Calmettes G, Drummond GB, Vowler SL. Making do with what we have: use your bootstraps. J Physiol 590: 3403–3406, 2012 [DOI] [PMC free article] [PubMed] [Google Scholar]
- Cavanaugh JR, Bair W, Movshon JA. Nature and interaction of signals from the receptive field center and surround in macaque V1 neurons. J Neurophysiol 88: 2530–2546, 2002 [DOI] [PubMed] [Google Scholar]
- Cleland BG, Lee BB. A comparison of visual responses of cat lateral geniculate nucleus neurones with those of ganglion cells afferent to them. J Physiol 369: 249–268, 1985 [DOI] [PMC free article] [PubMed] [Google Scholar]
- Crunelli V, Lightowler S, Pollard CE. A T-type Ca2+ current underlies low-threshold Ca2+ potentials in cells of the cat and rat lateral geniculate nucleus. J Physiol 413: 543–561, 1989 [DOI] [PMC free article] [PubMed] [Google Scholar]
- Cudeiro J, Sillito AM. Spatial frequency tuning of orientation-discontinuity-sensitive corticofugal feedback to the cat lateral geniculate nucleus. J Physiol 490: 481–492, 1996 [DOI] [PMC free article] [PubMed] [Google Scholar]
- de Labra C, Rivadulla C, Grieve K, Mariño J, Espinosa N, Cudeiro J. Changes in visual responses in the feline dLGN: selective thalamic suppression induced by transcranial magnetic stimulation of V1. Cereb Cortex 17: 1376–1385, 2007 [DOI] [PubMed] [Google Scholar]
- DeAngelis GC, Freeman RD, Ohzawa I. Length and width tuning of neurons in the cat's primary visual cortex. J Neurophysiol 71: 347–374, 1994 [DOI] [PubMed] [Google Scholar]
- Deleuze C, Huguenard JR. Distinct electrical and chemical connectivity maps in the thalamic reticular nucleus: potential roles in synchronization and sensation. J Neurosci 26: 8633–8645, 2006 [DOI] [PMC free article] [PubMed] [Google Scholar]
- Derrington AM, Felisberti F. Peripheral shift reduces visual sensitivity in cat geniculate neurones. Vis Neurosci 15: 875–880, 1998 [DOI] [PubMed] [Google Scholar]
- Destexhe A, Sejnowski TJ. The initiation of bursts in thalamic neurons and the cortical control of thalamic sensitivity. Philos Trans R Soc Lond B Biol Sci 357: 1649–1657, 2002 [DOI] [PMC free article] [PubMed] [Google Scholar]
- Einevoll GT, Plesser HE. Extended difference-of-Gaussians model incorporating cortical feedback for relay cells in the lateral geniculate nucleus of cat. Cogn Neurodyn 6: 307–324, 2012 [DOI] [PMC free article] [PubMed] [Google Scholar]
- Einevoll GT, Plesser HE. Response of the difference-of-Gaussians model to circular drifting-grating patches. Vis Neurosci 22: 437–446, 2005 [DOI] [PubMed] [Google Scholar]
- Enroth-Cugell C, Robson J. The contrast sensitivity of retinal ganglion cells of the cat. J Physiol 187: 517–552, 1966 [DOI] [PMC free article] [PubMed] [Google Scholar]
- Erişir A, Van Horn SC, Sherman SM. Relative numbers of cortical and brainstem inputs to the lateral geniculate nucleus. Proc Natl Acad Sci USA 94: 1517–1520, 1997 [DOI] [PMC free article] [PubMed] [Google Scholar]
- Funke K, Eysel UT. Inverse correlation of firing patterns of single topographically matched perigeniculate neurons and cat dorsal lateral geniculate relay cells. Vis Neurosci 15: 711–729, 1998 [DOI] [PubMed] [Google Scholar]
- Golshani P, Liu XB, Jones EG. Differences in quantal amplitude reflect GluR4- subunit number at corticothalamic synapses on two populations of thalamic neurons. Proc Natl Acad Sci USA 98: 4172–4177, 2001 [DOI] [PMC free article] [PubMed] [Google Scholar]
- Hartline HK. The effects of spatial summation in the retina on the excitation of the fibers of the optic nerve. Am J Physiol 130: 700–711, 1940 [Google Scholar]
- Heuer HW, Britten KH. Contrast dependence of response normalization in area MT of the rhesus macaque. J Neurophysiol 88: 3398–3408, 2002 [DOI] [PubMed] [Google Scholar]
- Hubel DH, Wiesel TN. Integrative action in the cat's lateral geniculate body. J Physiol 155: 385–398, 1961 [DOI] [PMC free article] [PubMed] [Google Scholar]
- Hubel DH, Wiesel TN. Receptive fields, binocular interaction and functional architecture in the cat's visual cortex. J Physiol 160: 106–154, 1962 [DOI] [PMC free article] [PubMed] [Google Scholar]
- Jones HE, Andolina IM, Oakely NM, Murphy PC, Sillito AM. Spatial summation in lateral geniculate nucleus and visual cortex. Exp Brain Res 135: 279–284, 2000 [DOI] [PubMed] [Google Scholar]
- Kapadia MK, Westheimer G, Gilbert CD. Dynamics of spatial summation in primary visual cortex of alert monkeys. Proc Natl Acad Sci USA 96: 12073–12078, 1999 [DOI] [PMC free article] [PubMed] [Google Scholar]
- Kawamura S, Sprague JM, Niimi K. Corticofugal projections from the visual cortices to the thalamus, pretectum and superior colliculus in the cat. J Comp Neurol 158: 339–362, 1974 [DOI] [PubMed] [Google Scholar]
- Kremers J, Silveira LCL, Kilavik BE. Influence of contrast on the responses of marmoset lateral geniculate cells to drifting gratings. J Neurophysiol 85: 235–246, 2001 [DOI] [PubMed] [Google Scholar]
- Liu XB, Jones EG. Predominance of corticothalamic synaptic inputs to thalamic reticular nucleus neurons in the rat. J Comp Neurol 414: 67–79, 1999 [PubMed] [Google Scholar]
- Marrocco RT, McClurkin JW, Young RA. Modulation of lateral geniculate nucleus cell responsiveness by visual activation of the corticogeniculate pathway. J Neurosci 2: 256–263, 1982 [DOI] [PMC free article] [PubMed] [Google Scholar]
- Mastronarde DN. Two classes of single-input X-cells in cat lateral geniculate nucleus. I. Receptive-field properties and classification of cells. J Neurophysiol 57: 357–380, 1987a [DOI] [PubMed] [Google Scholar]
- Mastronarde DN. Two classes of single-input X-cells in cat lateral geniculate nucleus. II. Retinal inputs and the generation of receptive-field properties. J Neurophysiol 57: 381–413, 1987b [DOI] [PubMed] [Google Scholar]
- McIlwain JT. Some evidence concerning the physiological basis of the periphery effect in the cat's retina. Exp Brain Res 1: 265–271, 1966 [DOI] [PubMed] [Google Scholar]
- Mineff EM, Weinberg RJ. Differential synaptic distribution of AMPA receptor subunits in the ventral posterior and reticular thalamic nuclei of the rat. Neuroscience 101: 969–982, 2000 [DOI] [PubMed] [Google Scholar]
- Murphy PC, Duckett SG, Sillito AM. Comparison of the laminar distribution of input from areas 17 and 18 of the visual cortex to the lateral geniculate nucleus of the cat. J Neurosci 20: 845–853, 2000 [DOI] [PMC free article] [PubMed] [Google Scholar]
- Murphy PC, Duckett SG, Sillito AM. Feedback connections to the lateral geniculate nucleus and cortical response properties. Science 286: 1552–1554, 1999 [DOI] [PubMed] [Google Scholar]
- Murphy PC, Sillito AM. Corticofugal feedback influences the generation of length tuning in the visual pathway. Nature 329: 727–729, 1987 [DOI] [PubMed] [Google Scholar]
- Murphy PC, Sillito AM. Functional morphology of the feedback pathway from area 17 of the cat visual cortex to the lateral geniculate nucleus. J Neurosci 16: 1180–1192, 1996 [DOI] [PMC free article] [PubMed] [Google Scholar]
- Nolt MJ, Kumbhani RD, Palmer LA. Contrast-dependent spatial summation in the lateral geniculate nucleus and retina of the cat. J Neurophysiol 92: 1708–1717, 2004 [DOI] [PubMed] [Google Scholar]
- Nolt MJ, Kumbhani RD, Palmer LA. Suppression at high spatial frequencies in the lateral geniculate nucleus of the cat. J Neurophysiol 98: 1167–1180, 2007 [DOI] [PubMed] [Google Scholar]
- Norton TT, Holdefer RN, Godwin DW. Effects of bicuculline on receptive field center sensitivity of relay cells in the lateral geniculate nucleus. Brain Res 488: 348–352, 1989 [DOI] [PubMed] [Google Scholar]
- Paz JT, Bryant AS, Peng K, Fenno L, Yizhar O, Frankel WN, Deisseroth K, Huguenard JR. A new mode of corticothalamic transmission revealed in the Gria4(−/−) model of absence epilepsy. Nat Neurosci 14: 1167–1173, 2011 [DOI] [PMC free article] [PubMed] [Google Scholar]
- Przybyszewski AW, Gaska JP, Foote W, Pollen DA. Striate cortex increases contrast gain of macaque LGN neurons. Vis Neurosci 17: 485–494, 2000 [DOI] [PubMed] [Google Scholar]
- Raiguel S, Van Hulle MM, Xiao DK, Marcar VL, Orban GA. Shape and spatial distribution of receptive fields and antagonistic motion surrounds in the middle temporal area (V5) of the macaque. Eur J Neurosci 7: 2064–2082, 1995 [DOI] [PubMed] [Google Scholar]
- Ramcharan EJ, Cox CL, Zhan XJ, Sherman SM, Gnadt JW. Cellular mechanisms underlying activity patterns in the monkey thalamus during visual behavior. J Neurophysiol 84: 1982–1987, 2000 [DOI] [PubMed] [Google Scholar]
- Rathbun DL, Warland DK, Usrey WM. Spike timing and information transmission at retinogeniculate synapses. J Neurosci 30: 13558–13566, 2010 [DOI] [PMC free article] [PubMed] [Google Scholar]
- Rivadulla C, Martinez L, Grieve KL, Cudeiro J. Receptive field structure of burst and tonic firing in feline lateral geniculate nucleus. J Physiol 553: 601–610, 2003 [DOI] [PMC free article] [PubMed] [Google Scholar]
- Rodieck RW. Quantitative analysis of cat retinal ganglion cell response to visual stimuli. Vision Res 5: 583–601, 1965 [DOI] [PubMed] [Google Scholar]
- Ruksenas O, Bulatov A, Heggelund P. Dynamics of spatial resolution of single units in the lateral geniculate nucleus of cat during brief visual stimulation. J Neurophysiol 97: 1445–1456, 2007 [DOI] [PubMed] [Google Scholar]
- Sceniak MP, Hawken MJ, Shapley R. Visual spatial characterization of macaque V1 neurons. J Neurophysiol 85: 1873–1887, 2001 [DOI] [PubMed] [Google Scholar]
- Sceniak MP, Ringach DL, Hawken MJ, Shapley R. Contrast's effect on spatial summation by macaque V1 neurons. Nat Neurosci 2: 733–739, 1999 [DOI] [PubMed] [Google Scholar]
- Sherman SM, Guillery RW. The role of the thalamus in the flow of information to the cortex. Philos Trans R Soc Lond B Biol Sci 357: 1695–1708, 2002 [DOI] [PMC free article] [PubMed] [Google Scholar]
- Sillito AM, Cudeiro J, Jones HE. Always returning: feedback and sensory processing in visual cortex and thalamus. Trends Neurosci 29: 307–316, 2006 [DOI] [PubMed] [Google Scholar]
- Sillito AM, Cudeiro J, Murphy PC. Orientation sensitive elements in the corticofugal influence on centre-surround interactions in the dorsal lateral geniculate nucleus. Exp Brain Res 93: 6–16, 1993 [DOI] [PubMed] [Google Scholar]
- Sillito AM, Jones HE. The role of the thalamic reticular nucleus in visual processing. Thalamus Relat Syst 4: 12, 2007 [Google Scholar]
- Sillito AM, Kemp JA. The influence of GABAergic inhibitory processes on the receptive field structure of X and Y cells in cat dorsal lateral geniculate nucleus (dLGN). Brain Res 277: 63–77, 1983 [DOI] [PubMed] [Google Scholar]
- Sincich LC, Adams DL, Economides JR, Horton JC. Transmission of Spike Trains at the Retinogeniculate Synapse. J Neurosci 27: 2683–2692, 2007 [DOI] [PMC free article] [PubMed] [Google Scholar]
- Singer W. Control of thalamic transmission by corticofugal and ascending reticular pathways in the visual system. Physiol Rev 57: 386–420, 1977 [DOI] [PubMed] [Google Scholar]
- Singer W, Poppel E, Creutzfeldt O. Inhibitory interaction in the cat's lateral geniculate nucleus. Exp Brain Res 14: 210–226, 1972 [DOI] [PubMed] [Google Scholar]
- Solomon SG, White AJ, Martin PR. Extraclassical receptive field properties of parvocellular, magnocellular, and koniocellular cells in the primate lateral geniculate nucleus. J Neurosci 22: 338–349, 2002 [DOI] [PMC free article] [PubMed] [Google Scholar]
- Tailby C, Solomon SG, Peirce JW, Metha AB. Two expressions of “surround suppression” in V1 that arise independent of cortical mechanisms of suppression. Vis Neurosci 24: 99–109, 2007 [DOI] [PubMed] [Google Scholar]
- Trevelyan AJ, Jack J. Detailed passive cable models of layer 2/3 pyramidal cells in rat visual cortex at different temperatures. J Physiol 539: 623–636, 2002 [DOI] [PMC free article] [PubMed] [Google Scholar]
- Tusa RJ, Palmer LA, Rosenquist AC. The retinotopic organization of area 17 (striate cortex) in the cat. J Comp Neurol 177: 213–235, 1978 [DOI] [PubMed] [Google Scholar]
- Tusa RJ, Rosenquist AC, Palmer LA. Retinotopic organization of areas 18 and 19 in the cat. J Comp Neurol 185: 657–678, 1979 [DOI] [PubMed] [Google Scholar]
- Uhlrich DJ, Cucchiaro JB. GABAergic circuits in the lateral geniculate nucleus of the cat. Prog Brain Res 90: 171–192, 1992 [DOI] [PubMed] [Google Scholar]
- Uhlrich DJ, Cucchiaro JB, Humphrey AL, Sherman SM. Morphology and axonal projection patterns of individual neurons in the cat perigeniculate nucleus. J Neurophysiol 65: 1528–1541, 1991 [DOI] [PubMed] [Google Scholar]
- Uhlrich DJ, Manning KA, Feig SL. Laminar and cellular targets of individual thalamic reticular nucleus axons in the lateral geniculate nucleus in the prosimian primate Galago. J Comp Neurol 458: 128–143, 2003 [DOI] [PubMed] [Google Scholar]
- Updyke BV. The patterns of projection of cortical areas 17, 18, and 19 onto the laminae of the dorsal lateral geniculate nucleus in the cat. J Comp Neurol 163: 377–395, 1975 [DOI] [PubMed] [Google Scholar]
- Usrey WM, Reppas JB, Reid RC. Specificity and strength of retinogeniculate connections. J Neurophysiol 82: 3527–3540, 1999 [DOI] [PubMed] [Google Scholar]
- Van Horn SC, Erişir A, Sherman SM. Relative distribution of synapses in the A-laminae of the lateral geniculate nucleus of the cat. J Comp Neurol 416: 509–520, 2000 [PubMed] [Google Scholar]
- Volgushev M, Vidyasagar TR, Chistiakova M, Yousef T, Eysel UT. Membrane properties and spike generation in rat visual cortical cells during reversible cooling. J Physiol 522: 59–76, 2000 [DOI] [PMC free article] [PubMed] [Google Scholar]
- Wang W, Jones HE, Andolina IM, Salt TE, Sillito AM. Functional alignment of feedback effects from visual cortex to thalamus. Nat Neurosci 9: 1330–1336, 2006 [DOI] [PubMed] [Google Scholar]
- Wang X, Hirsch JA, Sommer FT. Recoding of sensory information across the retinothalamic synapse. J Neurosci 30: 13567–13577, 2010 [DOI] [PMC free article] [PubMed] [Google Scholar]
- Wang X, Wei Y, Vaingankar V, Wang Q, Koepsell K, Sommer FT, Hirsch JA. Feedforward excitation and inhibition evoke dual modes of firing in the cat's visual thalamus during naturalistic viewing. Neuron 55: 465–478, 2007 [DOI] [PMC free article] [PubMed] [Google Scholar]
- Webb BS, Tinsley CJ, Barraclough NE, Easton A, Parker A, Derrington AM. Feedback from V1 and inhibition from beyond the classical receptive field modulates the responses of neurons in the primate lateral geniculate nucleus. Vis Neurosci 19: 583–592, 2002 [DOI] [PubMed] [Google Scholar]
- Weyand T. Retinogeniculate transmission in wakefulness. J Neurophysiol 2007 [DOI] [PubMed] [Google Scholar]
- Wielaard J, Sajda P. Extraclassical receptive field phenomena and short-range connectivity in V1. Cereb Cortex 16: 1531–1545, 2006 [DOI] [PubMed] [Google Scholar]
- Wörgötter F, Eyding D, Macklis JD, Funke K. The influence of the corticothalamic projection on responses in thalamus and cortex. Philos Trans R Soc Lond B Biol Sci 357: 1823–1834, 2002 [DOI] [PMC free article] [PubMed] [Google Scholar]
- Xiao DK, Raiguel S, Marcar V, Orban GA. The spatial distribution of the antagonistic surround of MT/V5 neurons. Cereb Cortex 7: 662–677, 1997 [DOI] [PubMed] [Google Scholar]
- Xu X, Bonds AB, Casagrande VA. Modeling receptive-field structure of koniocellular, magnocellular, and parvocellular LGN cells in the owl monkey (Aotus trivigatus). Vis Neurosci 19: 703–711, 2002 [DOI] [PubMed] [Google Scholar]