

Abstract
Purpose
EMT has been associated with metastatic spread and EGFR inhibitor resistance. We developed and validated a robust 76-gene EMT signature using gene expression profiles from four platforms using NSCLC cell lines and patients treated in the BATTLE study.
Methods
We conducted an integrated gene expression, proteomic, and drug response analysis using cell lines and tumors from NSCLC patients. A 76-gene EMT signature was developed and validated using gene expression profiles from four microarray platforms of NSCLC cell lines and patients treated in the BATTLE (Biomarker-integrated Approaches of Targeted Therapy for Lung Cancer Elimination) study, and potential therapeutic targets associated with EMT were identified.
Results
Compared with epithelial cells, mesenchymal cells demonstrated significantly greater resistance to EGFR and PI3K/Akt pathway inhibitors, independent of EGFR mutation status, but more sensitivity to certain chemotherapies. Mesenchymal cells also expressed increased levels of the receptor tyrosine kinase Axl and showed a trend towards greater sensitivity to the Axl inhibitor SGI-7079, while the combination of SGI-7079 with erlotinib reversed erlotinib resistance in mesenchymal lines expressing Axl and in a xenograft model of mesenchymal NSCLC. In NSCLC patients, the EMT signature predicted 8-week disease control in patients receiving erlotinib, but not other therapies.
Conclusion
We have developed a robust EMT signature that predicts resistance to EGFR and PI3K/Akt inhibitors, highlights different patterns of drug responsiveness for epithelial and mesenchymal cells, and identifies Axl as a potential therapeutic target for overcoming EGFR inhibitor resistance associated with the mesenchymal phenotype
Keywords: lung cancer, EMT, EGFR inhibition, PI3K inhibition, Axl
INTRODUCTION
Previous molecular profiling studies and recent mutational analyses have demonstrated the molecular heterogeneity of non-small cell lung cancer (NSCLC). For EGFR mutant and EML4-ALK fusion subgroups, mutation status predicts response to targeted therapy with EGFR inhibitors or ALK inhibitors, respectively. Unfortunately only a minority of patients express these markers, with EGFR mutations detected in ~10-15% of lung adenocarcinomas (1-6) and EML4-ALK fusions in ~4% (7). For the majority of patients with wild-type EGFR, a subgroup appears to benefit from EGFR inhibitor treatment, although there are currently no validated markers for identifying these patients (8-10). Thus, validated predictive markers are needed to accurately predict likelihood of benefit to EGFR-targeted therapy independent of EGFR mutation status, as well as for other targeted therapies.
Epithelial-mesenchymal transition (EMT) is a biological program observed in several types of epithelial cancers including NSCLC. EMT is associated with loss of cell adhesion proteins such as E-cadherin and increased invasion, migration, and cell proliferation (11-14). Preclinical and clinical data suggest that markers of EMT may be associated with limited responses to EGFR inhibitors, whereas retention of an epithelial phenotype is associated with response even in patients without EGFR receptor mutations (15-18). For example, high E-cadherin and low vimentin /fibronectin (i.e., an epithelial phenotype) have been associated with erlotinib sensitivity in cell lines and xenografts with wild-type EGFR (16). Clinically, E-cadherin protein expression has been associated with longer time to progression and a trend toward longer overall survival following combination erlotinib/chemotherapy, although EGFR mutation status of the patients was not known in this study (15). The ability to identify tumors that have not undergone EMT may help with the selection of patients most likely to benefit from EGFR inhibition, particularly in patients with wild type EGFR. In addition, targeting EMT may reverse or prevent acquisition of therapeutic resistance to EGFR inhibitors, as illustrated by one study in which restoration of an epithelial phenotype in NSCLC cell lines restored sensitivity to the EGFR inhibitor gefitinib (19). Although a number of markers have been associated with EMT and EMT signatures have been described in other cancer types, there is no validated EMT signature in NSCLC. Furthermore, it is unknown to what extent EMT may predict response to other targeted drugs in NSCLC.
To better characterize EMT in NSCLC and its association with drug response, we performed an integrated analysis of gene expression profiling from several microarray platforms together with high-throughput functional proteomic profiling. By cross-validating gene expression data from two independent microarray platforms in our training set of NSCLC cell lines, we were able to derive a robust EMT gene expression signature capable of classifying whether a NSCLC cell line had undergone EMT. We also performed an integrated analysis of the EMT gene signature and high-throughput proteomic profiling of key oncogenic pathways to explore differences in signaling pathways between epithelial and mesenchymal lines. Finally, we tested the ability of the EMT signature to predict response to erlotinib and other drugs in preclinical models and patient tumor samples.
MATERIALS AND METHODS
Cell lines
NSCLC cell lines were established by John D. Minna and Adi Gazdar at the National Cancer Institute and the University of Texas Southwestern Medical Center (20, 21) or obtained from the ATCC). Details of cell culture conditions are provided in Supplemental Information.
Expression profiling of cell lines
Total RNA was isolated from cell lines and profiled as described in Supplemental Information.
Selection of single best EMT marker probes
Because the NSCLC cell line panel was profiled on both Affymetrix and Illumina microarray platforms, we were able to select the single best Affymetrix probe sets for CDH1, VIM, CDH2, and FN1 on the basis of their strong correlation with other probes for the same gene within a microarray platform and/or across platforms (Supplemental Figure 1). Details provided in Supplemental Information.
Gene expression profiling of BATTLE tumors
Tumors collected during the BATTLE clinical trial were subjected to microarray profiling, as detailed in Supplemental Information.
Drug sensitivity of cell lines
For each drug, the concentration required to inhibit 50% growth (IC50) was measured by MTS assay ≥3 times in NSCLC cell lines derived from treatment-naïve patients and the average values were used for analysis as described previously and in Supplemental Information (22).
Generation and characterization of AXL inhibitor SGI-7079
Details of SGI-7079 generation are provided in Supplemental Figure 2 and Supplemental Information. To demonstrate inhibition of Axl activation by SGI-7079, HEK-293 cells were transiently transfected by electroporation with 1 mg FLAG-tagged plasmid containing the human Axl gene (OriGene Technologies, Rockville, MD) and allowed to incubate in standard media + 10% FBS for 24 hrs. Cells were treated with SGI-7079 for 10 minutes at the indicated concentrations. Five minutes prior to lysis, the cells were stimulated with Gas6 containing WI38 conditioned media. Immunoprecipitation of FLAG-tagged Axl was performed with anti-FLAG M2 agarose (Sigma-Aldrich, St. Louis, MO). Immunoprecipitates were resolved by SDS-PAGE, and Western blotting was performed with anti-PY20-HRP or anti-Axl (Santa Cruz Biotechnology Inc., Santa Cruz, CA). p-Axl = tyrosine phosphorylated Axl.
Protein profiling by reverse-phase protein array and Western blot
Reverse phase protein array (RPPA) studies were performed and analyzed as described previously and in Supplemental Information (23).
Animal studies
Mice were obtained from Charles River Laboratories. All animal studies were conducted under an institutionally approved protocol and were compliant with NIH guidelines with respect to animal care and welfare assurance. A detailed description of these methods is included in Supplemental Information.
RESULTS
A 76-gene EMT signature classifies NSCLC cell lines into distinct epithelial and mesenchymal groups
Using a training set of 54 NSCLC cell lines profiled on Affymetrix U133A, U133B, and Plus2.0 arrays, we selected genes for the EMT gene expression signature based on two criteria aimed at increasing the robustness and potential applicability of the signature across different platforms. First, we identified genes whose mRNA expression levels were either positively or negatively correlated with the single best probe for at least one of four putative EMT markers—E-cadherin (CDH1), vimentin (VIM), N-cadherin (CDH2), and/or fibronectin 1 (FN1) (see Supplemental Information for details). These markers were selected based on their previously established role as markers of EMT in lung cancer, as well as other epithelial tumors (15, 16, 24). From that set, we then selected only those genes whose mRNA expression followed a bimodal distribution pattern across the cell lines (bimodal index >1.5) (25). By limiting the EMT signature to genes expressed among the cell lines at either relatively high or low levels, but not in between, we expected to increase the likelihood that the signature could separate patient tumors into distinct epithelial and mesenchymal groups.
Using that approach, we identified 76 unique genes (the EMT signature) whose expression levels were (1) correlated with known EMT markers and (2) bimodally distributed (Fig 1, Supplemental Table 1). Most genes in the signature (63/76) were highly correlated (positively or negatively) with CDH1 and/or VIM. In contrast, only 10/76 signature genes were highly correlated with FN1 and 3/76 with CDH2. CDH2 itself did not meet the criterion for bimodal distribution across the NSCLC cells and therefore was not included in the final 76-gene signature.
Fig 1. The EMT gene expression signature separates NSCLC cell lines into distinct epithelial-like and mesenchymal-like groups independent of microarray platform.
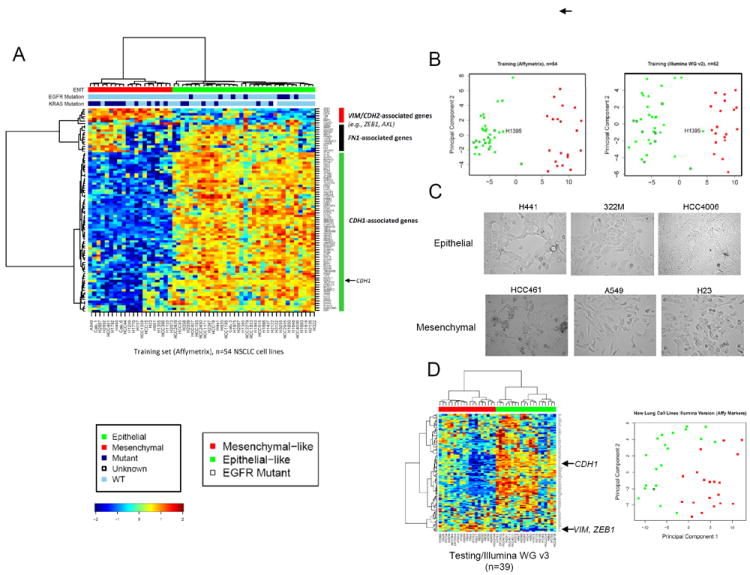
(A) Affymetrix probes corresponding to the EMT signature genes were clustered by two-way hierarchical clustering using Pearson correlation distance between genes (rows), Euclidean distance between cell lines (columns), and the Ward’s linkage rule. NSCLC cell lines separated into distinct epithelial (green bar) and mesenchymal (red bar) groups at the first major branching of the dendrogram. Mutation status for EGFR and KRAS are indicated by the color bars above the heatmap (dark blue=mutated, light blue=wild-type, white=unknown). EGFR mutations were seen only in the epithelial group. KRAS mutations were more common in the mesenchymal group and expressed higher levels of FN1 and FN1-associated genes. (B) Cell line classifications were concordant across platforms, with the exception of H1395 which switched from epithelial to mesenchymal group when arrayed on the Illumina WG v2 platform. First principal component analysis shows good separation of the epithelial and mesenchymal groups on both Affymetrix and Illumina platforms. (C) Characteristic differences in morphology are seen between lines characterized as epithelial or mesenchymal by the EMT signature. (D) In an independent set of 39 NSCLC cell lines profiled on a third platform (Illumina WGv3), the EMT signature separated cell lines into distinct epithelial (green) and mesenchymal (red) groups by hierarchical clustering and principal component analysis.
We then analyzed expression of the EMT signature in the training set using hierarchical clustering and principal component analysis. Clustering of the NSCLC lines based on their expression of signature genes separated them into distinct epithelial (n=34/54 cell lines) and mesenchymal (n=20/54) groups (Fig 1A). Cell lines in the mesenchymal group expressed higher levels of genes activated by EMT transcription factors ZEB1/2 and/or SNAIL1/2, including matrix metalloprotease-2 (MMP2) (26, 27), vimentin (28-30), and ZEB1 itself (a target of SNAIL) (31). Consistent with these findings, mesenchymal cell lines also expressed significantly higher levels of TGFB1, an inducer of SNAIL. AXL, a receptor tyrosine kinase that is overexpressed in breast and pancreatic cancers that have undergone EMT (32-34), was also more highly expressed in mesenchymal NSCLC cells. In contrast, epithelial lines had higher expression of genes repressed by ZEB1 and SNAIL, such as CDH1 (28, 29, 31, 35), the vesicle protein RAB25 (36), MUC1 (31), and claudins 4 (CLDN4) and 7 (CLDN7) (37). The EGFR family member ERBB3 and SPINT2, a regulator of HGF, were also expressed a higher levels in epithelial lines. Similar to the clustering results, first principal component analysis using the EMT signature also separated the cell lines into epithelial and mesenchymal groups (Fig 1B).
As expected, all nine EGFR-mutant cell lines in the training set were classified by the EMT signature as epithelial. Included were H1975 and H820, which carry the acquired-resistance mutation T790M (Fig 1A). In contrast, KRAS mutations were more common in mesenchymal lines, comprising 60% of that group (n=12/20), as compared with 18% of the epithelial cell lines (n=6/34) (p=0.014 by Fischer’s exact test, 95% confidence interval 0.42-0.76, odds ratio 0.19) (Fig 1A). There was also a trend towards more frequent loss of STK11 (LKB1) in mesenchymal cell lines (56%) versus in epithelial cells (27.6%) and more SMARCA4 mutations/deletions in mesenchymal cell lines (46% vs 15%), although these did not reach statistical significance possibly due to the small sample size (p=0.11 for both) (Supplemental Table 2). In contrast, CDKN2A and CDKN2B loss were more frequent in epithelial cell lines.
NSCLC cell lines in the training set included several histologies, although the predominant subtype was adenocarcinoma. Among 35 cell lines with adenocarcinoma histology, 29 (83%) had epithelial signatures, and only 8 (23%) had mesenchymal signatures. That is, the adenocarcinomas more commonly expressed an epithelial signature (p=0.0016 by chi-squared test). The four cell lines with squamous histology were evenly distributed between epithelial and mesenchymal- subsets, while lines with neuroendocrine, large cell, or large cell neuroendocrine all had mesenchymal signatures.
Validation on alternate array platforms and in an independent testing set
Because a major goal of this study was to develop a platform-independent signature, we next tested the performance of the EMT signature on a different microarray platform. Illumina WGv2 microarray data were available for 52 of the 54 NSCLC cell lines used in the original training set. As with the Affymetrix platform, distinct differences were observed in the expression of Illumina probes corresponding to the 76 EMT signature genes, as reflected by hierarchical clustering and first principal component analysis (Fig 1 B). Strikingly, classification as epithelial or mesenchymal agreed across the two platforms for 51 of the 52 cell lines tested, with only HCC1359 switching between groups (Fig 1 B).
The EMT signature was then tested in an independent set of NSCLC cell lines profiled on a third microarray platform (Illumina WG v3). 39 NSCLC cell lines that had not been included in the original training set were analyzed. As with the training set, the EMT signature separated these cell lines into distinct epithelial and mesenchymal groups by hierarchical clustering and principal component analysis (Fig 1D). Among these cell lines, only one contained a known EGFR mutation, and it was classified as epithelial (HCC4011).
Integrated proteomic analysis
Next, we performed an integrated proteomic analysis to identify major differences in protein expression between cell lines classified by the signature as epithelial (n=29) or mesenchymal (n=20). More than 200 total and phosphorylated proteins were measured by reverse phase protein array (RPPA), a highly quantitative assay that measures protein levels from cell lysates printed in a serial dilution series. Unsupervised hierarchical clustering of the cell lines based on their expression of all proteins demonstrated separation of the epithelial and mesenchymal cell lines (p=0.001 by Chi squared test), reflecting major differences in protein expression and signaling between epithelial and mesenchymal cells (Fig 2A). We then performed a supervised analysis comparing the expression of each protein between epithelial and mesenchymal cell lines by t-test. Not surprisingly, E-cadherin was the most significantly different between the groups (p<0.0001) with mean E-cadherin levels 7.42-fold higher in cell lines designated as epithelial as compared to mesenchymal (Fig 2B, C). The EMT first principal component was also highly correlated with E-cadherin protein expression (r= -0.90, corresponding p value <0.0001, 95% confidence interval [CI] 0.83-0.94) (Fig 2B). Similarly, the EMT first principal component calculated from the Illumina platform data also correlated strongly with E-cadherin (r=0.91, p<0.0001, CI 0.84-0.95). In the independent testing set of 39 NSCLC cell lines, protein data were available for only 14 lines. However, despite the small numbers, EMT first principal component again correlated well with E-cadherin protein (r=0.68, p=0.007). In contrast, correlation of E-cadherin protein with any single CDH1 probe was highly variable (r=0.37-0.86), supporting the rationale for using of a signature rather than any single gene to assess EMT from mRNA expression data (Supplemental Fig 3).
Fig 2. Integrated analysis of protein expression and the EMT signature.
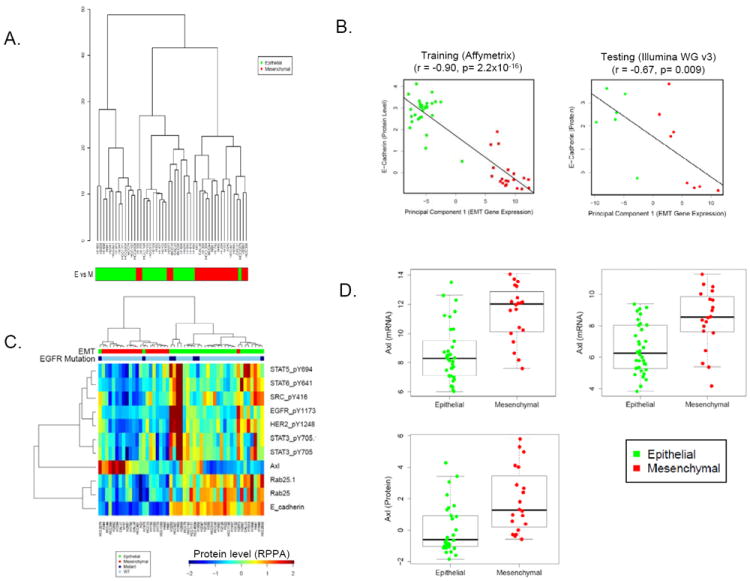
(A) RPPA analysis reveals that cell lines dichotomize into epitheial and mesenchymal groups based on their overall proteomic signature. (B) E-cadherin protein levels quantified by RPPA were strongly correlated with the EMT signature first principal component in the training and testing cell line sets. (C) Hierarchical clustering of proteins strongly associated with an epithelial or mesenchymal signature showed higher expression of EGFR pathway proteins and Rab25 in epithelial lines. (D) Axl expression was significantly higher in a subset of mesenchymal cell lines at the mRNA and protein levels.
Other proteins expressed at higher levels in epithelial cells lines included phosphorylated proteins in the EGFR pathway (e.g., pEGFR and pHER2 and downstream targets pSrc and pSTAT3, 5, and 6) (p<0.006) and Rab25 (p<0.0001) (Fig 2C). Rab25 is a trafficking protein involved with EGFR recycling. It was selected as one of the 76 EMT signature genes based on its strong correlation with CDH1 expression (r=0.8) and high bimodal index (BI=2.88, top 3% of signature genes). Rab25 protein was 1.5-fold higher in the epithelial group and correlated with E-cadherin protein at an r-value of 0.67. Although Rab25 has been described as a marker of EMT in breast cancer (33), this is the first time it has been associated with EMT in NSCLC.
Relatively few genes in the EMT signature were expressed at higher levels in the mesenchymal group, relative to the epithelial group. Among these, AXL mRNA expression correlated strongly with vimentin (r=0.60) and N-cadherin (r=0.54). Because Axl has previously been described as an EMT marker in breast and pancreatic cancer (32-34) and is a potential therapeutic target in NSCLC (38), we further investigated its expression at the protein level by RPPA. Consistent with the mRNA data, Axl protein expression was expressed at low levels in most epithelial lines, but highly expressed in a subset of mesenchymal cell lines (p=0.001 by t-test, 3.5-fold higher in mesenchymal) (Fig 2C,D).
The EMT gene signature predicts resistance to EGFR and PI3K inhibitors in vitro
Previously, E-cadherin expression has been associated with greater benefit from erlotinib in NSCLC patients (15-18). Therefore, we tested the association between our epithelial and mesenchymal classification and cell line sensitivity to erlotinib. Seventy-eight NSCLC cell lines derived from treatment-naïve patients were analyzed. Mesenchymal cell lines were highly resistant to erlotinib, with mean concentrations required for 50% cell growth inhibition (IC50) that were 3.7-fold higher in the mesenchymal cell lines (n=34) as compared to epithelial cell lines (n=44) (p=0.002 by t-test). (Fig 3, Supplemental Fig 4-5). Forty-five cell lines (29 epithelial and 16 mesenchymal) treated with gefinitib also showed greater sensitivity in the epithelial-like group (p=0.0003 by t-test, 5.5-fold difference in mean IC50 values) (Fig 3, Supplemental Fig 4-5). Although cell lines with EGFR activating mutations were among the most sensitive to erlotinib, in the subset of 40 cell lines (22 epithelial, 18 mesenchymal) with wild-type EGFR and wild-type KRAS, the correlation between EMT signature and erlotinib response was maintained, with significantly greater resistance in mesenchymal-like cell lines (p=0.023, 2-fold higher mean IC50 values). Importantly, the EMT signature was a better predictor of erlotinib response than were mRNA probe sets for individual genes such as CDH1 or VIM (Supplemental Fig 6).
Fig 3. Mesenchymal lines are significantly more resistant to EGFR inhibition and PI3K pathway inhibition but sensitive to Axl inhibition by SGI-7079.
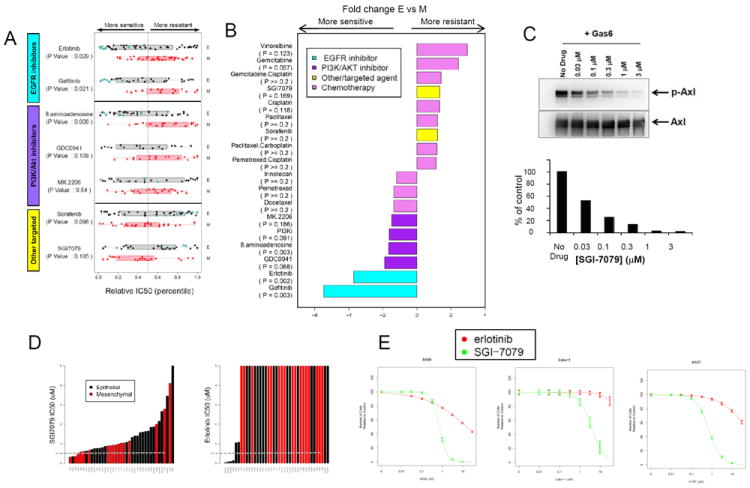
(A) Relative IC50 levels of targeted agents are shown with p-values corresponding to Wilcoxon rank sum test. (B) Fold difference between mean IC50s in epithelial (E) versus mesenchymal (M) cell lines. (C) SGI-7079 inhibits Gas6-induced Axl phosphorylation as shown by Western analysis. Densitometry histogram of the Western blot is graphed as the percentage of no drug treatment control of p-Axl relative to total Axl. The EC50 for SGI-7079 is < 100 nM. (D-E) Mesenchymal cell lines (red bars) are relatively more sensitive to SGI7079 whereas epithelial cell lines (black bars) are more sensitive to erlotinib. Gray bar (C) denotes 1uM concentration.
NSCLC cell lines with mesenchymal signatures were also more resistant to drugs targeting the PI3K/Akt pathway, such as the selective pan PI3K inhibitor GDC0941 (Fig 3B; p=0.068, 1.9-fold higher IC50) and 8-amino-adenosine, an adenosine analog that inhibits Akt/mTOR signaling (p=0.003, 1.7-fold higher IC50) (39, 40). A trend towards greater resistance was also seen in mesenchymal cells treated with the Akt selective inhibitor MK2206 (Fig 3B; p=0.18, 1.5-fold difference IC50), although these did not reach statistical significance. In contrast to EGFR and PI3K inhibitors, mesenchymal cells were not more resistant to other targeted agents, such as sorafenib (Fig 3B; p=0.33) or to commonly used cytotoxic chemotherapies, including pemetrexed, docetaxel, paclitaxel, and platinum-doublets (p-values ≥0.2). Instead, a trend towards greater relative sensitivity was seen in mesenchymal cells as compared to epithelial for cisplatin (p=0.11), gemcitabine (p=0.06), and vinorelbine (p=0.12) (Fig 3B). The observation of greater sensitivity in mesenchymal lines to some chemotherapies suggests that EMT is not a marker of pan-resistance, but may identify subgroups of cancers more or less likely to respond to inhibition by drugs with distinct pathway targeting or mechanisms of action.
Mesenchymal cells are sensitive to Axl inhibition
Because mesenchymal cell lines expressed higher levels of the receptor tyrosine kinase Axl, we next tested the activity of the Axl inhibitor SGI-7079 in mesenchymal versus epithelial NSCLC lines. As determined by Western analysis, SGI-7079 effectively inhibited Axl activation in the presence of exogenous Gas6 ligand (Fig 3C). In keeping with their higher target expression, mesenchymal cell lines were 1.3-fold more sensitive overall to Axl inhibition, although this did not reach statistical significance (p-value 0.17 by t-test) (Supplemental Fig 5). Next, we tested whether Axl inhibition could reverse mesenchymal cell resistance to EGFR inhibition, since Axl inhibition has been shown to reverse the mesenchymal phenotype in other epithelial cancers (34). Mesenchymal cell lines expressing Axl were treated with SGI-7079 alone, erlotinib alone, or SGI-7079 and erlotinib in combination. In cell lines expressing high levels of Axl, erlotinib alone had little or no effect on cell growth. Conversely, these same cell lines were highly sensitive to SGI-7079 alone. However, when combined, the addition of Axl inhibition (SGI-7079) to EGFR inhibition (erlotinib) resulted in a striking synergistic effect as demonstrated by the Chou-Talalay combination index (CI <1.0 at IC50 for combination, range 0.46-0.72) in four of six cell lines (Table 1) (41). In the two cell lines with highest Axl protein expression (Calu-1 and H2882), the combination was only synergistic at higher concentrations of SGI-7079, possibly reflecting a need for higher dosing in cells with higher expression levels of the target.
Table 1.
Axl inhibition reverses EGFR resistance in mesenchymal cell lines.
| A549 | Calu-1 | H157 | H1299 | H460 | H2882 | |
|---|---|---|---|---|---|---|
| Erlotinib IC50 (μM) | 13.54 | >100 | 48.50 | >100 | >100 | >100 |
| SG-Axl-I IC50 (μM) | 0.92 | 2.44 | 0.74 | 1.74 | 2.01 | 4.29 |
| CI @IC50 | 0.46 | >1.00* | 0.67 | 0.72 | 0.57 | >1.00* |
| Combination: Erlotinib + SG-Axl-I IC50 (μM) | 1.07 + 0.35 | 13.86 + 4.47 | 1.46 + 0.47 | 3.76 + 1.21 | 3.53 + 1.14 | 16.44 + 5.30 |
for Calu-1 and H2882, the combination was antagonistic at IC50 but synergistic at higher concentration of SG-Axl-i.
Axl blockade inhibits the growth of mesenchymal NSCLC tumors
We next tested the efficacy of SGI-7079 in a mouse xenograft model of NSCLC using the mesenchymal NSCLC cell line A549. Once the tumor volumes reached 100mm3, animals were randomized into treatment groups. SGI-7079 inhibited tumor growth in a dose dependent manner, and at the maximum dose, inhibited tumor growth by 67%, compared to control (ΔT/ΔC 33%; Fig 4A). The combined inhibition of Axl (SGI-7079) plus EGFR (erlotinib) was significantly more effective than either drug alone (p<0.001 vs erlotinib and p<0.001 vs SGI-7079 by t-test). Notably, SGI-7079 + erlotinib (25/100 mg/kg) reduced the tumor growth by 82% (ΔT/ΔC 18% T/C) (Fig 4B, Supplemental Table 3).
Fig 4. Axl blockade by SGI-7079 inhibits the growth of mesenchymal NSCLC xenograft tumors.
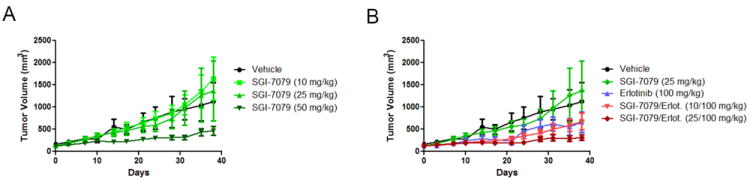
(A) Mean tumor volume for A549 xenografts implanted in mice treated with vehicle or SGI-7079. (B) Mean tumor volume for A549 xenografts in mice treated with vehicle and the combination of SGI-7079 plus erlotinib.
EMT signature in patients with relapsed or metastatic NSCLC
Finally, we tested the EMT signature in previously-treated NSCLC patients with advanced NSCLC enrolled in the BATTLE-1 trial (Biomarker-integrated Approaches of Targeted Therapy for Lung Cancer Elimination) (42). Consistent with what we observed in the cell lines—and despite all patients having advanced, metastatic disease—a majority of patients (approximately 2/3) showed epithelial signatures (Fig 5). However, unlike the cell lines, clinical samples with EGFR and KRAS mutations were distributed more evenly between the two groups, possibly because of prior therapy (e.g., previous EGFR inhibitors in EGFR mutant patients).
Fig 5. Improved 8-week disease control in BATTLE patients with epithelial signatures treated with erlotinib.
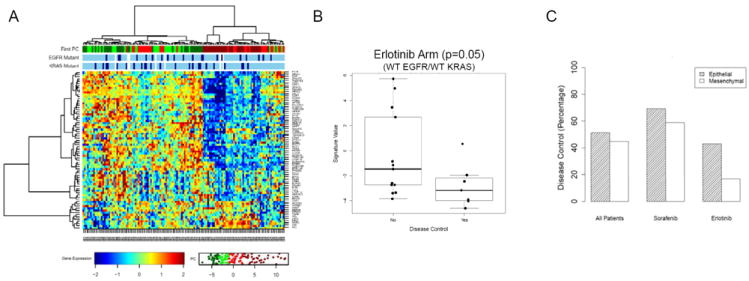
(A) BATTLE patients (all treatment arms) were classified as mesenchymal or epithelial-like based on the EMT signature. (B) Among patients with wild type EGFR and KRAS treated with erlotinib, 8-week disease control appeared superior in patients with more epithelial tumors (p=0.052). (C) There was no significant difference in 8 week disease control between epithelial and mesenchymal tumors in other treatment arms.
To assess the potential value of the EMT signature as a predictive marker of erlotinib response in patient tumors, we analyzed the association between EMT signature expression and clinical outcome. Analysis was limited to the EGFR wild type/KRAS wild type patients, since there are no validated markers of response to EGFR inhibitors in that group (whereas EGFR mutation is associated with response and KRAS mutation with resistance (3, 4, 43)). Although the numbers were small (n=20), EGFR/KRAS-wild type patients with disease control at eight weeks (the primary study endpoint) showed a more epithelial-like signature as compared with those without disease control, with the difference of borderline significance (p=0.05, by t-test). Six out of seven BATTLE patients with 8 week disease control had an epithelial EMT signature (defined as the first principal component of the EMT signature below the median), whereas only 1/5 patients with mesenchymal EMT signatures (principal components above the median) had disease control.
In contrast, among the full group of 101/139 clinically evaluable patients (all treatment arms), expression of EMT signature genes was not prognostic of 8-week disease control (p=0.40) or progression-free survival (PFS) in the overall group (all treatment arms), nor was it associated with differences in disease control in other individual treatment arms (e.g., sorafenib treated patients). These results suggest that the EMT signature may be a marker of erlotinib activity in EGFR wild-type/KRAS wild-type tumors, and not simply a prognostic marker of a less aggressive tumor phenotype.
Because of our interest in Axl targeting as a potential therapeutic approach in NSCLC, we also looked specifically at differences in Axl levels between BATTLE patients with mesenchymal and epithelial signatures. Axl mRNA levels were higher in mesenchymal patient tumors (p<0.01 by t-test). Even more strikingly, the Axl ligand GAS6 was markedly increased in these tumors (p<0.0001). Together, these data indicate that inhibiting GAS6 signaling through its receptor, Axl, might have therapeutic benefit within the subset of NSCLC patients with mesenchymal tumors.
DISCUSSION
In these studies, we developed and tested a robust EMT gene expression signature capable of assessing the degree to which NSCLC cells have undergone EMT status of NSCLC cells and tumors from patients. An integrated analysis of mRNA expression and proteomic data confirmed significant correlation of the EMT signature with E-cadherin protein levels. Additionally, higher expression of activated EGFR pathway proteins were observed in epithelial cell lines, while higher protein expression of the receptor tyrosine kinase Axl (a signature gene associated with EMT in other epithelial cancers) was seen in mesenchymal lines. Finally, we demonstrated differences in drug response between epithelial and mesenchymal cancers. Cell lines and/or patients classified by the EMT signature as mesenchymal were more resistant to drugs inhibiting EGFR or the PI3K/Akt pathway, but were more sensitive to certain chemotherapies and to the Axl inhibitor SGI-7079. Moreover, Axl inhibition reversed erlotinib resistance in a subset of mesenchymal cell lines, and in a mesenchymal xenograft model of NSCLC, combine blockade of Axl and EGFR was more effective at controlling tumor growth than inhibition of either single target.
A common limitation of gene expression signatures is their platform-dependence, resulting from the derivation of the signature on a specific microarray platform. One particular strength of the study presented here was the use of microarray data from two independent mRNA profiling platforms, Affymetrix and Illumina, for the initial development of the signature in the training cell lines. This strategy allowed us to identify the most robust probe set for four EMT markers (CDH1, VIM, CDH2, and FN1) which were then used to derive the 76-gene signature. The goal of selecting the best cross-platform probe sets was to increase the likelihood that the signature could be applied to samples profiled on different types of mRNA arrays and with emerging technologies such as RNA seq. The success of that approach was demonstrated in the independent testing sets, which included cell lines profiled on Illumina v2 and v3 arrays and patient tumors profiled on Affymetrix Human ST 1.0 arrays.
We believe that the use of cross-validated, robust probe sets to derive the EMT signature also led to a signature enriched for genes with biological relevance in EMT. Interestingly, the EMT first principal component correlated better with E-cadherin protein level than did even the best CDH1 RNA probe set. That observation supports our hypothesis that a signature incorporating several relevant markers is likely to be superior to any single marker for assessing complex biological processes such as EMT. In addition, higher expression of two of the signature genes, Rab25 in epithelial lines and Axl in mesenchymal lines, was confirmed at the protein level. Those two genes are established EMT markers in other cancer types (32-34). However, to our knowledge, this is the first time they have been demonstrated to be markers of EMT in NSCLC. This discovery has potential therapeutic implications, particularly for mesenchymal NSCLC, given the rapid predevelopment of that a number of Axl inhibitors are currently in development or clinical testing. In addition, the similarities we observed between our EMT signature and EMT markers in other tumor types suggests that our EMT signature may also be applicable in other epithelial tumors such as breast, colon, or head and neck.
Another important result of this study was that the EMT score predicted erlotinib sensitivity in both EGFR-mutant and EGFR-wild type NSCLC. Although the signature was derived in cell lines, it was validated in clinical samples where it successfully identified EGFR-wild type patients who benefitted from treatment with EGFR TKIs. Currently, activating mutations of EGFR are the only validated biomarkers of response to EGFR tyrosine kinase inhibitors in NSCLC. However, such mutations occur in only a minority of patients with NSCLC and cannot account for the subset of EGFR-wild type patients who have shown benefit from EGFR TKIs in several clinical trials (8-10). Therefore, our demonstration of greater clinical benefit from erlotinib in EGFR-wild type patients with tumors demonstrating an epithelial phenotype from the BATTLE study suggests that EMT may be a clinically relevant predictive marker for patients lacking mutations known to be associated with drug sensitivity (EGFR mutation) or resistance (KRAS mutation), meriting further investigation. Consistent with these findings, we observed significantly greater EGFR pathway activation in epithelial cell lines (both EGFR mutant and wild type) relative to mesenchymal lines in our protein analysis. Although the mechanism of activation in EGFR-wild type patients is not yet known, the greater frequency of EGFR pathway activation in epithelial-like NSCLC probably accounts for the trend towards greater sensitivity to erlotinib in the epithelial group.
Another major observation in this study was the significantly higher frequency of resistance to PI3K/AKT pathways inhibitors in mesenchymal cell lines. This was a class effect observed across four different drugs targeting this pathway. Coupled with the data from EGFR inhibitors, this suggests that mesenchymal cells may have decreased dependence on signaling from EGFR family of receptor tyrosine kinases and downstream signaling pathways. Several PI3K/AKT inhibitors are in clinical development for NSCLC. Therefore, the identification of a negative predictive signature that identifies a group of patients unlikely to benefit from the drug has immediate clinical implications. To test this possibility, the EMT signature will be assessed in the ongoing BATTLE-2 study, which includes treatment arms with erlotinib as well as two combinations with the AKT inhibitor MK2206. If the association between EMT and PI3K/AKT inhibitor resistance is confirmed in NSCLC patients, it may also have relevance for other epithelial tumors such as breast cancer where these drugs are also being investigated.
We also investigated whether EMT status predicted responsivenesss to standard chemotherapy agents used for NSCLC and other targeted agents. There was no association between EMT status and drug response for sorafenib and most chemotherapy drugs, indicating that the mesenchymal phenotype is not associated with pan-drug resistance. Gemcitabine and vinorelbine demonstrated a mesenchymal-bias with >2-fold lower median IC50 in mesenchymal compared with epithelial cells. These findings indicate that certain chemotherapeutics or targeted agents may have greater activity in mesenchymal-type tumors, and provides a starting point for developing combination regimens tailored for mesenchymal-type tumors.
Finally, Axl was identified in this study as a novel marker of EMT in NSCLC and represents a potential new therapeutic target for NSCLC. In the NSCLC cell lines, Axl inhibition showed greater activity in the mesenchymal group. Moreover, inhibition of Axl—which has been shown in other cancers models to decrease invasion, migration, and other behaviors characteristic of cancers that have undergone EMT (34)—sensitized otherwise-resistant mesenchymal NSCLC lines to the EGFR inhibitor erlotinib in vitro and in vivo in a xenograft model of mesenchymal NSCLC. This suggests that in addition to single agent activity, Axl inhibition may have a role in reversing EGFR inhibitor resistance. Importantly, following the submission of this manuscript, Zhang et al (44) reported increased activation of Axl and evidence for EMT using in vitro and in vivo EGFR-mutant lung cancer models with acquired resistance to erlotinib. In these models, Axl inhibition restored sensitivity to erlotinib. Taken together, these results support further investigation of combined Axl and EGFR inhibition in mesenchymal tumors and in acquired EGFR inhibitor resistance, which is in some cases associated with EMT.
In conclusion, the present study establishes a robust, cross-platform EMT signature capable of classifying NSCLC cell lines and patient tumors as epithelial-like or mesenchymal-like. The ability to classify such tumors accurately, independent of microarray platform, will assist with future investigations into the growing field of EMT. Furthermore, the mesenchymal phenotype identified here appears to be a negative predictor of response to drugs that target EGFR or the PI3K/Akt pathway. Finally, this analysis identifies the tyrosine kinase Axl as a novel EMT marker and potential mesenchymal-associated target for therapy of NSCLC.
Supplementary Material
STATEMENT OF TRANSLATIONAL SIGNIFICANCE.
Although some molecular markers such as EGFR mutations and ALK fusions have been identified in NSCLC that can be used to select patient therapy, there are still no validated predictive biomarkers for a majority of NSCLC patients. In this study, we investigated whether EMT influenced response to established (ex., EGFR inhibitors) and emerging (ex., PI3K inhibitors) targeted drugs in lung cancer cell lines and patient tumors. Our data suggest that a robust gene expression signature can identify mesenchymal NSCLC cancers that are likely to be resistant to certain chemotherapeutic agents and targeted therapies such as EGFR and PI3K/Akt inhibitors and reveals potential therapeutic strategies for targeting them. The receptor tyrosine kinase Axl, shown here for the first time as a novel EMT marker in NSCLC, has shown early potential as a therapeutic target in other epithelial cancers and should be further investigated in mesenchymal NSCLC.
Acknowledgments
Research Support: We would like to thank Emily C. Brantley, Ph.D. for editorial assistance. This work was supported by The University of Texas Southwestern Medical Center and The University of Texas MD Anderson Cancer Center Lung SPORE grant 5 P50 CA070907; DoD PROSPECT grant W81XWH-07-1-0306; DoD BATTLE grant W81XWH-06-1-0303 03; R01 CA168484-01; CCSG grant 5 P30 CA016672; Kleberg Center for Molecular Markers; Chapman Fund for Bioinformatics in Personalized Cancer Therapy, 1 U24 CA143883; and the E.L. Wiegand Foundation. LAB is supported in part by the AACR-AstraZeneca-Prevent Cancer Foundation Fellowship for Translational Lung Cancer Research and the Barbara Rattay Advanced Fellowship Program.
Affymetrix microarray results from the cell line training set were previously published and archived at the Gene Expression Omnibus repository (http://www.ncbi.nlm.nih.gov/geo/, GEO accession GSE4824).
Illumina v2 (GSE32989) and v3 (GSE32036) results have been deposited in the GEO repository and are available at the following private links (to made public upon publication)
Illumina v2 :
http://www.ncbi.nlm.nih.gov/geo/query/acc.cgi?token=lxatjamqwakaidw&acc=GSE32989
Illumina v3:
http://www.ncbi.nlm.nih.gov/geo/query/acc.cgi?token=pfiphqkackiyubo&acc=GSE32036
BATTLE array results have been deposited in the GEO repository (GSE33072) and are available at the following private links (to made public upon publication): http://www.ncbi.nlm.nih.gov/geo/query/acc.cgi?token=xfwnxqsygocaajg&acc=GSE33072
Footnotes
Conflict of Interest: DJB and SLW are employed by Tolero Pharmaceuticals, Inc. JMK is employed by and has ownership interest in Astex Pharmaceuticals, Inc. SBK is employed by Astex Pharmaceuticals, Inc.
References
- 1.Koivunen JP, Mermel C, Zejnullahu K, Murphy C, Lifshits E, Holmes AJ, et al. EML4-ALK fusion gene and efficacy of an ALK kinase inhibitor in lung cancer. Clin Cancer Res. 2008;14:4275–83. doi: 10.1158/1078-0432.CCR-08-0168. [DOI] [PMC free article] [PubMed] [Google Scholar]
- 2.Pao W, Miller V, Zakowski M, Doherty J, Politi K, Sarkaria I, et al. EGF receptor gene mutations are common in lung cancers from “never smokers” and are associated with sensitivity of tumors to gefitinib and erlotinib. Proc Natl Acad Sci U S A. 2004;101:13306–11. doi: 10.1073/pnas.0405220101. [DOI] [PMC free article] [PubMed] [Google Scholar]
- 3.Lynch TJ, Bell DW, Sordella R, Gurubhagavatula S, Okimoto RA, Brannigan BW, et al. Activating mutations in the epidermal growth factor receptor underlying responsiveness of non-small-cell lung cancer to gefitinib. N Engl J Med. 2004;350:2129–39. doi: 10.1056/NEJMoa040938. [DOI] [PubMed] [Google Scholar]
- 4.Paez JG, Janne PA, Lee JC, Tracy S, Greulich H, Gabriel S, et al. EGFR mutations in lung cancer: correlation with clinical response to gefitinib therapy. Science. 2004;304:1497–500. doi: 10.1126/science.1099314. [DOI] [PubMed] [Google Scholar]
- 5.Tokumo M, Toyooka S, Kiura K, Shigematsu H, Tomii K, Aoe M, et al. The relationship between epidermal growth factor receptor mutations and clinicopathologic features in non-small cell lung cancers. Clin Cancer Res. 2005;11:1167–73. [PubMed] [Google Scholar]
- 6.Cappuzzo F, Hirsch FR, Rossi E, Bartolini S, Ceresoli GL, Bemis L, et al. Epidermal growth factor receptor gene and protein and gefitinib sensitivity in non-small-cell lung cancer. J Natl Cancer Inst. 2005;97:643–55. doi: 10.1093/jnci/dji112. [DOI] [PubMed] [Google Scholar]
- 7.Soda M, Choi YL, Enomoto M, Takada S, Yamashita Y, Ishikawa S, et al. Identification of the transforming EML4-ALK fusion gene in non-small-cell lung cancer. Nature. 2007;448:561–6. doi: 10.1038/nature05945. [DOI] [PubMed] [Google Scholar]
- 8.Bell DW, Lynch TJ, Haserlat SM, Harris PL, Okimoto RA, Brannigan BW, et al. Epidermal growth factor receptor mutations and gene amplification in non-small-cell lung cancer: molecular analysis of the IDEAL/INTACT gefitinib trials. J Clin Oncol. 2005;23:8081–92. doi: 10.1200/JCO.2005.02.7078. [DOI] [PubMed] [Google Scholar]
- 9.Zhu CQ, da Cunha Santos G, Ding K, Sakurada A, Cutz JC, Liu N, et al. Role of KRAS and EGFR as biomarkers of response to erlotinib in National Cancer Institute of Canada Clinical Trials Group Study BR.21. J Clin Oncol. 2008;26:4268–75. doi: 10.1200/JCO.2007.14.8924. [DOI] [PubMed] [Google Scholar]
- 10.Mok TS, Wu YL, Thongprasert S, Yang CH, Chu DT, Saijo N, et al. Gefitinib or carboplatin-paclitaxel in pulmonary adenocarcinoma. The New England journal of medicine. 2009;361:947–57. doi: 10.1056/NEJMoa0810699. [DOI] [PubMed] [Google Scholar]
- 11.Huber MA, Kraut N, Beug H. Molecular requirements for epithelial-mesenchymal transition during tumor progression. Curr Opin Cell Biol. 2005;17:548–58. doi: 10.1016/j.ceb.2005.08.001. [DOI] [PubMed] [Google Scholar]
- 12.Thiery JP. Epithelial-mesenchymal transitions in tumour progression. Nat Rev Cancer. 2002;2:442–54. doi: 10.1038/nrc822. [DOI] [PubMed] [Google Scholar]
- 13.Thiery JP, Acloque H, Huang RY, Nieto MA. Epithelial-mesenchymal transitions in development and disease. Cell. 2009;139:871–90. doi: 10.1016/j.cell.2009.11.007. [DOI] [PubMed] [Google Scholar]
- 14.Hugo H, Ackland ML, Blick T, Lawrence MG, Clements JA, Williams ED, et al. Epithelial--mesenchymal and mesenchymal--epithelial transitions in carcinoma progression. J Cell Physiol. 2007;213:374–83. doi: 10.1002/jcp.21223. [DOI] [PubMed] [Google Scholar]
- 15.Yauch RL, Januario T, Eberhard DA, Cavet G, Zhu W, Fu L, et al. Epithelial versus mesenchymal phenotype determines in vitro sensitivity and predicts clinical activity of erlotinib in lung cancer patients. Clin Cancer Res. 2005;11:8686–98. doi: 10.1158/1078-0432.CCR-05-1492. [DOI] [PubMed] [Google Scholar]
- 16.Thomson S, Buck E, Petti F, Griffin G, Brown E, Ramnarine N, et al. Epithelial to mesenchymal transition is a determinant of sensitivity of non-small-cell lung carcinoma cell lines and xenografts to epidermal growth factor receptor inhibition. Cancer Res. 2005;65:9455–62. doi: 10.1158/0008-5472.CAN-05-1058. [DOI] [PubMed] [Google Scholar]
- 17.Frederick BA, Helfrich BA, Coldren CD, Zheng D, Chan D, Bunn PA, Jr, et al. Epithelial to mesenchymal transition predicts gefitinib resistance in cell lines of head and neck squamous cell carcinoma and non-small cell lung carcinoma. Mol Cancer Ther. 2007;6:1683–91. doi: 10.1158/1535-7163.MCT-07-0138. [DOI] [PubMed] [Google Scholar]
- 18.Nikolova DA, Asangani IA, Nelson LD, Hughes DP, Siwak DR, Mills GB, et al. Cetuximab attenuates metastasis and u-PAR expression in non-small cell lung cancer: u-PAR and E-cadherin are novel biomarkers of cetuximab sensitivity. Cancer Res. 2009;69:2461–70. doi: 10.1158/0008-5472.CAN-08-3236. [DOI] [PubMed] [Google Scholar]
- 19.Witta SE, Gemmill RM, Hirsch FR, Coldren CD, Hedman K, Ravdel L, et al. Restoring E-cadherin expression increases sensitivity to epidermal growth factor receptor inhibitors in lung cancer cell lines. Cancer Res. 2006;66:944–50. doi: 10.1158/0008-5472.CAN-05-1988. [DOI] [PubMed] [Google Scholar]
- 20.Ramirez RD, Sheridan S, Girard L, Sato M, Kim Y, Pollack J, et al. Immortalization of human bronchial epithelial cells in the absence of viral oncoproteins. Cancer Res. 2004;64:9027–34. doi: 10.1158/0008-5472.CAN-04-3703. [DOI] [PubMed] [Google Scholar]
- 21.Phelps RM, Johnson BE, Ihde DC, Gazdar AF, Carbone DP, McClintock PR, et al. NCI-Navy Medical Oncology Branch cell line data base. J Cell Biochem Suppl. 1996;24:32–91. doi: 10.1002/jcb.240630505. [DOI] [PubMed] [Google Scholar]
- 22.Gandhi J, Zhang J, Xie Y, Soh J, Shigematsu H, Zhang W, et al. Alterations in genes of the EGFR signaling pathway and their relationship to EGFR tyrosine kinase inhibitor sensitivity in lung cancer cell lines. PLoS One. 2009;4:e4576. doi: 10.1371/journal.pone.0004576. [DOI] [PMC free article] [PubMed] [Google Scholar]
- 23.Byers LA, Sen B, Saigal B, Diao L, Wang J, Nanjundan M, et al. Reciprocal regulation of c-Src and STAT3 in non-small cell lung cancer. Clin Cancer Res. 2009;15:6852–61. doi: 10.1158/1078-0432.CCR-09-0767. [DOI] [PMC free article] [PubMed] [Google Scholar]
- 24.Gemmill RM, Roche J, Potiron VA, Nasarre P, Mitas M, Coldren CD, et al. ZEB1-responsive genes in non-small cell lung cancer. Cancer Lett. 2011;300:66–78. doi: 10.1016/j.canlet.2010.09.007. [DOI] [PMC free article] [PubMed] [Google Scholar]
- 25.Wang J, Wen S, Symmans WF, Pusztai L, Coombes KR. The bimodality index: a criterion for discovering and ranking bimodal signatures from cancer gene expression profiling data. Cancer Inform. 2009;7:199–216. doi: 10.4137/cin.s2846. [DOI] [PMC free article] [PubMed] [Google Scholar]
- 26.Miyoshi A, Kitajima Y, Sumi K, Sato K, Hagiwara A, Koga Y, et al. Snail and SIP1 increase cancer invasion by upregulating MMP family in hepatocellular carcinoma cells. Br J Cancer. 2004;90:1265–73. doi: 10.1038/sj.bjc.6601685. [DOI] [PMC free article] [PubMed] [Google Scholar]
- 27.Yokoyama K, Kamata N, Fujimoto R, Tsutsumi S, Tomonari M, Taki M, et al. Increased invasion and matrix metalloproteinase-2 expression by Snail-induced mesenchymal transition in squamous cell carcinomas. Int J Oncol. 2003;22:891–8. [PubMed] [Google Scholar]
- 28.Cano A, Perez-Moreno MA, Rodrigo I, Locascio A, Blanco MJ, del Barrio MG, et al. The transcription factor snail controls epithelial-mesenchymal transitions by repressing E-cadherin expression. Nat Cell Biol. 2000;2:76–83. doi: 10.1038/35000025. [DOI] [PubMed] [Google Scholar]
- 29.Eger A, Aigner K, Sonderegger S, Dampier B, Oehler S, Schreiber M, et al. DeltaEF1 is a transcriptional repressor of E-cadherin and regulates epithelial plasticity in breast cancer cells. Oncogene. 2005;24:2375–85. doi: 10.1038/sj.onc.1208429. [DOI] [PubMed] [Google Scholar]
- 30.Bindels S, Mestdagt M, Vandewalle C, Jacobs N, Volders L, Noel A, et al. Regulation of vimentin by SIP1 in human epithelial breast tumor cells. Oncogene. 2006;25:4975–85. doi: 10.1038/sj.onc.1209511. [DOI] [PubMed] [Google Scholar]
- 31.Guaita S, Puig I, Franci C, Garrido M, Dominguez D, Batlle E, et al. Snail induction of epithelial to mesenchymal transition in tumor cells is accompanied by MUC1 repression and ZEB1 expression. J Biol Chem. 2002;277:39209–16. doi: 10.1074/jbc.M206400200. [DOI] [PubMed] [Google Scholar]
- 32.Gjerdrum C, Tiron C, Hoiby T, Stefansson I, Haugen H, Sandal T, et al. Axl is an essential epithelial-to-mesenchymal transition-induced regulator of breast cancer metastasis and patient survival. Proceedings of the National Academy of Sciences of the United States of America. 107:1124–9. doi: 10.1073/pnas.0909333107. [DOI] [PMC free article] [PubMed] [Google Scholar]
- 33.Vuoriluoto K, Haugen H, Kiviluoto S, Mpindi JP, Nevo J, Gjerdrum C, et al. Vimentin regulates EMT induction by Slug and oncogenic H-Ras and migration by governing Axl expression in breast cancer. Oncogene. 30:1436–48. doi: 10.1038/onc.2010.509. [DOI] [PubMed] [Google Scholar]
- 34.Koorstra JB, Karikari CA, Feldmann G, Bisht S, Rojas PL, Offerhaus GJ, et al. The Axl receptor tyrosine kinase confers an adverse prognostic influence in pancreatic cancer and represents a new therapeutic target. Cancer Biol Ther. 2009;8:618–26. doi: 10.4161/cbt.8.7.7923. [DOI] [PMC free article] [PubMed] [Google Scholar]
- 35.Batlle E, Sancho E, Franci C, Dominguez D, Monfar M, Baulida J, et al. The transcription factor snail is a repressor of E-cadherin gene expression in epithelial tumour cells. Nat Cell Biol. 2000;2:84–9. doi: 10.1038/35000034. [DOI] [PubMed] [Google Scholar]
- 36.De Craene B, Gilbert B, Stove C, Bruyneel E, van Roy F, Berx G. The transcription factor snail induces tumor cell invasion through modulation of the epithelial cell differentiation program. Cancer research. 2005;65:6237–44. doi: 10.1158/0008-5472.CAN-04-3545. [DOI] [PubMed] [Google Scholar]
- 37.Ikenouchi J, Matsuda M, Furuse M, Tsukita S. Regulation of tight junctions during the epithelium-mesenchyme transition: direct repression of the gene expression of claudins/occludin by Snail. J Cell Sci. 2003;116:1959–67. doi: 10.1242/jcs.00389. [DOI] [PubMed] [Google Scholar]
- 38.Ye X, Li Y, Stawicki S, Couto S, Eastham-Anderson J, Kallop D, et al. An anti-Axl monoclonal antibody attenuates xenograft tumor growth and enhances the effect of multiple anticancer therapies. Oncogene. 29:5254–64. doi: 10.1038/onc.2010.268. [DOI] [PubMed] [Google Scholar]
- 39.Dennison JB, Shanmugam M, Ayres ML, Qian J, Krett NL, Medeiros LJ, et al. 8-Aminoadenosine inhibits Akt/mTOR and Erk signaling in mantle cell lymphoma. Blood. 116:5622–30. doi: 10.1182/blood-2010-05-285866. [DOI] [PMC free article] [PubMed] [Google Scholar]
- 40.Ghias K, Ma C, Gandhi V, Platanias LC, Krett NL, Rosen ST. 8-Amino-adenosine induces loss of phosphorylation of p38 mitogen-activated protein kinase, extracellular signal-regulated kinase 1/2, and Akt kinase: role in induction of apoptosis in multiple myeloma. Mol Cancer Ther. 2005;4:569–77. doi: 10.1158/1535-7163.MCT-04-0303. [DOI] [PubMed] [Google Scholar]
- 41.Chou TC, Talalay P. Quantitative analysis of dose-effect relationships: the combined effects of multiple drugs or enzyme inhibitors. Adv Enzyme Regul. 1984;22:27–55. doi: 10.1016/0065-2571(84)90007-4. [DOI] [PubMed] [Google Scholar]
- 42.Kim ES HR, Wistuba II, Lee JJ, Blumenschein Gr, Tsao A, Stewart DJ, Hicks ME, Erasmus J, Gupta S, Alden CM, Liu S, Tang X, Khuri FR, Trans HT, Johnson BE, Heymach JV, Mao L, Fossella F, Lies M, Papadimitrakopoulou V, Davis SE, Lippman SM, Hong WK. The BATTLE Trial: Personalizing Therapy for Lung Cancer. Cancer Discovery. 2011;1:43–51. doi: 10.1158/2159-8274.CD-10-0010. [DOI] [PMC free article] [PubMed] [Google Scholar]
- 43.Eberhard DA, Johnson BE, Amler LC, Goddard AD, Heldens SL, Herbst RS, et al. Mutations in the epidermal growth factor receptor and in KRAS are predictive and prognostic indicators in patients with non-small-cell lung cancer treated with chemotherapy alone and in combination with erlotinib. J Clin Oncol. 2005;23:5900–9. doi: 10.1200/JCO.2005.02.857. [DOI] [PubMed] [Google Scholar]
- 44.Zhang Z, Lee JC, Lin L, Olivas V, Au V, Laframboise T, et al. Activation of the AXL kinase causes resistance to EGFR-targeted therapy in lung cancer. Nat Genet. 2012;44:852–60. doi: 10.1038/ng.2330. [DOI] [PMC free article] [PubMed] [Google Scholar]
Associated Data
This section collects any data citations, data availability statements, or supplementary materials included in this article.