

Abstract
Sub-Saharan Africa has been identified as the part of the world with the greatest human genetic diversity. This high level of diversity causes difficulties for genome-wide association (GWA) studies in African populations—for example, by reducing the accuracy of genotype imputation in African populations compared to non-African populations. Here, we investigate haplotype variation and imputation in Africa, using 253 unrelated individuals from 15 Sub-Saharan African populations. We identify the populations that provide the greatest potential for serving as reference panels for imputing genotypes in the remaining groups. Considering reference panels comprising samples of recent African descent in Phase 3 of the HapMap Project, we identify mixtures of reference groups that produce the maximal imputation accuracy in each of the sampled populations. We find that optimal HapMap mixtures and maximal imputation accuracies identified in detailed tests of imputation procedures can instead be predicted by using simple summary statistics that measure relationships between the pattern of genetic variation in a target population and the patterns in potential reference panels. Our results provide an empirical basis for facilitating the selection of reference panels in GWA studies of diverse human populations, especially those of African ancestry. Genet. Epidemiol. 35:766–780, 2011.
Keywords: haplotype variation, imputation, linkage disequilibrium
Introduction
Africa has consistently been identified as the part of the world where the level of human genetic variation is greatest [e.g., Bowcock et al., 1994; Stephens et al., 2001; Ramachandran et al., 2005; Tishkoff et al., 2009], and genomic studies have also confirmed that African populations have the lowest levels of linkage disequilibrium [LD; Reich et al., 2001; Tishkoff and Kidd, 2004; Conrad et al., 2006; Jakobsson et al., 2008]. The high diversity and low LD in Africa in turn influence the design and analysis of genome-wide association (GWA) studies in African populations [Rosenberg et al., 2010; Teo et al., 2010].
Recent strategies for finding causal variants that underlie common diseases have been based on LD, or the nonrandom association of variants at separate genetic loci. Because of shared inheritance of single-nucleotide polymorphism (SNP) variants at neighboring sites, an association detected between disease status and genotypes at a marker can indicate the presence of a nearby disease-susceptibility locus. Thus, highly informative “tag SNPs” that show considerable LD with other SNPs in the genome have been used as markers for finding disease associations.
The general utility of the tag-SNP approach is partly determined by the portability of tag SNPs, the extent to which tag SNPs chosen based on haplotypic patterns in a reference population perform in identifying disease genes in study populations whose patterns of haplotype variation differ from those of reference populations. Tag-SNP portability has been shown to be affected primarily by the level of LD in the study population, with genetic similarity of the reference and study populations playing a less critical but still important role [Conrad et al., 2006]. Thus, for populations that have relatively low levels of LD and that are genetically different from standard reference groups—a class of populations that include much of Sub-Saharan Africa—the tag-SNP approach is less effective than for other populations.
Improved designs for GWA studies have recently used LD patterns to impute genetic variants that have not been genotyped in the study sample but that have been genotyped in a reference panel. Imputation of unknown variants, followed by testing of these variants for disease association, has been shown to improve the genomic coverage and statistical power of GWA studies [e.g., Marchini et al., 2007; Servin and Stephens, 2007; Li et al., 2009]. Investigations of genotype imputation in worldwide populations, however, suggest that imputation accuracy is low in most African populations, again owing largely to low levels of LD and high levels of genetic diversity [Huang et al., 2009a; Teo et al., 2010]. This decreased imputation accuracy in turn can substantially inflate the sample size required for maintaining power in imputation-based GWA studies in African populations [Huang et al., 2009b].
Despite the reduced tag-SNP portability and imputation accuracy in African populations, data on patterns of haplotype variation in Africa and their applications to the design of GWA studies are relatively scarce. In this study, we extend the characterization of African haplotype diversity and LD to a total of 15 Sub-Saharan African populations, and we perform an investigation of imputation in African populations. The combination of high levels of genetic variation, low levels of LD, and large numbers of private haplotypes in African populations makes imputation of untyped markers particularly challenging in Africans. We examine a variety of imputation designs in African populations, and by considering summary statistics on patterns of haplotype variation, we demonstrate a close relationship between maximal imputation accuracy and statistics that measure different forms of genetic similarity between samples from a target African population and those available in reference panels.
Results
Data
We considered a dataset of 1,107 individuals from 63 populations worldwide, including 15 Sub-Saharan African populations. Each individual was genotyped for 2,810 SNPs spread across 36 genomic regions: 16 on chromosome 21, 16 on other autosomes, and 4 on the nonpseudoautosomal part of the X chromosome. Each region was designed to contain a core of 60 SNPs genotyped at high density, with 12 SNPs at lower density extending in each direction away from the core. This set of genomic regions was originally chosen to represent the range of recombination rates and gene densities present in the human genome, and most SNPs were selected among those discovered in multiethnic panels [Conrad et al., 2006]. The dataset subsumes the dataset of Pemberton et al. [2008] on 957 individuals from 55 populations (see Materials And Methods), and the 150 newly genotyped individuals (Table I) represent eight Sub-Saharan African populations chosen to provide a geographically and genetically diverse subset among the samples of Tishkoff et al. [2009]. Our investigations focus primarily on the 15 Sub-Saharan African populations.
Table I. Eight newly genotyped African populations incorporated in the study.
| Population | Sampling location | Language family | Sample size |
|---|---|---|---|
| 1. The Beja and Fulani samples are from the Tishkoff et al. [2009] Hadandawa Beja and Mbororo Fulani samples, respectively. | |||
| Beja | Sudan | Afroasiatic | 20 |
| Borana | Kenya | Afroasiatic | 18 |
| Fulani | Cameroon | Niger-Kordofanian | 19 |
| Hadza | Tanzania | Khoesan | 18 |
| Iraqw | Tanzania | Afroasiatic | 18 |
| Mada | Cameroon | Afroasiatic | 19 |
| Sandawe | Tanzania | Khoesan | 20 |
| Sengwer | Kenya | Nilo-Saharan | 18 |
For some analyses of imputation in study populations on the basis of external reference panels, the 1,107 individuals were augmented with 901 unrelated individuals from 11 populations in release 2 of Phase 3 of the International Haplotype Map Project [International HapMap 3 Consortium, 2010], representing a subset of the collection of 1,117 unrelated individuals in HapMap Phase 3 release 3 that was described by Pemberton et al. [2010]. In these HapMap individuals, 517 markers were considered, all of which were located on chromosome 21 and typed in both the 63 study populations and the 11 HapMap populations. The HapMap Phase 3 data contain four groups with significant recent African ancestry: ASW (African Americans from the southwest of the USA), LWK (Luhya from Webuye, Kenya), MKK (Maasai from Kinyawa, Kenya), and YRI (Yoruba from Ibadan, Nigeria). We constructed all 24−1 = 15 possible mixtures of one or more among the four HapMap groups, and considered each of these panels as reference data for imputation in the 15 Sub-Saharan African target populations.
Haplotype Variation
We assessed several aspects of haplotype variation, including “haplotype flow,” private haplotypes, LD, and haplotype sharing between sampled populations and HapMap reference populations. These various computations are used later in explaining the outcomes of genotype-imputation experiments.
Haplotype Flow
Using the sample-size-corrected z-statistic of Conrad et al. [2006], we computed pairwise haplotype sharing between major geographic regions—Sub-Saharan Africa, the Middle East (and North Africa), Europe, Central/South Asia, Oceania, and the Americas. For a fixed haplotype length, this statistic measures the fraction of haplotypes in a sample of specified size from one population that are also found in a second population. It can be viewed either as a measure of “outward haplotype flow” for the second population, quantifying the extent to which this population could have contributed haplotypes to the first population, or alternatively, as a measure of “inward haplotype flow” for the first population.
As was observed by Conrad et al. [2006], the outward haplotype flow from Sub-Saharan Africa (henceforth sometimes abbreviated to “Africa”) to each of the other regions exceeds the corresponding inward haplotype flow (Fig. 1). Haplotype sharing between regions is lower when comparing Africa to other regions than when comparing most pairs of non-African regions. Consistently across haplotype lengths, haplotype sharing between Africa and other regions is greater when the full set of 15 African populations is used than when using the seven previously sampled African populations alone. It is possible that the newly sampled populations, most of which were sampled in East Africa, represent the groups that migrated out of Africa more closely than do the previously sampled groups, thereby producing increased haplotype sharing with non-Africans. Indeed, some of these populations, including Beja, Borana, and Fulani, have been observed to partially cluster with Middle Eastern populations in analyses of population structure [Tishkoff et al., 2009].
Figure 1.

Schematic world map of haplotype variation. (A) Haplotype sharing on the basis of the data from Pemberton et al. [2008]. (B) Haplotype sharing after including eight newly sampled African populations. The mean number of haplotypes per genomic core region in a sample size of 54 chromosomes is written for each geographic region. Links entering a geographic region indicate the percentages of distinct haplotypes from the geographic region found in other regions and are drawn proportionately in width. For example, in part A, on average 10% of haplotypes observed in Europe are found in Africa (18% in part B), whereas 6% of African haplotypes are found in Europe (10% in part B). The links can be viewed as a description of haplotype “flow”: for example, 10% (18%) gives a measurement of the proportion of distinct European haplotypes that could have come from Africa (without mutation or recombination), and 6% (10%) gives the proportion of African haplotypes that could have come from Europe. We used 1,800 core SNPs to generate the figure.
Private haplotypes
For each geographic region, we computed the number of private haplotypes found only in that region. Our computations used a rarefaction approach [Kalinowski, 2004; Conrad et al., 2006] to adjust for differences in sample sizes across regions. We observe much larger numbers of private haplotypes in Africa than in non-African regions (Fig. 2A), consistent with greater levels of diversity and lower LD in Africa. For example, in a sample of 54 chromosomes, for haplotypes of length 25 kb, we find on average 7.35 private haplotypes in Africa, whereas we only find on average 1.71 private haplotypes in the Middle East, and even fewer in the other regions. Within Africa, the greatest numbers of private haplotypes are found in hunter-gatherer populations, such as the San, Biaka Pygmy, and Mbuti Pygmy groups (Fig. 2B). These three populations do not stand out in other aspects of diversity, however, as they do not have particularly large numbers of distinct haplotypes (Fig. S1) or high haplotype heterozygosity (Fig. S2).
Figure 2.
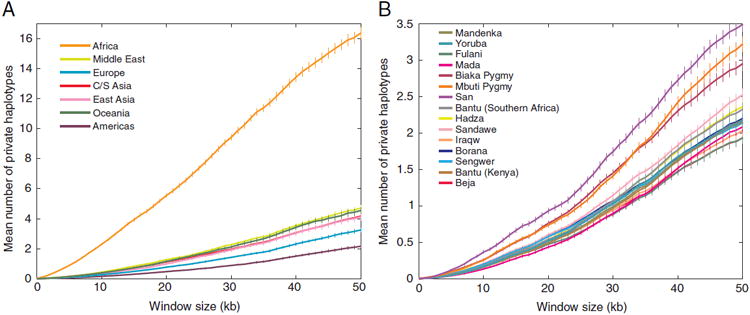
Numbers of private haplotypes. (A) The number of private haplotypes in each geographic region as a function of haplotype length. Sample sizes were adjusted to represent 54 chromosomes from each geographic region. (B) The number of private haplotypes in each African population as a function of haplotype length. Sample sizes were adjusted to represent 12 chromosomes from each population. Error bars represent the standard error of the mean across haplotype-loci.
Linkage disequilibrium
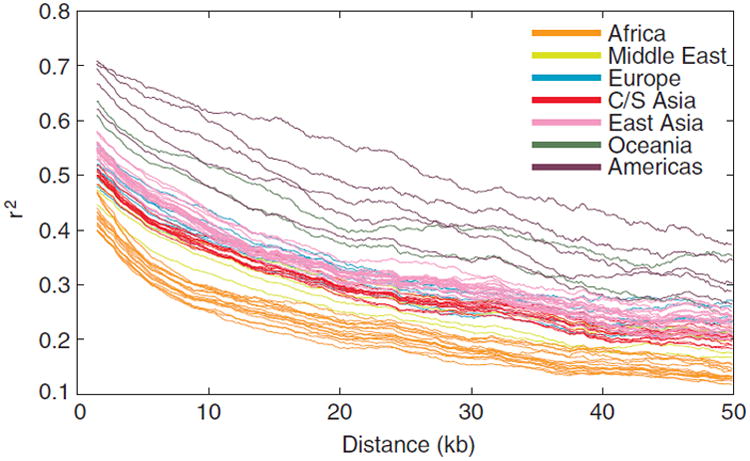
LD, as measured by mean r2 values for SNP pairs in physical distance bins, declines with increasing physical distance between SNPs for all 63 populations (Fig. 3). African populations have the lowest levels of LD, followed by populations from the Middle East, Central/South Asia, Europe, East Asia, Oceania, and the Americas. For example, for SNPs with minor allele frequency 0.05 or greater, mean r2 across African populations, when calculated for all SNP pairs in bins of width 6 kb, drops below 0.4 at a distance of 2.5 kb. The corresponding distances at which mean r2 first drops below 0.4 are 5.2, 7.1, 9.6, 10.5, 19.2, and 33.3 kb for the populations of the Middle East, Central/South Asia, Europe, East Asia, Oceania, and the Americas, respectively. Thus, considering a larger sample of Sub-Saharan African populations than in most previous studies, we continue to find comparatively low LD in African populations.
Figure 3.

Linkage disequilibrium (LD) vs. physical distance. r2 was calculated for each pair of SNPs with minor allele frequency greater than or equal to 0.05. The mean r2 within a bin is plotted as a function of the mean of the distance between pairs of SNPs within the bin. The bin size was 6 kb. Lines for individual populations are color-coded by geographic region.
Haplotype sharing with the HapMap
Using a statistic that measures the extent to which the common haplotypes in one population are also common in a second population, Conrad et al. [2006] found that the HapMap Phase 2 data capture common haplotypes relatively well in most groups, with the primary exception of African populations. Employing this same statistic, an expanded dataset with additional African populations, and the newer HapMap Phase 3 data, we continue to observe that for African populations, levels of sharing for common 50 kb haplotypes (>10% frequency) with HapMap Phase 3 are significantly lower than corresponding levels of sharing with HapMap Phase 3 for non-African populations (P<0.0001, one-sided Wilcoxon rank-sum test).
Figure 4 shows the fraction of common haplotypes in individual populations that are also common in the HapMap Phase 3 populations, demonstrating that the most similar HapMap group for a population is generally found in the same or the closest geographic region. Although common haplotypes of several African populations (San, Mbuti Pygmy, and Biaka Pygmy) continue to have the greatest difference from those of the individual HapMap populations, similarly to the observation of Conrad et al. [2006], they can generally be better captured by pooled collections consisting of two or more HapMap Phase 3 populations than by the HapMap populations individually (Fig. 5). In particular, testing the difference in haplotype sharing for common 50 kb haplotypes in African populations with the combination panels that achieve the maximal haplotype sharing (among the 15 combinations of one or more HapMap Phase 3 populations of African descent) and with the HapMap Phase 3 YRI panel, sharing is significantly greater with the combination panels than with the YRI panel alone (P<0.0001, one-sided Wilcoxon signed-rank test).
Figure 4.
The fraction of common haplotypes in individual populations that are also common in the HapMap. For each plot we used haplotypes based on the 517 SNPs that overlap between HapMap Phase 3 and our autosomal core regions on chromosome 21. We first averaged over all haplotype-loci within each core region and then averaged across the core regions for windows of a given length. Each curve shows the fraction of the common haplotypes of a population (with >10% frequency) that are also common in a HapMap sample. The lower right plot shows for each population the maximal sharing across the 11 HapMap samples, determined separately at each window size.
Figure 5.

The fraction of common haplotypes in African populations that are also common in the HapMap. For each plot we used haplotypes based on the 517 SNPs that overlap between HapMap Phase 3 and our autosomal core regions on chromosome 21. We first averaged over all haplotype-loci within each core region and then averaged across the core regions for windows of a given length. Each curve shows the fraction of the common haplotypes of a population (with >10% frequency) that are also common in a HapMap sample formed by combining specific HapMap groups with recent African ancestry. Inside each plot that corresponds to one of the 15 HapMap mixtures, we label target populations in which the corresponding HapMap mixture served as the optimal reference panel among the 15 mixture panels. For the last plot of maximal haplotype sharing across HapMap mixtures, we label the populations with the highest and lowest maximal sharing fractions.
Genotype Imputation
To understand the properties of genotype imputation in African populations, we considered two designs, both using the software MACH [Li et al., 2006, 2010]. We first examined imputation accuracy for all pairs among the 63 populations, with one population chosen as the reference and another as the target. We next identified, for each of the 15 African populations, the optimal reference panel from the HapMap.
Imputation at untyped markers based on population samples
To examine the variation in imputation accuracy across potential reference populations, for each of 63 × 63 population pairs consisting of a target population and a reference population, we imputed missing genotypes at randomly selected hidden markers in the target population on the basis of a small panel of individuals in the reference population, holding reference panel size constant at six individuals. The panel size of six individuals corresponds to the smallest sample size among all 63 populations, and therefore, it represents the largest panel size that permits comparable evaluations of all pairs of distinct populations.
Considering all 63 × 63 imputations, we find that except for African target populations, imputing missing genotypes in a target population on the basis of a reference population from the same geographic region yields higher imputation accuracy than the mean of all values in the 63 × 63 matrix of imputation accuracies (Fig. 6). By contrast, imputing missing genotypes in African target groups using non-African reference groups yields imputation accuracy lower than the mean, except in a few target populations (e.g., Beja, Iraqw, and Sandawe with the Mozabite group as reference). Among all 779 pairs consisting of reference and target populations from the same geographic region, we find that 30.4% of the imputations appear in the top 10% of all 63 × 63 imputation accuracies, with values ranging from 88.2 to 94.6%. On the other hand, among 720 pairs consisting of an African target population and a non-African reference population, 36.7% appear in the bottom 10% of imputation accuracies, with values ranging between 59.3 and 78.2%.
Figure 6.

Imputation accuracy for inference of genotypes at hidden markers. For each target population specified by the column label, we masked a set of markers and imputed genotypes in the population using the reference population specified by the row label. Of 1,272 markers, 77, or ∼6%, were randomly chosen among a subset of 517 markers and masked, and for each target, the same set was masked for imputation with each reference population. The colors correspond to ten deciles of imputation accuracy across all populations and all reference panels. For each population, the best and second-best reference panels among 62 other populations are labeled 1 and 2, respectively. For convenience in interpreting the figure, the horizontal and vertical blue lines separate results by geographic region (from left to right and from bottom to top: Africa, Europe, Middle East, Central/South Asia, East Asia, Oceania, and the Americas).
In this imputation experiment, we observe an asymmetry of imputation performance in population pairs consisting of a reference population and a target population with different geographic origins. That is, in many cases, imputation using one population as a reference panel and a second population from a different geographic region as a target has considerably higher or lower accuracy than in a scenario with the roles of the populations reversed. This reference-target asymmetry is most pronounced in population pairs in which one population is African and the other is non-African; in 628 or 87.2% of 720 such pairs (15 African × 48 non-African populations), imputation accuracy is lower when imputing untyped markers in an African population on the basis of a non-African population than when performing imputation in the reverse direction. For population pairs of non-African descent from different geographic regions, we observe a similar reference-target asymmetry. For instance, in 113 or 78.5% of 144 pairs containing a European and an East Asian population (8 European × 18 East Asian populations), imputation accuracy is lower in the European population than in the East Asian population on the basis of the other population as reference data.
Evaluating the portability of a reference population for imputation in target populations other than the reference population itself, we consider two metrics—the number of target populations in which a reference population serves as either the best or second-best reference panel, and the mean imputation accuracy across target populations in which imputation is performed using the reference population. Using the first metric to identify top-performing reference groups across the range of possible target populations, we find Sengwer and Yoruba to be the most portable reference groups for imputation in African populations. Sengwer is the best or second-best reference group in 6 of the 14 other African samples, and Yoruba is the best or second-best panel in 5 of 14. Additionally, Sengwer and Yoruba produce the highest mean imputation accuracy across the 14 remaining African populations (86.0 and 85.8%, respectively).
Imputation at untyped markers based on the HapMap
To identify suitable HapMap reference panels for imputation in the 15 African populations, in each population, we masked a fixed set of randomly selected markers and then imputed missing genotypes at these markers on the basis of each of the 15 possible combinations of the four HapMap panels of African descent.
For each African target population, Figure 7 reports the optimal reference panel chosen from the 15 combinations of HapMap reference groups. All except one of the target populations are most accurately imputed using a reference panel that contains individuals from new HapMap Phase 3 samples of African ancestry (ASW, LWK, and MKK). The only exception is Mandenka, for which the optimal reference panel consists solely of the HapMap YRI population. The combined panel of all four HapMap populations of African descent is not the optimal reference group in any of the 15 African populations, and it is the second-best reference panel in only three of the 15 African groups (Kenyan Bantus, Fulani, and Mada). Interestingly, several populations (Beja, Biaka Pygmy, Borana, Fulani, Mbuti Pygmy, and Sandawe) have in their optimal reference panels the HapMap ASW admixed sample of African Americans.
Figure 7.

Imputation accuracy for inference of genotypes at hidden markers, based on 15 reference panels consisting of combinations among four HapMap Phase 3 panels with recent African ancestry. For each target population, the bar represents the maximal imputation accuracy among the 15 choices, and it is colored according to the choice of optimal reference panel. Each HapMap panel was used with its original size in the combination panels. In each population, we masked the same 77, or ∼15%, of 517 markers as in Figure 6.
On the basis of reference panels consisting of mixtures of the HapMap Phase 3 populations, the San, Mbuti Pygmy, and Biaka Pygmy populations continue to be the most poorly imputed groups, as was previously observed with earlier reference panels from HapMap Phase 2 [Huang et al., 2009a]. Yoruba remains the best-imputed population, with the combination of the HapMap LWK and YRI populations as its optimal reference panel. Although the size of the underlying optimal reference panels varies widely across the 15 target populations, from 80 individuals for the LWK panel to 284 individuals for the combined panel containing the HapMap LWK, MKK, and YRI populations, maximal imputation accuracy varies only moderately across the 15 African target populations. The highest and lowest values differ by less than 7.0% among all 15 populations, and by less than 2.0% for the 11 populations with highest maximal imputation accuracy.
To evaluate the improvement in imputation accuracy in African populations resulting from the addition of the ASW, LWK, and MKK samples to the HapMap Phase 3 data, for each African population, we computed the difference between the maximal imputation accuracy in the population using its optimal combination of reference panels and the imputation accuracy in the population on the basis of the YRI reference panel. Averaged across African populations, the increase in imputation accuracy is 1.3%, corresponding to a mean percentage reduction of 11.1% in imputation error rates. Note, additionally, that the HapMap Phase 3 YRI panel examined in our study contains 80% more unrelated individuals than the HapMap Phase 2 YRI panel (108 rather than 60); this panel is thus likely to produce higher imputation accuracy than the earlier panel. Consequently, as a measure of the improvement in African imputation accuracy on the basis of HapMap Phase 3 compared to HapMap Phase 2, our estimate is likely to be conservative.
To further quantify contributions of individual HapMap Phase 3 panels of African ancestry to imputation accuracy in the 15 African populations, for each HapMap panel of African descent, we computed the difference in maximal imputation accuracy attainable in each of the 15 populations using two optimal reference panels, one chosen from a full collection of combination panels and the other chosen from a reduced collection. The full collection consisted of all 24−1 = 15 combinations of the four HapMap Phase 3 panels, producing the maximal imputation accuracies shown in Figure 10. The reduced collection, a subset of the full collection, consisted of 23−1 = 7 combinations of the same panels of African descent, excluding the panel whose contributions were under evaluation. A larger difference in maximal imputation accuracy, examining the full and reduced collections, suggests a greater impact of the HapMap panel under consideration, because of a greater difference in imputation accuracy achieved with and without the panel. For each of the 15 African populations, we ranked the four HapMap Phase 3 panels of African descent by the difference in maximal imputation accuracy, finding that the HapMap ASW panel has the greatest influence on maximal imputation accuracy only in Fulani, a group that has been suggested to have had recent gene flow both with Sub-Saharan African and with Eurasian populations [Scheinfeldt et al., 2010]. Considering the remaining 14 African populations, exclusions of the HapMap MKK, LWK, and YRI panels produce the greatest impact in six, five, and three populations, respectively. Among the target populations whose imputation accuracies are most strongly influenced by a particular panel, the mean percentage reductions in imputation error rates are 4.1, 10.4, and 8.3% for MKK, LWK, and YRI, respectively (the percentage reduction in imputation error in Fulani when including the ASW reference panel is 3.8%).
Figure 10.

Imputation accuracy and Fst with HapMap mixtures. For each target population, imputation accuracy using each of 15 HapMap mixture reference panels is plotted as a function of Fst with the reference panel. The imputation accuracy for the optimal reference panel corresponds to the maximal imputation accuracy plotted in Figure 7.
Relating Imputation To Haplotype Variation
The selection of optimal reference panels for imputation in target populations generally requires an investigator either to have prior knowledge of the performance of candidate panels in the target populations or to perform imputation experiments similar to the ones described in the preceding section. However, prior knowledge might be unavailable for unusual target populations, and imputation experiments can be computationally intensive. Thus, for target populations that have not been the focus of previous imputation studies, the ability to predict the optimal reference panel among a collection of candidate panels on the basis of simple genotypic and haplotypic variation statistics computed for the target and each of its candidate reference groups can serve as an attractive approach to the selection of reference panels.
To provide a basis for predicting properties of imputation from statistics on variation patterns, we examined the dependence of imputation-accuracy results (Fig. 7) on our analysis of haplotype variation in the 15 African populations. Both imputation accuracy and haplotype variation were investigated using the same set of 517 markers that overlapped between our study populations and the HapMap Phase 3 populations. We considered three haplotype-variation statistics from the Haplotype Variation section (haplotype sharing for a target population with a reference population, number of private haplotypes in the target population, and level of LD in the target population), as well as Fst between target and reference populations, as possible predictors of imputation accuracy in a target population on the basis of a reference population. Haplotype sharing and Fst are reasonable predictors because they measure genetic similarity and distance between a target group and a reference group. The number of private haplotypes provides a measure of the distinctiveness of a target population and thus might be expected to be inversely related to imputation accuracy. Finally, the level of LD as measured by r2 is a reasonable predictor because the strength of correlation among nearby SNPs on a target haplotype underlies our ability to impute genotypes at an untyped SNP using genotype information at a nearby typed SNP.
For the 15 African target populations, with missing genotypes imputed based on their respective optimal HapMap mixtures, Figure 8 displays the relationships of imputation accuracy with four summary statistics—the number of private haplotypes of length 50 kb, the level of LD at 50 kb, the haplotype sharing for target populations with their optimal reference groups using a window size of 50 kb, and Fst between the target and reference populations. Haplotype sharing for a target population with a reference population, as well as Fst between a target population and a reference population, each produce a strong relationship with imputation accuracy in the target (with Pearson correlation coefficient r = 0.79 and P = 0.0004 between imputation accuracy and haplotype sharing, and r = −0.86 and P<0.0001 between imputation accuracy and Fst). The relationship between imputation accuracy and the number of private haplotypes is weaker (r = −0.66, P<0.0070), and the relationship between imputation accuracy and the level of LD is not statistically significant (r = 0.15, P = 0.6044).
Figure 8.

Imputation accuracy and statistics of genotypic and haplotypic variation. (A) Number of private haplotypes, (B) LD as measured by r2, (C) fraction of common haplotypes also common in the HapMap, and (D) Fst between a target population and its optimal HapMap mixture. The imputation accuracy represents the maximal imputation accuracy using the optimal panel among the 15 combinations of the HapMap panels of African descent (identical numerical values as plotted in Figure 7). All computations used the set of 517 SNPs that overlapped with HapMap Phase 3. In parts A and C, a window size of 50 kb was used; in part B, r2 was computed using a bin size of 6 kb; in part D, Fst was first computed for individual SNPs and was then averaged across the 517 SNPs. The fraction of common haplotypes also found in the HapMap and Fst were computed for target populations with their respective optimal panels among the 15 choices. The Pearson correlation coefficients are −0.66 (P = 0.0070) between imputation accuracy and number of private haplotypes, 0.15 (P = 0.6044) between imputation accuracy and r2, 0.79 (P = 0.0004) between imputation accuracy and fraction of common haplotypes in a target population also found in the HapMap, and −0.86 (P<0.0001) between imputation accuracy and Fst of a target population with its optimal HapMap mixture.
Statistics on genetic similarity between an African target population and a HapMap reference group can in some cases be used for identifying the optimal reference panel for imputation in the target. Each plot in Figure 9 shows the imputation accuracies in a given target population on the basis of each of the 15 HapMap mixture panels, sorted on the x-axis according to the haplotype-sharing statistic. In 4 of the 15 target populations, the optimal HapMap mixture, as shown in Figure 7, is indeed the mixture with the highest haplotype sharing; in most target populations, use of the mixture with the highest haplotype sharing leads to a relatively small decrease in imputation accuracy compared to use of the optimal mixture. For each target population, we computed the difference in accuracy between the imputation performed using the mixture with the highest value of the haplotype-sharing statistic and the imputation performed using the optimal HapMap mixture. The mean loss of imputation accuracy across the 15 African target populations in this case is 0.0038, corresponding to a mean percentage increase of 4.2% in imputation error.
Figure 9.

Imputation accuracy and the fraction of common haplotypes that are also common in the HapMap. For each target population, imputation accuracy using each of 15 HapMap mixture reference panels is plotted as a function of haplotype sharing with the reference panel (window size of 50 kb). The imputation accuracy for the optimal reference panel corresponds to the maximal imputation accuracy plotted in Figure 7.
Similarly, each plot in Figure 10 shows the imputation accuracies in a target population on the basis of the 15 HapMap mixture panels, sorted instead on the x-axis according to Fst. The optimal HapMap mixture is the mixture with the lowest Fst in only 3 of the 15 target populations. However, in many of the remaining target populations, the imputation accuracy obtained using the mixture with the lowest Fst is only very slightly lower than the imputation accuracy obtained using the optimal mixture. The mean loss in imputation accuracy from use of the lowest-Fst mixture rather than the optimal mixture is 0.0013, corresponding to a mean percentage increase of 1.3% in imputation error. This small difference in imputation accuracy suggests that genetic similarity between target and reference populations plays a central role in predicting imputation accuracy in the target population, and that similarity statistics can be used to guide the selection of suitable reference populations.
Discussion
Genotype imputation has played an increasingly important role in the analysis of human genetic variation and genotype-phenotype association, and the continuing growth of genomic resources facilitates the expansion of imputation studies into new populations. We have found that the availability of additional HapMap Phase 3 populations of African descent increases the accuracy of genotype imputation in Sub-Saharan African populations, improving the prospects for GWA studies in these groups. Focusing on populations from Sub-Saharan Africa, we have presented a detailed investigation of haplotype diversity and genotype imputation, recommending the use of haplotype-sharing measures and Fst between a target population and candidate reference populations as guiding criteria for selecting reference panels for imputation in the target population.
We characterized the level of genetic similarity between populations by the magnitude of their haplotype sharing. Examining the patterns of haplotype sharing at a regional level, we confirmed earlier observations of asymmetry between African and non-African populations in haplotype sharing, as reflected in the greater “outward” than “inward” haplotype flow from Africa to other geographic regions [Conrad et al., 2006]. This asymmetry in haplotype sharing (Fig.1) provides a partial explanation for a corresponding reference-target asymmetry in imputation performance for Africans and non-Africans (Fig. 6). In particular, the net outward haplotype flow from Africa to other geographic regions implies that for a non-African haplotype targeted for imputation on the basis of an African reference population, the probability of finding the same haplotype inherited by descent in the reference population is greater than the probability of finding an African haplotype targeted for imputation in a non-African reference population. An increased probability of finding reference chromosomal stretches inherited by descent for a non-African target haplotype in turn produces an increased probability of correctly inferring missing genotypes of the non-African target on the basis of African reference haplotypes, compared to the probability of correctly inferring missing genotypes of an African target on the basis of non-African reference haplotypes. Following the same argument, we can attribute much of the asymmetry in imputation performance between collections of populations from different geographic regions to the asymmetry in haplotype sharing for the populations involved.
The accuracy with which genotypes can be imputed in a target population, although positively correlated with haplotype sharing and the Fst statistic with the reference panel, is not solely determined by either of these measures of genetic similarity between target and reference populations. For example, considering the 15 African populations, the Mandenka population had the highest maximal haplotype-sharing fraction across the 15 possible mixtures of the HapMap Phase 3 populations of African descent (Fig. 5). Among the 15 African target populations, however, the Mandenka population had less than the median maximal imputation accuracy on the basis of the optimal reference panel chosen among the 15 HapMap mixtures. Future theoretical work will be important for clarifying the determinants of imputation accuracy; in the absence of such work, further investigation of empirical approaches, some inspired by population-genetic theory, can continue to provide improvements to imputation in novel target populations [e.g., Egyud et al., 2009; Huang et al., 2009a; Li et al., 2010; Paşaniuc et al., 2010; Shriner et al., 2010].
Although our dataset in 63 worldwide populations enables us to investigate factors affecting accuracy of genotype imputation in diverse populations, especially in Sub-Saharan Africans, the relatively small numbers of markers and sample sizes do limit the scope of our study. For example, because of the small size of the marker set, the fraction of the markers that we chose to impute in our experiments was less than that typically used in GWA applications, for which larger fractions of the dataset are imputed rather than genotyped. This small size of the marker set had the additional consequence that in our imputation experiment involving the HapMap, for each of the 15 African target populations, imputation accuracies resulting from use of the top choices of reference panels did not differ substantially, thereby limiting our ability to provide clear support for particular mixtures of HapMap panels (Fig. 7). Further, for our 63 × 63 imputation experiment involving data only from the 63 populations, we relied on phased haplotypes, and relatively small sample sizes might have limited phasing accuracy; because phasing accuracy is lowest in populations with lower LD [Conrad et al., 2006], phasing errors could have contributed to the elevated imputation error rates in African target populations (Fig. 6). We also note that while the MACH software that we studied is among the most commonly used imputation programs, other methods such as BEAGLE [Browning and Browning, 2007, 2009] and IMPUTE [Marchini et al., 2007; Howie et al., 2009] are frequently employed. While the numerical results of the imputation experiments would likely vary with our methodological choices, however, our primary goal has been to examine the way in which imputation accuracies relate to each other across different reference and target populations, with a focus on Sub-Saharan Africa, and we do not expect that these general patterns would be substantially affected by changes to the imputation software, marker sets, or sample sizes. The limitations of our imputation experiments will become easier to address as large-scale African population-genetic datasets proliferate, from such sources as genomic studies of human evolution [e.g., Bryc et al., 2010; Henn et al., 2011] and GWA studies in African and African-American populations [e.g., Adeyemo et al., 2009; Jallow et al., 2009; Teo et al., 2010].
Materials And Methods
Data
SNP data
We supplemented the worldwide set of 957 individuals studied by Pemberton et al. [2008], which itself updated the dataset of Conrad et al. [2006] on 927 individuals from 53 populations, with data on eight additional African populations. Among 160 African individuals genotyped initially, four were discarded as a result of poor genotyping quality. For each pair among the remaining 156 individuals, the fractions of SNPs at which the pair shared 0, 1, and 2 identical alleles were calculated. The computation used all SNPs at which genotyping was attempted, and it identified two pairs of duplicate samples and five pairs of close relatives, two of which shared one individual. This shared individual was removed from both pairs, and from each of the five remaining pairs, the individual with the greater amount of missing data was removed. Research and ethics approvals and permits were secured prior to sample collection, as detailed by Tishkoff et al. [2009]. Written informed consent was obtained on-site from all participants, and the institutional review boards of the University of Maryland at College Park and the University of Pennsylvania approved the study.
Genotyping was attempted for the African individuals at 3,024 SNPs spread across 36 genomic regions, simultaneously with genotyping of the 30 Indian samples that formed the focus of the work of Pemberton et al. [2008]. The preparation of the final dataset for this study appears in Pemberton et al. [2008], who incorporated the African samples in producing a final dataset of 2,810 SNPs, but then omitted these samples in data analysis. Our final dataset, considering all 1,107 individuals and 2,810 SNPs, has a missing data rate of 0.11% (0.38% in the 150 newly sampled African individuals). Among the 2,810 SNPs, 1,272 are located on chromosome 21. To investigate genotype imputation in our study samples, we focused on this subset, which has a missing data rate of 0.10% (0.36% in the 150 newly sampled African individuals). Haplotype phasing utilized fastPHASE 1.0[Scheet and Stephens, 2006], following the same approach as in Conrad et al. [2006], and it was completed by Pemberton et al. [2008].
HapMap data
For some analyses, we incorporated additional reference individuals for genotype imputation. The reference data consisted of 901 unrelated individuals in release 2 of HapMap Phase 3 [International HapMap 3 Consortium, 2010]. We used a dataset in which phased genotypes in these individuals were available at 1,361,534 autosomal SNPs. Of these SNPs, 18,943 were on chromosome 21, among which 517 were also available in the 1,107 study individuals. For imputation designs involving HapMap individuals as reference data, we assessed imputation accuracy at a subset of the 517 SNPs by using the unphased genotypes at the 1,272 SNPs from the study sample and the phased genotypes at the 18,943 chromosome 21 SNPs in the HapMap Phase 3 data. For imputations that instead used populations in the study sample as reference data, we evaluated imputation accuracy at a subset of the 1,272 SNPs, using unphased data for target samples and phased data for reference samples at those SNPs.
Statistical Analyses Of Haplotype Variation
Haplotype windows
We computed haplotype summary statistics using haplotypes defined by “core” SNPs in genomic windows of size w base pairs. In the set of SNPs genotyped, core SNPs are SNPs that lie within a more densely genotyped region with a mean spacing of ∼1.5 kb between consecutive SNPs (noncore SNPs lie in regions flanking each core,with a mean spacing of ∼10 kb). For each SNP in a “core” region, a haplotype locus is specified by the set of allelic states at all SNPs located in the half-open window [a,a + w), where a denotes the position of the SNP under consideration and a + w denotes the position along the chromosome w base pairs away from the position a. All SNPs defining a haplotype locus are required to lie completely within a core region. Furthermore, identical haplotypes must have the same variants for all SNPs with positions in [a,a + w). For each value of the window size w, we present summary statistics averaged across all haplotype loci of size w. For instance, for a given population, haplotype heterozygosity was computed for each haplotype locus and was then averaged across haplotype loci.
Unless otherwise noted, summary statistics on haplotype variation were calculated twice in our study. We first computed the statistics using all 1,800 core SNPs outside X-chromosomal regions [numbered 23–26 in Table SM.2 of Conrad et al., 2006] for the characterization of haplotype variation in the study populations (Figs. 1–3). The collection of 1,800 SNPs was identical to that used by Pemberton et al. [2008]. For the investigation of the relationship between haplotype variation and imputation performance (Figs.4,5,8–10), we repeated the computation using the set of 517 SNPs that overlapped between the study samples and the HapMap Phase 3 data so that results on haplotype variation and on imputation accuracy used the same underlying set of SNPs. Finally, we computed pairwise Fst between each of 15 African target populations and each of 15 mixtures of HapMap Phase 3 panels of African ancestry, using the set of 517 SNPs and eq. 5.3 of Weir [1996]. All haplotype summary statistics, as well as Fst, were computed using phased datasets.
Numbers of distinct haplotypes and private haplotypes
To adjust for sample-size differences across populations and geographic regions, following Conrad et al. [2006], we used a rarefaction approach for estimating the numbers of distinct haplotypes and private haplotypes. For each of these two statistics, in a sample of size N, this approach chooses a value g≤N and it obtains the statistic by averaging the expected value of the statistic across all possible subsamples of size g from the original sample of size N. This method enables a correction for differing sample sizes across populations, as the same value of the subsample size g can be used in evaluating a statistic in each population. For all population-level computations of the two statistics, we used g = 12, which corresponds to the smallest sample size among the 63 populations. For all computations involving geographic regions, we used g = 54, as the smallest sample size among the seven geographic regions equaled 54 chromosomes.
Haplotype sharing
To compute the fraction of distinct haplotypes shared between two populations, j and j′, we used the z-statistic of Conrad et al. [2006]. For each haplotype locus, we first computed the numbers of distinct haplotypes and the numbers of private haplotypes for each of the two populations, where private haplotypes for population j refer to those not found in population j′. This computation used rarefaction with g = 54 when comparing geographic regions and g = 12 when comparing populations.
The expected number of distinct haplotypes found in a sample of size g from population j that will also be found in a sample of size g from population j′ is then equal to the difference between the expected number of distinct haplotypes in population j and the expected number of private haplotypes in population j. Thus, the z-statistic of Conrad et al. [2006] is an estimator of the fraction of distinct haplotypes observed in a sample of size g from population j that will also be observed in a sample of size g from population j′.
Linkage disequilibrium
We measured LD by the correlation coefficient, r2, between all pairs of SNPs with minor allele frequency greater than or equal to some cutoff value, c, where c∈[0,1). For each population, we computed the mean r2 and the mean distance between pairs of SNPs for all SNP pairs within bins of size b; a bin centered on distance xcontains all pairs of distinct SNPs in the interval (x−b/2,x + b/2]. We tested the sensitivity of r2 values to various choices of c (0, 0.05, and 0.1) and b (1, 3, 6, and 10 kb), and we found that the choices of c and b had relatively little effect on the observed LD patterns.
Haplotype sharing with the HapMap
Using the statistic [Conrad et al., 2006], for each population, we computed the fraction of haplotypes common in a population that were also common in each of the 11 HapMap Phase 3 populations and in the 15 combinations of one or more HapMap Phase 3 groups of African descent. This statistic evaluates the number of distinct haplotypes that are common in each of a pair of populations, as a fraction of the number of distinct haplotypes common in the population from the pair designated as the “donor.” We used g = 12 in rarefaction-based evaluations of the number of distinct haplotypes, and the set of 517 SNPs that overlapped with the HapMap Phase 3 data was used for computations of. Estimates of were generally insensitive to the choice of cutoff used for defining “common” haplotypes (haplotype frequency >0.01, >0.05, or >0.1). The statistic was obtained by averaging across haplotype loci within each of the genomic core regions, and it was then averaged across genomic regions.
Genotype-Imputation Experiments
Imputation at untyped markers based on population samples
We examined how well missing genotypes in each population can be imputed using other population samples as reference panels. For each population in which imputation was performed, we masked the same set of 77 SNPs on chromosome 21, randomly chosen among the 517 markers that overlapped between our samples and the HapMap Phase 3 populations. We then estimated genotypes at these markers using the software MACH [Li et al., 2006, 2010]. MACH settings were identical to those used in imputations of untyped markers in Huang et al. [2009a] except that we dropped two options, “interimInterval,” which outputs intermediate results, and “mask,” which masks a specified proportion of genotypes (as opposed to masking the genotypes of specific markers in all individuals). For improved genotype estimates, we also increased “rounds,” the number of rounds for the Markov sampler, from 20 to 50. The median minor allele frequency of the 77 hidden SNPs ranges from 0.1957 to 0.2895 across the 15 African populations, and from 0.1875 to 0.3036 across 61 of the populations (the median minor allele frequency is lower in the Surui and Pima populations).
In each target population, imputation was performed 62 times, each time based on a subset of the unmasked, phased data from one of the remaining populations as a reference group. The target data of a population consisted of unphased genotype data in all individuals available from that population. For all target populations, we used the same reference data, consisting of haplotypes of six individuals randomly selected from a reference population.
Additionally, we imputed each population on the basis of itself. For each population, we split its data into two nonoverlapping sets and used one set to impute the other. For 61 of 63 groups, we used the same reference sets of six individuals described above. For two population samples of size six individuals (San and Tuscan), we randomly selected five instead of six individuals and created the reference set using the unmasked, phased genotype data of these individuals. We then used unphased genotype data for individuals not sampled for inclusion in the reference set to form the target set for the evaluation of imputation accuracy. Thus, for imputation in a target population with sample size n using reference data from the same population, for 61 populations, the target set consisted of n−6 individuals that were not in the reference set, and for the remaining two populations, it contained the unique individual that was not in the reference set.
Finally, to summarize imputation performance in each population, we estimated allelic imputation accuracy using eq. (1) of Huang et al. [2009b], which employs MACH-estimated genotype posterior probabilities and averages them across SNPs and across individuals in the target population sample. Imputation error is then defined as one minus imputation accuracy. We averaged imputation accuracy across 10 replicates of our imputation experiment, each time using one of ten randomly selected sets of reference individuals (the mean across the replicates is plotted in Fig. 6).
We note that except in three African populations (Iraqw, Sengwer, and Borana) that have slightly elevated native missing data rates of 0.42, 0.67, and 0.71%, the other 60 populations have similarly low rates of natively missing data, ranging between 0.01 and 0.29% across the 1,272 markers on chromosome 21 (“natively missing data” refer to data missing prior to our intentional masking of SNPs in the experimental design; all natively missing data rates were computed using unphased subsets of our final dataset).
Imputation at untyped markers based on Hapmap populations
We next evaluated the use of HapMap Phase 3 populations as reference data and identified optimal reference panels for imputing missing genotypes in the various African populations. The same collection of 77 SNPs (∼15% of 517 overlapping SNPs between the HapMap data and our data) masked in the previous experiment was masked, and the unphased genotypes of these hidden SNPs were estimated using identical MACH settings to those in the previous section, except that we modified the “seed” option to change the initial random seed used by MACH from its default value of 123456. The values plotted in Figure 7 were obtained as means across 10 replicates, with the replicates having varying random seeds for the MACH runs. We considered as reference data combinations of HapMap Phase 3 groups of African descent, pooling phased genotypes of unrelated individuals from the four populations with significant recent African ancestry (40 ASW, 80 LWK, 96 MKK, and 108 YRI individuals). In total, 24−1 = 15 possible combinations were considered. Because we combined the panels with their original sizes, the 15 combination panels varied in size. Imputation accuracy was assessed in the same manner as in the previous experiment.
Relating Imputation To Haplotype Variation
To explore the relationship between imputation accuracy and summary statistics on genotypic and haplotypic variation, we investigated the correlation between maximal imputation accuracy in the 15 African populations on the basis of the optimal panel chosen among the 15 HapMap combinations and each of several summary statistics: number of private haplotypes, LD as measured by r2, haplotype sharing as measured by the fraction of common haplotypes also found in the optimal panel among the 15 choices, and Fst between a target population and its corresponding optimal mixture of the HapMap Phase 3 panels. The number of private haplotypes and the fraction of common haplotypes shared with the HapMap were computed using a window size of 50 b. Values of r2 were determined using 6 b bins, and Fst was computed for individual SNPs and then averaged across SNPs. Imputation and haplotype-variation results were obtained using the same underlying set of 517 SNPs that overlapped between the HapMap data and our study samples. We computed the Pearson correlation coefficients between imputation accuracy and each of the four statistics.
Supplementary Material
Acknowledgments
We thank F. Reed for assistance. This work was supported in part by grants from the Burroughs Wellcome Fund and the National Institutes of Health (grants R01 GM081441 and R01 HG005855 to NAR, and grants R01 GM076637 and Director's Pioneer Award Program DP-1-OD-006445 to S.A.T.).
Footnotes
Web Resources: HapMap Phase 3 data, http://hapmap.ncbi.nlm.nih.gov/downloads/phasing/2009-02_phaseIII/HapMap3_r2/, MACH software, http://www.sph.umich.edu/csg/abecasis/MACH/
References
- Adeyemo A, Gerry N, Chen G, Herbert A, Doumatey A, Huang H, Zhou J, Lashley K, Chen Y, Christman M, Rotimi C. A genome-wide association study of hypertension and blood pressure in African Americans. PLoS Genet. 2009;5:e1000564. doi: 10.1371/journal.pgen.1000564. [DOI] [PMC free article] [PubMed] [Google Scholar]
- Bowcock AM, Ruiz-Linares A, Tomfohrde J, Minch E, Kidd JR, Cavalli-Sforza LL. High resolution of human evolutionary trees with polymorphic microsatellites. Nature. 1994;368:455–457. doi: 10.1038/368455a0. [DOI] [PubMed] [Google Scholar]
- Browning SR, Browning BL. Rapid and accurate haplotype phasing and missing-data inference for whole-genome association studies by use of localized haplotype clustering. Am J Hum Genet. 2007;81:1084–1097. doi: 10.1086/521987. [DOI] [PMC free article] [PubMed] [Google Scholar]
- Browning BL, Browning SR. A unified approach to genotype imputation and haplotype-phase inference for large data sets of trios and unrelated individuals. Am J Hum Genet. 2009;84:210–223. doi: 10.1016/j.ajhg.2009.01.005. [DOI] [PMC free article] [PubMed] [Google Scholar]
- Bryc K, Auton A, Nelson MR, Oksenberg JR, Hauser SL, Williams S, Froment A, Bodo JM, Wambebe C, Tishkoff SA, Bustamante CD. Genome-wide patterns of population structure and admixture in West Africans and African Americans. Proc Natl Acad Sci USA. 2010;107:786–791. doi: 10.1073/pnas.0909559107. [DOI] [PMC free article] [PubMed] [Google Scholar]
- Conrad DF, Jakobsson M, Coop G, Wen X, Wall JD, Rosenberg NA, Pritchard JK. A worldwide survey of haplotype variation and linkage disequilibrium in the human genome. Nat Genet. 2006;38:1251–1260. doi: 10.1038/ng1911. [DOI] [PubMed] [Google Scholar]
- Egyud MRL, Gajdos ZKZ, Butler JL, Tischfield S, Le Marchand L, Kolonel LN, Haiman CA, Henderson BE, Hirschhorn JN. Use of weighted reference panels based on empirical estimates of ancestry for capturing untyped variation. Hum Genet. 2009;125:295–303. doi: 10.1007/s00439-009-0627-8. [DOI] [PMC free article] [PubMed] [Google Scholar]
- Henn BM, Gignoux CR, Jobin M, Granka JM, Macpherson JM, Kidd JM, Rodríguez-Botigué L, Ramachandran S, Hon L, Brisbin A, Lin AA, Underhill PA, Comas D, Kidd KK, Norman PJ, Parham P, Bustamante CD, Mountain JL, Feldman MW. Hunter-gatherer genomic diversity suggests a southern African origin for modern humans. Proc Natl Acad Sci USA. 2011;108:5154–5162. doi: 10.1073/pnas.1017511108. [DOI] [PMC free article] [PubMed] [Google Scholar]
- Howie BN, Donnelly P, Marchini J. A flexible and accurate genotype imputation method for the next generation of genome-wide association studies. PLoS Genet. 2009;5:e1000529. doi: 10.1371/journal.pgen.1000529. [DOI] [PMC free article] [PubMed] [Google Scholar]
- Huang L, Li Y, Singleton AB, Hardy JA, Abecasis G, Rosenberg NA, Scheet P. Genotype-imputation accuracy across worldwide human populations. Am J Hum Genet. 2009a;84:235–250. doi: 10.1016/j.ajhg.2009.01.013. [DOI] [PMC free article] [PubMed] [Google Scholar]
- Huang L, Wang C, Rosenberg NA. The relationship between imputation error and statistical power in genetic association studies in diverse populations. Am J Hum Genet. 2009b;85:692–698. doi: 10.1016/j.ajhg.2009.09.017. [DOI] [PMC free article] [PubMed] [Google Scholar]
- International HapMap 3 Consortium. Integrating common and rare genetic variation in diverse human populations. Nature. 2010;467:52–58. doi: 10.1038/nature09298. [DOI] [PMC free article] [PubMed] [Google Scholar]
- Jakobsson M, Scholz SW, Scheet P, Gibbs JR, VanLiere JM, Fung HC, Szpiech ZA, Degnan JH, Wang K, Guerreiro R, Bras JM, Schymick JC, Hernandez DG, Traynor BJ, Simon-Sanchez J, Matarin M, Britton A, van de Leemput J, Rafferty I, Bucan M, Cann HM, Hardy JA, Rosenberg NA, Singleton AB. Genotype, haplotype and copy-number variation in worldwide human populations. Nature. 2008;451:998–1003. doi: 10.1038/nature06742. [DOI] [PubMed] [Google Scholar]
- Jallow M, Teo YY, Small KS, Rockett KA, Deloukas P, Clark TG, Kivinen K, Bojang KA, Conway DJ, Pinder M, Sirugo G, Sisay-Joof F, Usen S, Auburn S, Bumpstead SJ, Campino S, Coffey A, Dunham A, Fry AE, Green A, Gwilliam R, Hunt SE, Inouye M, Jeffreys AE, Mendy A, Palotie A, Potter S, Ragoussis J, Rogers J, Rowlands K, Somaskantharajah E, Whittaker P, Widden C, Donnelly P, Howie B, Marchini J, Morris A, SanJoaquin M, Achidi EA, Agbenyega T, Allen A, Amodu O, Corran P, Djimde A, Dolo A, Doumbo OK, Drakeley C, Dunstan S, Evans J, Farrar J, Fernando D, Hien TT, Horstmann RD, Ibrahim M, Karunaweera N, Kokwaro G, Koram KA, Lemnge M, Makani J, Marsh K, Michon P, Modiano D, Molyneux ME, Mueller I, Parker M, Peshu N, Plowe CV, Puijalon O, Reeder J, Reyburn H, Riley EM, Sakuntabhai A, Singhasivanon P, Sirima S, Tall A, Taylor TE, Thera M, Troye-Blomberg M, Williams TN, Wilson M, Kwiatkowski DP Wellcome Trust Case Control Consortium; Malaria Genomic Epidemiology Network. Genome-wide and fine-resolution association analysis of malaria in West Africa. Nat Genet. 2009;41:657–665. doi: 10.1038/ng.388. [DOI] [PMC free article] [PubMed] [Google Scholar]
- Kalinowski ST. Counting alleles with rarefaction: private alleles and hierarchical sampling designs. Conserv Genet. 2004;5:539–543. [Google Scholar]
- Li Y, Ding J, Abecasis GR. Mach 1.0: rapid haplotype reconstruction and missing genotype inference. Am J Hum Genet. 2006;79:S2290. [Google Scholar]
- Li Y, Willer CJ, Sanna S, Abecasis G. Genotype imputation. Annu Rev Genom Hum Genet. 2009;10:387–406. doi: 10.1146/annurev.genom.9.081307.164242. [DOI] [PMC free article] [PubMed] [Google Scholar]
- Li Y, Willer CJ, Ding J, Scheet P, Abecasis GR. MaCH: using sequence and genotype data to estimate haplotypes and unobserved genotypes. Genet Epidemiol. 2010;34:816–834. doi: 10.1002/gepi.20533. [DOI] [PMC free article] [PubMed] [Google Scholar]
- Marchini J, Howie B, Myers S, McVean G, Donnelly P. A new multipoint method for genome-wide association studies by imputation of genotypes. Nat Genet. 2007;39:906–913. doi: 10.1038/ng2088. [DOI] [PubMed] [Google Scholar]
- Paşaniuc B, Avinery R, Gur T, Skibola CF, Bracci PM, Halperin E. A generic coalescent-based framework for the selection of a reference panel for imputation. Genet Epidemiol. 2010;34:773–782. doi: 10.1002/gepi.20505. [DOI] [PMC free article] [PubMed] [Google Scholar]
- Pemberton TJ, Jakobsson M, Conrad DF, Coop G, Wall JD, Pritchard JK, Patel PI, Rosenberg NA. Using population mixtures to optimize the utility of genomic databases: linkage disequilibrium and association study design in India. Ann Hum Genet. 2008;72:535–546. doi: 10.1111/j.1469-1809.2008.00457.x. [DOI] [PMC free article] [PubMed] [Google Scholar]
- Pemberton TJ, Wang C, Li JZ, Rosenberg NA. Inference of unexpected genetic relatedness among individuals in HapMap Phase III. Am J Hum Genet. 2010;87:457–464. doi: 10.1016/j.ajhg.2010.08.014. [DOI] [PMC free article] [PubMed] [Google Scholar]
- Ramachandran S, Deshpande O, Roseman CC, Rosenberg NA, Feldman MW, Cavalli-Sforza LL. Support from the relationship of genetic and geographic distance in human populations for a serial founder effect originating in Africa. Proc Natl Acad Sci USA. 2005;102:15942–15947. doi: 10.1073/pnas.0507611102. [DOI] [PMC free article] [PubMed] [Google Scholar]
- Reich DE, Cargill M, Bolk S, Ireland J, Sabeti PC, Richter DJ, Lavery T, Kouyoumjian R, Farhadian SF, Ward R, Lander ES. Linkage disequilibrium in the human genome. Nature. 2001;411:199–204. doi: 10.1038/35075590. [DOI] [PubMed] [Google Scholar]
- Rosenberg NA, Huang L, Jewett EM, Szpiech ZA, Jankovic I, Boehnke M. Genome-wide association studies in diverse populations. Nat Rev Genet. 2010;11:356–366. doi: 10.1038/nrg2760. [DOI] [PMC free article] [PubMed] [Google Scholar]
- Scheet P, Stephens M. A fast and flexible statistical model for large-scale population genotype data: applications to inferring missing genotypes and haplotypic phase. Am J Hum Genet. 2006;78:629–644. doi: 10.1086/502802. [DOI] [PMC free article] [PubMed] [Google Scholar]
- Scheinfeldt LB, Soi S, Tishkoff SA. Working toward a synthesis of archaeological, linguistic, and genetic data for inferring African population history. Proc Natl Acad Sci USA. 2010;107:8931–8938. doi: 10.1073/pnas.1002563107. [DOI] [PMC free article] [PubMed] [Google Scholar]
- Servin B, Stephens M. Imputation-based analysis of association studies: candidate regions and quantitative traits. PLoS Genet. 2007;3:e114. doi: 10.1371/journal.pgen.0030114. [DOI] [PMC free article] [PubMed] [Google Scholar]
- Shriner D, Adeyemo A, Chen G, Rotimi CN. Practical considerations for imputation of untyped markers in admixed populations. Genet Epidemiol. 2010;34:258–265. doi: 10.1002/gepi.20457. [DOI] [PMC free article] [PubMed] [Google Scholar]
- Stephens JC, Schneider JA, Tanguay DA, Choi J, Acharya T, Stanley SE, Jiang R, Messer CJ, Chew A, Han JH, Duan J, Carr JL, Lee MS, Koshy B, Kumar AM, Zhang G, Newell WR, Windemuth A, Xu C, Kalbfleisch TS, Shaner SL, Arnold K, Schulz V, Drysdale CM, Nandabalan K, Judson RS, Ruaño G, Vovis GF. Haplotype variation and linkage disequilibrium in 313 human genes. Science. 2001;293:489–493. doi: 10.1126/science.1059431. [DOI] [PubMed] [Google Scholar]
- Teo YY, Small KS, Kwiatkowski DP. Methodological challenges of genome-wide association analysis in Africa. Nat Rev Genet. 2010;11:149–160. doi: 10.1038/nrg2731. [DOI] [PMC free article] [PubMed] [Google Scholar]
- Tishkoff SA, Kidd KK. Implications of biogeography of human populations for “race” and medicine. Nat Genet. 2004;36:S21–S27. doi: 10.1038/ng1438. [DOI] [PubMed] [Google Scholar]
- Tishkoff SA, Reed FA, Friedlaender FR, Ehret C, Ranciaro A, Froment A, Hirbo JB, Awomoyi AA, Bodo JM, Doumbo O, Ibrahim M, Juma AT, Kotze MJ, Lema G, Moore JH, Mortensen H, Nyambo TB, Omar SA, Powell K, Pretorius GS, Smith MW, Thera MA, Wambebe C, Weber JL, Williams SM. The genetic structure and history of Africans and African Americans. Science. 2009;324:1035–1044. doi: 10.1126/science.1172257. [DOI] [PMC free article] [PubMed] [Google Scholar]
- Weir BS. Genetic Data Analysis II. Sunderland, MA: Sinauer Associates; 1996. [Google Scholar]
Associated Data
This section collects any data citations, data availability statements, or supplementary materials included in this article.