Abstract
Artificial transcriptional networks have been used to achieve novel, nonnative behavior in bacteria. Typically, these artificial circuits are isolated from cellular metabolism and are designed to function without intercellular communication. To attain concerted biological behavior in a population, synchronization through intercellular communication is highly desirable. Here we demonstrate the design and construction of a gene-metabolic circuit that uses a common metabolite to achieve tunable artificial cell–cell communication. This circuit uses a threshold concentration of acetate to induce gene expression by acetate kinase and part of the nitrogen-regulation two-component system. As one application of the cell–cell communication circuit we created an artificial quorum sensor. Engineering of carbon metabolism in Escherichia coli made acetate secretion proportional to cell density and independent of oxygen availability. In these cells the circuit induced gene expression in response to a threshold cell density. This threshold can be tuned effectively by controlling ΔpH over the cell membrane, which determines the partition of acetate between medium and cells. Mutagenesis of the enhancer sequence of the glnAp2 promoter produced variants of the circuit with changed sensitivity demonstrating tunability of the circuit by engineering of its components. The behavior of the circuit shows remarkable predictability based on a mathematical design model.
The design of artificial gene circuits that resemble submodules of natural circuitry in the cell has led to bacterial strains that exhibit programmed behavior. Oscillators (1, 2), toggle switches (3), and autoregulatory systems (4) are well defined components for artificial networks. Assembly of these devices combined with in vivo tuning by directed evolution (5) may ultimately lead to designer biosystems that perform complex functions (6, 7). Most of these submodules are not direct derivatives of natural circuits but were constructed to accomplish comparable functionality in isolation from cellular networks. This isolation allows predictability of circuit behavior and avoids interference by the metabolism of the engineered cell. However, more complex functionality may be achieved with a circuit design that is interlaced with metabolism. Artificial transcriptional networks that interact with metabolism have been constructed. In particular, acetyl phosphate (AcP) has been used as an intracellular signal to interact with a nonnative feedback circuit involving the two-component nitrogen regulatory system (8). As a signal of metabolic flux overflow, AcP has been used to direct metabolic flux to an engineered heterologous pathway in Escherichia coli (8). In this system AcP is the link between metabolic and transcriptional regulatory networks. Uniquely qualified for this mediator role, AcP interacts with two-component regulators involved in the phosphate starvation response, nitrogen regulation, and chemotaxis, and it is an important intermediate in central metabolism (9). AcP has also been implicated as a global signal in biofilm development (10).
Most synthetic circuits are not only isolated from cell metabolism, but also do not communicate between cells to allow controlled behavior of bacterial populations. One example of natural cell–cell communication is quorum sensing (QS), which was first described in the 1970s for the marine bacterium Vibrio fischeri and is widespread among bacteria (11). By using QS bacteria can sense the density of their population and activate genes collectively once a certain density, a quorum, is reached (12, 13). QS controls behavior that is only productive when undertaken by a group of cells simultaneously, such as biofilm formation, bioluminescence, and virulence factor expression. In QS, cells release autoinducers and respond to threshold concentrations of these molecules that can only be reached at a certain cell density (14). The genes of the natural QS system have been expressed in E. coli and its components were used to demonstrate cell–cell communication in this host (7, 15). A synthetic gene network has been modeled in which this intercellular signaling is combined with an oscillator circuit to induce synchronous oscillations (16).
This design of an artificial cell–cell communication circuit does not draw from natural QS systems. Instead, the integration of transcriptional regulation, cellular metabolism, and intercellular communication to construct a tunable circuit is demonstrated. Acetate is the signal molecule, and AcP serves as a mediator between intercellular signal and transcriptional regulation. A mathematical model predicted the behavior and the tunability of the system. In this article, we report the design, modeling, and experimental characterization of an artificial cell–cell communication circuit.
Materials and Methods
Strains, Plasmids, Media, and Reagents. BW18793 (lacX74 glnL2001 pta-200 zej-223::Tn10) (17) carrying pGlnAp2GFPmut3.1 (BW18793/pGlnAp2GFPmut3.1), was designated as the QS strain. BW18500 (lacX74 glnL2001 Δpta ackA hisQ hisP zej-223::Tn10) (17) carrying pGlnAp2GFPmut3.1 (BW18500/pGlnAp2GFPmut3.1) was used as a control strain mutated in ack. BW18499 (lacX74 glnL2001 ackA200 zej-223::Tn10) (17) was used as a pta+ control strain. The GFPmut3.1 gene that codes for a fast-folding variant of GFP (18) was amplified by using 5′ primer (5′-GAATTCAGGAGAAAAAATGAGTAAAGG-3′), 3′ primer (5′-CTGCAGTTATTATTTGTATAGTTCATCCA-3′), and pGFP-mut3.1 as template; it was inserted downstream of the glnAp2 promoter in p2IDI (8) by using EcoRI and PstI sites, resulting in pGlnAp2GFPmut3.1. pGlnAp2GFPAAV was constructed in the same way by using a 3′ PCR primer containing the coding sequence for the degradable amino acid tag (AANDENYAAAV). Strains were grown in LB medium (19) or in M9 minimal medium containing 12.8 g of Na2HPO4·7H2O, 3 g of KH2PO4, 0.5 g of NaCl, 1 g of NH4Cl, 1 mg of thiamin hydrochloride, 1 ml of 1 M MgSO4, 1 ml of 0.1 M CaCl2, and 0.5% glucose. All restriction enzymes were from Invitrogen, and Taq polymerase was from Eppendorf. Pfu-turbo polymerase was from Stratagene, and T4 DNA ligase was from Promega. pGFPmut3.1 was kindly donated by M. Goulian (Physics Department, University of Pennsylvania, Philadelphia).
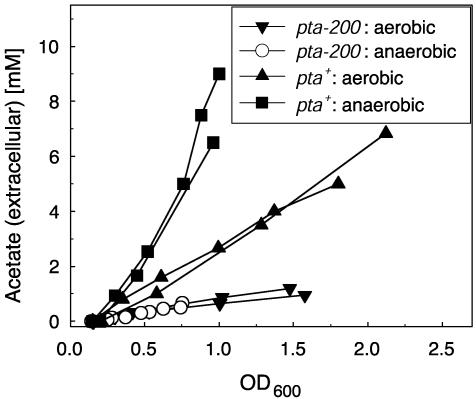
Evaluation of pta. This method is relevant for the results shown in Fig. 3. BW18499 (pta+) and BW18793 (pta-200) were grown in M9 medium in shake flasks at 37°C and 250 rpm in a rotary shaker. Anaerobic cultivation was carried out in tubes that were sealed with Parafilm. The aerobic cultivation was also performed in a fermenter (3-liter glass bioreactor, Applikon, Schiedam, The Netherlands) at 70% saturation with dissolved oxygen.
Fig. 3.
Influence of oxygen supply during cultivation on acetate production by a strain with disrupted pta and by a control strain. BW18499 (pta+) and BW18793 (pta-200) were cultivated in M9 medium in shake flasks. Two cultures were measured for each condition. Anaerobic cultivation was carried out in tubes sealed with Parafilm.
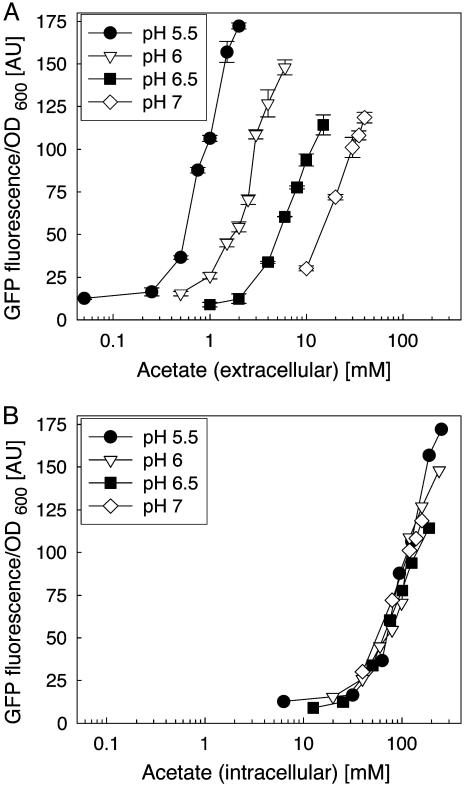
glnAp2 Characterization. This method is relevant for the results shown in Fig. 4. An overnight culture of BW18793/pGlnAp2GFPmut3.1 in M9 medium (0.5% glucose, pH 7) was centrifuged (3,000 × g), and the cells were resuspended in M9 medium (0.5% glucose/2 mM phosphate/100 μg/ml ampicillin) buffered with 100 mM Mes or Mops at pH 5.5, 6.0, 6.5, or 7.0. The suspensions were centrifuged, resuspended in the same buffer, and transferred into microwell plates (200 μl per well, black with clear flat bottom, Corning). The plates were sealed (Thermowell sealing tape, Corning) and incubated in a rotary shaker at 30°C and 425 rpm for 30 min. Acetate (adjusted to the appropriate pH) was added to different final concentrations. The expression of GFP was measured by using a fluorescence microplate reader (Gemini XS, Molecular Devices) with excitation at 472 nm and emission at 515 nm. Cell densities were measured with an absorbance microplate reader (Powerwave XS, Bio-Tek, Winooski, VT) at 600 nm. The plates were sealed and incubated at 30°C and 425 rpm for 90 min, and GFP fluorescence and cell density were measured again. The intracellular acetate concentration was calculated from the extracellular concentration and ΔpH over the membrane with the Henderson–Hasselbalch equation:
 |
Fig. 4.
Induction of the glnAp2 promoter with acetate at different pH values. The QS strain was incubated for 90 min in medium of different pH values containing different concentrations of acetate. Values for GFP fluorescence and OD600 are means of two parallel cultures for each condition. (A) Fluorescence normalized against cell densities is plotted versus acetate concentration in the medium. (B) The same fluorescence data set is plotted versus intracellular acetate concentration. Intracellular acetate concentration was calculated from the extracellular acetate concentration and ΔpH over the cell membrane by using the Henderson–Hasselbalch equation.
QS Experiments. This method is relevant for the results shown in Figs. 5, 6, 7 (Fig. 7 is published as supporting information on the PNAS web site). The QS strain was grown in M9 medium with 0.5% glucose and 100 μg/ml ampicillin. The cells were harvested by centrifugation (3,000 × g) in exponential phase (OD600 = 0.5–0.7), resuspended in M9 medium (0.5% glucose, 2 mM phosphate) buffered with 200 mM Mes or Mops at various pH values. Suspensions were centrifuged, resuspended with the same buffer, and incubated in a rotary shaker at 250 rpm and 37°C. GFP fluorescence and cell density were monitored, and acetate in the medium was measured with an enzymatic assay (acetic acid kit, R-Biopharm, Darmstadt, Germany) or by using HPLC with an aminex HPX 87-H column (Bio-Rad).
Fig. 5.
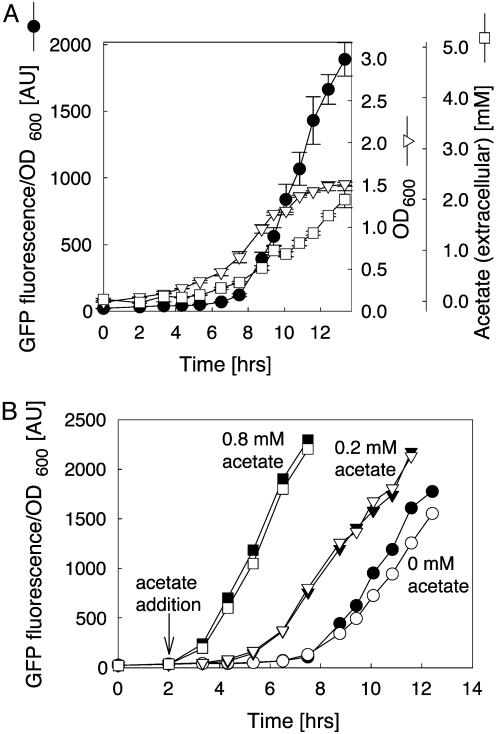
Demonstration of QS behavior. (A) The QS strain was cultivated in M9 medium at pH 5.5 in two parallel cultures. GFP fluorescence, OD600, and acetate concentration were measured. GFP fluorescence and OD600 levels were measured in triplicate. Acetate concentrations were measured in duplicate. (B) The QS strain was cultivated as for A. After 2 h acetate was added to four of the six parallel cultures. □ and ▪, 0.8 mM acetate added; ▿ and ▾, 0.2 mM acetate added; ○ and •, no acetate added. GFP fluorescence and OD600 were measured in triplicate. Open and closed forms of the symbols are used for better distinction between the two parallel cultures.
Fig. 6.
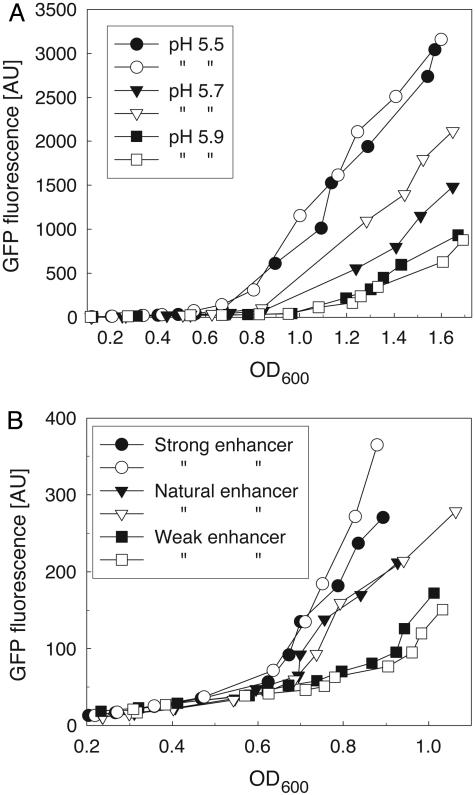
Tuning of the QS circuit. (A) Effect of environmental pH on the QS behavior. Two cultures of the QS strain were grown in M9 medium at pH 5.5, 5.7, and 5.9, respectively. GFP fluorescence and OD600 were measured in triplicate. Open and closed forms of the symbols are used for better distinction between the two parallel cultures. (B) Influence of enhancer sequence on circuit sensitivity. Variants of the QS strain bearing the natural enhancer sequence, or a weak or a strong variant of it, respectively, were grown in M9 medium at pH 5.5. GFP fluorescence and OD600 were measured in triplicate in two cultures for each variant.
Enhancer Mutagenesis. This method is relevant for the results shown in Fig. 6B. The enhancer sequence was mutagenized with Splicing by Overlap Extension (SOE) with pGlnAp2GFPmut3.1 as template (20). Details of the PCR conditions and the primer sequences can be found in Supporting Text, which is published as supporting information on the PNAS web site.
Results
Design. This design of a cell–cell communication circuit aims at simplicity and tunability. Simplicity leads to straightforward modeling and predictability of its behavior under different environmental conditions. Tunability of the circuit allows the adjustment of sensitivity, input, and output levels for different applications and for the combination of this circuit to other artificial submodules. The circuit includes a connection to the metabolism of the cell to allow the construction of gene-metabolic circuitry.
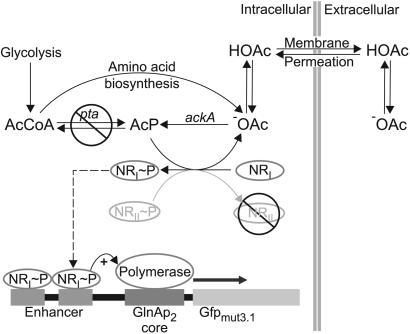
A QS circuit requires a signal molecule that is produced in a growth-dependent manner and is transported in and out of the cell. This signal has to be detected by an expression system that is specific for the signal and responds to its threshold concentration. We chose acetate as the communication molecule, because it is a secreted metabolic byproduct of many organisms, and its precursor, AcP, allows connection to metabolism and expression systems (Fig. 1). The expression system of choice is the nitrogen starvation regulon, because the nitrogen regulator protein I (NRI or NtrC) has been shown to be phosphorylated by AcP in a dose-dependent manner in the absence of its signal recognition protein NRII (NtrB) (17), the product of glnL. Phosphorylated NRI induces transcription from the glnAp2 promoter.
Fig. 1.
Scheme of the cell–cell communication circuit. Acetate functions as the communication molecule. The E. coli strain used in this work produces and secretes acetate at a constant rate through its amino acid biosynthesis. Acetate production is proportional to cell growth rather than environmental conditions and metabolic state, because the main production pathway from AcCoA is disrupted. Acetic acid diffuses freely across the cell membrane and into neighboring cells. Inside the cell, acetate is converted to AcP by Ack. In the absence of the histidine kinase NRII, AcP phosphorylates the response regulator NRI.NRI≈P binds the glnA enhancer sequence and induces the promoter glnAp2. Because acetate is constantly produced and secreted by the cell, expression from glnAp2 depends on population density.
In E. coli, acetate is mainly produced by the pta ack pathway. When grown aerobically in the presence of excess nutrients, acetate is an overflow product. Anaerobically acetate is one of the products of mixed-acid fermentation. To avoid this dependence of acetate production on the environment this pathway has to be disabled by disruption of pta. In a strain mutated in pta, acetate should be buffered from changes in metabolism. Its concentration should depend on cell density only and should be proportional to the concentration of AcP. This behavior is the first requirement of the QS circuit design.
Acetate is transported passively through the cell membrane in its protonated form and the dissociation equilibrium of acetic acid is pH-dependent. Within the cell pH is homeostatically regulated, leaving the intracellular concentration of acetate dependent on ΔpH over the cell membrane. Induction of the circuit requires a threshold intracellular concentration of acetate that is reached at different extracellular acetate concentrations, depending on the chosen extracellular pH. A lower external pH drives the accumulation of acetate in the cell and reduces the extracellular acetate concentration that is sufficient to induce the circuit. Accordingly, a low environmental pH will make the circuit more sensitive, and the quorum needed for a response of the circuit will be smaller. In this way, a weak acid as sensor molecule allows tuning of the circuit sensitivity by pH adjustment.
We intended to modify circuit sensitivity by engineering of its components, targeting the signal transduction cascade from AcP to the glnAp2 promoter. NRI binds to an enhancer sequence 120 bp upstream of the glnAp2 promoter (21). Phosphorylation of NRI facilitates oligomerization to a complex of at least two NRI≈P dimers on two neighboring binding sites of the enhancer sequence (22). This complex activates transcription from the glnAp2 promoter (23, 24). To demonstrate the circuit tuning the enhancer sequence was mutated to change its affinity to NRI≈P.
Model. Circuit behavior was simulated with a mathematical model describing production and secretion of acetate, properties of acetate kinase (Ack) and AcP, and induction of glnAp2 by NRI≈P. The model was based on the following assumptions. (i) The system is a well mixed homogenous culture. (ii) Acetic acid but not acetate transport across the cell membrane is relevant, because the membrane permeability of acetic acid (Pm, 6.9·10–4 cm/s) is about three orders of magnitude higher than that of acetate (25, 26). (iii) The kinetics of Ack follow a Michaelis–Menten equation depending on acetate and AcP only. (iv) The intracellular NRI concentration is in excess, and the glnAp2 promoter responds directly to the concentration of AcP, because a glnL negative host is used. The model equations and details of model derivation and parameter selection are in Supporting Text.
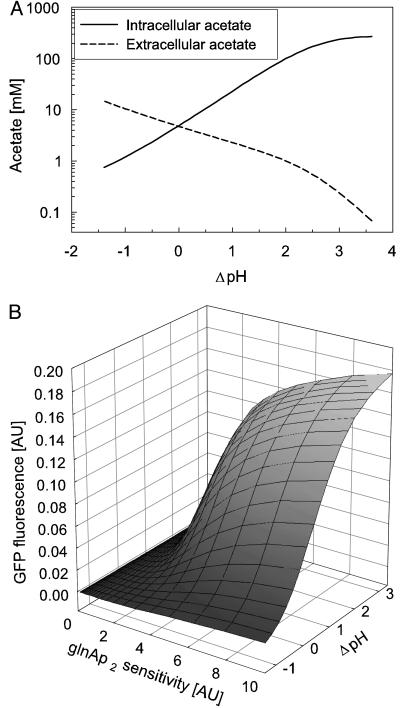
The influence of ΔpH on acetate concentration inside and outside of the cells was simulated (Fig. 2A). The model simulated 10 h of growth with an initial cell density of 2.5·107 cells ml–1 (OD600 0.1) at different ΔpH values and calculated the resulting acetate concentrations. A higher ΔpH leads to a dramatic increase of the intracellular concentration of acetate. Also, the influence of ΔpH and the strength of the enhancer-binding sites on GFP expression was simulated. The model simulated 10 h of growth at an intracellular pH of 7.6 and an environmental pH ranging from 5.0 to 8.0 (Fig. 2B). The model predicted that at neutral extracellular pH (ΔpH = 0.6) QS behavior does not occur if the natural enhancer sequence is used. However, when the ΔpH value is increased, the artificial system drives the transcription of the reporter gene. Changing the sensitivity of the glnAp2 promoter had a similar effect on the circuit. Higher sensitivity increased expression from glnAp2 and made the system more responsive. These results underline the circuit's potential tunability by ΔpH and by genetic engineering of the enhancer, targeting signal molecule transport and glnAp2 sensitivity.
Fig. 2.
(A) Simulation of intra- and extracellular acetate produced by the QS strain at different ΔpH values after 10 h of growth. The intra- and extracellular concentrations of acetic acid are similar and increase from 1.6 μMat ΔpH –1 to 0.37 mM at ΔpH 3.5. (B) Simulation of the circuit response after 10 h of growth at different glnAp2 sensitivity and ΔpH values. GlnAp2 sensitivity is defined as 1/Kl (see Table 3, which is published as supporting information on the PNAS web site).
Experimental Realization. For QS, the signal production of a culture has to be proportional to cell density and independent of environmental conditions that may change during cultivation. In wild-type E. coli, fermentative metabolism produces more acetate than respiration. In addition to the pta ack pathway, E. coli produces acetate as a by-product of arginine and cysteine biosynthesis. Thus, disruption of the pta ack pathway is predicted to reduce acetate production significantly and make it independent of oxygen availability. As expected, the pta+ control strain (BW18499) produced more acetate anaerobically than aerobically. In contrast, cultivation of the pta-200 strain (BW18793) under anaerobic and aerobic conditions shows the same acetate production rate for both conditions (Fig. 3). This behavior was verified for cultivation in shake flasks and in a fermenter (data not shown). This result fulfills the first requirement of the design.
The model predicts that, in the absence of NRII, the glnAp2 promoter activity depends on acetate concentration and pH in the medium. The artificial QS strain (BW18793/ pGlnAp2GFPmut3.1) was cultivated at different pH values, and GFP expression and acetate concentration were measured. As predicted by the model, expression from glnAp2 at a given acetate concentration was higher at lower pH (Fig. 4A). This behavior resulted from the ΔpH-dependent partitioning of acetate between medium and intracellular volume. When fluorescence is plotted versus the calculated intracellular acetate concentration the plots for the different ΔpH values merge (Fig. 4B). This result verifies our prediction of circuit behavior.
The cell–cell communication circuit was designed to fulfill the essential criteria for QS: The communication molecule should accumulate with cell growth. On reaching a threshold concentration, the signal molecule triggers a signal transduction cascade, leading to promoter activation. To verify this behavior experimentally, the artificial QS strain (BW18793/pGlnAp2GFPmut3.1) was cultivated at pH 5.5, and cell growth, acetate concentration, and GFP expression were monitored (Fig. 5A). Throughout the exponential growth phase acetate concentration increases proportionally to cell density, indicating that acetate is secreted at a constant rate by the individual cells. After 7.5 h at OD600 = 0.6 the signal molecule acetate reaches the threshold concentration for glnAp2 response (0.4 mM). At this point GFP expression is induced and fluorescence increases linearly.
In a control experiment, we monitored cell growth, acetate concentration, and GFP expression of BW18500/pGlnAp2GFPmut3.1, a strain in which ack is disrupted. Growth and extracellular acetate accumulation profiles were almost identical with the QS strain, but induction of GFP expression was not observed (data not shown). To verify that GFP expression is linked to a threshold cell density by the acetate concentration in the medium, we repeated the QS experiment and added different concentrations of acetate to the cultures (Fig. 5B). Addition of acetate in a concentration higher than that observed at threshold cell density led to immediate induction of the circuit and linear increase of GFP expression (0.8 mM in Fig. 5B). Addition of a lower concentration of acetate resulted in circuit response at a cell density below the threshold density observed without addition of acetate (0.2 mM in Fig. 5B). These results show that the QS circuit's response is decoupled from the threshold cell density by addition of acetate, confirming acetate as the signal responsible for threshold activation.
In circuit engineering accumulation of slow-degrading proteins can alter results. The mathematical model predicts that the artificial cell–cell communication circuit is not sensitive to the half-life of the reporter protein GFP (data not shown). GFPmut3.1 with a half-life of >24 h was used in the QS strain (18). To verify the model's prediction GFPmut3.1 was exchanged with a fast-degrading variant (GFPAAV) with a half-life of 1 h (18). The modified QS strain showed essentially the same behavior of threshold activation as that observed with the more stable GFPmut3.1 as reporter protein (Fig. 7).
Constitutive expression (leakiness) is an important problem in engineering biological circuits. To assess leakiness we cultivated the QS strain (BW18793/pGlnAp2GFPmut3.1) and BW18793 in parallel under the conditions described for the QS experiment. After 5 h of incubation and before reaching the threshold cell density GFP fluorescence/OD of the QS strain was 8 arbitrary units (AU) higher than that measured for BW18793. Background fluorescence/OD of the cells was 35 AU after 5 h as measured for BW18793. When fully induced under the same conditions, the QS strain produced 2,030 AU GFP fluorescence/OD in 5 h. Constitutive expression is 0.4% of the maximum output of the induced circuit.
Tunability is an important feature of the cell–cell communication circuit design. To show the feasibility of tuning by ΔpH, the QS strain was grown at different pH values (Fig. 6A). At pH 5.5, expression is induced at a lower cell density and increases faster than at pH 5.7. Expression at pH 5.9 requires an even larger quorum, and at pH 6.9 no response of the circuit occurs (data not shown). Simulation indicated that engineering the enhancer sequence of the glnAp2 promoter can change circuit sensitivity. The natural enhancer sequence is composed of two sites with regions of imperfect dyad symmetry. Porter et al. (22, 23) exchanged both natural sites with a site from the ntrBC promoter region with higher dyad symmetry that showed increased affinity to NRI (“strong enhancer”). In another mutant, the symmetry of one region was destroyed to reduce its affinity to the pair of NRI dimers needed for activation of transcription (“weak enhancer”). We changed the natural enhancer into the strong and the weak variant by site-directed mutagenesis. When incorporated into the QS circuit, the strong enhancer leads to a more sensitive circuit and the weak variant renders a less sensitive circuit than the natural enhancer (Fig. 6B). Consequently, a stronger enhancer reduces the threshold cell density required for circuit induction. As predicted by the simulation the circuit can be tuned by ΔpH and by genetic engineering of the enhancer sequence.
Discussion
In this work, an artificial cell–cell communication circuit was constructed. The system was demonstrated to function as a quorum sensor fulfilling the following criteria. It was shown that the signal molecule acetate is constantly produced by the cells. This signal diffuses across the cell membrane to allow cell–cell communication. The concentration of acetate correlates with cell density, and acetate only induces transcription when a threshold cell density is reached. The fast transition of the culture from no reporter expression to expression of GFP at the threshold cell density and the linear increase of the circuit response thereafter suggest that the transcriptional response is cooperative.
Conceptual design and mathematical modeling correctly predicted the system's behavior, including its response to interventions in signal transport (ΔpH) and genetic engineering of signal transduction (enhancer engineering). Further improvement of the circuit will be facilitated by its predictability. In this regard, other members of the signal transduction cascade from Ack to glnAp2 are suitable targets for protein engineering that can further improve sensitivity. Variants of components can then be combined to yield a library of circuits harboring a range of characteristics.
This acetate-based cell–cell communication system was not built for QS alone, which is just an example for cell–cell communication in a broader sense. The use of the primary metabolite acetate as signal molecule can eventually allow communication of metabolic states. When pta is inactivated, the system behaves like a quorum sensor through the coupling of acetate production and cell density. When pta is active, the cell–cell communication becomes sensitive to general metabolic states through the coupling between acetate and the central metabolism. In the latter situation, the system does not work as a quorum sensor but still as a cell–cell communicator. The potential of acetate to reflect the cell's metabolic state in other genetic backgrounds opens up the possibility to use this system to communicate metabolic state when pta is active and cell density when pta is inactive. This versatility may prove to make this circuit an important tool for gene-metabolic circuit design.
In wild-type cells, acetate is produced through the pta ack pathway with AcP as the intermediate. Disruption of pta resulted in reduced acetate production, but the pta-200 strain still produced and secreted acetate, which was the basis for the artificial circuit's design. In fact, acetate leakage in pta or pta ackA mutant strains has been observed in bacteria such as E. coli and Bacillus subtilis, but the responsible pathway has not been elucidated (27–29). To determine the source of acetate, acs and poxB were disrupted in the pta-200 strain. However, acetate production by these strains was not reduced significantly (data not shown), thus suggesting that acs and poxB are not a major source of acetate. Other sources of acetate can be found in amino acid and fatty acid metabolism. The identification of the source of residual acetate production in the pta mutant strain would permit even greater control of the system.
Acetate is a common metabolite produced by most living organisms. Moreover AcP is a regulator in many bacteria. Two-component systems in E. coli such as Ntr, Pho, and Che are capable of using AcP as a phosphate donor for their cognate regulation proteins (17). Many other bacteria are known to possess similar two-component systems, which can be modified to respond to AcP (30, 31). This situation suggests that the strategy used in the artificial cell–cell communication system can be universally applied to other bacteria. Hence, the artificial system presented here also possesses the capability for interspecies communication and can serve as a model system to understand how communication between cells of the same or different species can lead to various behaviors and phenotypes observed in nature.
Supplementary Material
Acknowledgments
This work was supported in part by Award NCC 2–1364 from the Center for Cell Mimetic Space Exploration, a National Aeronautics and Space Administration University Research, Engineering, and Technology Institute.
This paper was submitted directly (Track II) to the PNAS office.
Abbreviations: QS, quorum sensing; AcP, acetyl phosphate; NRI, nitrogen regulator protein I; Ack, acetate kinase; AU, arbitrary units.
See Commentary on page 2221.
References
- 1.Elowitz, M. B. & Leibler, S. (2000) Nature 403, 335–338. [DOI] [PubMed] [Google Scholar]
- 2.Atkinson, M. R., Savageau, M. A., Myers, J. T. & Ninfa, A. J. (2003) Cell 113, 597–607. [DOI] [PubMed] [Google Scholar]
- 3.Gardner, T. S., Cantor, C. R. & Collins, J. J. (2000) Nature 403, 339–342. [DOI] [PubMed] [Google Scholar]
- 4.Becskei, A. & Serrano, L. (2000) Nature 405, 590–593. [DOI] [PubMed] [Google Scholar]
- 5.Yokobayashi, Y., Weiss, R. & Arnold, F. H. (2002) Proc. Natl. Acad. Sci. USA 99, 16587–16591. [DOI] [PMC free article] [PubMed] [Google Scholar]
- 6.Hasty, J., McMillen, D. & Collins, J. J. (2002) Nature 420, 224–230. [DOI] [PubMed] [Google Scholar]
- 7.Weiss, R., Basu, S., Hooshangi, S., Kalmbach, A., Karig, D., Mehreja, R. & Netravali, I. (2003) Nat. Comput. 2, 47–84. [Google Scholar]
- 8.Farmer, W. R. & Liao, J. C. (2000) Nat. Biotechnol. 18, 533–537. [DOI] [PubMed] [Google Scholar]
- 9.McCleary, W. R. & Stock, J. B. (1994) J. Biol. Chem. 269, 31567–31572. [PubMed] [Google Scholar]
- 10.Wolfe, A. J., Chang, D. E., Walker, J. D., Seitz-Partridge, J. E., Vidaurri, M. D., Lange, C. F., Pruss, B. M., Henk, M. C., Larkin, J. C. & Conway, T. (2003) Mol. Microbiol. 48, 977–988. [DOI] [PubMed] [Google Scholar]
- 11.Engebrecht, J., Nealson, K. & Silverman, M. (1983) Cell 32, 773–781. [DOI] [PubMed] [Google Scholar]
- 12.Bassler, B. L. (1999) Curr. Opin. Microbiol. 2, 582–587. [DOI] [PubMed] [Google Scholar]
- 13.Fuqua, C., Parsek, M. R. & Greenberg, E. P. (2001) Annu. Rev. Genet. 35, 439–468. [DOI] [PubMed] [Google Scholar]
- 14.Bassler, B. L. (2002) Cell 109, 421–424. [DOI] [PubMed] [Google Scholar]
- 15.Weiss, R. & Knight, T. F., Jr. (2000) in DNA6: Sixth International Meeting on DNA Based Computers (Springer, Leiden, The Netherlands), pp. 1–16.
- 16.McMillen, D., Kopell, N., Hasty, J. & Collins, J. J. (2002) Proc. Natl. Acad. Sci. USA 99, 679–684. [DOI] [PMC free article] [PubMed] [Google Scholar]
- 17.Feng, J., Atkinson, M. R., McCleary, W., Stock, J. B., Wanner, B. L. & Ninfa, A. J. (1992) J. Bacteriol. 174, 6061–6070. [DOI] [PMC free article] [PubMed] [Google Scholar]
- 18.Andersen, J. B., Sternberg, C., Poulsen, L. K., Bjorn, S. P., Givskov, M. & Molin, S. (1998) Appl. Environ. Microbiol. 64, 2240–2246. [DOI] [PMC free article] [PubMed] [Google Scholar]
- 19.Sambrook, J., Fritsch, E. F. & Maniatis, T. (1989) Molecular Cloning: A Laboratory Manual (Cold Spring Harbor Lab. Press, Plainview, NY).
- 20.Horton, R. M. (1995) Mol. Biotechnol. 3, 93–99. [DOI] [PubMed] [Google Scholar]
- 21.Reitzer, L. J. & Magasanik, B. (1986) Cell 45, 785–792. [DOI] [PubMed] [Google Scholar]
- 22.Porter, S. C., North, A. K., Wedel, A. B. & Kustu, S. (1993) Genes Dev. 7, 2258–2273. [DOI] [PubMed] [Google Scholar]
- 23.Porter, S. C., North, A. K. & Kustu, S. (1995) in Two-Component Signal Transduction, eds. Hoch, J. A. & Silhavy, T. J. (ASM Press, Washington, D.C.), pp. 147–158.
- 24.Ninfa, A. J., Reitzer, L. J. & Magasanik, B. (1987) Cell 50, 1039–1046. [DOI] [PubMed] [Google Scholar]
- 25.Walter, A. & Gutknecht, J. (1986) J. Membr. Biol. 90, 207–217. [DOI] [PubMed] [Google Scholar]
- 26.Gutknecht, J. & Tosteson, D. (1973) Science 182, 1258–1261. [DOI] [PubMed] [Google Scholar]
- 27.Chang, D. E., Shin, S., Rhee, J. S. & Pan, J. G. (1999) J. Bacteriol. 181, 6656–6663. [DOI] [PMC free article] [PubMed] [Google Scholar]
- 28.Presecan-Siedel, E., Galinier, A., Longin, R., Deutscher, J., Danchin, A., Glaser, P. & Martin-Verstraete, I. (1999) J. Bacteriol. 181, 6889–6897. [DOI] [PMC free article] [PubMed] [Google Scholar]
- 29.Yang, Y. T., Bennett, G. N. & San, K. Y. (1999) Biotechnol. Bioeng. 65, 291–297. [PubMed] [Google Scholar]
- 30.Kim, S. B., Shin, B. S., Choi, S. K., Kim, C. K. & Park, S. H. (2001) FEMS Microbiol. Lett. 195, 179–183. [DOI] [PubMed] [Google Scholar]
- 31.Bernish, B. & van de Rijn, I. (1999) J. Biol. Chem. 274, 4786–4793. [DOI] [PubMed] [Google Scholar]
Associated Data
This section collects any data citations, data availability statements, or supplementary materials included in this article.


