

Abstract
BACKGROUND AND PURPOSE
The mechanisms of paraquat (PQ)-induced toxicity are poorly understood and PQ poisoning is often fatal due to a lack of effective antidotes. In this study we report the effects of N-[2-(2-methoxy-6H-dipyrido{2,3-a:3,2-e}pyrrolizin-11-yl)ethyl]-2-furamide (NMDPEF), a melatonin-related inhibitor of quinone oxidoreductase2 (QR2) on the toxicity of PQ in vitro & in vivo.
EXPERIMENTAL APPROACH
Prevention of PQ-induced toxicity was tested in different cells, including primary pneumocytes and astroglial U373 cells. Cell death and reactive oxygen species (ROS) were analysed by flow cytometry and fluorescent probes. QR2 silencing was achieved by lentiviral shRNAs. PQ (30 mg·kg−1) and NMDPEF were administered i.p. to Wistar rats and animals were monitored for 28 days. PQ toxicity in the substantia nigra (SN) was tested by a localized microinfusion and electrocorticography. QR2 activity was measured by fluorimetry of N-benzyldihydronicotinamide oxidation.
KEY RESULTS
NMDPEF potently antagonized non-apoptotic PQ-induced cell death, ROS generation and inhibited cellular QR2 activity. In contrast, the cytoprotective effect of melatonin and apocynin was limited and transient compared with NMDPEF. Silencing of QR2 attenuated PQ-induced cell death and reduced the efficacy of NMDPEF. Significantly, NMDPEF (4.5 mg·kg−1) potently antagonized PQ-induced systemic toxicity and animal mortality. Microinfusion of NMDPEF into SN prevented severe behavioural and electrocortical effects of PQ which correlated with inhibition of malondialdehyde accumulation in cells and tissues.
CONCLUSIONS AND IMPLICATIONS
NMDPEF protected against PQ-induced toxicity in vitro and in vivo, suggesting a key role for QR2 in the regulation of oxidative stress.
LINKED ARTICLE
This article is commented on by Baltazar et al., pp. 44–45 of this issue. To view this commentary visit http://dx.doi.org/10.1111/j.1476-5381.2012.02017.x
Keywords: NQO2, oxidative stress, ROS, paraquat, pesticides, astrocytes, mammary epithelial cells, substantia nigra, electrocorticogram
Introduction
Paraquat (1,1′-dimethyl-4,4′-bipyridinium; PQ) is a herbicide used worldwide and the acute exposure to PQ, after accidental or suicidal ingestion, causes thousands of deaths each year. However, clinical management of PQ poisoning is often unsuccessful due to a lack of effective antidotes (Dinis-Oliveira et al., 2009a). PQ poisoning leads to fatal injury of lungs, kidneys, liver, brain and other organs. PQ is toxic to all cell types, but the active accumulation of PQ via diamine transporters in alveolar epithelial cells (pneumocytes type I and II) has been proposed to be responsible for the high sensitivity of lung tissue (Dinis-Oliveira et al., 2008).
Chronic exposure to PQ and other pesticides has been implicated in the pathogenesis of neurodegenerative disorders such as Parkinson's disease (Hatcher et al., 2008) a common neurodegenerative disorder in the elderly, characterized by the loss of dopaminergic neurons in substantia nigra pars compacta (SN). In support of a causative role of PQ in Parkinsonian pathology, many animal models have been developed that show certain features of the disease, like nigrostratial degeneration or dyskinaesia, following acute or chronic exposures to the herbicide or to a structurally related toxin, MPTP (Duty and Jenner, 2011; Nistico et al., 2011). PQ has been shown to cause a selective death of dopaminergic neurons, a process mediated by oxidative stress and a marked activation of microglial cells (Peng et al., 2005; 2009). These events correlate with potent behavioural, electrocortical (ECoG) and neurodegenerative effects following PQ injection into several areas of the rat brain (Mollace et al., 2003). These effects can be prevented by administration of a non-peptidyl superoxide dismutase (SOD) mimetic (Mollace et al., 2003), suggesting that oxidative stress is involved in the neurotoxic response to PQ.
The mechanism whereby PQ induces oxidative stress and elicits cell damage involves a cyclic reduction/oxidation of the PQ di-cation with consumption of NAD(P)H and production of superoxide anion (Bus and Gibson, 1984; Drechsel and Patel, 2008). This process is likely to be catalysed by diaphorases, i.e, enzymes with oxidoreductase activity, localized in different cellular compartments (Drechsel and Patel, 2008; Drechsel and Patel, 2009). Several NAD(P)H-dependent diaphorases have been identified as PQ-reducing enzymes. These include, cytoplasmic NADPH oxidases of the Nox family (Miller et al., 2007; Cristovao et al., 2009), a diphenylene iodonium (DPI)-sensitive thioredoxin reductase, highly expressed in alveolar epithelium (Gray et al., 2007), mitochondrial oxidoreductases present in the electron transport Complex I (Cocheme and Murphy, 2008) and Complex III (Castello et al., 2007; Drechsel and Patel, 2009) or a mitochondrial NADH-dependent reductase VDAC1 (Shimada et al., 2009). Finally, it cannot be excluded that oxidoreductases that preferentially use an alternative electron donor to NAD(P)H, are also involved in PQ-induced cytotoxicity.
N-riboside dihydronicotinamide (NRH) : quinone oxidoreductase 2 (NQO2), also known as quinone reductase 2 (QR2), is a NADPH-independent flavoenzyme typically catalysing two-electron reductions of quinones and oxidation of N-alkyl and N-ribosyl nicotinamide (NADH) derivatives (Mailliet et al., 2005); however, one and four electron reactions have also been proposed to be catalysed by this enzyme. QR2 is a homolog of quinone oxidoreductase 1 (QR1), a more extensively studied enzyme of phase II drug metabolism (Bianchet et al., 2008). QR2 and QR1 have partially overlapping substrate specificity, but distinct co-substrates and tissue expression profiles. For this reason both enzymes may play different biological roles.
Quinone and quinone-derivative conversion to hydroquinones is usually detoxifying, but in some cases leads to the bioactivation of cytotoxic compounds, such as menadione and mitomycin (Celli et al., 2006). A remarkable feature of human QR2 is its ability to act as a nitroreductase with high specificity for selected substrates. This property is essential for the bioactivation of the anti-tumour, DNA cross-linking agent CB1954 (Knox et al., 2003). The majority of QR2 substrates are xenobiotics and only a few endogenous substrates are known. For example, a possible role of this enzyme has been suggested in dopamine quinone metabolism and Parkinson's disease (Fu et al., 2008). Interestingly, genetic studies have identified an association of a promoter region polymorphism in the NQO2 gene locus characterized by a 29-bp deletion, with idiopathic and pesticide-induced Parkinson's disease (Harada et al., 2001). In light of more recent findings, this deletion disrupts the sp3 repressor binding site on the NQO2 promoter and favours an increased expression of QR2 (Wang et al., 2004; Yu et al., 2009).
Another important feature of QR2 is its ability to bind several ligands with inhibitory properties, for example natural flavonoids, such as resveratrol and quercetin, anti-tumour drugs such as imatinib, and the neurohormone melatonin. Importantly, QR2 has been identified as the melatonin MT3 receptor located in the cytoplasm (Mailliet et al., 2005) which may mediate some of the antioxidant activities of melatonin, such as its potent protective effect against PQ systemic toxicity in rats (Melchiorri et al., 1995).
Given the role of QR2 in nitroreduction, bioactivation of cytoxic xenobiotics and in melatonin signalling, we examined a potential involvement of QR2 in PQ-induced toxicity. We found that a melatonin-related and specific QR2 inhibitor, N-[2-(2-methoxy-6H-dipyrido{2,3-a:3,2-e}pyrrolizin-11-yl)ethyl]-2-furamide (NMDPEF), prevented the cytotoxic effects of PQ in vitro in several cell lines and in primary pneumocytes. Knock-down of QR2 partially rescued the cells from PQ-induced toxicity and reduced the protective effect of the QR2 inhibitor. Importantly, NMDPEF showed a potent antidote effect in vivo in animal toxicity studies. Our data suggest a novel pharmacological approach to the treatment of PQ poisoning and demonstrate a role for QR2 in the regulation of oxidative stress.
Methods
Cell culture
The human astrocytic cell line U373 (kind gift of M. Pollicita e S. Aquaro, Tor Vergata University, Rome) and human embryonic kidney cells HEK293 were cultured in the complete medium: low-glucose (1%) Dulbecco's modified Eagle's medium (DMEM) supplemented with 10% heat inactivated foetal calf serum (FCS; Lonza, Basel, Switzerland), 2 mM glutamine, 1 mM sodium pyruvate, 100 units·mL−1 penicillin, 100 µg·mL−1 streptomycin (Pen/Strep). Mouse mammary epithelial cells EpH4 were cultured as previously described (Janda et al., 2002). A549 lung carcinoma cells were cultured in F12-K medium, supplemented with 10% FCS and Pen/Strep. Only few specified experiments were carried in high-glucose DMEM (4.5% glucose) complete medium.
Measurement of QR2 activity
Fluorometric assay of QR2 activity was performed as previously described (Mailliet et al., 2005) with a few modifications. Cells were washed once in PBS, collected in PBS with a rubber scraper and centrifuged (400×g, 5 min, 4°C). The resulting cell pellet was resuspended in GPS reaction buffer (50 mM Tris/HCl, pH 7.5, 1 mM n-octyl-β-D-glucopyranoside) and homogenized by a tight glass Dounce homogenizer (Weaton) with 18 strokes on ice. A amount of 0.5 mL of GPS buffer was used for 80% confluent 10 cm dishes. Nuclei and debris were removed by centrifugation (1000×g, 5 min, 4°C). Aliquots of the supernatant were stored at −80°C until required. Protein concentration was determined by BCA assay (Pierce, Rockford, IL, USA). 1–2.5 µg of cell lysate was used for one 170 µL reaction. Reactions were carried out at room temperature in 96 well plates. N-benzyldihydronicotinamide (BNAH, Santa Cruz Biotech., Santa Cruz, CA, USA) oxidation was measured at 1 min intervals using a Victor 1420 fluorometer (Perkin Elmer, Waltham, MA, USA) with excitation at 355 nm and emission at 460 nm. Baseline measurements were taken before the addition of the enzyme source and the reaction followed for 15–20 min. Data were manipulated using Microsoft Excel and then analysed by GraphPad Prism 3.0 software for Michelis-Menten kinetics (GraphPad, San Diego, CA, USA). The velocity of the reaction was determined by curve fitting and corresponded to the velocity 2 min. after the addition of the enzyme. BNAH fluorescence coefficient per well (96 well plate) was calculated experimentally as 3.5 × 10⁸ M−1.
Isolation of pneumocytes
Primary rat alveolar epithelial cells (mainly type II pneumocytes) were isolated from lung tissue obtained from Wistar rats using techniques described previously (Dusinska et al., 1998) with modifications indicated in the Supporting Information.
Flow cytometry (FACS) analysis of cell viability and apoptosis
U373 astroglial cells were plated at 1 × 10⁴ cells cm−2 on 24 well plates 2 days before treatment. Growth medium was removed and 500 µL of fresh regular medium containing test compounds or control vehicle was added to each well. At desired time points the cells were washed with PBS (pH 7.4) once and the cell supernatants were collected into FACS tubes.
EpH4 cells were seeded 2.6 × 10⁴ cells cm−2 and treated at different time points before analysis, which was done at day 5, after plating. Cells were trypsinized for 3–4 min, (trypsin 0.05%) neutralized in pre-warmed regular medium and collected in FACS tubes.
Primary rat pneumocytes were seed after isolation at a density of 2 × 10⁵ cells cm−2 on 96 well plates and treatments were started 24 h later. Twenty-four and 72 h after treatment the adherent cells were detached by trypsinization (0.1%, 8 min, 37°C) and pooled with non-adherent cells as described earlier. The cells were then pelleted by centrifugation for 5 min at 1000 x g, and resuspended in 300 µL PBS containing 1% FBS. Trypan blue solution in PBS (0.016%; 100 µL) was added immediately and incubated for 5–10 min before FACS analysis (FACSCanto II, BD Biosciences, Erenbodgem, Belgium). The data were collected in 630 nm (PerCP-Cy5) channel.
LDH cell toxicity assay
LDH released into the medium was measured with a colorimetric kit (CytoTox96, Promega, Madison, WI, USA) as described in the Supporting Information.
QR2 knock-down with lentivirus short harpin RNA (shRNA)
Lentivirus particles coding for shRNA against QR2 were produced in 293FT cells (Invitrogen, Carlsbad, CA, USA), transfected with specific pLKO plasmids from Mission shRNA library (Sigma-Aldrich, St Louis, MO, USA) targeting human NQO2 (TRCN0000036709-13) and with lentiviral packaging vectors (kind gift of G. Morrone, UMG, Catanzaro, Italy). G418-resistant 293FT cells (3 × 10⁶) were co-transfected with 2.5 µg pLKO, 1 µg VSVG and 5 µg Delta 8.9 plasmids and Lipofectamine 2000 (Invitrogen). The lentivirus supernatant was collected 42 h post-transfection and was used directly to infect U373 cells. U373 cells (70% confluent) plated on 6 cm dishes were overlaid with 2.5 mL supernatant containing 4 µg·mL−1 polybrene (Sigma-Aldrich). The infection was carried out for 14 h. Infected U373 cells were tested in cytotoxicity assays within 10 days post-infection. EpH4 cells were infected with shRNA lentiviruses prepared as described above, but coding for mouse NQO2 (TRCN0000041873-7) and selected for 8 days with puromycin (2 µg·mL−1). QR2 down-regulation was confirmed by Western blots (see below). Aliquots of cells were frozen and analysed a few days after thawing, in cytotoxicity assays. For cytotoxicity assays, EpH4 cells were seeded on 24 well plates and cultured in 4.5% glucose DMEM, 10% FCS and cytotoxicity measured as described previously.
FACS detection of reactive oxygen species (ROS) in live cells
3,8-phenanthridinediamine, 5-(6′-triphenylphosphoniumhexyl)-5,6 dihydro-6-phenyl (MitoSOX; Mito-hydroethidium) and 3′-(p-aminophenyl)fluorescein (APF), (Molecular Probes, Eugene, OR, USA) were used to monitor mitochondrial and cytoplasmic ROS levels, respectively, according to the procedure described in the Supporting Information.
Western blot analysis
For Western blot analysis of QR2, U373 cells (80% confluent) and EpH4 cells (90–100% confluent) were lysed in RIPA buffer (50 mM Tris-HCl, 150 mM NaCl, Igepal 1%) and processed as described by Janda et al., 2011). After addition of Laemmli sample buffer, the lysates were incubated 20 min at 90°C. Protein lysates (50-100 µg) were loaded on ae 8% or 10% SDS-PAGE gel. For Bis-Tris gradient NuPage gels (Invitrogen) lysates were processed according to the manufacturer's indications. The gels were blotted on PVDF membrane and blocked with 5% milk in Tris buffered saline supplemented with 0.05% Tween-20 (TTBS) for 3 h. QR2 and QR1 were detected by overnight incubation with goat anti-QR2 (Sc-18574, Santa Cruz Biotech.) diluted 1:100 in 5% BSA and then with secondary horseradish peroxidase-conjugated anti-goat antibody (Ab) (Santa Cruz Biotech., Sc-2020) 1:5000 in 5% milk.
Immun-Star WesternC Chemiluminescent kit was used for the chemiluminescent (ECL)signal detection. Mouse anti-α-tubulin (Santa Cruz Biotech.) was used to detect tubulin on the same PVDF membrane by standard procedures, but the ECL signal was recorded by ChemiDoc XRS (Biorad, Hercules, CA, USA).
Studies of systemic toxicity in Wistar rats
All animal care and experimental procedures used in the PQ-induced toxicity studies were approved by the Italian Ministry of Health according to the law DL 116/92. Wistar rats (290–310 g; Harlan, Italy) were used. Animals were housed under controlled temperature (20 + 2°C), humidity (60%) and a 12 h light/12 h dark cycle (light on at 0800 h); food and water were available ad libitum. Rats were divided in five groups (six per group): G1 – Control, G2 – PQ only, G3 – NMDPEF only and G4, G5 – PQ plus NMDPEF 3 and 4.5 mg·kg−1 respectively. A 50 mg·mL−1 NMDPEF solution in DMSO was diluted in pre-warmed 150 mM NaCl solution (1 or 1.5:100) and vigorously mixed. PQ was diluted to 60 mg·mL−1 in 150 mM NaCl.
Animals (groups G2 and G4) and were injected i.p. with PQ (30 mg·kg−1). NMDPEF solution (0.5 mg·kg−1[G4 group] or 0.75 mg·kg−1[G5 group]) was injected i.p. at 2, 4, 24, 28, 48 and 52 h after PQ treatment. Control animals (G1) were injected with the same amount of vehicle (NaCl solution plus DMSO) at the same times. G3 animals were treated with vehicle (0.9% NaCl) instead of PQ solution, followed by NMDPEF i.p. injections at the same times as the G5 animals. The animals were monitored daily for signs of toxicity for 28 days and longer. A group of surviving treated animals was killed 3.5 months after PQ treatment to assess any late PQ toxicity, such as lung fibrosis.
Microinfusion into the SN
PQ-induced brain toxicity studies were approved by the Italian Ministry of Health according to the law DL 116/92. Animals were housed as described earlier. Rats were anaesthetized with chloral hydrate (400 mg·kg−1 i.p.) and positioned in a stereotaxic frame (D. Kopf Instruments, Tujunga, CA, USA). A stainless steel guide cannulae (25 gauge) was then implanted unilaterally into the SN under stereotaxic guidance and secured to the skull with a dental acrylic. In the same session, four electrodes were chronically inserted into each frontoparietal cortex to permit recording of ECoG activity (Bagetta et al., 1994). Rats were allowed 2 days of recovery before experiments were carried out. No alteration of posture or motor activity changes have been found over this period. For testing, the animals were placed into individual transparent Perspex cages and allowed to acclimatize to the new environment for 15 min.
PQ was solubilised in PBS. Drugs were solubilised in DMSO and then diluted in PBS. Microinfusion of drugs or vehicle (5% DMSO diluted in PBS) was carried out by means of a 10 µL Hamilton syringe connected by a Teflon tube to an injector cannula. Test compounds were microinjected in a total volume of 1 µL. The injector cannula was left in place for a further 2 min after completing the injection. Drugs or vehicle were infused for 30 min before PQ injection. Each animal was treated only once and monitored continuously for 4 h after treatment. Postural, locomotor changes and convulsive behaviour were recorded by two independent observers who were unaware of the treatment the animals had received.
Malondialdehyde (MDA) determination in brain tissue and isolated cells
MDA standard was prepared by hydrolysis of 1,1,3,3-tetraethoxypropane. Endogenous MDA was determined indirectly by quantifying the content of 2,4-dinitrophenylhydrazone, which is the product of the derivatization reaction of MDA with 2,4-dinitrophenylhydrazine (DNPH).
In order to obtain brain tissue, the animals were killed 24 h after treatment and the SN area excised. 0.5 g of tissue per sample was homogenized in phosphate buffer (0.01 M, pH 7.0). Cultured cells (8 × 10⁶) were treated as required with PQ plus NMDPEF or vehicle (DMSO) and 18 h later cells were resuspended in phosphate buffer by scraping. The biological material was sonicated and then centrifuged at 4500×g for 5 min. The supernatant was collected and used for the derivatization reaction, which was carried out for 30 min at room temperature. The solid-phase extraction procedure was applied to isolate 2,4-dinitrophenylhydrazone from biological samples.
Quantitative analysis of derivatization reaction products was performed on Agilent 1200 using a 20 µL loop injection valve (Agilent, Santa Clara, CA, USA). The chromatographic system was attached to a diode-array detector. A methanol solution of hydrazone and acid solution of DNPH were injected into the column and identified by their relative retention times determining the maximum wavelength of absorption of the hydrazone at 310 nm. A mixture of H2O acidified by CF3COOH (pH = 2.20) and acetonitrile, in ratio of 45:55 (v/v) was used as mobile phase. It was delivered at a flow rate of 1.0 mL·min−1 through a Nucleosil 100-5 RP/18 (25 × 4.6 cm, 4 µm) reverse phase column (Agilent), with a relative guard column (4.5 × 0.46 cm).
Data and statistical analysis
Data are expressed as means ± SEM for the number n of independent experiments or as means ± SD for the number n of independent samples, from a representative experiment out of at least 3 independent experiments that yielded comparable results, as indicated for each figure. Numerical data from all the experiments were analysed with anova, followed by Student–Newman–Keuls test. IC50 was calculated by XLfit software package.
Materials
NMDPEF, a kind gift from Philipe Delagrange, Servier, France [100 or 20 mM stock in DMSO], melatonin (Sigma-Aldrich, 500 mM stock in DMSO), apocynin (Sigma-Aldrich, 200 mM stock in EtOH), PQ (Sigma-Aldrich, 100 mM in PBS), rotenone (Sigma-Aldrich, 10 mM in PBS) were stored in aliquots at −80°C, and dilutions were prepared shortly before treatments.
Results
The QR2 inhibitor NMDPEF prevents non-apoptotic PQ-induced cell death in astroglial and epithelial cells
In order to examine a potential involvement of QR2 in PQ-induced toxicity we tested a specific and potent QR2 inhibitor NMDPEF (Mailliet et al., 2005) (Figure 1A), in different cell systems, including lung, brain, kidney and mammary gland-derived cell lines. NMDPEF exerted a marked cytoprotective effect against PQ-induced cell death in human U373 astroglial cells, in embryonic kidney HEK293 cells (Supporting Information Figure S2A and C) and moderate or poor cytoprotective effect in other cell types These observations may be a reflection of different expression levels of QR2 in different cell lines (Supporting Information Figure S2E).
Figure 1.
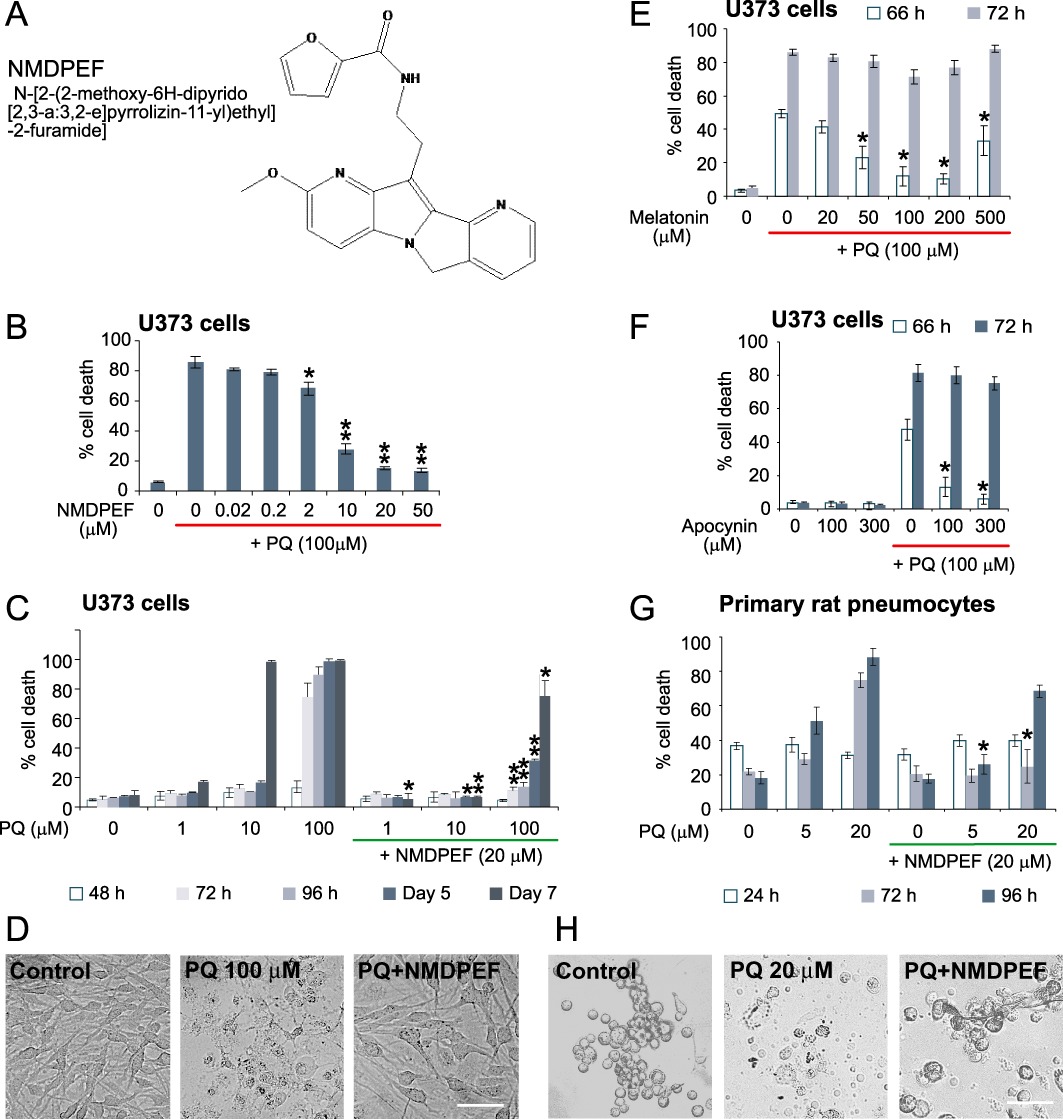
Protective effect of the QR2 inhibitor against PQ-induced cell death in vitro. (A) Structure of QR2 inhibitor NMDPEF. (B) Dose-dependent effect of NMDPEF against PQ-induced cell death in human astroglial cells U373. Cells were treated with 100 µM PQ and different concentrations of NMDPEF. Cell death was assessed by Trypan blue and FACS analysis 72 h post-treatment. (C) Long-term protective effect of NMDPEF (20 µM) against different concentrations of PQ was analysed in U373 cells for 7 days. (D) Phase-contrast micrographs of U373 cells treated with 100 µM PQ +/– 20 µM NMDPEF taken 72 h post-treatment. Bar 100 µm. (E,F) Weak and transient protective effect of melatonin (E) and a NADPH inhibitor apocynin (F) against PQ-induced cell death in U373 cells. The experiments were performed as in B but the cells were analysed at 66 and 72 h post-treatment. (G) Protective effect of NMDPEF against PQ-induced cell death in primary rat alveolar epithelial cells. Cell death was assessed by Trypan blue and FACS analysis. (H) Phase-contrast micrographs of primary pneumocytes treated with 20 µM PQ with or without 20 µM NMDPEF for 72 h. Bar 50 µM. The graphs in (B), (E) and (G) show the mean ± SEM of 3 independent experiments performed in triplicate (n= 9). The graphs C and G show the mean ± SD, n= 3, of a representative experiment out of at least three independent experiments performed in triplicate that yielded similar results. *P < 0.05, **P < 0.01; significant effect of NMDPEF, n= 9.
We chose U373 astroglial cells, which responded very well to NMDPEF, as a model system to evaluate the QR2 inhibitor in vitro. We first determined the IC50 of the cytoprotective effect of NMDPEF in U373 cells in the presence of lethal doses of PQ (100 µM). This concentration of PQ induced a non-apoptotic cell death in 60–86% U373 cells 72 h after treatment (Supporting Information Figure S1). NMDPEF prevented cell death in a dose-dependent fashion, with a maximum effect at 20–50 µM (Figure 1B) and an IC50= 6.5 µM. We also analysed the protective effect of NMDPEF over time at different PQ concentrations. NMDPEF delayed cell death induced by 100 µM PQ (Figure 1C and D) and also against millimolar concentrations. of PQ (Supporting Information Figure S2A). Furthermore, when tested against lower concentrations of PQ (1 and 10 µM) NMDPEF fully prevented cell death over a period of 7 days (Figure 1D).
NMDPEF is structurally related to melatonin and has been reported to inhibit QR2 by binding to the same site on the enzyme as melatonin (Mailliet et al., 2005) and has been shown to inhibit PQ toxicity in vivo (Melchiorri et al., 1995).Therefore, we tested if this neurohormone was able to counteract the cytoxicity of PQ in astroglial cells. Melatonin effectively blocked morphological changes induced by PQ in astroglial cells at 24–48 h, but showed only a modest and transient protection against PQ-induced cell mortality (100 µM) at later time points (Figure 1E). This effect of melatonin demonstrates a 10,000 fold weaker inhibition of QR2 activity, compared with that of NMDPEF (Mailliet et al., 2005). Apocynin, a NADH oxidase inhibitor was also shown to have a significant protective effect against PQ-induced toxicity in vitro and in vivo (Cristovao et al., 2009). However, apocynin only delayed the onset of PQ-induced cell death for several hours and had only a marginal effect at 72 h (Figure 1F). These observations correlated with our findings that, in U373 cells melatonin and apocynin had no inhibitory effect and melatonin only a weak inhibitory effect on QR2 activity (Figure 2A and B).
Figure 2.
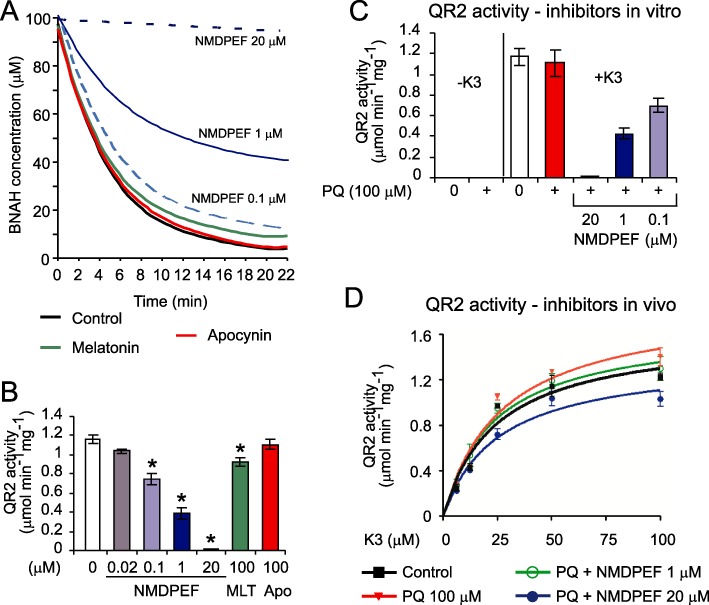
Effect of NMDPEF and PQ on QR2 activity is dependent on the assay. (A) QR2 reaction progress in the presence of substrate K3 (menadione, 100 µM), co-substrate BNAH (100 µM), U373 cell lysate (2.5 µg) and indicated conc. of NMDPEF or melatonin (100 µM) or apocynin (100 µM). The decrease in co-substrate (BNAH) fluorescence was measured by fluorimetry in triplicate. Best-fitted curves to all experimental points are shown. (B) QR2 activity in the presence of NMDPEF, melatonin (MLT) and apocynin (APO) at indicated concentrations. The reactions were carried out as described in (A) and QR2 activity was calculated. The graph shows the mean ± SEM of three independent experiments (n= 9). *P < 0.01; significantly different from control. (C) No effect of PQ on QR2 activity in vitro. U373 cell lysate (1 µg) was incubated with 100 µM PQ and 20, 1 and 0.1 µM NMDPEF in the presence or absence of K3. The graph shows the mean ± SEM of three independent experiments (n= 9). (D) Effects of PQ and NMDPEF on QR2 activity in whole cells. Cells were treated for 24 h with PQ (100 µM) with or without NMDPEF (1, 20 µM), lysed and 1 µg of the lysates (in quadruplicate) was assayed in the presence of different concentrations of substrate as indicated above. Michaelis-Menten curves were fitted by non-linear regression. The graph shows a representative experiment out of three independent experiments performed in quadruplicate, means ± SEM Note, QR2 activity is enhanced in cells exposed to PQ for 24 h and blocked by cytoprotective doses of NMDPEF.
PQ is toxic to all organs and tissues, but the major cause of death is respiratory failure mainly as a consequence of damage to alveolar epithelial cell (pneumocytes type I and II) (Dinis-Oliveira et al., 2008). For this reason we evaluated the protective effect of NMDPEF on PQ-induced cell death in pneumocytes. We decided to perform experiments on freshly isolated primary pneumocytes to avoid variability in the response due to genetic alterations present in existing cell lines (Supporting Information Figure S2). It is interesting to note that the QR2 gene is localized on a distal region of chromosome 6 (6p25), which is frequently deleted in many lung tumours (Merlo et al., 1994). Rat alveolar epithelial cells were several times more sensitive to PQ than astroglial cells and 20 µM PQ was sufficient to kill 80% of cells within 72 h (Figure 1G). NMDPEF significantly counteracted cell death induced by high and low doses of PQ (Figure 1G and H).
The effect of NMDPEF and PQ on QR2 activity in vitro
NMDPEF had a significant effect on QR2 activity in U373 cell lysates (IC50 between 0.1 and 1 µM). As expected, the inhibitory effect of melatonin (100 µM) was weak, but significant, whereas apocynin did not inhibit QR2 activity (Figure 2A and B). In order to determine whether PQ has any effect on QR2 activity we performed two types of assays. In the first assay we determined QR2 activity from U373 cell lysates in the presence of PQ with or without NMDPEF added to the in vitro reaction (Figure 2C). In the second assay, we tested QR2 activity in protein lysates prepared from cells treated for 24 h with PQ with or without the QR2 inhibitor (Figure 2D). PQ added exogenously to the QR2 activity assay did not increase BNAH consumption in the absence of menadione (Figure 2C) and had no significant effect on QR2 activity in the presence of substrate (Figure 2C). Interestingly, we could detect a statistically significant increase in QR2 activity in cells treated for 24 h with PQ (100 µM) (Figure 2D), which could be inhibited by NMDPEF (20 µM). Both assays showed that NMDPEF inhibited QR2 activity, however, the concentration required to detect a significant inhibition of QR2 in whole cells (20 µM) (Figure 2D) was much higher than the concentration required for potent inhibition of QR2 in vitro (0.1–1 µM) (Figure 2C).
QR2 inhibition prevents ROS generation in response to PQ and other oxidative agents
Next, we evaluated the ability of NMDPEF to prevent ROS generation in response to PQ, hydrogen peroxide and rotenone. ROS generation was determined by an indirect method based on the mean fluorescence intensity (MFI) measurement by FACS of mitochondrial superoxide-reactive MitoSOX probe. Although MitoSOX does not allow quantitative measurements of superoxide, it is a method of choice for comparative evaluations of oxidative stress in mitochondria (Mukhopadhyay et al., 2007). In U373 cells PQ (100µL) induced a threefold increase in MitoSOX fluorescence at 24 h and a lower, but significant increase at earlier time points (Figure 3A). Co-treatment with NMDPEF strongly attenuated mitochondrial ROS induction by PQ at each tested time point (Figure 3A and B). Rotenone (10µL) caused a comparable increase in mitochondrial superoxide levels, but the decrease in MitoSOX-MFI caused by NMDPEF was significantly less pronounced (Figure 3A and B). In line with these findings, NMDPEF delayed or prevented cell death induced by rotenone, but was more effective in preventing PQ-dependent cytotoxicity (Supporting Information Figure S3). The antioxidant activity of NMDPEF was further confirmed by the use of another fluorescent probe, APF, which is sensitive to hydroxyl radicals and NO, but not to hydrogen peroxide levels in the cytoplasm (Setsukinai et al., 2003). PQ induced a maximal shift in cytoplasmic ROS levels around 11 h post-treatment. A similar effect was observed when H2O2 (1 mM) was applied. The increase in APF-MFI was attenuated by NMDPEF, but its antioxidant effect was significantly weaker against H2O2-induced oxidative stress (Figure 3C and D).
Figure 3.
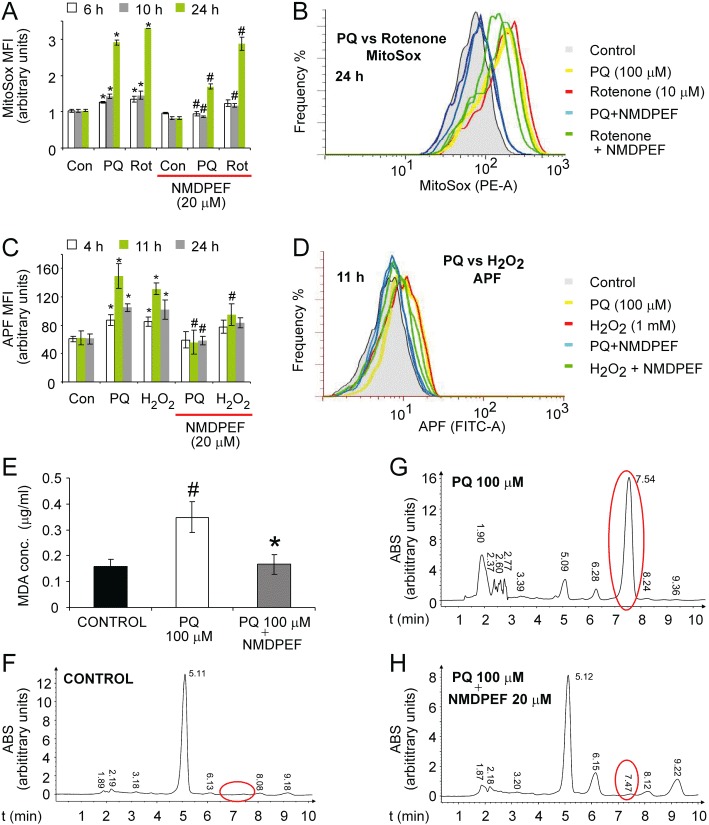
QR2 inhibitor NMDPEF prevents ROS production induced by PQ, hydrogen peroxide and rotenone, but the protective effect is greater against PQ. The oxidative stress was measured by an MFI of MitoSOX using FACS. (A) U373 cells were treated with PQ (100 µM) or rotenone (10 µM) + /– NMDPEF (20 µM). Six, 10, 24 h later the cells were loaded with MitoSOX, trypsinized and analysed by FACS. (B) Representative fluorescence histograms of the experiment shown in A (two histograms for each 24 h treatment). (C) U373 cells were treated with PQ (100 µM) and or H2O2 (1 mM) and APF probe was used to quantify ROS levels. (D) Representative FITC channel fluorescence histograms of the experiment shown in C (two histograms for each 11 h treatment). Data represent the mean ± SEM, n= 6, of three independent experiments performed in duplicate. *P < 0.05, **P < 0.01, significant differences between untreated versus PQ-, rotenone- or H2O2-treated cells. #P < 0.05, significant effect of NMDPEF. (E-H) NMDPEF blocks lipid peroxidation in cells exposed to PQ. (E) Cells were treated for 20 h with 100 µM PQ plus 20 µM NMDPEF or with PQ plus vehicle (DMSO) and compared with control cells (DMSO treated). MDA was measured by HPLC. Mean ± SEM, n= 3, of three independent experiments. (F) Representative HPLC profiles of MDA-derivatization products extracted from control cells, (G) cells treated with PQ (100 µM) for 20 h and (H) cells co-treated with indicated concentrations of PQ and NMDPEF for 20 h. ABS, 280 nm absorbance; red circles, MDA derivatization product – 2,4-dinitrophenylhydrazone; #P < 0.05, significant difference between untreated and PQ-treated cells. *P < 0.05, significant effect of NMDPEF.
One consequence of an oxidative insult to whole cells is lipid peroxidation, which we measured by determining the MDA content in cells treated with PQ and NMDPEF. NMDPEF efficiently inhibited the increase in MDA induced by PQ (Figure 3E–H).
These data suggest that NMDPEF is able to attenuate the oxidative stress induced by various stimuli, but with a higher specificity against PQ-induced ROS.
Silencing of QR2 attenuates PQ-induced cell death in astroglial and epithelial cells
Next we determined if QR2 is a key player in PQ-induced toxicity and if NMDPEF exerts its protective activity by binding to QR2. To answer this question we expressed shRNA against QR2, initiated by lentiviral particles, to down-regulate QR2 expression. First we evaluated the ability of four different lentiviral constructs to silence QR2 expression. Two shRNAs were able to decrease strongly QR2 levels in U373 cells (Figure 4A). U373 cells expressing different shRNAs were then tested in an LDH-based cytotoxicity assay 72 h after exposure to PQ. QR2 down-regulation strongly decreased LDH release, compared with the cells with normal QR2 levels (Figure 4B). Although QR2 silencing significantly augmented basal cell mortality in astroglial cells, it strongly attenuated the increase (∼20%) in cell death in response to 100 µM PQ, as determined by FACS analysis (Figure 4C, right panel). However, shRNA QR2 cells did not show a significant resistance to 1 mM PQ (Figure 4C, left panel). In addition, QR2 silencing led to a markedly reduced response to NMDPEF in U373 cells treated with 1 mM and 100 µM PQ (Figure 4C). The higher resistance to PQ and to NMDPEF correlated with lower expression levels of QR2 in cells expressing one of the shRNAs against QR2 – h10 (Figure 4D). We confirmed these observations in a non-transformed mammary epithelial cell line EpH4 (Supporting Information Figure S2B). EpH4 cells required puromycin selection to achieve a satisfactory down-regulation of QR2 (Figure 4E), but in contrast to astroglial cells, EpH4 QR2 shRNA expressing cells showed lower basal cell mortality compared with control cells. This observation correlated with the marked resistance to PQ-induced cell death in response to high (Figure 4F, left panel) as well as low dose PQ (Figure 4F, right panel), as compared with control (shRNA virus infected and puromycin-resistant cells). Significantly, QR2 knock-down led to a complete loss of the protective effect mediated by NMDPEF in epithelial cells.
Figure 4.
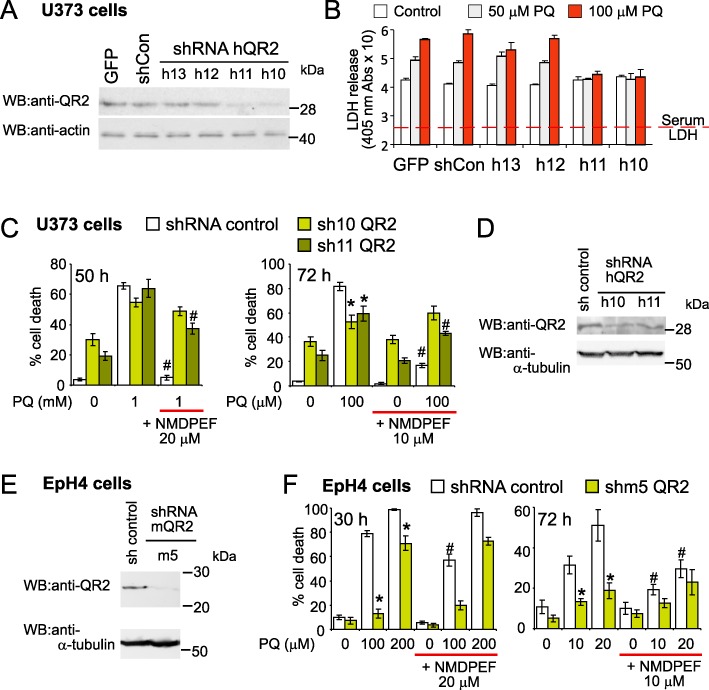
QR2 silencing attenuates cell death induced by PQ. (A) U373 cells were infected with four different lentiviruses encoding shRNA against human QR2 (shQR2) or control lentivirus [Lenti GFP and shRNA control (shCon)] and efficacy of QR2 silencing was assessed by Western blot 5 days after infection. Cell lysate (40 µg) was run on 8% SDS-PAGE gel. (B) In parallel, the cells analysed in A, were seeded in 24 well plates and incubated in the presence of PQ. Seventy-two hours post-treatment the PQ-induced toxicity was assessed by colorimetric assay for LDH content. This experiment was performed three times and yielded comparable results. Means ± SD, n= 4, of a representative experiment. The values start from the mean serum LDH background absorbance. (C) Human U373 cells infected as in A, with anti- hQR2 shRNA h10 and h11, lentiviruses effective in blocking the expression of QR2 (see Western blot in A), were incubated for 50 h with 1 mM PQ (left panel) or 72 h with 100 µM PQ (right panel). The PQ treatment was started 8 days post-infection (Day 0). Cell mortality was assessed by Trypan blue and FACS. Means ± SD, n= 3, of a representative experiment out of three experiments that yielded comparable results. (D) Western blot analysis of QR2 expression in U373 cells used in (C). Cells were lysed on day 0 of the experiment showed in C and analysed as in (A). (E) Western blot analysis of QR2 silencing in mouse epithelial cells EpH4. Cells were infected with lentiviruses producing shRNA against mouse QR2 (mQR2) and selected with puromycin for 8 days. Cell lysate (50 µg) was run on a gradient (4–12%) NuPage gel. (F) High resistance to a high and low dose of PQ in EpH4 shRNA m5 (shm5) expressing cells compared with pLKO-control shRNA cells. Eighty per cent confluent EpH4 cells, were treated with 100 µM PQ and analysed 30 h later (left panel) or with 10 µM PQ and analysed 72 h later (right panel) as described for C. Means ± SD, n= 3, of a representative experiment out of three independent experiments, performed in triplicate that yielded comparable results. *P < 0.05, statistically significant differences for shRNA QR2 cells versus the ‘no target’ shRNA pLKO control cells. #P < 0.05, significantly different from NMDPEF-untreated cells.
NMDPEF prevents systemic toxicity of PQ
As NMDPEF was a potent inhibitor of PQ effects in cultured cells, we decided to test the effects of the compound in vivo. In the systemic toxicity studies, animals were injected i.p. with PQ (30 mg·kg−1, n= 6) or vehicle. Two and 4 h later animals were injected i.p. with NMDPEF. The injections of NMDPEF were subsequently repeated on days 1 and 2 after the PQ treatment. PQ given i.p. caused visible toxicity in animals (piloerection, tremors, extended limbs, limited motor activity) which was observed the day after treatment. Animal deaths usually occurred between 4 and 14 days after injection (Figure 5A). The manifestations of PQ-induced toxicity were markedly reduced in all animals treated with NMDPEF. In addition, NMDPEF reduced (3 mg·kg−1) or fully prevented (4.5 mg·kg−1) animal mortality (Figure 5A), and potently reduced lung fibrosis in surviving PQ-treated animals (Figure 5B). Moreover, we did not observe any toxic effects after treatment with NMDPEF alone, as measured by animal behaviour or histological analysis of organs (data not shown).
Figure 5.
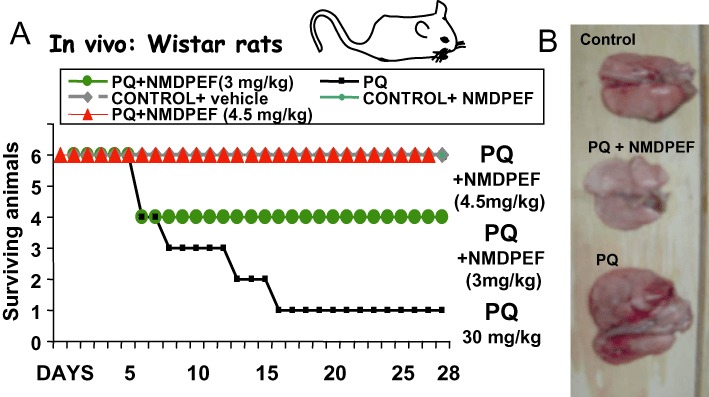
QR2 inhibitor prevents PQ-induced systemic toxicity and mortality in Wistar rats. (A) The animals (six per group) were injected i.p. with PQ (30 mg·kg−1) followed by i.p. injections of NMDPEF (0.5 mg·kg−1 or 0.75 mg·kg−1 each) 2 and 4 h later (Day 0). The drug was also administered twice on the Day 1 and twice on the Day 2 post-PQ treatment, 0.5 mg·kg−1 or 0.75 mg·kg−1 each time, to the final dose 3 and 4.5 mg·kg−1 respectively. The animals were monitored daily for signs of toxicity for 28 days post-treatment. (B) The animals surviving after the PQ treatment and controls were killed 3.5 months later and lungs were analysed for macroscopic signs of fibrosis. Note, enlarged lungs and extended areas of fibrosis in animals that survived from PQ treatment and normal size and normal appearance of lungs isolated form animals treated with 4.5 mg·kg−1 of NMDPEF and PQ.
QR2 prevents direct effects of PQ in nigral areas of the brain
In a second in vivo experiment PQ was directly microinfused into the SN. We previously reported that such a treatment leads to electrocorticographic (EcoG), epileptogenic discharges and behavioural stimulation in rats that resembles Parkinsonian movements in humans (Mollace et al., 2003). We tested the ability of NMDPEF to prevent these immediate effects of PQ and compared it with a non-peptidyl SOD mimetic, M40401. The microinfusion of 1 µL of vehicle into SN failed to modify the animal behaviour and EcoG recordings (Figure 6A) and did not induce any lethality in treated rats (Figure 6B). In contrast, PQ (25 µg) produced increased motor activity, jumping and circling of animals, starting from 27 min post-injection. EcoG showed a pattern of desynchronization with high voltage and long lasting (4 h) epileptogenic discharges (Figure 6A). All the animals died 32 ± 2.5 h after the microinfusion of PQ into SN. Pre-treatment of rats with NMDPEF or M40401 (10 µg infused into SN; n= 10) antagonized motor convulsion, ECoG epileptogenic discharges (Figure 6A) and the mortality of rats receiving PQ (Figure 6B). In particular, NMDPEF (10 µg; n= 10) injected into SN 30 min before PQ administration, prolonged the latency of symptoms (Figure 6C) and reduced PQ-related mortality of rats by 80% (Figure 6B). This observation correlated with a strong reduction in MDA levels in the nigrostratial areas of the brain in animals treated with NMDPEF, compared with PQ-treated animals (Figure 6D). The overall protective effect of NMDPEF was comparable with M40401, in terms of reduction of mortality, latency of symptoms and lipid peroxidation (Figure 6B–D), suggesting that the inhibition of QR2 strongly attenuated the oxidative stress elicited by PQ in this SN toxicity model.
Figure 6.
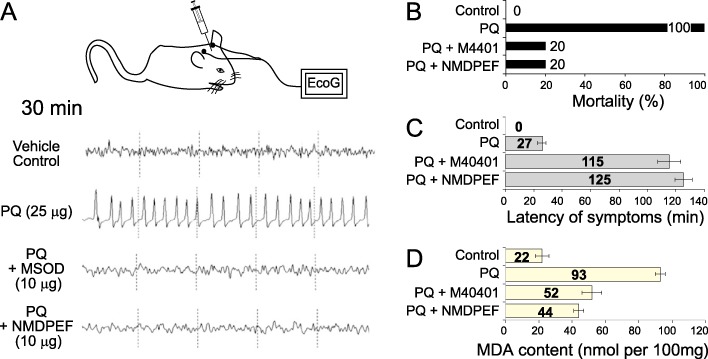
NMDPEF prevents ECoG discharges, lipid peroxidation and death induced by the infusion of PQ into the SN of Wistar rats. (A) Representative traces showing high voltage epileptogenic discharges induced by the infusion of PQ (25 µg) or vehicle with or without pre-treatment (20 min) with NMDPEF or a MnSOD mimetic M40401 (10 µg). Traces are representative of ECoG effect observed 30 min after administration of the herbicide. (B) Mortality following the infusion of PQ (25 µg, n= 10) and NMDPEF or M40401 as in A (n= 10, each treatment). (C) The effect of NMDPEF and M40401 (10 µg) on the latency (min) of seizures induced by PQ (25 µg). Mean ± SEM, n= 10. (D) MDA accumulation in the brain tissue in rats receiving PQ (25 µg) with or without pre-treatment with NMDPEF or M40401 as in A and B. SN homogenates were subjected to derivatization and analysed by HPLC Data shown are means ± SEM, n= 10. *P < 0.05, significantly different from PQ alone.
Discussion and conclusions
This report shows that NMDPEF, a novel, melatonin-related tetracyclic compound, previously characterized as a potent inhibitor of QR2 (also known as NQO2) (Mailliet et al., 2005), prevents PQ-induced toxicity in vitro and in vivo in rat models of systemic and brain toxicity. NMDPEF is several times more potent than melatonin and apocynin, which have been previously shown to antagonize PQ-induced toxicity (Melchiorri et al., 1995; Cristovao et al., 2009). The protective effect of QR2 knock-down in astroglial and epithelial cells confirms the involvement of this enzyme in the complex toxic mechanisms elicited by PQ (Figure 4). In addition, the reduced sensitivity to the QR2 inhibitor, following QR2 silencing in astroglial cells, as well as the lack of response to NMDPEF in epithelial cells, suggested that QR2 was the main target of NMDPEF in the protection against PQ (Figure 4).
To our knowledge this report is the first to suggest a role of QR2 in PQ-induced toxicity, although QR2 has been implicated in the toxic effects of other xenobiotics. In fact, in contrast to QR1, which usually works as a detoxifying enzyme, QR2 was found to mediate the toxicity of exogenous quinones and other compounds. For example, in the case of menadione, a cytotoxic synthetic analogue of vitamin K, QR2 is a bio-activating enzyme such that cells deficient in QR2 and also QR2 knock-out mice are resistant to menadione toxicity. Furthermore, activation of QR2 with NRH, a non-biogenic co-substrate, augments the toxic effects of menadione (Long et al., 2002; Celli et al., 2006). QR2 also bioactivated mitomycin C leading to the generation of the cytotoxic, nitroreductase anti-tumour drug CB1954. Keratinocytes isolated from skin tumours of QR2 knock-out mice show increased resistance to CB1954 and mitomycin C, whereas addition of NRH or overexpression of QR2 enhances drug toxicity (Celli et al., 2006).
Our data suggest that PQ-induced toxicity is mediated via QR2 activity. Several other oxidoreductases have also been implicated in PQ bioactivation, such as NADPH oxidases of the Nox family (Miller et al., 2007; Cristovao et al., 2009), a DPI-sensitive thioredoxin reductase (Gray et al., 2007), as well as a mitochondrial NADH-dependent reductase (Shimada et al., 2009). However, in spite of a wide specificity of QR2 in terms of substrates and co-substrates, it is unlikely that QR2 directly catalyses the conversion of the PQ di-cation into a PQ radical, thus using PQ as a substrate in a mechanism analogous to the diaphorases listed above. This is a likely explanation because QR2, just as its homologue QR1, is considered to be a two-electron oxidoreductase mediating the transfer of two or four electrons from a co-substrate to a substrate, no matter whether it is a quinone reduction or nitroreduction (Wu et al., 1997; Chen et al., 2000). However, an alternative, yet widely, accepted mechanism of PQ reduction involves the single electron transfer on the nitrogen of the pyridine ring (Drechsel and Patel, 2008), which is rather incompatible with the obligatory two-electron transfer mediated by the FAD catalytic centre of QR enzymes (Li et al., 1995). In fact, PQ added to the QR2 activity fluorometric assay using BNAH as substrate, did not increase BNAH consumption and had no significant effect on BNAH decay in vitro in the presence of menadione (Figure 2C). This observation suggested that PQ was not a QR2 substrate and any positive effect on QR2 activity, such as the one observed after 24 h treatment (Figure 2D), was indirect and cell-system dependent. Therefore, even though it has been suggested that QR2 may be able to catalyse one electron reductions (Vella et al., 2005) we would exclude QR2 as a candidate enzyme directly involved in PQ redox cycling, Further experiments should clarify the indirect role of QR2 in PQ redox cycling and PQ-induced toxicity.
QR2 may play a more general role in oxidative stress regulation. In fact, NMDPEF attenuated rotenone and hydrogen peroxide-induced ROS levels in vitro (Figures 2 and Supporting Information Figure S3). QR2 stabilizes the transcription factor p53 by a MDM2 ubiquitination-independent mechanism (Gong et al., 2007) and p53 is an important cellular mediator of the oxidative stress response (Vousden and Ryan, 2009). Moreover, QR2 knock-down and knockout cells have an increased resistance to benzopyrene-mediated cell death and decreased basal cell mortality, thereby facilitating the survival of cells with DNA damage (Gong et al., 2007) and decreasing sensitivity to chemical carcinogens (Shen et al., 2010). Finally, a function of QR2 in PQ-induced toxicity might be even more indirect and could be related to a potential role in the regulation of cellular metabolism, similar to mitochondrial aconitase. Aconitase has been shown to mediate PQ toxicity not only via release of oxidized iron from its 4Fe-S clusters and thereby favouring Fenton reactions, but also by its active role in the Krebs cycle and respiration. Indeed, knock-down of aconitase caused a decrease in cellular metabolism, which protected against PQ-mediated cell death (Cantu et al., 2011).
QR2 has been proposed to act as the third melatonin receptor MT3 in the cell (Nosjean et al., 2000; Mailliet et al., 2004). The relationship between the many physiological functions of melatonin and this enzyme remains unclear, but the weak inhibitory effect of melatonin on QR2 may explain the anti-oxidant properties of this neurohormone (Vella et al., 2005; Luchetti et al., 2010). Melatonin exhibited significant protection against systemic toxicity of PQ in two rat strains (Melchiorri et al., 1995). We did not directly compare the effects of melatonin and NMDPEF in vivo, but considering the high doses of melatonin necessary to attenuate PQ-induced mortality in rats, it is likely that NMDPEF is much more potent in vivo, giving full protection at 4.5 mg·kg−1 (Figure 5). In addition, melatonin was only partially cytoprotective in astroglial cells when used at ∼100 µM (Figure 1E). These findings are in agreement with a weak inhibitory activity of melatonin on QR2 activity (IC50= 130 ± 35 µM). In contrast, NMDPEF has been structurally designed to resemble melatonin and bind to the melatonin-binding site on QR2. It is a very powerful QR2 inhibitor (IC50= 14 nM) (Mailliet et al., 2005) and a potent blocker of PQ-induced toxicity as shown here.
Plant flavonoids such as resveratrol and quercetin also act as QR2 inhibitors (Vella et al., 2005). Interestingly, both compounds have been shown to protect against PQ-induced toxicity and even though these effects have been explained by other mechanisms (Park et al., 2010; Robb and Stuart, 2011), it is likely that some of the antioxidant activity of flavonoids depends on their interaction with QR2.
Equimolar concentrations of QR2 inhibitor compared with PQ (10 µM) were required for full protection against cell death in vitro in U373 cells (Figure 1C). Interestingly, NMDPEF was effective at much lower concentrations than PQ in vivo in preventing the systemic and nigral toxicity of PQ in the majority of animals, suggesting that NMDPEF had better pharmacokinetic properties than PQ (Figure 5). NMDPEF exhibited no inherent toxicity at 4.5 mg·kg−1in vivo and was effective even if administered after PQ. This profile suggests that NMDPEF could be a candidate for the therapeutic management of PQ poisoning. Indeed, the current methods of clinical intervention in cases of PQ poisoning are often unsuccessful due to the lack of effective treatments (Dinis-Oliveira et al., 2009a). Recently, sodium salicylate (Dinis-Oliveira et al., 2007) as well as lysine acetylsalicylate (Dinis-Oliveira et al., 2009b), commonly available non-steroidal anti-inflammatory drugs, have been proposed as promising antidotes for the treatment of PQ poisoning. The modulation of pro-oxidant and pro-inflammatory pathways has been suggested as essential features of the beneficial effects of both sodium salicylate and lysine acetylsalicylate. However, in animal models, high doses of these drugs (∼200 mg·kg−1) are required to protect against PQ (25 mg·kg−1 i.p.) toxicity. Furthermore, in these animals, the compounds themselves demonstrated inherent toxicity at 400 mg·kg−1 kg−1 suggesting a limited therapeutic window for these agents in the treatment of PQ poisoning (Dinis-Oliveira et al., 2009b). Other anti-inflammatory and ROS scavenging drugs are used in current PQ detoxification protocols, including dexamethasone, methylprednisolone, cyclophosphamide and N-acetylcysteine. All these agents seem to offer only a limited benefit for patients with acute PQ poisoning (Dinis-Oliveira et al., 2009a). Other compounds able to attenuate the toxic effects of PQ in vitro, such as apocynin and DPI (Cristovao et al., 2009; Gray et al., 2007), show a protective effect specific for SN dopaminergic degeneration in vivo triggered by low dose PQ (Cristovao et al., 2009), yet their efficacy against acute systemic PQ-induced toxicity has not been addressed.
Thus the data presented here suggest a novel pharmacological approach to the treatment of acute PQ poisoning. Future studies should elucidate the molecular mechanisms of the antidote-like effect of NMDPEF and the role of QR2 in the regulation of oxidative stress.
Acknowledgments
We would like to thank Philippe DeLagrange (Servier Pharmaceuticals, Paris, France) for the kind gift of NMDPEF. We are grateful to Dr. Gerardo Perozziello for assistance with fluorometry, University Magna Graecia (UMG), Catanzaro, Italy, Professor Giovanni Morrone, UMG, for kind gift of lentiviral plasmids, to Dr. Manuela Oliviero, UMG, for critical suggestions to the manuscript and to Dr. Michela Pollicita and Professor Stefano Aquaro, Tor Vergata University, Rome, for the kind gift of U373 astroglial cell line and Professor G. Viglietto, UMG, for A549 cells. We also would like to thank Giovanni Politi, UMG, for the help with animal work and Marcella Zappino, UMG, for the technical support with HPLC analysis. This work was funded by Calabrian Environmental Protection Agency (ARPACal).
Glossary
- Ab
antibody
- APF
3′-(p-aminophenylfluorescein)
- BNAH
N-benzyldihydronicotinamide
- DPI
diphenylene iodonium
- FACS
flow cytometry
- LDH
lactate dehydrogenase
- MDA
malondialdehyde
- MitoSOX
3,8-phenanthridinediamine, 5-(6′-triphenylphosphoniumhexyl)-5,6 dihydro-6-phenyl
- NMDPEF
N-[2-(2-methoxy-6H-dipyrido{2,3-a:3,2-e}pyrrolizin-11-yl)ethyl]-2-furamide
- NRH
N-riboside dihydronicotinamide
- PQ
paraquat
- ROS
reactive oxygen species
- shRNA
short harpin RNA
- SN
substantia nigra
- TTBS
Tween-Tris buffered saline
Conflict of interest
All authors declare no competing financial interests.
Supporting information
Additional Supporting Information may be found in the online version of this article:
Figure S1 The cell death induced by PQ in U373and EpH4 cells is not apoptosis. (A) The 48 h PQ treatment failedto induce significant apoptosis in U373 cells. Annexin V stainingwas performed as above 48 h after the addition of PQ. Mean ±SEM, n = 3. (B) The 18 h PQ treatment (1 and 2 mM) did notinduce any significant increase in Annexin V positive astroglialcells. Cells were trypsinized, stained with PE-labelled Annexin Vand 7-AAD to monitor dead cells and analysed by FACS. After gatingthe populations the percentage of 7-AAD and Annexin V-positivecells was determined. (C) U373 cells, exposed to PQ for 60 h, weretreated for 20 min with PE-fmk-zVAD caspase-3 inhibitor (Casp3*Red), recognizing the activated caspase-3. After trypsinization,cells were co-stained with Trypan blue and analysed by FACS. Mean± SEM, n = 3. (D) PQ failed to induce caspase-3activation in highly sensitive mammary epithelial cells EpH4. Cellswere stained as in C and analysed by FACS. Mean ± SEM,n = 3. (E) Representative dot-plots of double PE-fmk-zVAD (Casp3* Red) and Trypan blue staining from the experiment shown in C.
Figure S2 The protective effect of QR2inhibitor NMDPEF on PQ-induced cell death correlates with QR2expression in different cell types. (A) U373 astroglial cells wereseeded at standard conditions and treated with PQ (as above) forindicated times and co-treated with 20 µM NMDPEF. Thepercentage of dead cells was analysed by Trypan blue and FACS. Arepresentative experiment out of 3 independent experimentsperformed in triplicate, Mean ± SD, n = 3; *P< 0.05, compared with the time-matched PQ alone controls. (B)EpH4 cells were seeded as indicated in methods and treated with PQas indicated above. The cell death analysis was performed on day 5after seeding as in A. *P < 0.05 and **P < 0.01compared with the time-matched PQ alone controls. (C) 6 ×10⁴ HEK293 cells were seeded per well (24 well plates),24 h before the addition of PQ and NMDPEF. The cells were exposedfor indicated times to indicated agents. The graph shows the meanof independent experiments performed in triplicate, Mean ±SD, n = 6; *P < 0.05 and **P < 0.01compared with the time-matched PQ alone controls. (D) A549 lungadenocarcinoma cells were seeded at a density 4 ×10⁴ per well (24 well plate). The cells were exposed forindicated times to PQ and NMDPEF added next day after seeding andanalysed as above. The graph shows the mean of independentexperiments performed in triplicate, Mean ± SD, n =9. (E) The expression levels of QR2 in different cell linescompared with rat liver and lung tissue. Around 80 µg of celllysate were run on 10% SDS-PAGE and QR2 expression was analysed byWestern blot. GAPDH expression is shown as loading control. Notethe highest expression of QR2 in HEK293 cells and U373 cells thatrespond very well to NMDPEF and a very low expression in A549cells, which are not protected by NMDPEF.
Figure S3 QR2 inhibitor NMDPEF protects againstPQ and rotenone toxicity, but the protective effect is muchstronger for PQ. The cells were treated with PQ (10 µM) orrotenone (10 µM) and the percent of dead cells was determinedby Trypan blue staining and FACS analysis at time points indicated.Mean ± SEM of 3 independent experiments performed at leastin duplicate, n = 6, *P < 0.05, compared with thetime-matched rotenone alone, #P < 0.01, compared with the time-matched PQ alone.
References
- Bagetta G, Nair S, Nistico G, Dolly JO. Hippocampal damage produced in rats by alpha-dendrotoxin – a selective K+ channel blocker – involves non-NMDA receptor activation. Neurochem Int. 1994;24:81–90. doi: 10.1016/0197-0186(94)90132-5. [DOI] [PubMed] [Google Scholar]
- Bianchet MA, Erdemli SB, Amzel LM. Structure, function, and mechanism of cytosolic quinone reductases. Vitam Horm. 2008;78:63–84. doi: 10.1016/S0083-6729(07)00004-0. [DOI] [PubMed] [Google Scholar]
- Bus JS, Gibson JE. Paraquat: model for oxidant-initiated toxicity. Environ Health Perspect. 1984;55:37–46. doi: 10.1289/ehp.845537. [DOI] [PMC free article] [PubMed] [Google Scholar]
- Cantu D, Fulton RE, Drechsel DA, Patel M. Mitochondrial aconitase knockdown attenuates paraquat-induced dopaminergic cell death via decreased cellular metabolism and release of iron and HO. J Neurochem. 2011;118:79–92. doi: 10.1111/j.1471-4159.2011.07290.x. [DOI] [PMC free article] [PubMed] [Google Scholar]
- Castello PR, Drechsel DA, Patel M. Mitochondria are a major source of paraquat-induced reactive oxygen species production in the brain. J Biol Chem. 2007;282:14186–14193. doi: 10.1074/jbc.M700827200. [DOI] [PMC free article] [PubMed] [Google Scholar]
- Celli CM, Tran N, Knox R, Jaiswal AK. NRH : quinone oxidoreductase 2 (NQO2) catalyzes metabolic activation of quinones and anti-tumor drugs. Biochem Pharmacol. 2006;72:366–376. doi: 10.1016/j.bcp.2006.04.029. [DOI] [PubMed] [Google Scholar]
- Chen S, Wu K, Knox R. Structure-function studies of DT-diaphorase (NQO1) and NRH: quinone oxidoreductase (NQO2) Free Radic Biol Med. 2000;29:276–284. doi: 10.1016/s0891-5849(00)00308-7. [DOI] [PubMed] [Google Scholar]
- Cocheme HM, Murphy MP. Complex I is the major site of mitochondrial superoxide production by paraquat. J Biol Chem. 2008;283:1786–1798. doi: 10.1074/jbc.M708597200. [DOI] [PubMed] [Google Scholar]
- Cristovao AC, Choi DH, Baltazar G, Beal MF, Kim YS. The role of NADPH oxidase 1-derived reactive oxygen species in paraquat-mediated dopaminergic cell death. Antioxid Redox Signal. 2009;11:2105–2118. doi: 10.1089/ars.2009.2459. [DOI] [PMC free article] [PubMed] [Google Scholar]
- Dinis-Oliveira RJ, Sousa C, Remiao F, Duarte JA, Navarro AS, Bastos ML, et al. Full survival of paraquat-exposed rats after treatment with sodium salicylate. Free Radic Biol Med. 2007;42:1017–1028. doi: 10.1016/j.freeradbiomed.2006.12.031. [DOI] [PubMed] [Google Scholar]
- Dinis-Oliveira RJ, Duarte JA, Sanchez-Navarro A, Remiao F, Bastos ML, Carvalho F. Paraquat poisonings: mechanisms of lung toxicity, clinical features, and treatment. Crit Rev Toxicol. 2008;38:13–71. doi: 10.1080/10408440701669959. [DOI] [PubMed] [Google Scholar]
- Dinis-Oliveira RJ, de Pinho PG, Santos L, Teixeira H, Magalhaes T, Santos A, et al. Postmortem analyses unveil the poor efficacy of decontamination, anti-inflammatory and immunosuppressive therapies in paraquat human intoxications. PLoS ONE. 2009a;4:e7149. doi: 10.1371/journal.pone.0007149. [DOI] [PMC free article] [PubMed] [Google Scholar]
- Dinis-Oliveira RJ, Pontes H, Bastos ML, Remiao F, Duarte JA, Carvalho F. An effective antidote for paraquat poisonings: the treatment with lysine acetylsalicylate. Toxicology. 2009b;255:187–193. doi: 10.1016/j.tox.2008.10.015. [DOI] [PubMed] [Google Scholar]
- Drechsel DA, Patel M. Role of reactive oxygen species in the neurotoxicity of environmental agents implicated in Parkinson's disease. Free Radic Biol Med. 2008;44:1873–1886. doi: 10.1016/j.freeradbiomed.2008.02.008. [DOI] [PMC free article] [PubMed] [Google Scholar]
- Drechsel DA, Patel M. Differential contribution of the mitochondrial respiratory chain complexes to reactive oxygen species production by redox cycling agents implicated in parkinsonism. Toxicol Sci. 2009;112:427–434. doi: 10.1093/toxsci/kfp223. [DOI] [PMC free article] [PubMed] [Google Scholar]
- Dusinska M, Kovacikova Z, Vallova B, Collins A. Responses of alveolar macrophages and epithelial type II cells to oxidative DNA damage caused by paraquat. Carcinogenesis. 1998;19:809–812. doi: 10.1093/carcin/19.5.809. [DOI] [PubMed] [Google Scholar]
- Duty S, Jenner P. Animal models of Parkinson's disease: a source of novel treatments and clues to the cause of the disease. Br J Pharmacol. 2011;164:1357–1391. doi: 10.1111/j.1476-5381.2011.01426.x. [DOI] [PMC free article] [PubMed] [Google Scholar]
- Fu Y, Buryanovskyy L, Zhang Z. Quinone reductase 2 is a catechol quinone reductase. J Biol Chem. 2008;283:23829–23835. doi: 10.1074/jbc.M801371200. [DOI] [PMC free article] [PubMed] [Google Scholar]
- Gong X, Kole L, Iskander K, Jaiswal AK. NRH : quinone oxidoreductase 2 and NAD(P)H : quinone oxidoreductase 1 protect tumor suppressor p53 against 20s proteasomal degradation leading to stabilization and activation of p53. Cancer Res. 2007;67:5380–5388. doi: 10.1158/0008-5472.CAN-07-0323. [DOI] [PubMed] [Google Scholar]
- Gray JP, Heck DE, Mishin V, Smith PJ, Hong JY, Thiruchelvam M, et al. Paraquat increases cyanide-insensitive respiration in murine lung epithelial cells by activating an NAD(P)H : paraquat oxidoreductase: identification of the enzyme as thioredoxin reductase. J Biol Chem. 2007;282:7939–7949. doi: 10.1074/jbc.M611817200. [DOI] [PubMed] [Google Scholar]
- Harada S, Fujii C, Hayashi A, Ohkoshi N. An association between idiopathic Parkinson's disease and polymorphisms of phase II detoxification enzymes: glutathione S-transferase M1 and quinone oxidoreductase 1 and 2. Biochem Biophys Res Commun. 2001;288:887–892. doi: 10.1006/bbrc.2001.5868. [DOI] [PubMed] [Google Scholar]
- Hatcher JM, Pennell KD, Miller GW. Parkinson's disease and pesticides: a toxicological perspective. Trends Pharmacol Sci. 2008;29:322–329. doi: 10.1016/j.tips.2008.03.007. [DOI] [PMC free article] [PubMed] [Google Scholar]
- Janda E, Litos G, Grunert S, Downward J, Beug H. Oncogenic Ras/Her-2 mediate hyperproliferation of polarized epithelial cells in 3D cultures and rapid tumor growth via the PI3K pathway. Oncogene. 2002;21:5148–5159. doi: 10.1038/sj.onc.1205661. [DOI] [PubMed] [Google Scholar]
- Janda E, Visalli V, Colica C, Aprigliano S, Musolino V, Vadala N, et al. The protective effect of tianeptine on Gp120-induced apoptosis in astroglial cells: role of GS and NOS, and NF-kappaB suppression. Br J Pharmacol. 2011;164:15900. doi: 10.1111/j.1476-5381.2010.01172.x. [DOI] [PMC free article] [PubMed] [Google Scholar]
- Knox RJ, Burke PJ, Chen S, Kerr DJ. CB 1954: from the Walker tumor to NQO2 and VDEPT. Curr Pharm Des. 2003;9:2091–2104. doi: 10.2174/1381612033454108. [DOI] [PubMed] [Google Scholar]
- Li R, Bianchet MA, Talalay P, Amzel LM. The three-dimensional structure of NAD(P)H : quinone reductase, a flavoprotein involved in cancer chemoprotection and chemotherapy: mechanism of the two-electron reduction. Proc Natl Acad Sci USA. 1995;92:8846–8850. doi: 10.1073/pnas.92.19.8846. [DOI] [PMC free article] [PubMed] [Google Scholar]
- Long DJ, 2nd, Iskander K, Gaikwad A, Arin M, Roop DR, Knox R, et al. Disruption of dihydronicotinamide riboside : quinone oxidoreductase 2 (NQO2) leads to myeloid hyperplasia of bone marrow and decreased sensitivity to menadione toxicity. J Biol Chem. 2002;277:46131–46139. doi: 10.1074/jbc.M208675200. [DOI] [PubMed] [Google Scholar]
- Luchetti F, Canonico B, Betti M, Arcangeletti M, Pilolli F, Piroddi M, et al. Melatonin signaling and cell protection function. FASEB J. 2010;24:3603–3624. doi: 10.1096/fj.10-154450. [DOI] [PubMed] [Google Scholar]
- Mailliet F, Ferry G, Vella F, Thiam K, Delagrange P, Boutin JA. Organs from mice deleted for NRH : quinone oxidoreductase 2 are deprived of the melatonin binding site MT3. FEBS Lett. 2004;578:116–120. doi: 10.1016/j.febslet.2004.10.083. [DOI] [PubMed] [Google Scholar]
- Mailliet F, Ferry G, Vella F, Berger S, Coge F, Chomarat P, et al. Characterization of the melatoninergic MT3 binding site on the NRH : quinone oxidoreductase 2 enzyme. Biochem Pharmacol. 2005;71:74–88. doi: 10.1016/j.bcp.2005.09.030. [DOI] [PubMed] [Google Scholar]
- Melchiorri D, Reiter RJ, Attia AM, Hara M, Burgos A, Nistico G. Potent protective effect of melatonin on in vivo paraquat-induced oxidative damage in rats. Life Sci. 1995;56:83–89. doi: 10.1016/0024-3205(94)00417-q. [DOI] [PubMed] [Google Scholar]
- Merlo A, Gabrielson E, Mabry M, Vollmer R, Baylin SB, Sidransky D. Homozygous deletion on chromosome 9p and loss of heterozygosity on 9q, 6p, and 6q in primary human small cell lung cancer. Cancer Res. 1994;54:2322–2326. [PubMed] [Google Scholar]
- Miller RL, Sun GY, Sun AY. Cytotoxicity of paraquat in microglial cells: involvement of PKCdelta- and ERK1/2-dependent NADPH oxidase. Brain Res. 2007;1167:129–139. doi: 10.1016/j.brainres.2007.06.046. [DOI] [PMC free article] [PubMed] [Google Scholar]
- Mollace V, Iannone M, Muscoli C, Palma E, Granato T, Rispoli V, et al. The role of oxidative stress in paraquat-induced neurotoxicity in rats: protection by non peptidyl superoxide dismutase mimetic. Neurosci Lett. 2003;335:163–166. doi: 10.1016/s0304-3940(02)01168-0. [DOI] [PubMed] [Google Scholar]
- Mukhopadhyay P, Rajesh M, Hasko G, Hawkins BJ, Madesh M, Pacher P. Simultaneous detection of apoptosis and mitochondrial superoxide production in live cells by flow cytometry and confocal microscopy. Nat Protoc. 2007;2:2295–2301. doi: 10.1038/nprot.2007.327. [DOI] [PMC free article] [PubMed] [Google Scholar]
- Nistico R, Mehdawy B, Piccirilli S, Mercuri N. Paraquat- and rotenone-induced models of Parkinson's disease. Int J Immunopathol Pharmacol. 2011;24:313–322. doi: 10.1177/039463201102400205. [DOI] [PubMed] [Google Scholar]
- Nosjean O, Ferro M, Coge F, Beauverger P, Henlin JM, Lefoulon F, et al. Identification of the melatonin-binding site MT3 as the quinone reductase 2. J Biol Chem. 2000;275:31311–31317. doi: 10.1074/jbc.M005141200. [DOI] [PubMed] [Google Scholar]
- Park HK, Kim SJ, Kwon Y, Park JH, Kim YC. Protective effect of quercetin against paraquat-induced lung injury in rats. Life Sci. 2010;87:181–186. doi: 10.1016/j.lfs.2010.06.011. [DOI] [PubMed] [Google Scholar]
- Peng J, Stevenson FF, Doctrow SR, Andersen JK. Superoxide dismutase/catalase mimetics are neuroprotective against selective paraquat-mediated dopaminergic neuron death in the substantia nigra: implications for Parkinson disease. J Biol Chem. 2005;280:29194–29198. doi: 10.1074/jbc.M500984200. [DOI] [PubMed] [Google Scholar]
- Peng J, Stevenson FF, Oo ML, Andersen JK. Iron-enhanced paraquat-mediated dopaminergic cell death due to increased oxidative stress as a consequence of microglial activation. Free Radic Biol Med. 2009;46:312–320. doi: 10.1016/j.freeradbiomed.2008.10.045. [DOI] [PMC free article] [PubMed] [Google Scholar]
- Robb EL, Stuart JA. Resveratrol interacts with estrogen receptor-beta to inhibit cell replicative growth and enhance stress resistance by upregulating mitochondrial superoxide dismutase. Free Radic Biol Med. 2011;50:821–831. doi: 10.1016/j.freeradbiomed.2010.12.038. [DOI] [PubMed] [Google Scholar]
- Setsukinai K, Urano Y, Kakinuma K, Majima HJ, Nagano T. Development of novel fluorescence probes that can reliably detect reactive oxygen species and distinguish specific species. J Biol Chem. 2003;278:3170–3175. doi: 10.1074/jbc.M209264200. [DOI] [PubMed] [Google Scholar]
- Shen J, Barrios RJ, Jaiswal AK. Inactivation of the quinone oxidoreductases NQO1 and NQO2 strongly elevates the incidence and multiplicity of chemically induced skin tumors. Cancer Res. 2010;70:1006–1014. doi: 10.1158/0008-5472.CAN-09-2938. [DOI] [PMC free article] [PubMed] [Google Scholar] [Retracted]
- Shimada H, Hirai K, Simamura E, Hatta T, Iwakiri H, Mizuki K, et al. Paraquat toxicity induced by voltage-dependent anion channel 1 acts as an NADH-dependent oxidoreductase. J Biol Chem. 2009;284:28642–28649. doi: 10.1074/jbc.M109.033431. [DOI] [PMC free article] [PubMed] [Google Scholar]
- Vella F, Ferry G, Delagrange P, Boutin JA. NRH : quinone reductase 2: an enzyme of surprises and mysteries. Biochem Pharmacol. 2005;71:1–12. doi: 10.1016/j.bcp.2005.09.019. [DOI] [PubMed] [Google Scholar]
- Vousden KH, Ryan KM. p53 and metabolism. Nat Rev Cancer. 2009;9:691–700. doi: 10.1038/nrc2715. [DOI] [PubMed] [Google Scholar]
- Wang W, Jaiswal AK. Sp3 repression of polymorphic human NRH : quinone oxidoreductase 2 gene promoter. Free Radic Biol Med. 2004;37:1231–1243. doi: 10.1016/j.freeradbiomed.2004.06.042. [DOI] [PubMed] [Google Scholar]
- Wu K, Knox R, Sun XZ, Joseph P, Jaiswal AK, Zhang D, et al. Catalytic properties of NAD(P)H : quinone oxidoreductase-2 (NQO2), a dihydronicotinamide riboside dependent oxidoreductase. Arch Biochem Biophys. 1997;347:221–228. doi: 10.1006/abbi.1997.0344. [DOI] [PubMed] [Google Scholar]
- Yu KD, Di GH, Yuan WT, Fan L, Wu J, Hu Z, Shen ZZ, Zheng Y, Huang W, Shao ZM. Functional polymorphisms, altered gene expression and genetic association link NRH : quinone oxidoreductase 2 to breast cancer with wild-type p53. Hum Mol Genet. 2009;18:2502–2517. doi: 10.1093/hmg/ddp171. [DOI] [PubMed] [Google Scholar]
Associated Data
This section collects any data citations, data availability statements, or supplementary materials included in this article.