Abstract
Oligopeptide hydrogels are emerging as useful matrices for cell culture with commercial products on the market, but L-oligopeptides are labile to proteases. An obvious solution is to create D-oligopeptide hydrogels, which lack enzymatic recognition. However, D-oligopeptide matrices do not support cell growth as well as L-oligopeptide matrices. In addition to chiral interactions, many cellular activities are strongly governed by charge-charge interactions. In this work the effects of chirality and charge on human mesenchymal stem cell (hMSC) behavior were studied using hydrogels assembled from oppositely charged oligopeptides. It was found that negative charges significantly improved hMSC viability and proliferation in D-oligopeptide gels but had little effect on their interactions with L-oligopeptide gels. This result points to the possibility of using charge and other factors to engineer biomaterials whose chirality is distinct from that of natural biomaterials, but whose performance is close to that of natural biomaterials.
Keywords: chirality, peptides, biomaterials, stem cells, biocompatibility, NMR spectroscopy
Introduction
Biohomochirality is recognized as a defining feature of life on earth. It is well known that biomacromolecules are homochiral, where proteins contain exclusively L-amino acids, and nucleic acids and most polysaccharides contain exclusively D-sugars. While the biochemical aspect of homochirality has been explored extensively,1-4 its material aspect has been seldom explored. In a previous paper, we investigated how chirality affects the mechanical and structural properties of oligopeptide hydrogels.5 In this work, we explored how chirality impacts hydrogel-cell interactions and how such interactions are modulated by the charge status of the hydrogel.
Hydrogels are viscoelastic materials with many natural (e.g., the extracellular matrix) and manmade (e.g., contact lenses) examples. As a result of the homochirality of its constitutive biopolymers, natural hydrogels are also homochiral. For example, the extracellular matrix (ECM) is a chiral material made of homochiral L-proteins and homochiral D-polysaccharides. Both L-protein (e.g., MatriGelTM) and L-oligopeptide (e.g., PuraMatrixTM) hydrogels have been used to mimic the ECM for cell culture applications. Considering that the ECM has a profound impact on cell growth6 and differentiation,7 the question of how ECM chirality affects cell behavior has significant implications for biology and bioengineering. In this work, oligopeptide hydrogels of different chirality makeups (homochiral, heterochiral and racemic) were used as ECM mimetics to grow cells. The impact of chirality on cell viability and proliferation was investigated.
In addition to chiral interactions, many cellular activities are strongly governed by charge-charge interactions. Examples include cell communication and ion transport across the cell membrane. Regarding material cell-interactions, it has been found that both the type and the material charge density affect cell behaviors.8-11 Dadsetan et al. found that chondrocytes proliferated more on oligo(poly(ethylene glycol) fumarate) modified with negatively charged monomers than positively charged monomers and that the percentage of monomer modification also affected cell behavior.9 In fact, material surface charge can be used to modify cell behavior.12-14 Keselowsky et al. found that on positively charged surfaces, osteoblasts up-regulated osteoblast-specific gene expression, alkaline phosphatase enzymatic activity, and matrix mineralization compared with negatively charged surfaces.14 Based on these previous studies, we hypothesized that it might be possible to exploit charge to modulate chiral effects in hydrogel-cell interactions. If proven true, then the combination of chirality and charge could be a powerful tool to guide cell behavior using oligopeptide hydrogels.
In contrast to other chirality studies in which thin films were used,15,16 we used soft hydrogels which more closely resemble the ECM. The hydrogels used in this study were assembled from self-repulsive but mutually attractive oligopeptide modules.17 Gelation requires at least two oppositely charged modules. This co-assembling approach allowed us to systematically explore various chirality-charge combinations, some of which are not accessible to hydrogels based on the self-assembly of a single oligopeptide.
In this study, human mesenchymal stem cells (hMSCs) were used because they are extremely attractive candidates for cellular therapy. MSCs have many attributes including ease of isolation, high expansion potential and genetic stability.18 Further, MSCs can be used allogeneically, an important clinical advantage.19 Understanding how hMSCs respond to different environments will facilitate the engineering of biomaterials with the appropriate properties for cell viability and proliferation. hMSC viability was investigated using a live/dead assay after one day of cell incubation. hMSC proliferation was observed with the WST-1 assay 1, 3 and 7 days after cell seeding.20
Materials and Methods
Chemicals
Fmoc-protected amino acids, N-Hydroxybenzotriazole (HOBt) and O-Benzotriazole-N,N,N’,N’-tetramethyl-uronium-hexafluoro-phosphate (HBTU) were purchased from Aapptec and used as received. Rink amide MBHA resin was purchased from Chem Impex. Dimethylformamide (DMF) was purchased from Macron. Acetic anhydride and trifluoroacetic acid (TFA) were purchased from Alfa Aesar. Piperidine, N,N-Diisopropylethylamine (DIEA), MeOH, triisopropylsilane (TIPS), 3-(trimethylsilyl)propionic-2,2,3,3-d4 acid, sodium salt (TSP) and diethyl ether were purchased from Sigma-Aldrich. WST-1 kit was purchased from Takara. Live/dead assay kit was purchased from Invitrogen. All components for hMSC basal growth media were also purchased from Invitrogen. hMSCs were purchased from Lonza.
Oligopeptide Design and Synthesis
Four oligopeptides were designed using a previously described approach17 in which oppositely charged oligopeptide modules interact electrostatically, co-assemble and form a hydrogel. Detailed synthesis and purification procedures for these oligopeptides are described elsewhere.21 Briefly, two positive sequences (L+ and D+) were made with alternating neutral (W and A) and positively charged (K) amino acids. The two oligopeptides were chiral opposites, made from either all L-amino acids or all D-amino acids. The two negative sequences (L− and D−) were made with alternating neutral (W and A) and negatively charged (E) amino acids. The oligopeptide sequences of these positively and negatively charged modules are given below:
Positive modules (L+ or D+): acetyl-K-W-K-A-K-A-K-A-K-W-K-amide
Negative modules (L− or D−): acetyl-E-W-E-A-E-A-E-A-E-W-E-amide
The oligopeptides were synthesized using standard Fmoc chemistry22 on Rink Amide MBHA resin using a microwave synthesizer. The oligopeptide products were cleaved, precipitated by cold diethyl ether, purified by reverse-phase HPLC, and dried by lyophilization. The purity and molecular weight of each purified oligopeptide were verified by reverse-phase analytical HPLC and mass spectrometry, respectively (see Supporting Information for more details).
Each purified oligopeptide was dissolved in deionized water and then dialyzed against deionized water for 24 hours to remove residual small molecules (TFA, MeOH, etc.). Afterwards, the oligopeptide was lyophilized again. The dried oligopeptide was then dissolved in phosphate-buffered saline (PBS, 50 mM sodium phosphate and 100 mM NaCl, pH 7.4). The concentration of each oligopeptide sample was determined on the basis of the UV absorption of the tryptophan residues in each oligopeptide, using an extinction coefficient of 5690 M−1cm−1 at 280 nm for each tryptophan residue.23 Ionic strengths of the oligopeptide samples were tuned to the conductivity of PBS buffer (17 mS/cm) using a conductivity meter. Oligopeptide solutions were sterile filtered directly prior to gelation. The pH of each oligopeptide solution is 7.4.
Hydrogel Preparation
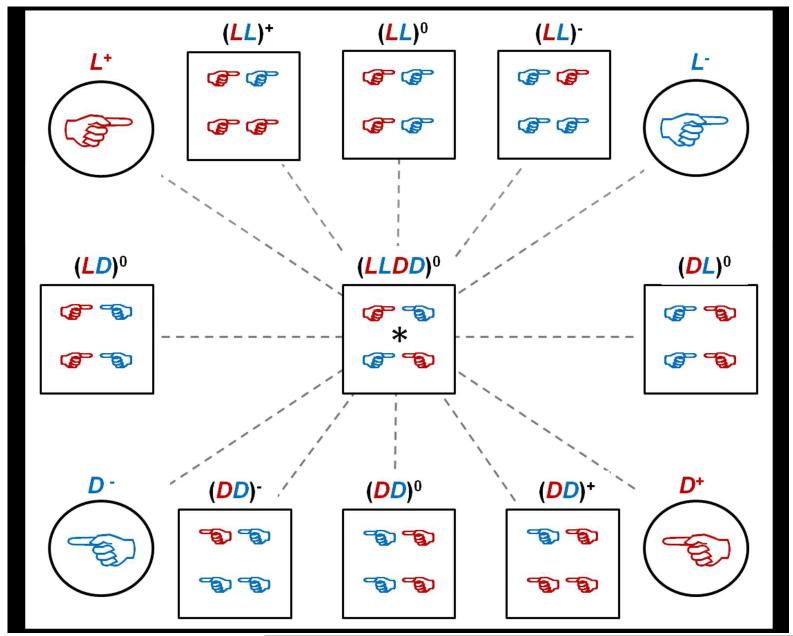
Our hydrogels are formed by mixing solutions of oppositely charged oligopeptide modules. In each hydrogel, the total oligopeptide concentration was 5 mM. All gels were made 24 hours before cell seeding. In total, 9 gel types were made under sterile conditions at 25°C (see Figure 1).
Figure 1.
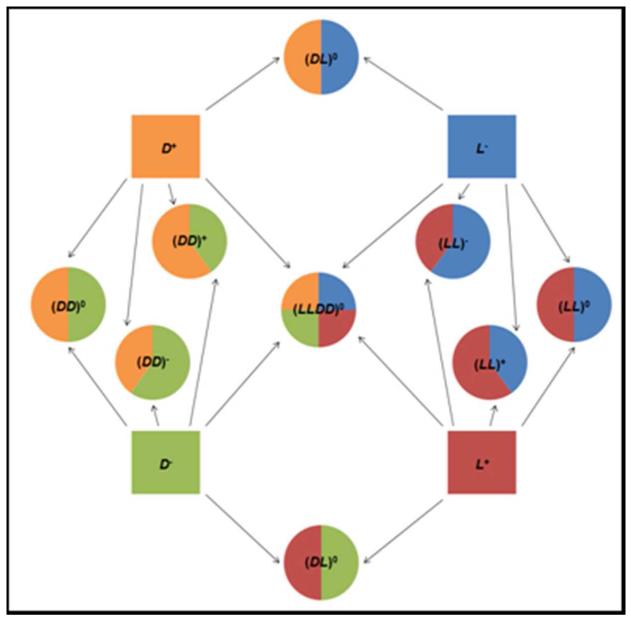
(A) Pictorial description of the 4 parent solutions and 9 hydrogel types made. The dashed lines connect mirror images which all run through (LLDD)0, which is its own mirror image. Red hands represent positively charged peptides and blue hands represent negatively charged peptides. Circles represent the parent oligopeptide solutions used to make the hydrogels. Squares represent the hydrogels. (B) Pictorial description of how each gel was made using different amounts of four parent oligopeptides. The final oligopeptide concentration for all gels was 5 mM. Neutral gels were made with 2.5 mM D+ or L+ and 2.5 mM D− or L−; positively charged gels were made with 3 mM D+ or L+ and 2 mM D− or L−; and negatively charged gels were made with 2 mM D+ or L+ and 3 mM D− or L−.
To investigate chirality, neutral homochiral, heterochiral and racemic hydrogels were prepared. The neutral homochiral (LL)0 gel was made by mixing equal volumes of 5 mM L+ with 5 mM L−. The neutral homochiral (DD)0 gel was made by mixing equal volumes of 5 mM D+ with 5 mM D−. Neutral heterochiral (LD)0 and (DL)0 gels were made by 1:1 mixing of 5 mM L+ with 5 mM D− and 1:1 mixing of 5 mM D+ with 5 mM L−, respectively. The neutral racemic hydrogel, (LLDD)0, was made by mixing equal volumes of all 4 types of 5 mM oligopeptide solutions, L+, D+, L− and D−, each with a 1.25 mM final concentration in the hydrogel.
To investigate charge-chirality interplay, charged homochiral gels were prepared by varying the positive to negative oligopeptide ratio in the hydrogel while keeping the total oligopeptide concentration at 5 mM. Specifically, positively charged (LL)+ and (DD)+ gels were made by mixing equal volumes of 6 mM L+ or D+ with 4 mM L− or D−, resulting in 1 mM of excess of positively charged oligopeptide in the hydrogel. Negatively charged (LL)− and (DD)− gels were made by mixing equal volumes of 4 mM L+ or D+ with 6 mM L− or D−, resulting in 1 mM of excess of negatively charged oligopeptide in the hydrogel.
Nuclear Magnetic Resonance (NMR) Measurements
Individual oligopeptide solutions were pre-equilibrated at room temperature and diluted to appropriate concentrations in PBS, as described in the gel preparation section. (LL)+, (LL)0 and (LL)− gels were loaded into NMR tubes by quickly mixing equal volumes of each L+ and L− solution together in a 1.5 mL plastic centrifuge tube and transferring the mixture to a 3-mm NMR tube using a long glass disposable pipette. Gels were allowed to mature for 24 hours at 25°C Both gels and solutions were contained in 3-mm NMR tubes (inner tubes). Each 3-mm inner tube was placed one at a time in the same 5-mm NMR outer tube containing 100% D2O to provide the deuterium lock signal. With this setup, solutions and gels did not come in contact with D2O.
NMR experiments were carried out on a Varian 400-MR spectrometer equipped with a triple resonance indirect detection probe. The temperature of the NMR spectrometer probe was preset to 25°C. 1H spectra were used to examine the presence of free oligopeptide in each gel after 24 hours. Due to the very short transverse relaxation time (T2) of gelled oligopeptides, only free oligopeptides can be detected by NMR spectroscopy.24 To compare the signal intensities from different 1D 1H spectra, the same calibrated 90° pulse and the same receiver gain were used in all cases. All samples contained an external TSP standard in the outer D2O tube in order to calibrate 1H peak height and chemical shift. The number of averages for each 1H spectrum was 16.
Cell Culture
hMSCs were cultured in high glucose Dulbecco’s modified eagle medium (DMEM) supplemented with 10% FBS, 1% penicillin/streptomycin (100 U/mL), 1% nonessential amino acids (0.1 mM), 2% L-glutamine (4 mM) and incubated at 37°C, 5% CO2. The medium was changed every two days. The cells were detached from flasks with PBS containing 0.25% w/v Trypsin-EDTA, were centrifuged and then resuspended in DMEM for re-plating on various hydrogels and tissue culture polystyrene (TCPS) plates.
Cell Viability
hMSCs (passage 5 or 6) were seeded onto the surfaces of the hydrogels in a 96-well plate at a density of 1×10⁵ cells/mL in the culture medium and the cells were incubated for one day at 37°C. To assess cell viability one day after seeding, a live/dead assay was used. Cells were washed with PBS and incubated in PBS containing calcein acetoxymethyl ester (calcein-AM) and ethidium homodimer-1 for 30 minutes. Cells were washed again and incubated in PBS containing 4′,6-diamidino-2-phenylindole (DAPI) for 10 minutes. hMSCs were then visualized by spinning disk microscope (SDM, Olympus IX81) at excitation wavelengths of 358 nm, 488 nm and 532 nm. DAPI was used to locate and focus on the cells within the gel, in an effort to minimize photobleaching of calcein-AM and ethidium homodimer-1. Fluorescence image stacks of 15 μm depth were created starting from the most superficial cell focal plane and then penetrating into the gel. Cells cultured on a tissue culture polystyrene (TCPS) 96-well plate without hydrogel and the nine hydrogel types without cells were used as positive and negative controls respectively. Three wells were made per hydrogel type, six images were taken per well, and the assay was performed in triplicate, so a total of 54 images were taken per hydrogel type. Cells were counted using NIH ImageJ software.25 Relative viability was calculated by normalizing the average cell viability on each gel type to the average cell viability on the TCPS control. Viability was calculated as:
To study the effect of single oligopeptides on hMSC viability, 50 μL of 2 mM oligopeptide in PBS was added to each well. Then, 50 μL of media containing 2×10⁵ cells/mL was added to each well, making the final total concentration of oligopeptide 1 mM. The cells were then incubated for one day at 37°C. A live/dead assay was also used to assess cell viability. Cells grown in normal media on TCPS and 1 mM oligopeptide on TCPS without cells were used as positive and negative controls respectively.
Cell Proliferation
hMSCs (passage 5 or 6) were seeded onto the surface of the hydrogels in a 96-well plate at a density of 7×10⁴ cells/mL. The medium was exchanged every two days. Cells cultured on a 96-well plate without hydrogel (TCPS) and hydrogel without cells were used as positive and negative controls respectively. At different time points (day 1, day 3 and day 7), the proliferation of viable cells was assessed by the WST-1 assay. This assay is based on the cleavage of the tetrazolium salt WST-1 to formazan by cellular mitochondrial dehydrogenases present in viable cells.20 Absorption by formazan at 450 nm was used to measure proliferation. Absorbance from negative controls at 450 nm was subtracted from all experimental results. The proliferation results were then expressed as a percentage of the absorbance of the positive control.
To study the effect of single oligopeptides on hMSC proliferation, 50 μL of 2 mM oligopeptide in PBS was added to each well. Then, 50 μL of media containing 2×10⁵ cells/mL was added to each well, making the final concentration of the oligopeptide 1 mM. Medium containing 1 mM oligopeptide was changed every two days. Cell proliferation was still assessed using the WST-1 assay. Cells grown in normal media on TCPS and 1 mM oligopeptide on TCPS without cells were used as positive and negative controls respectively.
Results and Discussion
Experimental Design
To investigate how chirality and charge of hydrogels affect hMSC behavior, two mirror-image positively charged oligopeptide modules, L+ and D+, were made; also made were two mirror-image negatively charged oligopeptide modules, L− and D−. Hydrogels were assembled by mixing oppositely charged oligopeptide modules in PBS. Note that although all oligopeptide modules are homochiral and charged, different combinations of oppositely charged oligopeptides result in hydrogels of different chirality (homochiral, heterochiral or racemic) and charge (positive, neutral or negative) statuses. This is the advantage afforded by the co-assembly approach to hydrogelation.
To investigate the effect of hydrogel chirality on hMSC behavior, five neutral hydrogels, including homochiral, heterochiral and racemic types, were made. The two homochiral gels, (LL)0 and (DD)0, were mirror-images of each other. So were the two heterochiral gels, (LD)0 and (DL)0. The racemic hydrogel, (LLDD)0, was its own mirror image.
To investigate the interplay of charge and chirality on hMSC behavior, six homochiral gels of different charge statuses were made. The six hydrogels were comprised of three-mirror image pairs: (LL)+ and (DD)+, (LL)0 and (DD)0, and (LL)− and (DD)−.
In total, 9 hydrogels of different chirality and charge statuses were assembled from 4 homochiral charged oligopeptides. Figure 1 lists all 4 parent oligopeptides, the resulting 9 hydrogels and their mirror image relationships.
Effect of oligopeptide chirality and charge on hMSC viability and proliferation
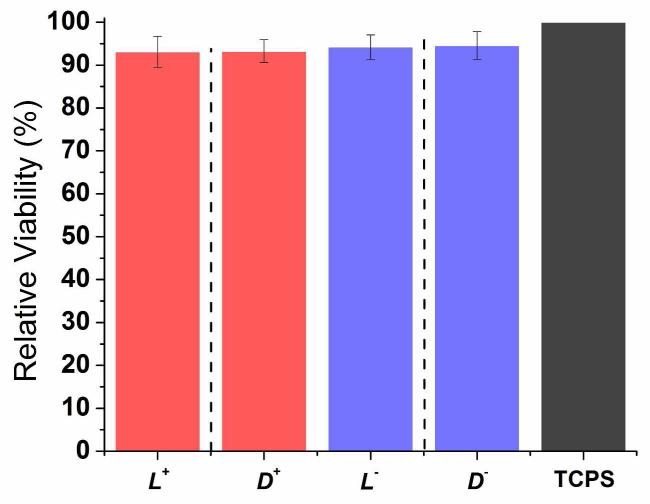
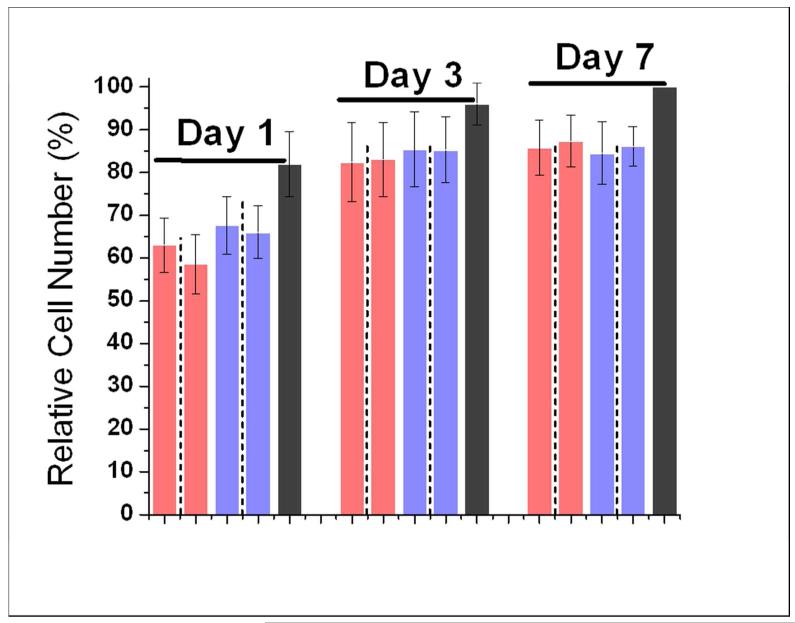
Because each hydrogel is assembled from two or more parent peptides, it is important to separate the impact of a hydrogel from the impact of its parent oligopeptides on stem cells. For this purpose, the impact of the four parent oligopeptides on hMSC behavior was assessed. The results are presented in Figure 2. These individual peptides serve as controls for the hydrogels. All four oligopeptides had about 5% lower cell viability and 15-20% lower proliferation in comparison to the control (TCPS). However, there is no statistically significant difference among the four oligopeptides (p > 0.01, Table S1). Based on this result, any observed differences in hydrogel-cell interactions among the nine hydrogels are caused by differences in hydrogels, not differences in parent peptides.
Figure 2.
(A) Relative hMSC viability on TCPS in the presence of single oligopeptides 24 hours after cell seeding. (B) hMSC cell number percentage on TCPS in the presence of single oligopeptides at 1, 3 and 7 days after seeding. Bar order and colors in (B) correspond to the same order and colors in (A). Adjacent bars separated by dashed lines are a pair of mirror images. For (A), results were normalized to TCPS. For (B), results were normalized to TCPS day 7. For both graphs, errors are expressed as the standard error of the mean (SEM).
Chirality Effects on hMSC Viability and Proliferation
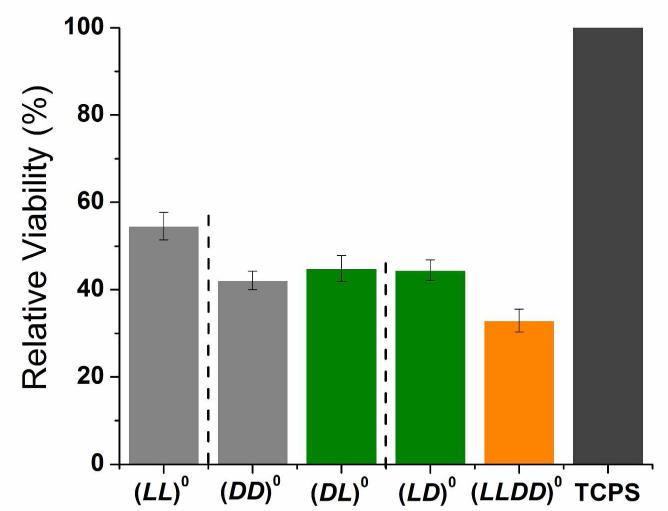
Compared to TCPS, all five neutral gels had 50-70% lower hMSC viability and 40-60% lower hMSC proliferation (Figure 3). Hence hydrogels lead to much lower hMSC viability and proliferation than their constitutive peptides. Among the five neutral hydrogels, the homochiral (LL)0 gel had the highest hMSC viability while the racemic (LLDD)0 gel had the lowest hMSC viability. The other three gels, (LD)0, (DL)0 and (DD)0 gel, showed no statistically significant difference in cell viability.
Figure 3.
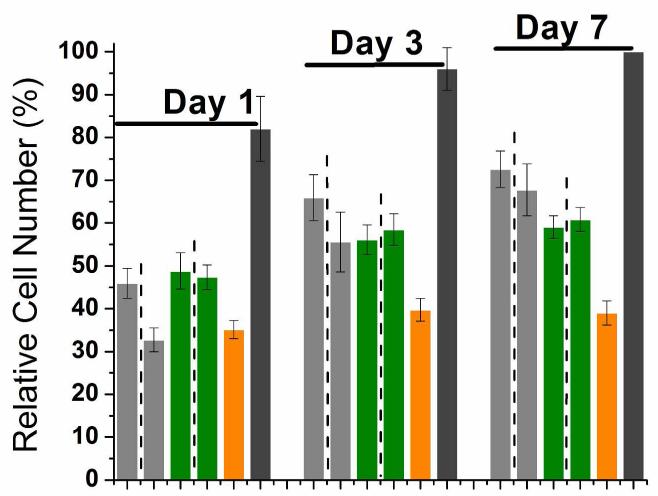
(A) Relative hMSC viability on neutral homochiral and heterochiral gels 24 hours after cell seeding. (B) hMSC cell number percentage on neutral homochiral and heterochiral gels at 1, 3 and 7 days after seeding. Bar order and colors in (B) correspond to the same order and colors in (A). Adjacent bars separated by dashed lines are a pair of mirror images. For (A), results were normalized to TCPS. For (B), results were normalized to TCPS day 7. For both graphs, errors are expressed as the standard error of the mean (SEM).
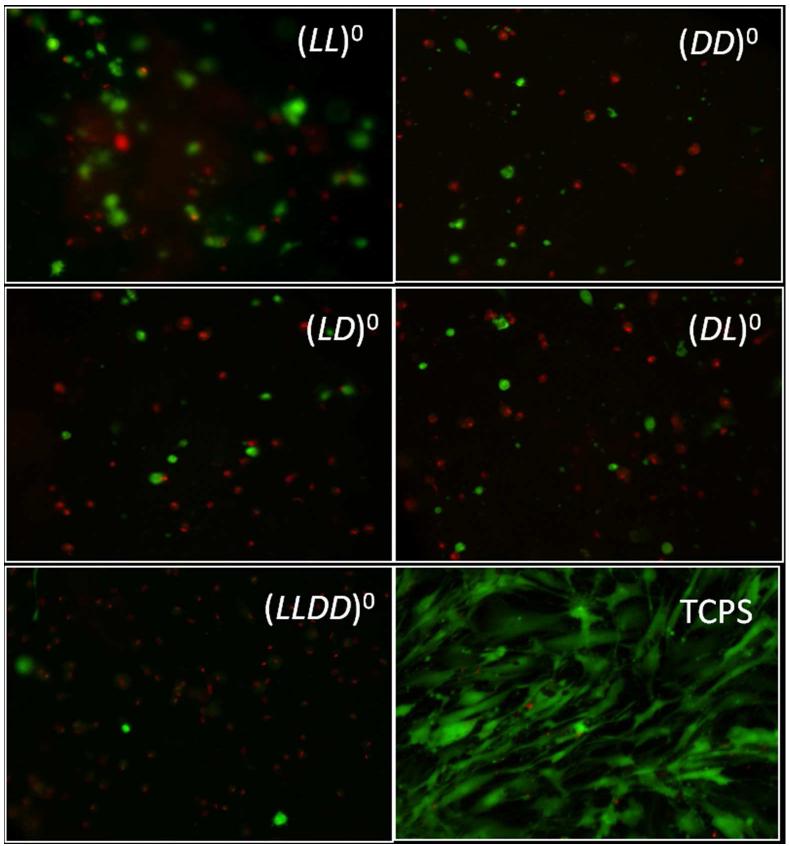
Clear differences in hMSC appearance and survival can be seen in Figure 4. Here, cells on (LL)0 gels appear blurry. Gel images were created from a 15 μm image stack from the most superficially located hMSCs, causing cells which lay in this superficial zone of the gel to sharply contrast the surrounding hydrogel. The blurriness seen within the (LL)0 image is caused by cell fluorescence below the 15 μm image stack. hMSCs seeded on (LL)0 do not exhibit the same clarity as (DD)0 due to penetrating away from this superficial zone and either sinking or migrating into the gel. It is interesting that such penetration is unique to the gel whose chirality matches the chirality of the proteins on the cell surface. Such chirality matching is likely the reason that the (LL)0 gel has better cell viability and proliferation than the other gels. The question now is whether chirality mismatch can be compensated by other factors, such as charge.
Figure 4.
Representative live/dead images for neutral gels and TCPS control at 1 day after cell seeding. Live hMSCs are green and dead hMSCs are red. Cell size is much larger and image clarity is much cloudier for (LL)0 images when compared with (DD)0 and heterochiral and racemic images. These images indicate cell sinking into LL gels, but not into gels containing D-oligopeptide.
After initial viability testing, hMSC proliferation was assessed on days 1, 3 and 7. All five gels supported hMSC proliferation during the seven-day period. However, the two homochiral gels, (LL)0 and (DD)0, had the largest increase in proliferation. On day 1, (LL)0, (DL)0 and (LD)0 gels supported statistically the same amount of hMSC proliferation, while (DD)0 and (LLDD)0 gels supported significantly less hMSC proliferation. By day 7, (LL)0 and (DD)0 gels had the highest level of hMSC proliferation while (LLDD)0 supported the lowest amount of hMSC proliferation. This result suggests that homochiral oligopeptide gels, both L and D, have higher potential for hMSC proliferation than heterochiral oligopeptide gels, which in turn have higher potential than racemic oligopeptide gels for hMSC proliferation.
Considering that (DD)0 has the “wrong” homochirality, it is not surprising that it does not support cell viability and proliferation as well as (LL)0. However, in spite of its initial much lower level of hMSC viability and proliferation, hMSC proliferation on (DD)0 eventually almost catches up with hMSC proliferation on (LL)0. Among the neutral five gels, (DD)0 would be the most protease resistant. (DD)0 also has the same mechanical and structural properties as (LL)0.5 Hence (DD)0 is the most promising replacement of (LL)0. With this in mind, we decided to investigate whether charge could make up the chiral disadvantage of the D-homochiral gel in hMSC viability and proliferation.
Combined Charge and Chirality Effects on hMSC Viability and Proliferation
Charged homochiral hydrogels were made by mixing the positively and negatively charged modules with one module in excess. Specifically, (LL)+ has 1 mM excess of L+ while (LL)− has 1 mM excess of L−. (DD)+ has 1 mM excess of D+ while (DD)− has 1 mM excess of D−. Please note that the total oligopeptide concentration in charged gels is still 5 mM, the same as neutral gels.
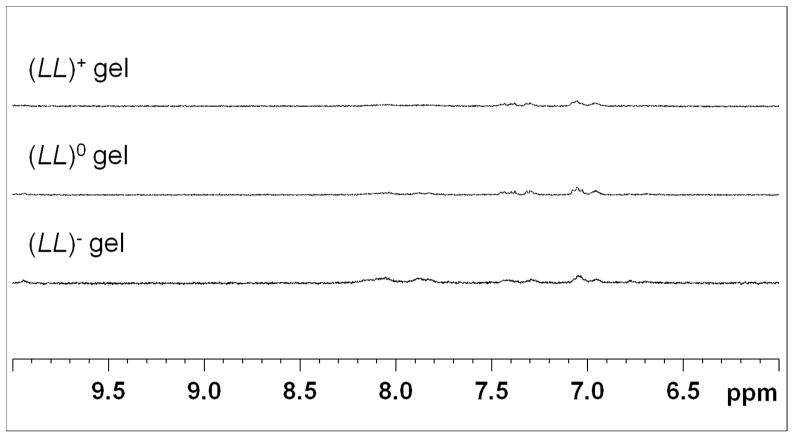
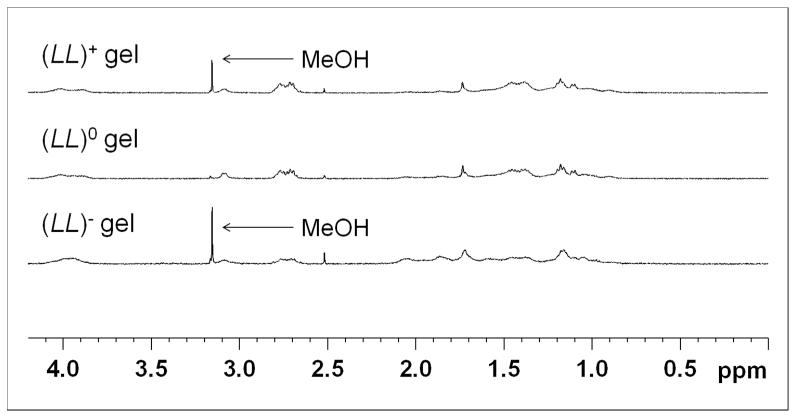
It is important to verify that the excess oligopeptide is indeed incorporated into the hydrogel rather than freely floating inside the matrix. This was accomplished using NMR spectroscopy. NMR 1D 1H measurements were performed on (LL)+, (LL)0 and (LL)− gels to determine whether there was a significant difference in the amount of free oligopeptides after 24 hours of gelation. The 1H peak heights of the three gels were compared (Figure 5). Peak heights of the three gels were comparable to each other. This result indicates that the excess oligopeptide in a charged gel was incorporated into the hydrogel matrix to the same extent as the neutral gel, with hardly any free oligopeptide left. Hence any observed effects of the charged hydrogels on the hMSCs are indeed caused by charged hydrogels, not by charged free oligopeptides.
Figure 5.
1D 1H NMR spectra for (LL)+ gel, (LL)0 gel and (LL)− gel plotted on the same scale. The figure is divided into two parts to exclude the unsuppressed portion of the H2O peak around 4.75 ppm. The left panel is the aromatic region and the right panel is the aliphatic region. Here, the peak heights for all three gels very similar and small, indicating a lack of free oligopeptide present in the gels after 24 hours. Peak heights were calibrated using the proton signal from TSP (9mM proton concentration). Trace amount of MeOH comes from the peptide purification procedure, which uses MeOH as an eluent.
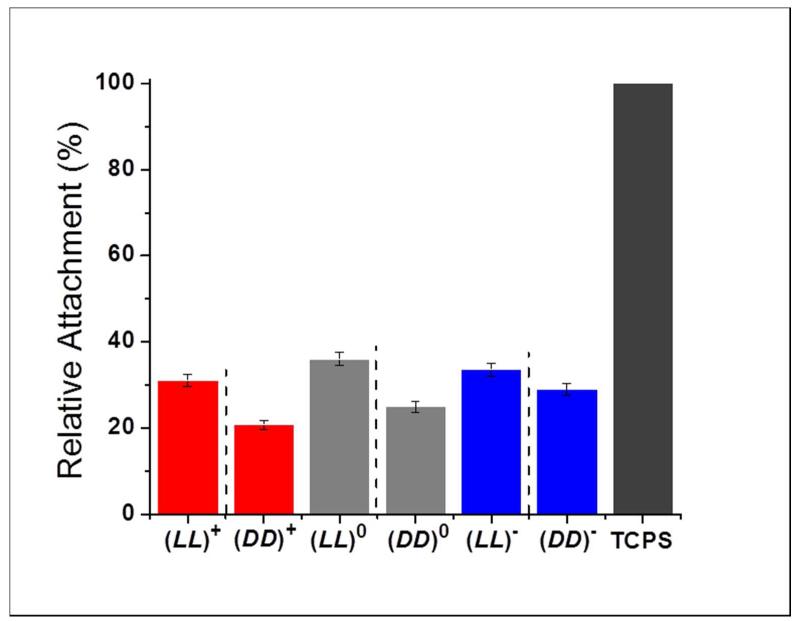
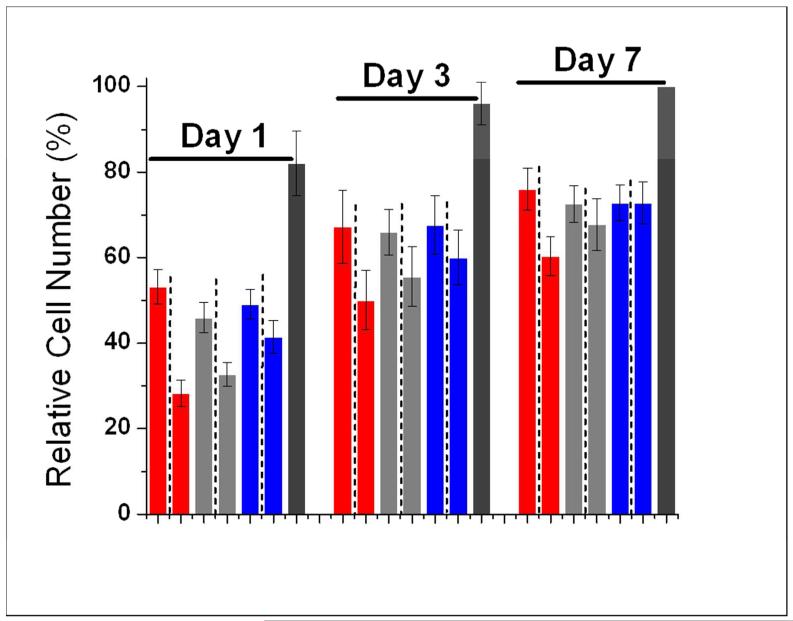
When homochiral gels of different charge statuses are compared (Figure 6), there is no statistically significant difference among the LL-gels in terms of hMSC viability and proliferation (Table S1). However, among (DD)+, (DD)0 and (DD)−, the following trend of hMSC viability and proliferation is observed:
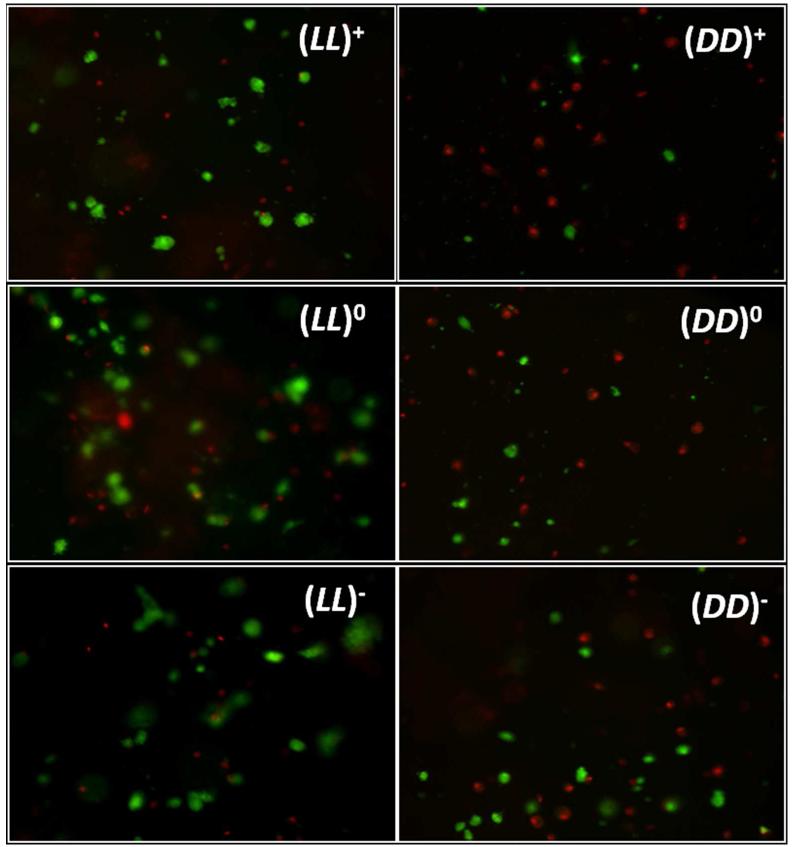
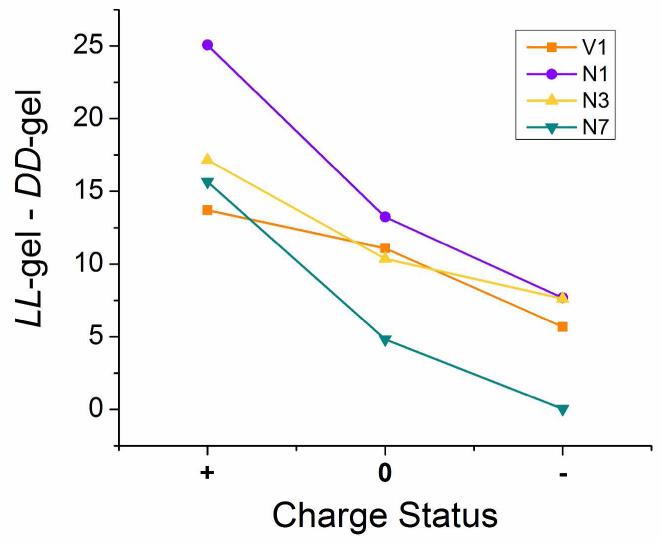
The above order was statistically significant for both viability and proliferation on day 1 but became less significant for proliferation on days 3 and 7 (Table S1). Nonetheless, the trend is very clear (Figure 6B). In Figure 7, the difference between the number of live cells on (DD)− vs. (DD)+ is also apparent. Figure 8 compares L-homochiral with D-homochiral gels of different charge statuses. Negative charges reduce the difference between L- and D-chmochiral gels while positive charges amplify such difference. On day 7, there is no difference at all between (LL)− and (DD)− in cell proliferation. Hence, in terms of hMSC viability and proliferation, chirality mismatch between matrix and cells can be compensated to various extents by negative charges. However, negative charge did not have an effect on cell penetration into the DD-gels. In Figure 7, it is evident that some hMSCs are deeper in the gel than the superficially located cells, causing them to appear blurry; while images of cells of DD-gels, regardless of charge status, remain within the same focal plane.
Figure 6.
(A) Relative hMSC viability on charged and neutral homochiral gels 24 hours after cell seeding. (B) hMSC cell number percentage on charged and neutral homochiral gels at 1, 3 and 7 days after seeding. Bar order and colors in (B) correspond to the same order and colors in (A). Adjacent bars separated by dashed lines are a pair of mirror images. For (A), results were normalized to TCPS. For (B), results were normalized to TCPS day 7. For both graphs, errors are expressed as the standard error of the mean (SEM).
Figure 7.
Representative live/dead images for charged and neutral homochiral gels at 1 day after cell seeding. Live hMSCs are green and dead hMSCs are red. Cell size is much larger and image clarity is much cloudier for LL images when compared with DD images. These images indicate cell penetrating into LL gels, but not into DD gels.
Figure 8.
Calculated differences (LL – DD) in cell behavior on positive, neutral and negative gel pairs. In the figure legend V1 is viability day 1, N1 is cell number day 1, N3 is cell number day 3 and N7 is cell number day 7. Differences between positive pairs are larger than differences between negative pairs in both viability and proliferation experiments and at all time-points.
At the molecular level, net charge is the only difference among different D- or L-homochiral gels. At the material level, difference in charge can induce indifferences in material properties within the D- and L-homochiral series, i.e., (DD)+, (DD)0 and (DD)− might differ in their structural, morphological, mechanical properties and the same holds true for (LL)+, (LL)0 and (LL)−. However basic physicochemical principles dictate that, aside from optical properties, changes in the D-series should parallel changes in the L-series, i.e., (DD)+ and (LL)+ should have identical non-optical material properties; so do (DD)0 and (LL)0; so do (DD)− and (LL)−. Indeed, we have shown experimentally that (DD)0 vs. (LL)0 have identical structural, morphological and viscoelastic properties.5
On the other hand, in terms of hMSC viability and proliferation, charge does not induce parallel changes in D- and L-homochiral gels because negative charge improves the biocompatibility of D-homochiral gels but has no discernible effects on L-homochiral gels (Figure 6 and Table S1). Hence it can be concluded that the interplay between charge and chirality exerts its effects at the molecular level. This is a sensible conclusion because at the molecular level, material-cell interaction must be of a chiral nature if the material is assembled from chiral molecules. Keep in mind that cell membrane proteins are made of L-amino acids, some of which are charged. Hence it is little surprise that they interact with charged D- and L-gels differently. The detailed molecular mechanism by which negative charges enhance the biocompatibility of D-homochiral gels awaits further study. But one possibility can be ruled out; this effect is not caused by negatively charged free peptides because hardly any is left in the hydrogel as shown by NMR studies (Figure 5).
Conclusion
This work shows that, among oligopeptide hydrogels of various chiral compositions, the L-homochiral gel is the most biocompatible, leading to highest hMSC viability and proliferation, while the racemic gel is the least biocompatible, leading to lowest hMSC viability and proliferation. Most importantly, the disadvantage of the D-homochiral gel can be compensated by negative charges. This result points to the possibility of using charge and other factors to engineer biomaterials whose chirality is distinct from that of natural biomaterials but whose performance is close to that of natural biomaterials. Aside from practical applications, such materials offer new tools and opportunities to investigate biohomochirality, an important and unresolved question in biology.
Supplementary Material
Acknowledgements
Financial support provided by the NIH (EB004416) is gratefully acknowledged. We also thank Dr. Y. Feng for his assistance with NMR experiments.
Footnotes
Supporting Information
A schematic showing how each gel was made, analytical HPLC and ESI-MS spectra of the peptides, paired t-tests for cell viability and proliferation and our WST-1 subtraction procedure. This material is available free of charge via the Internet at http://pubs.acs.org.
References
- 1).Kumar A, Ramakrishnan V, Ranbhor R, Patel K, Durani S. J. Phys. Chem. B. 2009;113:16435–16442. doi: 10.1021/jp906811k. [DOI] [PubMed] [Google Scholar]
- 2).Saghatelian A, Yokobayashi Y, Soltani K, Ghadiri MR. Nature. 2001;409:797–801. doi: 10.1038/35057238. [DOI] [PubMed] [Google Scholar]
- 3).Milton RC, deL, Milton SCF, Kent SBH. Science. 1992;256:1445–1448. doi: 10.1126/science.1604320. [DOI] [PubMed] [Google Scholar]
- 4).Reich Z, Schramm O, Brumfeld V, Minsky A. J. Am. Chem. Soc. 1996;118:6345–6349. [Google Scholar]
- 5).Taraban MB, Feng Y, Hammouda B, Hyland LL, Yu YB. Chem. Mater. 2012;24:2299–2310. doi: 10.1021/cm300422q. [DOI] [PMC free article] [PubMed] [Google Scholar]
- 6).Gospodarowicz D, Delgado D, Vlodavsky I. Proc. Nat. Acad. Sci. U.S.A. 1980;77:4094–4098. doi: 10.1073/pnas.77.7.4094. [DOI] [PMC free article] [PubMed] [Google Scholar]
- 7).Reilly GC, Engler AJ. J. Biomech. 2010;43:55–62. doi: 10.1016/j.jbiomech.2009.09.009. [DOI] [PubMed] [Google Scholar]
- 8).Bet MR, Goissis G, Vargas S, Selistre-de-Araujo HS. Biomaterials. 2003;24:131–137. doi: 10.1016/s0142-9612(02)00270-3. [DOI] [PubMed] [Google Scholar]
- 9).Dadsetan M, Pumberger M, Casper ME, Shogren K, Giuliani M, Ruesink T, Hefferan TE, Currier BL, Yaszemski MJ. Acta Biomater. 2011;7:2080–2090. doi: 10.1016/j.actbio.2011.01.012. [DOI] [PMC free article] [PubMed] [Google Scholar]
- 10).Kim S, English AE, Kihm KD. Acta Biomater. 2009;5:144–151. doi: 10.1016/j.actbio.2008.07.033. [DOI] [PubMed] [Google Scholar]
- 11).Ishikawa J, Tsuji H, Sato H, Gotoh Y. Surf. Coat. Technol. 2007;201:8083–8090. [Google Scholar]
- 12).Lee JH, Jung HW, Kang IK, Lee HB. Biomaterials. 1994;15:705–711. doi: 10.1016/0142-9612(94)90169-4. [DOI] [PubMed] [Google Scholar]
- 13).Keselowsky BG, Collard DM, García AJ. J. Biomed. Mat. Res. A. 2003;66:247–259. doi: 10.1002/jbm.a.10537. [DOI] [PubMed] [Google Scholar]
- 14).Keselowsky BG, Collard DM, García AJ. Proc. Natl. Acad. Sci. U.S.A. 2005;102:5953–5957. doi: 10.1073/pnas.0407356102. [DOI] [PMC free article] [PubMed] [Google Scholar]
- 15).Yi Q, Wena X, Li L, He B, Nie Y, Wu Y, Zhang Z, Gu Z. Eur. Poly. J. 2009;45:1970–1978. [Google Scholar]
- 16).Sun T, Han D, Rhemann K, Chi L, Fuchs H. J. Am. Chem. Soc. 2007;129:1496–1497. doi: 10.1021/ja0686155. [DOI] [PubMed] [Google Scholar]
- 17).Ramachandran S, Tseng Y, Yu YB. Biomacromolecules. 2005;6:1316–1321. doi: 10.1021/bm049284w. [DOI] [PMC free article] [PubMed] [Google Scholar]
- 18).Pittenger MF, Martin B. J. Circ. Res. 2004;95:9–20. doi: 10.1161/01.RES.0000135902.99383.6f. [DOI] [PubMed] [Google Scholar]
- 19).McIntosh KR, Bartholomew A. Graft. 2000;3:324–328. [Google Scholar]
- 20).Berridge MV, Tan AS, McCoy KD, Wang R. Biochemica. 1996;4:15–20. [Google Scholar]
- 21).Hyland LL, Taraban MB, Feng Y, Hammouda B, Yu YB. Biopolymers. 2012;97:177–188. doi: 10.1002/bip.21722. [DOI] [PMC free article] [PubMed] [Google Scholar]
- 22).Chan WC, White PD. Fmoc Solid Phase Peptide Synthesis: A Practical Approach. Oxford University Press; New York: 2000. pp. 1–75. [Google Scholar]
- 23).Gill SC, von Hippel PH. Anal. Biochem. 1989;182:319–326. doi: 10.1016/0003-2697(89)90602-7. [DOI] [PubMed] [Google Scholar]
- 24).Feng Y, Taraban M, Yu YB. Soft Matter. 2011;7:9890–9893. doi: 10.1039/C1SM06389H. [DOI] [PMC free article] [PubMed] [Google Scholar]
- 25).Abramoff MD, Magelhaes PJ, Ram S. J. Biophotonics Int. 2004;11:36–42. [Google Scholar]
Associated Data
This section collects any data citations, data availability statements, or supplementary materials included in this article.


