

Abstract
Epstein-Barr virus (EBV) is present in all cases of endemic Burkitt lymphoma (BL) but in few European/North American sporadic BLs. Gene expression arrays of sporadic tumors have defined a consensus BL profile within which tumors are classifiable as “molecular BL” (mBL). Where endemic BLs fall relative to this profile remains unclear, since they not only carry EBV but also display one of two different forms of virus latency. Here, we use early-passage BL cell lines from different tumors, and BL subclones from a single tumor, to compare EBV-negative cells with EBV-positive cells displaying either classical latency I EBV infection (where EBNA1 is the only EBV antigen expressed from the wild-type EBV genome) or Wp-restricted latency (where an EBNA2 gene-deleted virus genome broadens antigen expression to include the EBNA3A, -3B, and -3C proteins and BHRF1). Expression arrays show that both types of endemic BL fall within the mBL classification. However, while EBV-negative and latency I BLs show overlapping profiles, Wp-restricted BLs form a distinct subgroup, characterized by a detectable downregulation of the germinal center (GC)-associated marker Bcl6 and upregulation of genes marking early plasmacytoid differentiation, notably IRF4 and BLIMP1. Importantly, these same changes can be induced in EBV-negative or latency I BL cells by infection with an EBNA2-knockout virus. Thus, we infer that the distinct gene profile of Wp-restricted BLs does not reflect differences in the identity of the tumor progenitor cell per se but differences imposed on a common progenitor by broadened EBV gene expression.
INTRODUCTION
Burkitt lymphoma (BL) is a B cell malignancy whose characteristic epidemiologic, histologic, and cytogenetic features and whose association with a B cell growth-transforming virus, the Epstein-Barr virus (EBV), have made it an important model for the study of human lymphomagenesis (1). The tumor occurs in a high-incidence “endemic” form, which is restricted to equatorial Africa and New Guinea and is consistently EBV positive, and in a low- to intermediate-incidence “sporadic” form elsewhere, with the EBV association falling as low as 10 to 15% in the lowest-incidence areas (Europe and North America) (2). Irrespective of geography or viral association, BL presents as a monomorphic tumor with a very high proliferation index and a significant rate of apoptotic cell death; the tumor cells are phenotypically CD10+ CD77+ Bcl2−, reminiscent of germinal center (GC) centroblasts (3). A unifying pathogenetic feature of all BLs is deregulation of c-myc oncogene expression resulting from one of three chromosomal translocations, t(8:14), t(2:8), or t(8:22), which place a c-myc allele into an immunoglobulin (Ig) heavy or light chain locus (4, 5). While additional genetic changes are almost certainly required to complete the malignant process (6, 7), the prime importance of the c-myc translocation is clear from experiments where forced expression of c-myc/Ig fusion gene constructs in either human B cells in vitro (8) or mouse B cells in vivo (9, 10) has converted those cells to a proliferating BL-like phenotype.
Despite these characteristic features, the boundary between classical BL and other lymphomas can be blurred. Thus, outside areas in which BL is endemic, some c-myc/Ig translocation-positive lymphomas are classified as “atypical BL” on the basis of subtle differences in histologic appearance or immunophenotype (11). In addition, among tumors histologically identified as diffuse large B cell lymphomas (DLBCLs), a small number have BL-like characteristics, in terms of either c-myc/Ig translocation or immunophenotype, and are consequently difficult to distinguish from classical BL. Since BL and DLBCL require different treatment regimes, these concerns prompted two studies (12, 13) which used gene expression profiling to define a molecular BL (mBL) phenotype that would aid accurate diagnosis. Using 95% similarity to a consensus mBL gene signature as the criterion, all classical BLs and almost all atypical BLs displayed an mBL phenotype, as did some (but not all) rare DLBCLs with ambiguous features. The mBL signature differed from that of typical DLBCLs by relative upregulation of c-myc target genes and of a subset of genes activated in GC cells but relative downregulation of other GC-associated genes, as well as of NF-κB target and major histocompatibility complex (MHC) class I genes (12, 13). Note that these pioneering studies focused on only European and North American tumors, and so, although not specified, it is likely that very few cases were EBV positive. Nevertheless, more recent work suggests that endemic BL tumors are broadly similar to sporadic tumors in gene expression profiles (14). Therefore, although individual Burkitt tumors may differ in precise secondary changes en route to malignancy, they all converge on gene expression profiles that are highly related and lie within the circumscribed mBL boundary. Whether there are patterns within the mBL signature that distinguish precise pathways of BL pathogenesis remains to be determined.
We were motivated to address this point further following the identification of two types of endemic BL which display different patterns of EBV antigen expression and, by inference, arise by different pathogenetic routes (15). From in vitro studies, EBV growth transformation of normal B cells to permanent lymphoblastoid cell lines (LCLs) involves the constitutive expression of six virus-encoded nuclear antigens (EBNA1, -2, -3A, -3B, and -3C and LP) and two latent membrane proteins (LMP1 and LMP2); this is referred to as a latency III (Lat III) infection (16). In contrast, endemic BLs exhibit a more restricted pattern of antigen expression (17–19). The majority of such tumors, the so-called latency I BLs, carry a wild-type transformation-competent EBV genome and express only the nuclear antigen EBNA1 from the EBNA1-specific latent promoter Qp (20–22). However, around 15% of endemic tumors, the so-called Wp-restricted BLs, carry an EBNA2 gene-deleted genome and express EBNA1, -3A, -3B, and -3C and the viral Bcl2 homologue BHRF1 from the Wp latent promoter (23–25). This distinction may be important clinically since, based on cell line studies, Wp-restricted BLs are markedly more resistant to apoptosis than are latency I BLs (24, 26) and may therefore require more aggressive therapy. Despite their different behavior in apoptosis assays, both types of tumor express c-myc at high levels from a classically translocated allele and display typical GC-like phenotypic markers (19, 23).
Given the existence of endemic BLs arising through two apparently different pathogenetic routes, the present work set out to address the following questions: (i) do both types of endemic tumors show gene expression profiles within the mBL signature, (ii) can their profiles be distinguished by subtle changes within that signature, and (iii) if so, do such changes reflect differences in the identity of the tumor progenitor cell per se or differences induced in a common progenitor by the different forms of viral infection?
MATERIALS AND METHODS
Cell lines.
BL2, BL30, and L3055 are EBV-negative sporadic BL lines (27). Kem-BL, Rael-BL, and Wan-BL are endemic EBV-positive latency I BL lines which express a single latent antigen, EBNA1 (19, 28). Tam-BL, Tiaz-BL, and Tiyo-BL are endemic EBV-positive BL lines which have drifted phenotypically during in vitro passage and now express the full range of EBV latent antigens (latency III). Ava-BL, Awia-BL, Oku-BL, and Sal-BL are Wp-restricted BL lines coinfected with wild-type and EBNA2-deleted virus genomes (23, 26). The EBV-negative, latency I, and Wp-restricted subclones of Awia-BL were generated by single-cell cloning as described previously (26). Awia tr-LCL was made by inducing virus replication in the Awia-BL line and rescuing transforming virus by infection of resting B cells (26). Standard BL lines and LCLs were maintained in RPMI 1640 medium (Invitrogen) containing 10% (vol/vol) selected fetal calf serum and 2 mM glutamine (Sigma). Wp-restricted BL lines were grown in complete RPMI 1640 medium further supplemented with 1 mM sodium pyruvate, 50 μM alpha-thioglycerol, and 20 nM bathocupronine disulfonic acid.
In vitro infection with EBNA2-deleted rEBV.
The EBNA2-deleted recombinant EBV (EBNA2 KO [E2KO] rEBV), derived from the wild-type 2089 virus, was kindly provided by W. Hammerschmidt (29). EBNA2 KO rEBV stocks were generated from stably transfected HEK293 cells as described previously (30). Awia-BL clones were infected with EBNA2 KO rEBV at a multiplicity of infection (MOI) of 50, and EBV-converted cell lines were generated following selection in medium containing 100 μg/ml hygromycin.
Western blotting.
Immunoblotting for EBV antigens and cellular proteins was performed using the following monoclonal antibodies: 1H4 (anti-EBNA1) (31), PE2 (anti-EBNA2) (32), CS1-4 (anti-LMP1) (33), 5B11 (anti-BHRF1; Millipore, United Kingdom), H170 (anticalregulin; Santa Cruz Biotechnology, CA), and C-8 (anti-c-Myc; Santa Cruz Biotechnology, CA). EBNA3A was detected using a polyclonal antibody, F115P (Exalpha Biologicals, Maynard, MA).
Real-time PCR analysis.
Total RNA (400 ng) was reverse transcribed using qScript cDNA Supermix (Quanta Biosciences) according to the manufacturer's instructions and then diluted to a final volume of 100 μl. TaqMan gene expression assays (Applied Biosystems, Foster City, CA) were used to detect transcripts for Pax5 (Hs00172003), IRF4 (Hs00180031), Bcl6 (Hs00153368), Blimp1/PRDM1 (Hs00153357), c-myc (Hs00153408), and glyceraldehyde-3-phosphate dehydrogenase (GAPDH) (4310884E). Assays were performed in a 25-μl reaction volume containing 1× TaqMan Universal PCR master mix, 1.25 μl TaqMan gene expression assay, 0.5 μl GAPDH endogenous control assay, and 5 μl diluted cDNA. Thermocycling and data collection were performed using an Applied Biosystems 7500 real-time PCR system. All test samples were run in triplicate, and template-negative and reverse transcriptase (RT)-negative samples were included as controls. Each run also contained 5-fold serial dilutions of a reference cDNA which were used to construct a calibration curve for each test gene. Raw data were analyzed using 7500 System Software v1.4, normalized to GAPDH expression, and then reported relative to the reference cell line.
HGMP cDNA glass slide arrays.
Dual-color microarray experiments were performed essentially as described previously (34). Briefly, RNA was extracted from BL cell lines using TRIzol and mRNA was subsequently isolated with an Oligotex mRNA minikit (Qiagen, Crawley, United Kingdom), followed by DNase I digestion. Purified mRNA (1 μg) was reverse transcribed and labeled with Cy5 (CyScribe first-strand cDNA labeling kit; GE Healthcare Life Sciences, United Kingdom). Cy5-labeled test cDNA was then mixed 1:1 with Cy3-labeled reference cDNA (generated from 6 cell lines in the following proportions: HeLa, 25%; HuH7, 20%; Ramos, 15%; MRC5, 5%; LCL, 25%; U937, 10%). The Cy5/Cy3 mixes were hybridized overnight to custom Human Genome Mapping Project (HGMP) cDNA glass slide arrays (comprising approximately 5,700 human genes), washed, and dried. Finally, the slides were scanned using a GenePix 4000B scanner (Axon Instruments, Union City, CA), the Cy5 and Cy3 fluorescence intensities were extracted for each gene spot, and the data were exported as GenePix Result (GPR) files.
To analyze the HGMP array data, GPR files were first imported into the CARMAweb analysis package (https://carmaweb.genome.tugraz.at/carma/). Experimental features flagged as “bad” were removed along with control elements, background fluorescence was subtracted using the Normexp method (35), and log2 median and mean ratios for Cy5 and Cy3 signals/spot were calculated. Within-array normalization was performed using the “robust splines” method, and between-array normalization was performed using the “scale” method (36). The normalized data were then exported and analyzed using TMEV (37). Briefly, the data structure was grouped by average linkage hierarchical clustering using the Pearson correlation coefficient as the distance metric and visualized using Java TreeView (38). Based on the original BL classification, differentially expressed genes were identified using significance analysis of microarrays (SAM) (39, 40) with an appropriate false discovery rate (FDR). In each case, differentially expressed genes are clustered by average linkage hierarchical clustering using the Pearson correlation coefficient.
Affymetrix HGU133 Plus 2.0 arrays.
Gene expression profiling using the Affymetrix Human Genome U133 (HGU133) Plus 2.0 arrays was performed according to the Affymetrix protocol (Santa Clara, CA). Briefly, biotinylated RNA was fragmented and hybridized to the gene chips. After washing and staining using an Affymetrix FS450 fluidics station, arrays were scanned using a GeneChip 3000 7G scanner. GeneChip Operating Software (GCOS) was used for instrument control and data acquisition. Scanned images were analyzed using GCOS and Expression Console software (Affymetrix), with the target signal set to 100. Ratios for GAPDH and beta-actin (3′/5′) were within acceptable limits (GAPDH, 0.995 to 1.17; beta-actin, 1.31 to 2.02), and BioB spike controls were present in all 12 chips, with BioC, BioD, and CreX also present in increasing intensity. Scaling factors ranged from 1.03 to 5.08, background ranged from 33 to 54, raw Q values ranged from 0.89 to 1.7, and percent present ranged from 32.3% to 40.3%. Probe-level quantile normalization (41) and robust multiarray analysis (42) on the raw CEL files were performed using the Affymetrix package of the Bioconductor (http://www.bioconductor.org) project. Differentially expressed probe sets were identified using SAM with the fold change threshold set to 1.5 and the FDR (the Q value) below 1%. Gene expression heat maps were generated using dChip (http://www.dchip.org). The sample correlation heat map was generated using the R gplots package.
The mBL phenotypes of eight Awia-BL clones (four latency I and four Wp restricted) were compared against 60 reference primary tumors (30 mBLs and 30 DLBCLs) randomly selected from the Molecular Mechanisms in Malignant Lymphoma (MMML) archive. Briefly, the raw Awia-BL and MMML data sets were merged based on common probe sequences between the HGU133 Plus 2.0 and HGU133A gene chips. Preprocessing and add-on normalization were performed to allow direct comparison of expression values (43). Expression values from the mBL signature genes were then used to calculate a single representative value (mBL index) for each sample by fitting a standard additive model with independent gene and sample effects using Tukey's median polish procedure (44).
Microarray data accession number.
The primary data are available from NCBI's Gene Expression Omnibus (GEO) (http://www.ncbi.nlm.nih.gov/geo) under the GEO series accession number GSE42867.
RESULTS
Cellular gene expression profiling of BL cell lines with different patterns of viral gene expression.
The initial experiments focused on cell lines established from three typical latency I BL lines and three Wp-restricted BL lines, all of endemic (African) origin. These were compared with three EBV-positive endemic BL lines which, though established from conventional latency I tumors, had switched during in vitro passage to a latency III pattern of viral gene expression and acquired an LCL-like cell phenotype (18, 45), and three EBV-negative sporadic BL lines. These different patterns of latent antigen expression are illustrated in Fig. 1. Latency I BL lines express EBNA1 only, while Wp-restricted BL lines express EBNA1, the EBNA3 family (here shown by EBNA3A), and BHRF1; note that while BHRF1 is usually considered a lytic cycle antigen (46), Wp-restricted BLs express BHRF1 as a latent protein from the EBNA2 gene-deleted virus genome (24). In contrast, the latency III-switched BL lines (and a representative tightly latent LCL, X50-7) express the full spectrum of latent genes, including the key markers of an EBV growth-transforming infection, EBNA2 and LMP1; the low levels of BHRF1 in the latency III BL lines reflect virus replication in a small fraction of cells. Importantly, latency I and Wp-restricted BL lines retain high-level expression of c-Myc, a key feature of the BL tumor, in contrast to the lower c-Myc levels typically seen in LCLs and in latency III BL lines.
Fig 1.
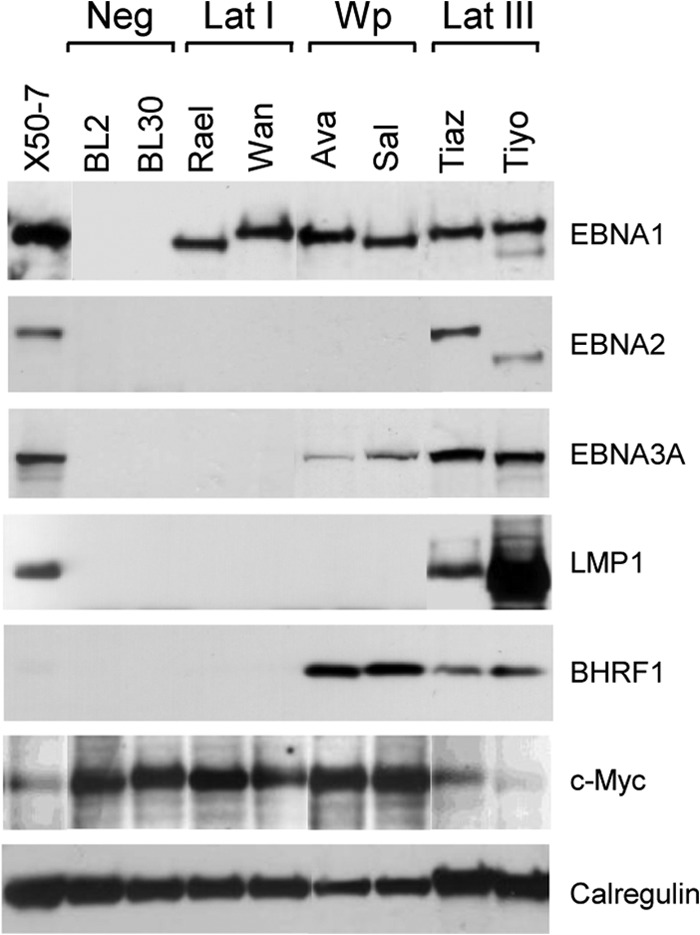
Analysis of EBV antigen expression in BL lines. Expression of the viral proteins EBNA1, EBNA2, EBNA3A, LMP1, and BHRF1 was detected by immunoblotting of cell lysates using the relevant specific antibodies. Calregulin was used as a loading control. BL2 and BL30 are EBV-negative BL lines. Rael-BL and Wan-BL are EBV-positive BL lines displaying a typical latency I (Lat I) form of infection characterized by the expression of a single latent antigen, EBNA1. Ava-BL and Sal-BL are Wp-restricted BL lines which express EBNA1, EBNA3A (and EBNA-3B and -3C [not shown]), and BHRF1. Tiaz-BL and Tiyo-BL are latency III BL lines which express the full spectrum of latent antigens detected in EBV-transformed LCLs (here shown by the tightly latent X50-7 LCL). Note that c-Myc protein is highly expressed in EBV-negative BL, latency I BL, and Wp-restricted BL lines but is downregulated in latency III BLs and the X50-7 LCL.
We then compared the gene expression profiles of three BL lines of each type using a custom cDNA glass slide array. Using a set of 1,969 genes which passed our filtering criteria, both the genes and samples from all 12 array experiments were first ordered and then grouped by hierarchical clustering (Fig. 2A). The 12 individual lines clustered into two main branches. The first branch contained the latency I lines (Kem-BL, Rael-BL, and Wan-BL), the EBV-negative lines (L3055, BL2, and BL30), and the Wp-restricted lines (Sal-BL, Oku-BL, and Ava-BL); note that the latency I and EBV-negative lines were intermingled, whereas two Wp-restricted lines formed a separate outgroup. In contrast, the latency III lines (Tiyo-BL, Tiaz-BL, and Tam-BL) were grouped into a second main branch, indicating that the gene expression profile of these lines was clearly different from that of the other BL lines tested.
Fig 2.

Gene expression profiling of BL cell lines using HGMP arrays. (A) Hierarchical clustering of EBV-negative (L3055, BL2, and BL30), latency I (Lat I) (Kem-BL, Rael-BL, and Wan-BL), Wp-restricted (Sal-BL, Ava-BL, and Oku-BL), and latency III (Tiyo-BL, Tiaz-BL, and Tam-BL) BL lines using a filtered data set of 1,969 genes. Each column represents one sample, and each row represents one gene. Gene expression is shown as a pseudocolored representation of log2 expression ratio, with yellow being above and blue being below the row's median level of gene expression, as shown by the scale. The dendrogram relates samples by the gene expression pattern, with shorter branch lengths indicating closer similarity. (B) Microarray expression data of selected mBL signature genes identified by Hummel et al. (12) (TCF3, BMP7, APBB2, CSE1L, TERT, RFC3, and TFDP2) or Dave et al. (13) (TCF3, BMP7, HMGB1, RFC3, and TERT) as being upregulated in BL relative to DLBCL. (C) Microarray expression data of selected mBL signature genes identified by Hummel et al. (12) (STAT3, CD44, NFKBIA, CRIP1, BCL2A1, and SQSTM1) or Dave et al. (13) (STAT3, CD44, NFKBIA, BCL2A1, PIM2, and CCL3) as being downregulated in BL relative to DLBCL. In panels B and C, the HGMP array data (two probe sets for each of the three cell lines in a BL subset) are represented as a box-and-whiskers plot, with each gene expressed as a log2 expression ratio relative to the median.
Given the limited number of features on the HGMP array, we could not conduct a comprehensive comparison of our data with the Affymetrix-defined mBL signature. Nevertheless, the HGMP arrays did yield information on 16 genes whose differential expression between BL and DLBCL defined the mBL signature (12, 13). We therefore used the HGMP array data to determine the mean expression levels of those informative genes in the different sets of BL lines. Figure 2B shows the results for eight genes reported to be upregulated in BL relative to DLBCL. Of these, four genes (TCF3, BMP7, APBB2, and HMGB1) were more highly expressed in EBV-negative and latency I BLs than in latency III lines; in these four cases, levels of expression in Wp-restricted BLs were either similar to those in the EBV negative/latency I subset or intermediate between these subsets and the latency III values. Interestingly, the four remaining genes (CSE1L, TERT, RFC3, and TFDP2) were equally expressed across all four BL subsets. Conversely, Fig. 2C shows the results for eight genes reported to be downregulated in BL relative to DLBCL. Of these, six genes (STAT3, CD44, NFKBIA, CRIP1, PIM2, and CCL3) showed lower levels of expression, not just in the EBV-negative/latency I lines but also in the Wp-restricted BLs, than in the latency III lines; the other two genes (BCL2A1 and SQSTM1) were expressed at similar levels in all four BL subsets. Overall, these findings provide preliminary evidence that Wp-restricted BL lines, like the EBV-negative/latency I BLs, display an mBL-like gene expression profile but may form a subtly distinct group of tumors within the mBL classification. In contrast, the latency III BL gene expression profile is clearly distinct from that of the other three BL subsets, although latency III BL cells still retain some features of gene expression that are characteristic of their BL origin.
To search for differentially expressed genes which distinguished between the four BL subsets, we next carried out groupwise comparisons using significance analysis of microarrays at appropriate false discovery rates (Fig. 3A). Comparison of EBV-negative/latency I with latency III BLs identified 94 statistically significant genes (Fig. 3B); 16 genes upregulated in EBV-negative/latency I lines and 78 upregulated in latency III lines. Many of the latter have already been reported as features of the in vitro-transformed LCL phenotype (47) and include genes known to be induced either by EBNA2 (IFNGR1, CCL3L3, CD53, RUNX3, and CASP1) (48, 49) or by LMP1 (the transcription factors JunB, IRF7, and RUNX3; the NFKB-related factors NFKBIA and TRAF1; CD58; CD95/FAS; and TNFAIP3/A20) (50). The markedly different expression profile of latency III BLs emphasizes the dramatic phenotypic change that occurs in those endemic BL cell lines that, on serial passage, spontaneously switch from a c-myc-driven to an EBV-driven growth program.
Fig 3.

Identification of differentially expressed genes in BL lines with different patterns of EBV latency. (A) Groupwise comparisons were performed to identify differentially expressed genes using significance analysis of microarrays (SAM) at appropriate false discovery rates (FDRs). The comparisons included EBV negative/latency I (Lat I) versus latency III, EBV negative/latency I versus Wp restricted, and latency I versus Wp restricted. The number of statistically significant genes and the FDR for each analysis are indicated. Note that in the comparisons between EBV-negative/latency I and Wp-restricted lines, and between latency I and Wp-restricted lines, it was necessary to use a much higher FDR of 10% to identify differences in gene expression. (B) Heat map of differentially expressed genes between latency III and EBV-negative/latency I BL lines. In total, 78 genes were upregulated in latency III BLs, and 16 genes were upregulated in latency I/EBV-negative BLs. EBNA2 target genes are shown in bold; LMP1 target genes are underlined. (C) Heat map of differentially expressed genes between latency I and Wp-restricted BL lines. In panels B and C, differentially expressed genes were grouped by hierarchical clustering, with each column representing a cell line and each row representing an individual gene. Gene expression is shown as a pseudocolored representation of log2 expression ratio relative to the row's median value, as shown by the scale. Gray indicates data removed by filtering.
In contrast, there were far fewer differences between EBV-negative, latency I, and Wp-restricted BL lines (Fig. 3A). Comparison of EBV-negative/latency I BLs with Wp-restricted BLs yielded only 12 genes, while comparison of latency I BLs with Wp-restricted BLs yielded 25 genes, including almost all of the previous 12. These 25 genes (18 upregulated and 7 downregulated in Wp-restricted BL cells relative to latency I) are identified in Fig. 3C. Searching among these 25 genes for candidates relevant to our immediate purpose, namely, distinguishing between the two types of tumor in terms of B cell phenotype, we identified two genes encoding well-characterized markers of B cell differentiation: Bcl6, a GC cell marker whose expression was higher in the latency I lines, and Sub1 (PC4), a plasma cell differentiation marker whose expression was higher in Wp-restricted lines. The positions of these and other markers of the physiologic process of B cell maturation from GC cell to plasma cell are summarized diagrammatically in Fig. 4A.
Fig 4.
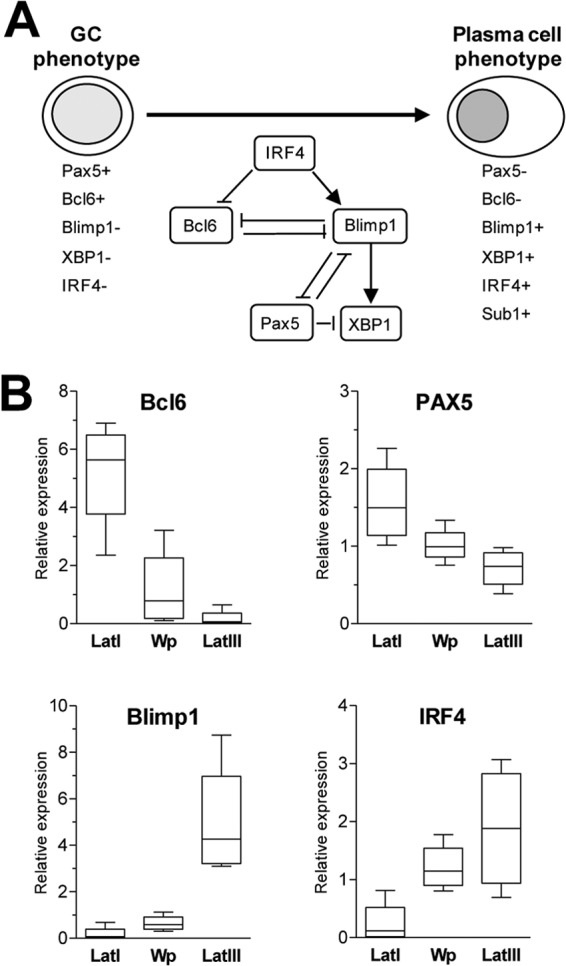
Expression of B cell differentiation genes in BL lines with different patterns of EBV latency. (A) Schematic illustration of key transcription factors involved in the transition from a germinal center to a plasma cell phenotype. Briefly, this process is characterized by the activation of IRF4, which causes upregulation of the master plasma cell regulator Blimp1/PRDM1 and downregulation of Bcl6, an inhibitor of plasma cell differentiation. Since Blimp1 and Bcl6 form a double-negative inhibitory loop, increased levels of Blimp1 lead to a further reduction in Bcl6 levels, reinforcing the switch from a GC to a plasma cell phenotype. Plasma cell differentiation is also linked to loss of the pan-B-cell marker Pax5 and upregulation of XBP1 (a positive regulator of plasma cell differentiation). Sub1, which is activated in plasma cells, is a known IRF4 target gene. (B) Quantitative RT-PCR analysis of Bcl6, Pax5, Blimp1, and IRF4 expression in latency I (Lat I), Wp-restricted, and latency III BL tumor subsets.
Since many of these B cell differentiation markers were not present on the original HGMP array, we used quantitative reverse transcriptase PCR (RT-PCR) assays to compare the levels of Bcl6, Pax5, IRF4, and Blimp1 transcripts in each of the relevant BL cell lines (Fig. 4B). The expression of Bcl6 was indeed clearly highest in latency I lines, lower in Wp-restricted lines, and lower still in the latency III BL lines included for comparison; the data for Pax5 showed a similar but less dramatic trend. Conversely, IRF4 and Blimp1 were both poorly expressed in latency I lines, were increased in Wp-restricted lines (particularly with respect to IRF4), and still higher in latency III lines. These findings reinforce the earlier HGMP array data indicating that Wp-restricted BLs represent a subtly distinct subset of tumors within the mBL signature and identify early changes on the GC-to-plasma cell differentiation pathway as potential markers of that subset.
Cellular gene expression profiling of EBV-negative, latency I, and Wp-restricted clones derived from a single case of endemic BL.
Recognizing that at least some of the heterogeneity observed above is likely to arise through comparing individual tumors derived from different patients, we next sought to move to an isogenic system. This became possible through our earlier identification of a unique endemic tumor, Awia-BL, which was heterogeneous in terms of EBV infection at the single-cell level. In earlier work, we had single cell cloned the parental Awia-BL cell line in early passage to generate EBV-negative, latency I, and Wp-restricted clones all carrying the same t(8:14) translocation and a unique trisomy 20 marker that confirmed their derivation from the same malignancy (26). Confirmation that these different sets of clones had the appropriate status with respect to EBV gene expression was obtained by immunoblotting for virus-encoded latent proteins (data not shown).
Representative Awia-BL clones of each type (duplicate cultures of two independent EBV-negative clones, four independent latency I clones, and four independent Wp-restricted clones) were then subjected to gene expression profiling using Affymetrix U133 Plus 2.0 gene chips. First, we examined all the Awia-BL data sets for expression of the 58 mBL signature genes (12). The resultant heat map (Fig. 5A) shows data from latency I and Wp-restricted Awia-BL clones alongside previously archived data from 30 reference cases of DLBCL and 30 reference cases of sporadic BL (12). Clearly, all the Awia-BL clones, irrespective of latency pattern, have gene expression profiles that fall within the boundary defining mBL. Indeed, for most of the 58 mBL signature genes, the Awia-BL clones showed very closely related profiles, even sharing particular exceptions to the general mBL signature (e.g., low expression of TUBB2A/2B). Note that idiosyncratic differences also exist between individual reference BL tumors, even though all these tumors are defined as BL through having gene expression patterns that are >95% similar to the consensus mBL profile. The existence of such idiosyncratic differences emphasizes the importance to the present study of comparing EBV-negative, latency I, and Wp-restricted BL cells all derived from the same tumor.
Fig 5.

Gene expression profiling of Awia-BL clones using HGU133 Plus 2.0 arrays. (A) Expression of mBL signature genes. The heat map shows the Affymetrix gene expression levels for 58 mBL signature genes (74 probe sets) from 8 Awia-BL subclones (four each of latency I [Lat I] and Wp restricted) compared to 30 reference cases of DLBCL and 30 reference cases of BL. Each column represents a different sample, and each row represents a different probe set (as indicated by the gene names on the right side of the figure); blue and yellow indicate low and high levels of expression, respectively. In the heat map, samples were ordered according to their mBL index, with the lowest value at the leftmost end of the figure. (B) Pearson correlation-based matrix of gene expression data sets from Awia-BL clones. The heat map shows a pairwise correlation matrix for two EBV-negative clones (w and z, assayed in biological duplicate), four latency I clones (a, b, c, and d), and four Wp-restricted clones (m, n, p, and q) based on Affymetrix gene expression data. The shading of each square represents the Pearson correlation coefficient, with red and blue indicating high and low similarity, respectively.
To search for relationships between the different Awia-BL clones, we next arranged the cell lines according to the overall similarity in their gene expression profiles. The results, illustrated as a Pearson coefficient correlation matrix (Fig. 5B), show that the four Wp-restricted clones form a tight homogeneous cluster separate from the other Awia-BL clones. By comparison, the EBV-negative and latency I clones were more heterogeneous, with individual clones intermingled irrespective of their EBV genome status. We then performed a SAM analysis to identify differentially expressed genes which distinguish between Wp-restricted and latency I Awia-BL clones. Of the 20,764 genes named on the HGU133 Plus 2.0 array, 980 (4.72%) were significantly altered between the two subsets; of these, 457 were upregulated and 523 were downregulated in Wp-restricted clones relative to latency I (Fig. 6A).
Fig 6.

Identification of differentially expressed genes in Awia-BL clones. (A) Heat map representing differentially expressed genes between latency I (Lat I) and Wp-restricted Awia-BL clones identified by SAM analysis using the criteria of >1.5-fold change and 1% FDR. Each row in the heat map represents a gene, and each column represents a sample. The expression levels for each gene were standardized to a mean value of 0 and a standard deviation of 1 and are represented according to the color scale; red and green indicate high and low expression, respectively. (B and C) DAVID gene ontology analysis was used to identify enriched genes (P < 0.05, fold enrichment of >2) in the top 200 upregulated (B) or downregulated (C) transcripts, which were then grouped according to biological function. (D) Comparison of differentially expressed genes with the plasma cell signature. The Venn diagrams show the overlap between genes significantly up- or downregulated in Wp-restricted BL clones compared with latency I BL clones and genes up- or downregulated in plasma cells compared to centrocytes. The HGU133 Plus 2.0 array contains 20,764 annotated genes, of which 980 are differentially expressed in Wp-restricted latency compared with latency I cells and 2,877 are differentially regulated in plasma cells compared to centrocytes; 259 genes are common to both data sets (odds ratio [OR], 2.36; chi-square, 136.2; P = 0.0000). Four hundred fifty-seven genes are upregulated in Wp-restricted latency, of which 126 are concordantly upregulated in the plasma cell signature; thus, genes which are upregulated in Wp-restricted latency are significantly enriched for genes increased during plasma cell differentiation (OR, 3.08; chi-square, 121.7; P = 0.0000). Conversely, 523 genes are downregulated in Wp-restricted latency versus latency I cells, of which 53 are concordantly regulated during plasma differentiation; thus, genes which are downregulated in Wp-restricted latency are also significantly enriched for genes downregulated in the plasma cell signature (OR, 4.75; chi-square, 127.1; P = 0.0000).
To gain insights into the possible biological significance of these changes, we used the web-based program DAVID (51) to identify gene ontology (GO) terms associated with the top 200 upregulated and top 200 downregulated genes. We then compared the GO term frequencies in these two gene lists with the global GO term frequencies of all genes present on the array to identify biological processes that are enriched in each gene list. The results are summarized in Table 1 and depicted as heat maps in Fig. 6B and C. Seven GO terms were overrepresented among the 200 upregulated genes, while four GO terms were overrepresented in the 200 downregulated genes. Taken together, the most common terms were broadly linked to leukocyte activation, immune system development, and regulation of developmental processes, suggesting that subtle changes relating to B cell activation or differentiation status are potential discriminators between Wp-restricted BL and latency I BL lines.
Table 1.
GO analysis of differentially expressed genes between latency I and Wp-restricted Awia BL clones
| Categorya | Term | Fold enrichmentb | No. of genesc | Fisher exactd |
|---|---|---|---|---|
| Top 200 upregulated genes | ||||
| GO:0019882 | Antigen processing and presentation | 5.8 | 5 | 5.00E-03 |
| GO:0045321 | Leukocyte activation | 3.5 | 10 | 5.50E-04 |
| GO:0051094 | Positive regulation of developmental process | 3.4 | 11 | 4.20E-04 |
| GO:0001775 | Cell activation | 3.0 | 10 | 2.00E-03 |
| GO:0006955 | Immune response | 2.4 | 19 | 4.40E-04 |
| GO:0044419 | Interspecies interaction between organisms | 2.4 | 9 | 1.80E-02 |
| GO:0008219 | Cell death | 2.3 | 19 | 6.10E-04 |
| Top 200 downregulated genes | ||||
| GO:0002520 | Immune system development | 3.7 | 11 | 1.90E-04 |
| GO:0030029 | Actin filament-based process | 2.7 | 7 | 1.40E-02 |
| GO:0045321 | Leukocyte activation | 2.7 | 7 | 1.60E-02 |
| GO:0050793 | Regulation of developmental process | 2.0 | 14 | 1.30E-02 |
Gene ontology (GO) annotation.
Fold enrichment of GO annotation term in top 200 up- or downregulated genes.
Number of genes matching a GO annotation term.
Fisher exact P value of gene enrichment.
To test the earlier suggestion that changes on the GC-to-plasma cell differentiation pathway were one such discriminator, we next examined the overlap between these 980 differentially regulated genes and a list of 2,877 genes previously reported to be differentially expressed between plasma cells and germinal B centrocytes (52). Of the 980 genes in our list, 259 (26.4%) were also differentially expressed between plasma cells and centrocytes (odds ratio [OR], 2.36; P = 0.0000). Furthermore, there was a significant overlap between genes upregulated in Wp-restricted BL and those upregulated in plasma cells and likewise between genes downregulated in Wp-restricted BL and those downregulated in plasma cells (Fig. 6D). Thus, the global analysis of gene expression in the Awia-BL clones is consistent with a detectable shift from a GC toward a plasmacytoid phenotype in Wp-restricted BL.
To further explore these findings, we screened our panel of Awia-BL clones for the expression of key B cell differentiation-associated genes both by RT-PCR and, where possible, by immunoblotting for the relevant proteins. Representative data from two EBV-negative, two latency I, and two Wp-restricted Awia-BL clones are shown in Fig. 7, against parallel data from a standard LCL. We found no consistent differences between the clones in the levels of Pax5 mRNA or protein. However, there was a tendency toward lower Bcl6 mRNA and protein levels in the Wp-restricted clones and a clear increase in IRF4 and Blimp1 transcription (over the very low levels detected in EBV-negative and latency I clones), accompanied by the appearance of detectable IRF4 protein. However, these shifts toward a more plasmacytoid phenotype in Wp-restricted clones were small compared to the phenotype shown by LCLs, where Bcl6 expression is fully extinguished while both IRF4 and Blimp1 are more strongly expressed. Note also that the small changes seen in Wp-restricted clones had occurred without prejudicing the high level of c-myc expression that was a characteristic of all the Awia-BL clones.
Fig 7.

Expression of B cell differentiation genes in Awia-BL clones with different forms of latent infection. Two EBV-negative clones (w and z), two latency I (Lat I) clones (a and d), and two Wp-restricted clones (m and n) of Awia-BL were screened for expression of key B cell differentiation markers. (A) Quantitative RT-PCR analysis of Pax5, Bcl6, Blimp1, IRF4, and c-myc RNA expression. (B) Immunoblotting of Pax5, Bcl6, IRF4, and c-Myc protein expression; calregulin was used as a loading control.
Recapitulating Wp-restricted infection in a BL cell background alters the cellular gene expression profile.
In the final experiments, we asked whether the shift toward a plasmacytoid phenotype seen in Wp-restricted BLs had been imposed by this form of EBV infection, rather than signifying that Wp-restricted tumors had arisen from a progenitor cell at a slightly different stage of differentiation. To do this, we took advantage of the fact that the Wp-restricted form of latency can be generated in vitro by infecting either EBV-negative or latency I BL cells with an EBNA2 gene-deleted (EBNA2 KO [E2KO]) virus. Thus, one EBV-negative Awia-BL clone and two latency I Awia-BL clones were infected with a recombinant EBNA2 KO virus carrying a hygromycin resistance gene, allowing selection of successfully infected converts. As reported in earlier work (25), all such converts displayed a Wp-restricted form of latent gene expression from the introduced recombinant EBV genome. When we compared these E2KO-converted lines with their parent clones for expression of key B cell differentiation-related genes (Fig. 8), we found that the imposition of Wp-restricted latency did not affect Pax5 protein expression but did lead to a clear reduction in Bcl6 protein in all three E2KO converts. Furthermore, there was a significant upregulation of IRF4 and Blimp1 transcription, which was also accompanied by increased IRF4 protein expression. For comparison, we included E2KO and wild-type EBV converts of the EBV-negative BL30 cell line. In the case of the E2KO convert, Bcl6 protein expression was clearly reduced compared to the parental BL30 line, while the levels of IRF4 and Blimp1 were both markedly increased. In contrast, Bcl6 expression was completely extinguished in the wild-type BL30 convert (which acquires a latency III form of infection and an LCL-like phenotype), while IRF4 was induced to even higher levels.
Fig 8.
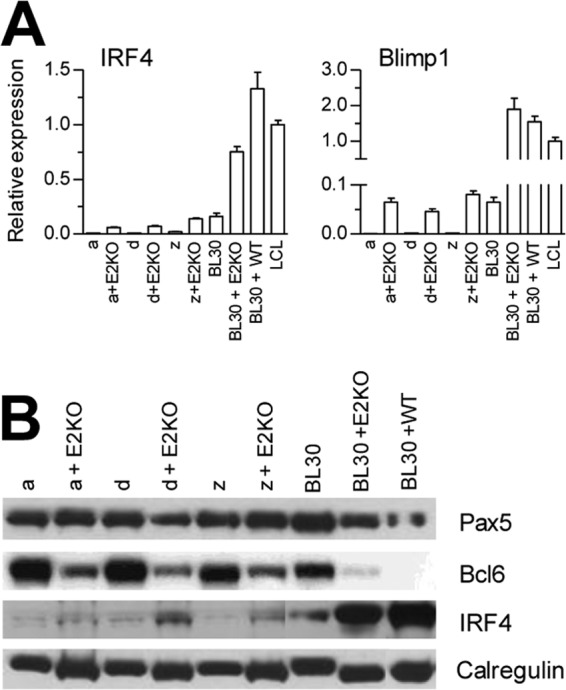
Analysis of Awia-BL clones converted with an EBNA2 KO rEBV. Two latency I (Lat I) Awia-BL clones (a and d) and one EBV-negative Awia-BL clone (z) were stably infected with a recombinant E2KO EBV and compared with uninfected clones. (A) Quantitative RT-PCR analysis of IRF4 and Blimp1 RNA expression. (B) Immunoblotting of Pax5, Bcl6, and IRF4 protein expression; calregulin served as a loading control. EBV-negative BL30 cells and matched E2KO and wild-type EBV converts were included as additional controls.
DISCUSSION
The difficulty of distinguishing between BL and certain cases of DLBCL on purely histologic grounds prompted two landmark studies defining a gene expression signature that was diagnostic of BL (12, 13). However, that work was entirely based on BL presenting in its sporadic (low-incidence, predominantly EBV-negative) form in Europe and North America. We were interested to extend this type of analysis to the tumor in its endemic (high-incidence, EBV-positive) form, particularly since we had identified two types of endemic BL with different patterns of EBV latent gene expression (23, 25). Latency I tumors express just one EBV protein, EBNA1, whereas Wp-restricted tumors express EBNA1, -3A, -3B, and -3C plus the viral Bcl2 homologue BHRF1. In both cases, the presence of EBV provides the tumor cells some protection from apoptotic challenge (26); however, protection is much more marked in Wp-restricted latency, implying that this particular subset of tumors will be less responsive to standard chemotherapy protocols. Since these two types of endemic BL appear to be histologically identical, we investigated whether gene expression profiling might distinguish between them. Here, we report that, while both endemic BLs have gene expression profiles lying within the mBL signature, Wp-restricted tumors form a transcriptionally distinct subset characterized by subtle changes similar to those seen when GC cells initiate differentiation toward a plasma cell phenotype (52). Based on in vitro studies, we argue that the slightly more differentiated phenotype of Wp-restricted BL does not reflect a different cell of origin for this tumor; rather, the changes in gene expression are imposed on the classical mBL signature by the novel Wp-restricted form of virus infection.
Out of necessity, we studied cell lines of endemic BL origin rather than primary tumors. However, in most cases the cell lines had been established in our own laboratory from fresh tumor material and cryopreserved in early passage. While EBV-negative sporadic BL lines tend to be phenotypically stable, latency I BL lines fall into two groups: some are phenotypically stable over multiple passages, and others (including many commonly used in the literature) have switched toward an LCL phenotype with a broadening of latent antigen expression (18, 19). We deliberately selected three stable latency I BL lines and compared them with three lines that had fully switched from Lat I to Lat III within the first 20 in vitro passages. We then compared these with our unique collection of three Wp-restricted lines, all in early passage; these lines are also phenotypically stable and have since retained this pattern of latency for >50 passages.
Unsupervised analysis of data from the limited HGMP gene array showed that the EBV-negative sporadic and both latency I (Lat I) and Wp-restricted endemic BL lines clustered together and, as far as could be tested, displayed expression profiles consistent with the defined mBL phenotype. In contrast, the BL cell lines that had switched to a latency III form of infection showed a quite different profile, with multiple changes (Fig. 3B). Many of the genes upregulated in these Lat III cells are diagnostic of a “B-lymphoblastoid” or “activated B cell” phenotype involving, for example, tumor necrosis factor receptor (TNFR) signaling components, STAT signaling, cell surface adhesion molecules, and antigen processing pathway components (53). Not surprisingly, there are parallels with the expression profiles reported for conventional LCLs and also that seen in a model B cell line when switched from a c-myc-driven (BL-like) to an EBV-driven (LCL-like) growth program (47). Many of these LCL-associated changes have been assigned to the effects of two major effectors of the EBV-induced transformation process, namely, EBNA2 as a transcriptional activator (48, 54, 55) and LMP1 as an activator of the NF-κB pathway (50, 56). It is therefore worth noting that, as the present study moves on to look for more subtle changes distinguishing between latency I and Wp-restricted BL lines, these two forms of infection lack both EBNA2 and LMP1.
Both the HGMP array data on BL cell lines established from different tumors and the Affymetrix data on clones established from the Awia-BL tumor gave a consistent picture. In both cases, gene expression profiling could not distinguish clearly between EBV-negative and latency I BL cells (Fig. 2A and 5B). However, it was possible to distinguish between latency I and Wp-restricted cells (Fig. 3C, 5B, and 6), even though both satisfied the criteria for diagnosis as mBL (Fig. 5A). These differences within the mBL gene signature are therefore subtle compared to the more dramatic changes distinguishing mBL from DLBCL, or latency I from latency III BL cell lines. We were interested to find that, in both types of array (comparing latency I and Wp-restricted cells as BL lines or Awia-BL clones), those subtle changes included genes linked to B cell differentiation status. Focusing on those genes, we confirmed that Wp-restricted BL cells are distinguished by a small but significant increase in the expression of genes such as IRF4 and Blimp1 that are linked with the early stages of GC cell-to-plasma cell transit, often accompanied by a reduction in the expression of genes such as Bcl6 and Pax5 that are eventually suppressed in fully differentiated plasma cells (Fig. 4B and 7).
We have argued in earlier work that the pathogenesis of latency I and Wp-restricted BLs is likely to be subtly different (15). Thus, the first involves a cell which (like most EBV-infected B cells in the body) carries a wild-type transformation-competent EBV genome that is capable of driving the proliferation of a preneoplastic clone; in contrast, the second involves a precursor which carries a rare EBNA2-deletion mutant that is growth transformation deficient. Whether the different stages of differentiation displayed by latency I and Wp-restricted BLs reflect a difference in precursor cell identity is therefore an important issue to resolve. We approached this by deliberately infecting EBV-negative and latency I clones of the Awia-BL cell line with an engineered EBNA2-deletion mutant, a procedure that we have previously shown stably establishes a Wp-restricted form of infection (25). Gene-specific assays showed that this led to a similar upregulation of IRF4 and Blimp1 and downregulation of Bcl6 and Pax5, in the BL target cells (Fig. 8). We therefore conclude that the subtly different phenotype of Wp-restricted (compared to latency I) BL does not reflect its derivation from a more differentiated precursor cell but rather a phenotype that has been imposed upon a common BL precursor by an EBNA2-deleted EBV genome. It remains to be seen what the viral effectors of such a change are, the candidates being the EBNA3A, -3B, and -3C and BHRF1 proteins and/or possibly the BHRF1 region-encoded microRNAs (miRNAs), all of which are expressed in Wp-restricted but not in latency I BLs (23, 24, 57). Of these candidates, one or more of the EBNA3 proteins appear to be the most likely; thus, recent array data in a different system, looking at BL cell lines which express all the EBV latent proteins except for one or more EBNA3 family members, have noted some differences in B cell differentiation phenotype (58). However, we see little overlap between the EBNA3-regulated genes identified in that study and those in the present work (data not shown), perhaps because the former was conducted on BL cells with an EBNA2/LMP1-positive LCL-like phenotype and the latter on the physiologic EBNA2/LMP1-negative BL background.
Regarding the cellular mutations which synergize with deregulated c-myc expression to clinch malignancy, two genomic studies have recently identified critical genetic changes in BL tumor cells (6, 7). Strikingly, both studies reported frequent mutations in the transcription factor TCF3 and its negative regulator ID3. In collaboration with the Staudt laboratory, we recently reported the ID3 and TCF3 mutation status in 10 of 13 BL lines studied in the present work (6). Overall, 8 BL lines had missense or nonsense ID3 mutations, while a single BL line had a TCF3 mutation. While the numbers of cell lines examined in each category were only small, the finding that ID3 is frequently mutated in both latency I and Wp-restricted BL lines is consistent with the view that such changes are common to the pathogenesis of both types of BL tumor. However, further studies are required to fully elucidate the phenotypic consequences of alterations in the ID3/TCF3 pathway in these different BL settings.
The most important conclusion from the present work is that two types of endemic BL, both with gene expression profiles that fit within the mBL-defined boundary, nevertheless do show subtly distinct phenotypes. They can best be distinguished by transcriptional analysis using two marker genes, IRF4 and Blimp1, which are not detectably expressed in latency I tumors but are activated to easily detectable levels in Wp-restricted tumors. We believe that such discrimination is important since, on the basis of in vitro studies, Wp-restricted tumors are rendered much more resistant to various apoptotic inducers, including cytotoxic drugs, than are latency I tumors by virtue of expressing the viral Bcl2 homologue BHRF1 (24, 59, 60). The prediction is that successful treatment of this subset of endemic tumors will require more aggressive chemotherapy, and so a means of identifying such tumors based on their expression of key B cell differentiation genes could have significant clinical benefit.
ACKNOWLEDGMENTS
This work was supported by a Cancer Research UK program grant (C910/A8829) to A.B.R. and A.I.B. and a Kay Kendall Fellowship to G.L.K.
Footnotes
Published ahead of print 26 December 2012
REFERENCES
- 1. Bornkamm GW. 2009. Epstein-Barr virus and the pathogenesis of Burkitt's lymphoma: more questions than answers. Int. J. Cancer 124:1745–1755 [DOI] [PubMed] [Google Scholar]
- 2. Magrath I. 1990. The pathogenesis of Burkitt's lymphoma. Adv. Cancer Res. 55:133–270 [DOI] [PubMed] [Google Scholar]
- 3. Gregory CD, Tursz T, Edwards CF, Tetaud C, Talbot M, Caillou B, Rickinson AB, Lipinski M. 1987. Identification of a subset of normal B cells with a Burkitt's lymphoma (BL)-like phenotype. J. Immunol. 139:313–318 [PubMed] [Google Scholar]
- 4. Dalla-Favera R, Bregni M, Erikson J, Patterson D, Gallo RC, Croce CM. 1982. Human c-myc onc gene is located on the region of chromosome 8 that is translocated in Burkitt lymphoma cells. Proc. Natl. Acad. Sci. U. S. A. 79:7824–7827 [DOI] [PMC free article] [PubMed] [Google Scholar]
- 5. Taub R, Kirsch I, Morton C, Lenoir G, Swan D, Tronick S, Aaronson S, Leder P. 1982. Translocation of the c-myc gene into the immunoglobulin heavy chain locus in human Burkitt lymphoma and murine plasmacytoma cells. Proc. Natl. Acad. Sci. U. S. A. 79:7837–7841 [DOI] [PMC free article] [PubMed] [Google Scholar]
- 6. Schmitz R, Young RM, Ceribelli M, Jhavar S, Xiao W, Zhang M, Wright G, Shaffer AL, Hodson DJ, Buras E, Liu X, Powell J, Yang Y, Xu W, Zhao H, Kohlhammer H, Rosenwald A, Kluin P, Muller-Hermelink HK, Ott G, Gascoyne RD, Connors JM, Rimsza LM, Campo E, Jaffe ES, Delabie J, Smeland EB, Ogwang MD, Reynolds SJ, Fisher RI, Braziel RM, Tubbs RR, Cook JR, Weisenburger DD, Chan WC, Pittaluga S, Wilson W, Waldmann TA, Rowe M, Mbulaiteye SM, Rickinson AB, Staudt LM. 2012. Burkitt lymphoma pathogenesis and therapeutic targets from structural and functional genomics. Nature 490:116–120 [DOI] [PMC free article] [PubMed] [Google Scholar]
- 7. Richter J, Schlesner M, Hoffmann S, Kreuz M, Leich E, Burkhardt B, Rosolowski M, Ammerpohl O, Wagener R, Bernhart SH, Lenze D, Szczepanowski M, Paulsen M, Lipinski S, Russell RB, Adam-Klages S, Apic G, Claviez A, Hasenclever D, Hovestadt V, Hornig N, Korbel JO, Kube D, Langenberger D, Lawerenz C, Lisfeld J, Meyer K, Picelli S, Pischimarov J, Radlwimmer B, Rausch T, Rohde M, Schilhabel M, Scholtysik R, Spang R, Trautmann H, Zenz T, Borkhardt A, Drexler HG, Moller P, Macleod RA, Pott C, Schreiber S, Trumper L, Loeffler M, Stadler PF, Lichter P, Eils R, Kuppers R, Hummel M, Klapper W, Rosenstiel P, Rosenwald A, Brors B, Siebert R. 2012. Recurrent mutation of the ID3 gene in Burkitt lymphoma identified by integrated genome, exome and transcriptome sequencing. Nat. Genet. 44:1316–1320 [DOI] [PubMed] [Google Scholar]
- 8. Polack A, Hortnagel K, Pajic A, Christoph B, Baier B, Falk M, Mautner J, Geltinger C, Bornkamm GW, Kempkes B. 1996. c-myc activation renders proliferation of Epstein-Barr virus (EBV)-transformed cells independent of EBV nuclear antigen 2 and latent membrane protein 1. Proc. Natl. Acad. Sci. U. S. A. 93:10411–10416 [DOI] [PMC free article] [PubMed] [Google Scholar]
- 9. Kovalchuk AL, Qi CF, Torrey TA, Taddesse-Heath L, Feigenbaum L, Park SS, Gerbitz A, Klobeck G, Hoertnagel K, Polack A, Bornkamm GW, Janz S, Morse HC., III 2000. Burkitt lymphoma in the mouse. J. Exp. Med. 192:1183–1190 [DOI] [PMC free article] [PubMed] [Google Scholar]
- 10. Zhu D, Qi CF, Morse HC, III, Janz S, Stevenson FK. 2005. Deregulated expression of the Myc cellular oncogene drives development of mouse “Burkitt-like” lymphomas from naive B cells. Blood 105:2135–2137 [DOI] [PubMed] [Google Scholar]
- 11. Salaverria I, Siebert R. 2011. The gray zone between Burkitt's lymphoma and diffuse large B-cell lymphoma from a genetics perspective. J. Clin. Oncol. 29:1835–1843 [DOI] [PubMed] [Google Scholar]
- 12. Hummel M, Bentink S, Berger H, Klapper W, Wessendorf S, Barth TF, Bernd HW, Cogliatti SB, Dierlamm J, Feller AC, Hansmann ML, Haralambieva E, Harder L, Hasenclever D, Kuhn M, Lenze D, Lichter P, Martin-Subero JI, Moller P, Muller-Hermelink HK, Ott G, Parwaresch RM, Pott C, Rosenwald A, Rosolowski M, Schwaenen C, Sturzenhofecker B, Szczepanowski M, Trautmann H, Wacker HH, Spang R, Loeffler M, Trumper L, Stein H, Siebert R. 2006. A biologic definition of Burkitt's lymphoma from transcriptional and genomic profiling. N. Engl. J. Med. 354:2419–2430 [DOI] [PubMed] [Google Scholar]
- 13. Dave SS, Fu K, Wright GW, Lam LT, Kluin P, Boerma EJ, Greiner TC, Weisenburger DD, Rosenwald A, Ott G, Muller-Hermelink HK, Gascoyne RD, Delabie J, Rimsza LM, Braziel RM, Grogan TM, Campo E, Jaffe ES, Dave BJ, Sanger W, Bast M, Vose JM, Armitage JO, Connors JM, Smeland EB, Kvaloy S, Holte H, Fisher RI, Miller TP, Montserrat E, Wilson WH, Bahl M, Zhao H, Yang L, Powell J, Simon R, Chan WC, Staudt LM. 2006. Molecular diagnosis of Burkitt's lymphoma. N. Engl. J. Med. 354:2431–2442 [DOI] [PubMed] [Google Scholar]
- 14. Piccaluga PP, De Falco G, Kustagi M, Gazzola A, Agostinelli C, Tripodo C, Leucci E, Onnis A, Astolfi A, Sapienza MR, Bellan C, Lazzi S, Tumwine L, Mawanda M, Ogwang M, Calbi V, Formica S, Califano A, Pileri SA, Leoncini L. 2011. Gene expression analysis uncovers similarity and differences among Burkitt lymphoma subtypes. Blood 117:3596–3608 [DOI] [PubMed] [Google Scholar]
- 15. Kelly GL, Rickinson AB. 2007. Burkitt lymphoma: revisiting the pathogenesis of a virus-associated malignancy. Hematology Am. Soc. Hematol. Educ. Program 2007:277–284 [DOI] [PubMed] [Google Scholar]
- 16. Rickinson AB, Kieff E. 2007. Epstein-Barr virus, p 2655–2700 In Knipe DM, Howley PM, Griffin DE, Lamb RA, Martin MA, Roizman B, Straus SE. (ed), Fields virology, 5th ed, vol II Lippincott Williams & Wilkins, Philadelphia, PA [Google Scholar]
- 17. Rowe DT, Rowe M, Evan GI, Wallace LE, Farrell PJ, Rickinson AB. 1986. Restricted expression of EBV latent genes and T-lymphocyte-detected membrane antigen in Burkitt's lymphoma cells. EMBO J. 5:2599–2607 [DOI] [PMC free article] [PubMed] [Google Scholar]
- 18. Rowe M, Rowe DT, Gregory CD, Young LS, Farrell PJ, Rupani H, Rickinson AB. 1987. Differences in B cell growth phenotype reflect novel patterns of Epstein-Barr virus latent gene expression in Burkitt's lymphoma cells. EMBO J. 6:2743–2751 [DOI] [PMC free article] [PubMed] [Google Scholar]
- 19. Rooney CM, Gregory CD, Rowe M, Finerty S, Edwards C, Rupani H, Rickinson AB. 1986. Endemic Burkitt's lymphoma: phenotypic analysis of tumor biopsy cells and of derived tumor cell lines. J. Natl. Cancer Inst. 77:681–687 [DOI] [PubMed] [Google Scholar]
- 20. Sample J, Brooks L, Sample C, Young L, Rowe M, Gregory C, Rickinson A, Kieff E. 1991. Restricted Epstein-Barr virus protein expression in Burkitt lymphoma is due to a different Epstein-Barr nuclear antigen 1 transcriptional initiation site. Proc. Natl. Acad. Sci. U. S. A. 88:6343–6347 [DOI] [PMC free article] [PubMed] [Google Scholar]
- 21. Schaefer BC, Woisetschlaeger M, Strominger JL, Speck SH. 1991. Exclusive expression of Epstein-Barr virus nuclear antigen 1 in Burkitt lymphoma arises from a third promoter, distinct from the promoters used in latently infected lymphocytes. Proc. Natl. Acad. Sci. U. S. A. 88:6550–6554 [DOI] [PMC free article] [PubMed] [Google Scholar]
- 22. Tao Q, Robertson KD, Manns A, Hildesheim A, Ambinder RF. 1998. Epstein-Barr virus (EBV) in endemic Burkitt's lymphoma: molecular analysis of primary tumor tissue. Blood 91:1373–1381 [PubMed] [Google Scholar]
- 23. Kelly G, Bell A, Rickinson A. 2002. Epstein-Barr virus-associated Burkitt lymphomagenesis selects for downregulation of the nuclear antigen EBNA2. Nat. Med. 8:1098–1104 [DOI] [PubMed] [Google Scholar]
- 24. Kelly GL, Long HM, Stylianou J, Thomas WA, Leese A, Bell AI, Bornkamm GW, Mautner J, Rickinson AB, Rowe M. 2009. An Epstein-Barr virus anti-apoptotic protein constitutively expressed in transformed cells and implicated in Burkitt lymphomagenesis: the Wp/BHRF1 link. PLoS Pathog. 5:e1000341 doi:10.1371/journal.ppat.1000341 [DOI] [PMC free article] [PubMed] [Google Scholar]
- 25. Kelly GL, Milner AE, Tierney RJ, Croom-Carter DS, Altmann M, Hammerschmidt W, Bell AI, Rickinson AB. 2005. Epstein-Barr virus nuclear antigen 2 (EBNA2) gene deletion is consistently linked with EBNA3A, -3B, and -3C expression in Burkitt's lymphoma cells and with increased resistance to apoptosis. J. Virol. 79:10709–10717 [DOI] [PMC free article] [PubMed] [Google Scholar]
- 26. Kelly GL, Milner AE, Baldwin GS, Bell AI, Rickinson AB. 2006. Three restricted forms of Epstein-Barr virus latency counteracting apoptosis in c-myc-expressing Burkitt lymphoma cells. Proc. Natl. Acad. Sci. U. S. A. 103:14935–14940 [DOI] [PMC free article] [PubMed] [Google Scholar]
- 27. Calender A, Billaud M, Aubry JP, Banchereau J, Vuillaume M, Lenoir GM. 1987. Epstein-Barr virus (EBV) induces expression of B-cell activation markers on in vitro infection of EBV-negative B-lymphoma cells. Proc. Natl. Acad. Sci. U. S. A. 84:8060–8064 [DOI] [PMC free article] [PubMed] [Google Scholar]
- 28. Habeshaw G, Yao QY, Bell AI, Morton D, Rickinson AB. 1999. Epstein-Barr virus nuclear antigen 1 sequences in endemic and sporadic Burkitt's lymphoma reflect virus strains prevalent in different geographic areas. J. Virol. 73:965–975 [DOI] [PMC free article] [PubMed] [Google Scholar]
- 29. Altmann M, Hammerschmidt W. 2005. Epstein-Barr virus provides a new paradigm: a requirement for the immediate inhibition of apoptosis. PLoS Biol. 3:e404 doi:10.1371/journal.pbio.0030404 [DOI] [PMC free article] [PubMed] [Google Scholar]
- 30. Tierney R, Nagra J, Hutchings I, Shannon-Lowe C, Altmann M, Hammerschmidt W, Rickinson A, Bell A. 2007. Epstein-Barr virus exploits BSAP/Pax5 to achieve the B-cell specificity of its growth-transforming program. J. Virol. 81:10092–10100 [DOI] [PMC free article] [PubMed] [Google Scholar]
- 31. Grasser FA, Murray PG, Kremmer E, Klein K, Remberger K, Feiden W, Reynolds G, Niedobitek G, Young LS, Mueller-Lantzsch N. 1994. Monoclonal antibodies directed against the Epstein-Barr virus-encoded nuclear antigen 1 (EBNA1): immunohistologic detection of EBNA1 in the malignant cells of Hodgkin's disease. Blood 84:3792–3798 [PubMed] [Google Scholar]
- 32. Maunders MJ, Petti L, Rowe M. 1994. Precipitation of the Epstein-Barr virus protein EBNA-2 by an EBNA-3C-specific monoclonal antibody. J. Gen. Virol. 75:769–778 [DOI] [PubMed] [Google Scholar]
- 33. Rowe M, Evans HS, Young LS, Hennessy K, Kieff E, Rickinson AB. 1987. Monoclonal antibodies to the latent membrane protein of Epstein-Barr virus reveal heterogeneity of the protein and inducible expression in virus-transformed cells. J. Gen. Virol. 68:1575–1586 [DOI] [PubMed] [Google Scholar]
- 34. Lopes AR, Kellam P, Das A, Dunn C, Kwan A, Turner J, Peppa D, Gilson RJ, Gehring A, Bertoletti A, Maini MK. 2008. Bim-mediated deletion of antigen-specific CD8 T cells in patients unable to control HBV infection. J. Clin. Invest. 118:1835–1845 [DOI] [PMC free article] [PubMed] [Google Scholar]
- 35. Ritchie ME, Silver J, Oshlack A, Holmes M, Diyagama D, Holloway A, Smyth GK. 2007. A comparison of background correction methods for two-colour microarrays. Bioinformatics 23:2700–2707 [DOI] [PubMed] [Google Scholar]
- 36. Smyth GK, Speed T. 2003. Normalization of cDNA microarray data. Methods 31:265–273 [DOI] [PubMed] [Google Scholar]
- 37. Saeed AI, Sharov V, White J, Li J, Liang W, Bhagabati N, Braisted J, Klapa M, Currier T, Thiagarajan M, Sturn A, Snuffin M, Rezantsev A, Popov D, Ryltsov A, Kostukovich E, Borisovsky I, Liu Z, Vinsavich A, Trush V, Quackenbush J. 2003. TM4: a free, open-source system for microarray data management and analysis. Biotechniques 34:374–378 [DOI] [PubMed] [Google Scholar]
- 38. Saldanha AJ. 2004. Java Treeview—extensible visualization of microarray data. Bioinformatics 20:3246–3248 [DOI] [PubMed] [Google Scholar]
- 39. Storey JD, Tibshirani R. 2003. Statistical methods for identifying differentially expressed genes in DNA microarrays. Methods Mol. Biol. 224:149–157 [DOI] [PubMed] [Google Scholar]
- 40. Tusher VG, Tibshirani R, Chu G. 2001. Significance analysis of microarrays applied to the ionizing radiation response. Proc. Natl. Acad. Sci. U. S. A. 98:5116–5121 [DOI] [PMC free article] [PubMed] [Google Scholar]
- 41. Bolstad BM, Irizarry RA, Astrand M, Speed TP. 2003. A comparison of normalization methods for high density oligonucleotide array data based on variance and bias. Bioinformatics 19:185–193 [DOI] [PubMed] [Google Scholar]
- 42. Irizarry RA, Bolstad BM, Collin F, Cope LM, Hobbs B, Speed TP. 2003. Summaries of Affymetrix GeneChip probe level data. Nucleic Acids Res. 31:e15 doi:10.1093/nar/gng015 [DOI] [PMC free article] [PubMed] [Google Scholar]
- 43. Bentink S, Wessendorf S, Schwaenen C, Rosolowski M, Klapper W, Rosenwald A, Ott G, Banham AH, Berger H, Feller AC, Hansmann ML, Hasenclever D, Hummel M, Lenze D, Moller P, Stuerzenhofecker B, Loeffler M, Truemper L, Stein H, Siebert R, Spang R. 2008. Pathway activation patterns in diffuse large B-cell lymphomas. Leukemia 22:1746–1754 [DOI] [PubMed] [Google Scholar]
- 44. Beier CP, Kumar P, Meyer K, Leukel P, Bruttel V, Aschenbrenner I, Riemenschneider MJ, Fragoulis A, Rummele P, Lamszus K, Schulz JB, Weis J, Bogdahn U, Wischhusen J, Hau P, Spang R, Beier D. 2012. The cancer stem cell subtype determines immune infiltration of glioblastoma. Stem Cells Dev. 21:2735–2761 [DOI] [PMC free article] [PubMed] [Google Scholar]
- 45. Gregory CD, Rowe M, Rickinson AB. 1990. Different Epstein-Barr virus-B cell interactions in phenotypically distinct clones of a Burkitt's lymphoma cell line. J. Gen. Virol. 71:1481–1495 [DOI] [PubMed] [Google Scholar]
- 46. Pearson GR, Luka J, Petti L, Sample J, Birkenbach M, Braun D, Kieff E. 1987. Identification of an Epstein-Barr virus early gene encoding a second component of the restricted early antigen complex. Virology 160:151–161 [DOI] [PubMed] [Google Scholar]
- 47. Faumont N, Durand-Panteix S, Schlee M, Gromminger S, Schuhmacher M, Holzel M, Laux G, Mailhammer R, Rosenwald A, Staudt LM, Bornkamm GW, Feuillard J. 2009. c-Myc and Rel/NF-kappaB are the two master transcriptional systems activated in the latency III program of Epstein-Barr virus-immortalized B cells. J. Virol. 83:5014–5027 [DOI] [PMC free article] [PubMed] [Google Scholar]
- 48. Maier S, Staffler G, Hartmann A, Hock J, Henning K, Grabusic K, Mailhammer R, Hoffmann R, Wilmanns M, Lang R, Mages J, Kempkes B. 2006. Cellular target genes of Epstein-Barr virus nuclear antigen 2. J. Virol. 80:9761–9771 [DOI] [PMC free article] [PubMed] [Google Scholar]
- 49. Spender LC, Cornish GH, Sullivan A, Farrell PJ. 2002. Expression of transcription factor AML-2 (RUNX3, CBF(alpha)-3) is induced by Epstein-Barr virus EBNA-2 and correlates with the B-cell activation phenotype. J. Virol. 76:4919–4927 [DOI] [PMC free article] [PubMed] [Google Scholar]
- 50. Vockerodt M, Morgan SL, Kuo M, Wei W, Chukwuma MB, Arrand JR, Kube D, Gordon J, Young LS, Woodman CB, Murray PG. 2008. The Epstein-Barr virus oncoprotein, latent membrane protein-1, reprograms germinal centre B cells towards a Hodgkin's Reed-Sternberg-like phenotype. J. Pathol. 216:83–92 [DOI] [PubMed] [Google Scholar]
- 51. Dennis G, Jr, Sherman BT, Hosack DA, Yang J, Gao W, Lane HC, Lempicki RA. 2003. DAVID: database for annotation, visualization, and integrated discovery. Genome Biol. 4:P3 doi:10.1186/gb-2003-4-5-p3 [PubMed] [Google Scholar]
- 52. Brune V, Tiacci E, Pfeil I, Doring C, Eckerle S, van Noesel CJ, Klapper W, Falini B, von Heydebreck A, Metzler D, Brauninger A, Hansmann ML, Kuppers R. 2008. Origin and pathogenesis of nodular lymphocyte-predominant Hodgkin lymphoma as revealed by global gene expression analysis. J. Exp. Med. 205:2251–2268 [DOI] [PMC free article] [PubMed] [Google Scholar]
- 53. Carter KL, Cahir-McFarland E, Kieff E. 2002. Epstein-Barr virus-induced changes in B-lymphocyte gene expression. J. Virol. 76:10427–10436 [DOI] [PMC free article] [PubMed] [Google Scholar]
- 54. Zhao B, Maruo S, Cooper A, Chase MR, Johannsen E, Kieff E, Cahir-McFarland E. 2006. RNAs induced by Epstein-Barr virus nuclear antigen 2 in lymphoblastoid cell lines. Proc. Natl. Acad. Sci. U. S. A. 103:1900–1905 [DOI] [PMC free article] [PubMed] [Google Scholar]
- 55. Schlee M, Krug T, Gires O, Zeidler R, Hammerschmidt W, Mailhammer R, Laux G, Sauer G, Lovric J, Bornkamm GW. 2004. Identification of Epstein-Barr virus (EBV) nuclear antigen 2 (EBNA2) target proteins by proteome analysis: activation of EBNA2 in conditionally immortalized B cells reflects early events after infection of primary B cells by EBV. J. Virol. 78:3941–3952 [DOI] [PMC free article] [PubMed] [Google Scholar]
- 56. Cahir McFarland ED, Izumi KM, Mosialos G. 1999. Epstein-Barr virus transformation: involvement of latent membrane protein 1-mediated activation of NF-kappaB. Oncogene 18:6959–6964 [DOI] [PubMed] [Google Scholar]
- 57. Amoroso R, Fitzsimmons L, Thomas WA, Kelly GL, Rowe M, Bell AI. 2011. Quantitative studies of Epstein-Barr virus-encoded microRNAs provide novel insights into their regulation. J. Virol. 85:996–1010 [DOI] [PMC free article] [PubMed] [Google Scholar]
- 58. White RE, Groves IJ, Turro E, Yee J, Kremmer E, Allday MJ. 2010. Extensive co-operation between the Epstein-Barr virus EBNA3 proteins in the manipulation of host gene expression and epigenetic chromatin modification. PLoS One 5:e13979 doi:10.1371/journal.pone.0013979 [DOI] [PMC free article] [PubMed] [Google Scholar]
- 59. Anderton E, Yee J, Smith P, Crook T, White RE, Allday MJ. 2008. Two Epstein-Barr virus (EBV) oncoproteins cooperate to repress expression of the proapoptotic tumour-suppressor Bim: clues to the pathogenesis of Burkitt's lymphoma. Oncogene 27:421–433 [DOI] [PubMed] [Google Scholar]
- 60. Yee J, White RE, Anderton E, Allday MJ. 2011. Latent Epstein-Barr virus can inhibit apoptosis in B cells by blocking the induction of NOXA expression. PLoS One 6:e28506 doi:10.1371/journal.pone.0028506 [DOI] [PMC free article] [PubMed] [Google Scholar]