Abstract
Here we describe a study of the feasibility of lipid and phospholipid (PL) profiling using matrix assisted laser desorption/ionization (MALDI) Fourier transform mass spectrometry (FTMS) for two different applications. In this work PL profiles of different mammalian tissues as well as those of whole cell organisms were examined. In particular, comparative analysis of lipid and PL profiles of tissues from mice fed different diets was done and, in another application, MALDI FTMS was used to analyze PL profiles of genetically modified Saccharomyces cerevisiae. Computational sorting of the observed ions was done in order to group the lipid and PL ions from complex MALDI spectra. The PL profiles of liver tissues from mice fed different diets showed a cross correlation coefficient of 0.2580, indicating significant dissimilarity, and revealed more than 30 significantly different peaks at the 99.9% confidence level. Histogram plots derived from the spectra of wild type and genetically modified yeast resulted in a cross correlation coefficient 0.8941 showing greater similarity, but still revealing a number of significantly different peaks. Based on these results, it appears possible to use MALDI FTMS to identify PLs as potential biomarkers for metabolic processes in whole cells and tissues.
Keywords: Matrix assisted laser desorption/ionization mass spectrometry (MALDI), Fourier transform mass spectrometry (FTMS), Saccharomyces cerevisiae, Yeast transcription factor Met4, High fat diet
Introduction
Analysis of phospholipids (PLs) by matrix assisted laser desorption/ionization (MALDI) was first described by Harvey [1] over a decade ago. Around the same time, Marshall et al. reported initial experiments for MALDI Fourier transform mass spectrometry (FTMS) of a number of biological PLs [2]. Since then, MALDI FTMS also has been successfully used for analysis of di-acyl PL profiles of whole cell organisms [3, 4] and mammalian tissues [5]. Lipid compositions as main components [6] of cell membranes are vital for the physiological functionality of biological cells. Cellular signaling, metabolic processes, structural functions and regulatory roles are some of the processes where PLs are important [7, 8]. As demonstrated in 2006, MALDI FTMS allows rapid and precise monitoring of PL profiles of different types of mouse tissues (brain, heart and liver) [5].
This study aimed to apply the proposed approaches [3–5] to real biological problems in an optimized manner. Two different biological problems were selected, (1) monitoring the impact of high fat diets on PL profiles of Mus musculus (house mouse) and (2) evaluating the role of the yeast transcriptional regulator Met4 in PL homeostasis. Here the exceptional potential of MALDI high-resolution mass spectrometry (> 104) for rapid, automated metabolite screens of complex biological samples is shown. This will allow researchers to achieve broader understanding of metabolic and signaling processes involving PLs.
Experimental Procedure
Reagents
The MALDI matrix used was 99% purity 2,5-dihydroxybenzoic acid (DHB) (Alfa Aesar, Shore Road, Heysham, Lancaster). Methanol was HPLC grade (EMC Chemical Inc., Gibbstown, NJ). Purified water was obtained from a Mill-Q gradient system (Millipore Corporation, Genay Cedex, France). The AIN-93G high fat diet was obtained from Dyets Inc., Bethlehem, PA. Trichloroacetic acid (TCA) was purchased from VWR, West Chester, PA.
Animal Care and Tissue Isolation
All animals were reared at Vanderbilt University. The protocols used in this study were performed and approved by the Institution for Animal Care and Use Committee of Vanderbilt University. Low density lipoprotein receptor LDLR−/− mice on a C57BL/6J background were placed on high fat diets (39% calories from fat and 0.5% cholesterol) supplemented with 6% olive oil or 6% fish oil for 12 weeks. The fish oil in the mouse diet contained 140 mg eicosapentaenoic acid (EPA) and 95 mg docosahexaenoic acid (DHA) per gram of oil. The liver was removed, weighed and snap frozen before doing a MALDI FTMS analysis. Further experimental details are published elsewhere [9]. As matrix for homogenizing the frozen liver tissues, 1 M DHB in methanol/water (80:20, by volume) with 7.5% TCA was used.
Saccharomyces cerevisiae Growth Conditions
To analyze PL profiles of yeast, both wild type (wt) and mutant were grown in YEPD medium (1% yeast extract, 2% Bacto Peptone, 2% glucose, 0.04 g/L adenine sulfate, 0.04 g/L uracil) at 30 °C to mid-log phase (OD600 = 1). Yeast cells were harvested by filtration and washed in water. Washed cells were lysed in isopropanol with glass beads for 90 s at setting 4.5 in FastPrep™ FP120. Cell debris was separated by centrifugation (10 min 13,000 g). The supernatant was stored in dark tubes under nitrogen and analyzed within 2 days by MALDI FTMS. Yeast mutants lacking the MET4 gene were generated by deleting the entire open reading frame using a PCR-based strategy [10]. For MALDI FTMS a saturated solution of DHB in methanol/Mill-Q water (70:30 by volume) was used as matrix.
Instrumentation and Data Analysis
MALDI FTMS analysis was performed using the positive ion mode of a 9.4 Tesla FTMS (IonSpec/Varian, Lake Forest, CA) with an external ion source and a Nd-YAG laser operating at λ = 355 nm. PL assignments were accomplished via an optimized Windows version 3.8.28 of a lipid database and search program, utilizing a previously published assignment algorithm [4].
Results and Discussion
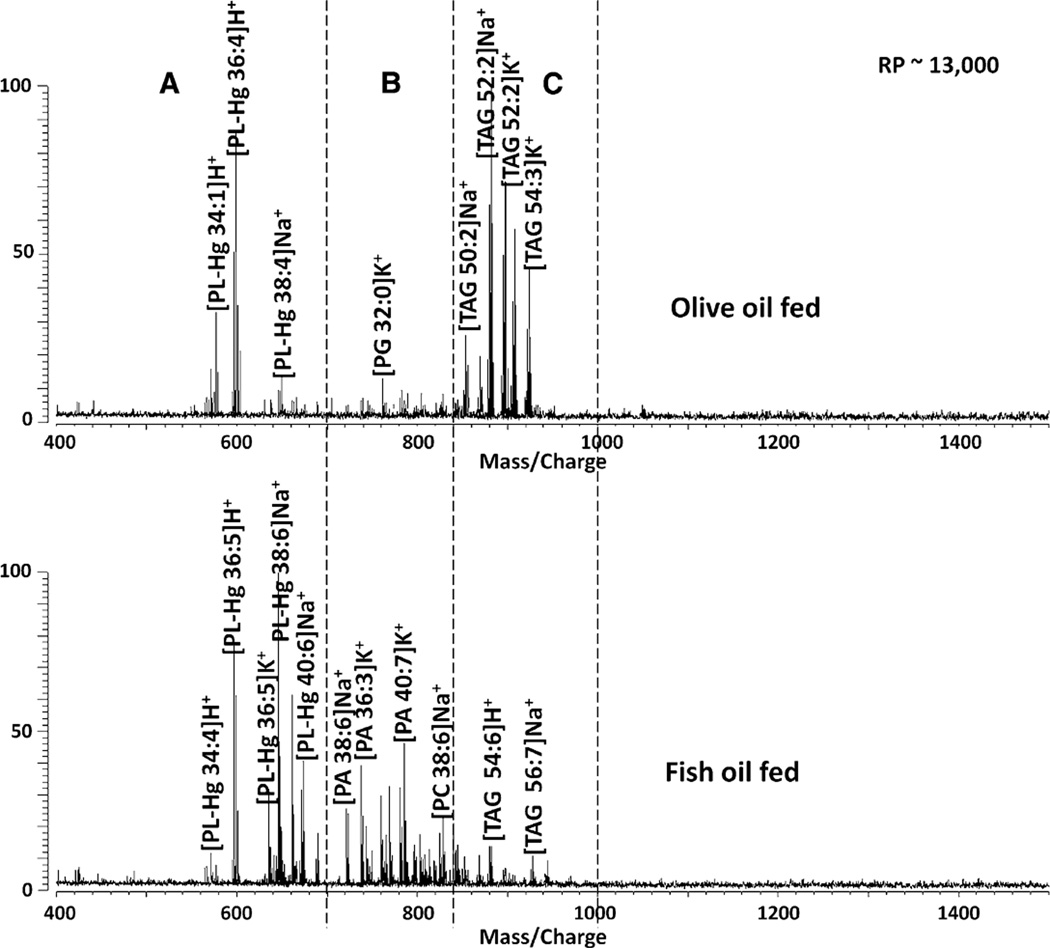
Following the methodology described above, reproducible MALDI FTMS spectra were observed. Figure 1 shows spectra of liver tissues from mice fed with different high fat diets. The spectra observed can be divided into three regions based on m/z values. PL fragment ions (PL-Hg) are found in the low mass region (550–700 m/z); PL ions such as those from phosphatidic acid (PA), phosphatidylethanolamine (PE), and phosphatidylcholine (PC) are found in the middle mass region (700–850 m/z); and the triacylglyceride ions (TAG) appear in the high mass region (850–1,000 m/z).
Fig. 1.
Representative spectra of liver tissues from mice fed high fat diets supplemented with 6% olive oil (top) and 6% fish oil (bottom). The spectra are divided into three regions a phospholipid fragments (PL-Hg) b PA phospholipids, PC, PE, etc., and c TAG triacylglycerides
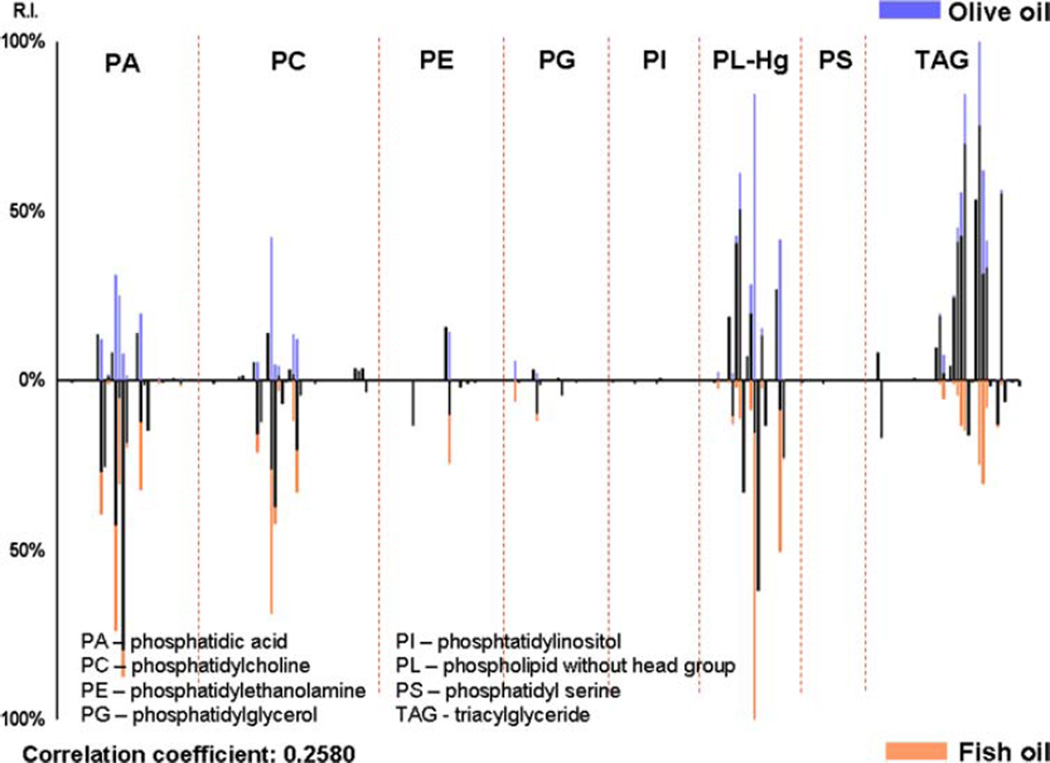
Triacylglycerides are of importance in this comparison because they are the major components of edible oils [11, 12]. In 2006 Lay et al. [11] observed that with the use of MALDI time-of-flight (TOF) mass spectrometry that edible oils can be identified through their TAG content. It is evident from the spectra shown in Fig. 1 that liver tissues from mice fed with the olive oil diet contain more TAG compared with liver tissues from mice fed with the fish oil diet. On the contrary, liver samples from fish oil fed mice have elevated PL contents compared with those from olive oil fed mice. The PLs and TAG content of the samples were binned together and a cross correlation calculation was done. The histogram correlation (Fig. 2) between the two samples is 0.2580 showing the expected low correlation. Based on these results, mice fed fish oil have lower TAG content than mice fed olive oil.
Fig. 2.
Histogram plot of lipid and phospholipids found in liver tissues from mice fed a high fat diet supplemented with 6% olive oil (top) and fish oil (bottom)
The results obtained in this study using MALDI FTMS are comparable to those obtained by Saraswathi et al. [9] using fatty acid methyl ester (FAME) analysis, wherein it was observed that the total TAG concentration in the liver for mice fed with the olive oil diet (74 mg/g tissue) is greater than that found in livers of fish oil fed mice (59 mg/g tissue). Although the biological importance of increased PLs in mice fed fish oil is not clear, our study demonstrates that MALDI FTMS can be used to better characterize the PL species in biological samples. Several previous studies have analyzed the relationship between fish oil diets and hypertriglyceridemia [13, 14] and all of their results reveal that dietary fish oil supplements reduce plasma TAG levels. The differences in their TAG content may be attributed to the fish oil’s ability to reduce hepatic triacylglyceride synthesis [9, 15]. Hypertriglyceridemia and hepatic steatosis have been linked to their contribution to cardiovascular diseases and diabetes [16, 17].
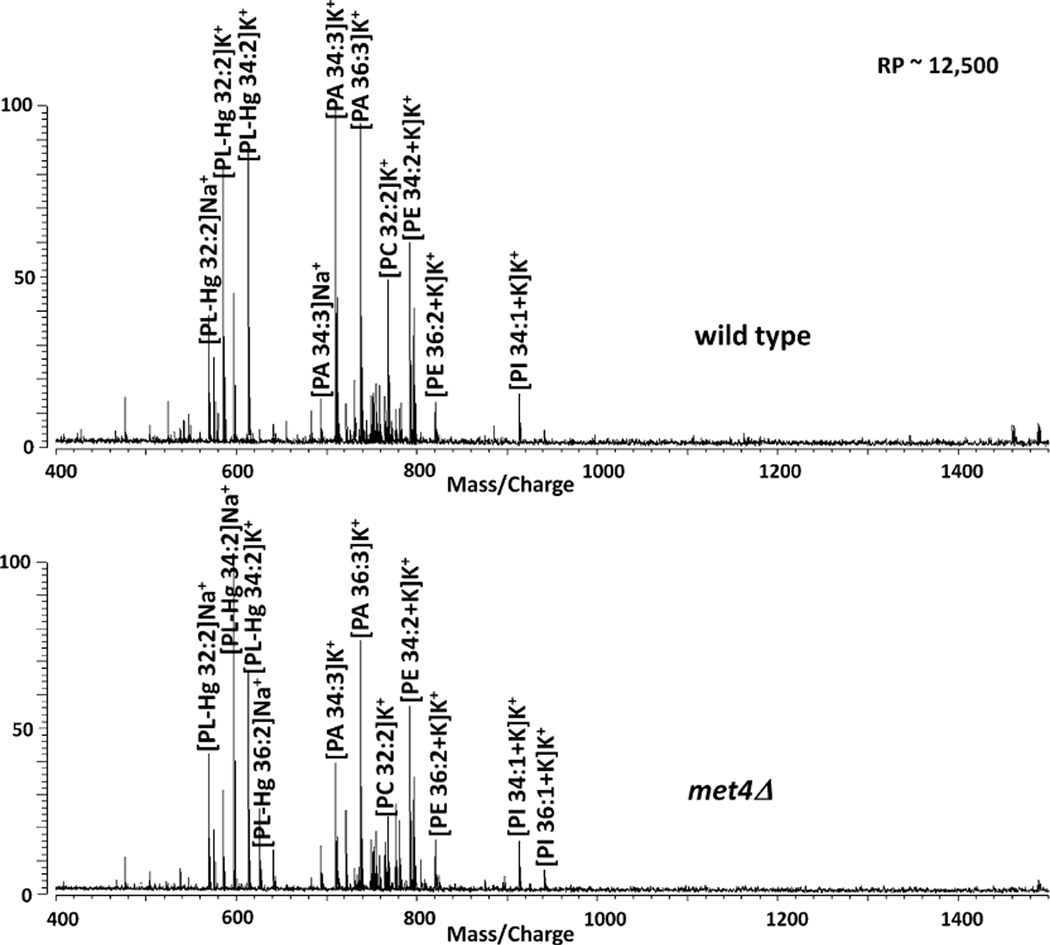
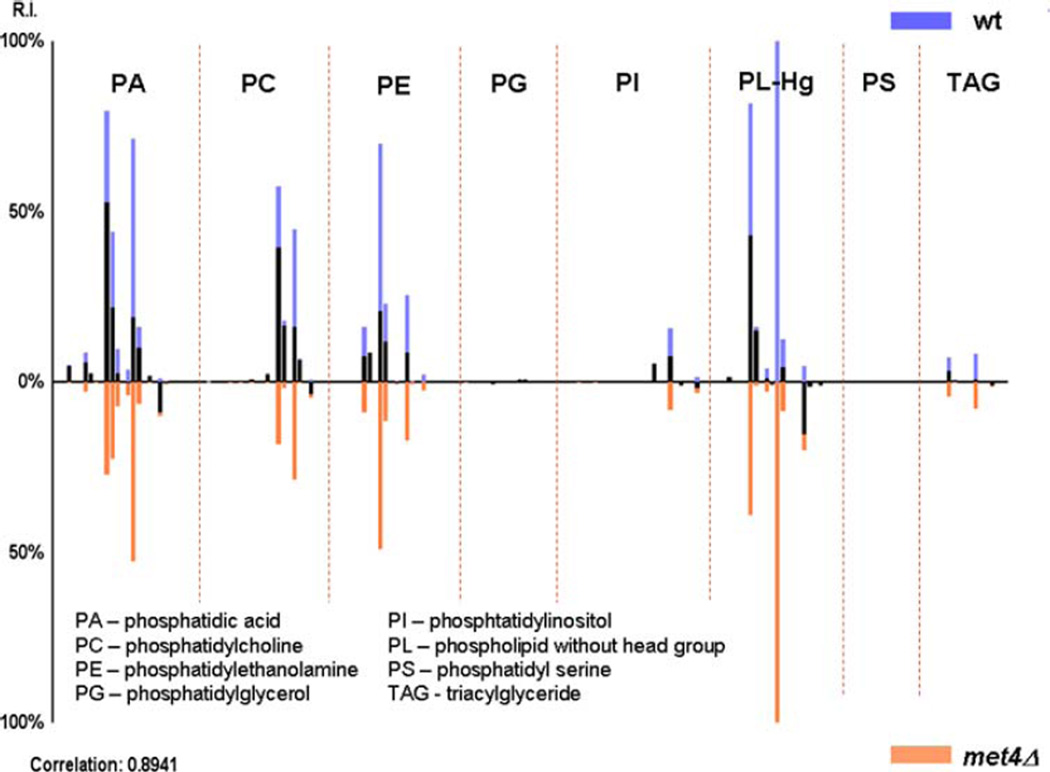
We also applied our PL profiling strategy to analyze the role of the Met4 transcription factor in PL homeostasis. The activity of Met4 is tightly regulated by the ubiquitin ligase SCFMet30 [18]. Met30 the substrate specificity factor within this ubiquitin ligase has previously been linked to PL homeostasis based on genetic studies [18]. We were therefore interested in testing whether Met4 is involved in lipid homeostasis, given that its regulator was connected to lipid metabolism. Met4 is best known as a master regulator that coordinates the expression of genes involved in the synthesis of sulfur containing amino acids which include methionine, cysteine, and S-adenosylmethionine. Met4 can also induce a cell cycle arrest and thus links metabolic pathways with cell proliferation to protect cellular integrity when key metabolites are suboptimal [19, 20]. To investigate a potential role of Met4 in lipid metabolism we lysed wild type cells (wt) and met4Δ mutants, which lack the entire MET4 gene and analyzed the lysates by MALDI FTMS. Representative spectra of the two strains are shown in Fig. 3. Although the most abundant ions are PL fragments, this does not necessary mean that these are the most important ions. Based on the spectra, it is not evident which PLs differ, however when histogram plots (Fig. 4) derived from the spectra were cross-correlated, the correlation coefficient was 0.8941. Yeast lysates that lack the Met4 transcription factor (met4Δ) contain lower PL compared with lysates from wt samples based on the relative abundances of the binned PL peaks. This shows that inactivation of Met4 in yeast cells reduces the presence of PA, PC and PE. These results clearly link the transcriptional activator Met4 to lipid homeostasis in yeast. Since Met4 coordinates metabolic pathways with cell proliferation it is tempting to speculate that the Met4 pathway coordinates lipid homeostasis and cell cycle progression. Further studies will be required to dissect these functions and the role of other components in the Met4 system, but this analysis demonstrates that application of the MALDI FTMS strategy to a genetic model system is effective in linking gene function to lipid homeostasis.
Fig. 3.
Representative MALDI FTMS spectra of wild type (wt) S. cerevisiae (top) and met4Δ mutant
Fig. 4.
Histogram plot of lipid and phospholipids found in wild type (top) and met4Δ mutant (bottom) S. cerevisiae lysates
To summarize, the use of MALDI FTMS has been demonstrated as a tool for PL profiling both in microorganisms with different genetic components as well as in mammalian tissues from mice fed different high fat diets. Our data have implications in understanding the cellular pathways involved in the biosynthesis and/or transport of PLs.
Acknowledgments
The authors are grateful for financial support from the Arkansas Biosciences Institute and NSF grants CHE-00-91868 and CHE-99-82045. P.K. acknowledges support from NIH-GM-66164. The authors appreciate discussions with R. M. O’Brien and support from the Arkansas Statewide Mass Spectrometry Facility.
Contributor Information
S. Mariccor A. B. Batoy, Department of Chemistry and Biochemistry, University of Arkansas, Fayetteville, AR, USA
Sabine Borgmann, Institute for Analytical Science (ISAS), Bunsen-Kirchhoff-Strasse 11, 44139 Dortmund, Germany.
Karin Flick, Department of Biological Chemistry, University of California, Irvine, CA, USA.
Josephine Griffith, Department of Chemistry and Biochemistry, University of Arkansas, Fayetteville, AR, USA.
Jeffrey J. Jones, Applied Proteomics Inc., Glendale, CA, USA
Viswanathan Saraswathi, Department of Molecular Physiology and Biophysics, Vanderbilt University, Nashville, TN, USA.
Alyssa H. Hasty, Department of Molecular Physiology and Biophysics, Vanderbilt University, Nashville, TN, USA
Peter Kaiser, Department of Biological Chemistry, University of California, Irvine, CA, USA.
Charles L. Wilkins, Email: cwilkins@uark.edu, Department of Chemistry and Biochemistry, University of Arkansas, Fayetteville, AR, USA.
References
- 1.Harvey DJ. Matrix-assisted laser desorption/ionization mass spectrometry of phospholipids. J Mass Spectrom. 1995;30:1333–1346. [Google Scholar]
- 2.Marto JA, White FM, Seldomddge S, Marshal AQ. Structural characterization of phospholipids by matrix-assisted laser desorption/ionization Fourier transform ion cyclotron resonance mass spectrometry. Anal Chem. 1995;67:3979–3984. doi: 10.1021/ac00117a025. [DOI] [PubMed] [Google Scholar]
- 3.Jones JJ, Stump MJ, Fleming RC, Lay JO, Wilkins CL. Strategies and data analysis techniques for lipid and phospholipid chemistry elucidation by intact cell MALDI-FTMS. J Am Soc Mass Spectrom. 2004;15:1665–1674. doi: 10.1016/j.jasms.2004.08.007. [DOI] [PubMed] [Google Scholar]
- 4.Jones JJ, Batoy SMAB, Wilkins CL. A comprehensive and comparative analysis for MALDI FTMS lipid and phospholipid profiles from biological samples. Comput Biol Chem. 2005;29:294–302. doi: 10.1016/j.compbiolchem.2005.06.001. [DOI] [PubMed] [Google Scholar]
- 5.Jones JJ, Borgmann S, Wilkins CL, O’Brien RM. Characterizing the phospholipid profiles in mammalian tissues by MALDI FTMS. Anal Chem. 2006;78:3062–3071. doi: 10.1021/ac0600858. [DOI] [PubMed] [Google Scholar]
- 6.Berg JM, Tymoczko JL, Stryer L. Biochemistry. New York: W·H. Freeman; 2006. [Google Scholar]
- 7.Gurr MI, Harwood JL, Frayn KN. Lipid biochemistry—an introduction. Oxford: Blackwell; 2002. [Google Scholar]
- 8.Ratledge C, Wilkinson SG. An overview of microbial lipids. In: Ratledge C, Wilkinson SG, editors. Microbial lipids. London: Academic Press; 1988. pp. 1–79. [Google Scholar]
- 9.Saraswathi V, Gao L, Morrow JD, Chait A, Niswender KD, Hasty AH. Fish oil increases cholesterol storage in white adipose tissue with concomitant decreases in inflammation, hepatic steatosis, and atherosclerosis in mice. J Nutr. 2007;137:1776–1782. doi: 10.1093/jn/137.7.1776. [DOI] [PubMed] [Google Scholar]
- 10.Wach A, Brachat A, Pohlmann R, Philippsen P. New heterologous modules for classical or PCR-based gene disruptions in Saccharomyces cerevisiae. Yeast. 1994;10:1793–1808. doi: 10.1002/yea.320101310. [DOI] [PubMed] [Google Scholar]
- 11.Lay JO, Liyanage R, Durham B, Brooks J. Rapid characterization of edible oils by direct matrix assisted laser desorption/ionization time-of-flight mass spectrometry analysis using triacylglycerols. Rapid Commun Mass Spectrom. 2006;20:952–958. doi: 10.1002/rcm.2394. [DOI] [PubMed] [Google Scholar]
- 12.Gidden J, Liyanage R, Durham B, Lay JO. Reducing fragmentation observed in the matrix-assisted laser desorption/ionization time-of-flight mass spectrometric analysis of triacylglycerols in vegetable oils. Rapid Commun Mass Spectrom. 2007;21:1951–1957. doi: 10.1002/rcm.3041. [DOI] [PubMed] [Google Scholar]
- 13.Levy E, Thibault L, Turgeon J, Roy C, Gurbindo C, Lepage G, Godard M, Rivard G, Seidman E. Beneficial effects of fish-oil supplements on lipids, lipoproteins, and lipoprotein lipase in patients with glycogen storage disease type I. Am J Clin Nutr. 1993;57:922–929. doi: 10.1093/ajcn/57.6.922. [DOI] [PubMed] [Google Scholar]
- 14.Jonkers IJAM, Smelt AHM, Princen HMG, Kuipers F, Romijn JA, Boverhof R, Masclee AAM, Stellaard F. Fish oil increases bile acid synthesis in male patients with hypertriglyceridemia. J Nutr. 2006;136:987–991. doi: 10.1093/jn/136.4.987. [DOI] [PubMed] [Google Scholar]
- 15.Davidson MH. Mechanisms for the hypotriglyceridemic effect of marine omega-3 fatty acids. Am J Cardiol. 2006;98:27i–33i. doi: 10.1016/j.amjcard.2005.12.024. [DOI] [PubMed] [Google Scholar]
- 16.Citkowitz E. Hypertriglyceridemia. In: Gambert SR, et al., editors. Hypertriglyceridemia, eMedicine.com. 2005. [Google Scholar]
- 17.Coenen KR, Hasty AH. Obesity potentiates development of fatty liver and insulin resistance, but not atherosclerosis, in high-fat diet-fed agouti LDLR-deficient mice. Am J Physiol Endocrinol Metab. 2002;293:E492–E499. doi: 10.1152/ajpendo.00171.2007. [DOI] [PubMed] [Google Scholar]
- 18.Schumacher MM, Choi JY, Voelker DR. Phosphatidylserine transport to the mitochondria is regulated by ubiquitination. J Biol Chem. 2002;277:51033–51042. doi: 10.1074/jbc.M205301200. [DOI] [PubMed] [Google Scholar]
- 19.Thomas D, Surdin-Kerjan Y. Metabolism of sulfur amino acids in Saccharomyces cerevisiae. Microbiol Mol Biol Rev. 1997;61:503–532. doi: 10.1128/mmbr.61.4.503-532.1997. [DOI] [PMC free article] [PubMed] [Google Scholar]
- 20.Kaiser P, Su N-Y, Yen JL, Ouni I, Flick K. The yeast ubiquitin ligase SCFMet30: connecting environment and intracellular conditions to cell division. Cell Division. 2006;1:16–23. doi: 10.1186/1747-1028-1-16. [DOI] [PMC free article] [PubMed] [Google Scholar]


