

Abstract
Iron deficiency anemia affects many pregnant women and young infants worldwide. The health impact is significant, given iron’s known role in many body functions, including oxidative and lipid metabolism, protein synthesis and brain neurochemistry. The following research determined if 1H NMR spectroscopy-based metabolomic analysis of cerebrospinal fluid (CSF) could detect the adverse influence of early life iron deficiency on the central nervous system. Using a controlled dietary model in 43 infant primates, distinct differences were found in spectra acquired at 600 MHz from the CSF of anemic monkeys. Three metabolite ratios, citrate/pyruvate, citrate/lactate and pyruvate/glutamine ratios, differed significantly in the iron deficient infant and then normalized following the consumption of dietary iron and improvement of clinical indices of anemia in the heme compartment. This distinctive metabolomic profile associated with anemia in the young infant indicates that CSF can be employed to track the neurological effects of iron deficiency and benefits of iron supplementation.
Keywords: metabolomics, cerebrospinal fluid, anemia, iron deficiency, infancy, primate
Introduction
Iron deficiency (ID) and iron deficiency anemia (IDA) during infancy are associated with impaired neurodevelopment [1–3]. Iron is critical for energy metabolism, myelination and neurotransmitter synthesis in the central nervous system (CNS) [4]. Alterations in each of these processes may be responsible for the neurodevelopmental and behavioral deficits that occur during and after early life ID. In addition, tissue hypoxia due to decreased oxygen delivery may amplify the adverse effects, particularly on energy metabolism and myelination [5,6]. Many neurodevelopmental deficits due to IDA in infancy appear to be refractory to iron rehabilitation, both in humans and animals [7,8], unless iron supplementation is started early [9]. Thus, early diagnosis and treatment of IDA has significant public health relevance.
Hematological indices and iron measures in the blood provide only an indirect approximation of the iron status of the CNS. Contrary to the traditional view that iron is prioritized to the brain, the red blood cells have preferential access to available iron [10,11]. Thus, there is an urgent need for refining better biomarkers of CNS iron status, for example, via cerebrospinal fluid (CSF), for understanding and detecting the neurological ramifications of IDA. There is a particular need to dissociate the CNS and peripheral effects, because tissue iron deficiency, including in the brain, predates anemia in young infants [10,11]. The purpose of the present study was to determine whether metabolomic analysis of CSF using high field 1H NMR spectroscopy is able to detect changes during IDA and after its resolution in infant monkeys.
CSF metabolomics is a powerful technique for assessing the underlying brain pathology in diverse neurological diseases in humans [12–14] and animal models [15,16]. However, its usefulness as a diagnostic tool has yet to be tested in the context of IDA. In rodent models, high-field in vivo 1H NMR spectroscopy has been successfully employed for assessing the neurological effects of early life ID and the response to treatment [17–21]. The method allows simultaneous determination of multiple metabolites indexing energy metabolism, neuronal and glial integrity, neurotransmitters and myelin synthesis in different brain regions [17–21].
We used a well-characterized and diet-controlled model of IDA in infant monkeys [22]. IDA in this model is induced by the imbalance between dietary iron intake and the needs for iron to sustain growth. Many rapidly growing infant monkeys relying on maternal milk as the sole dietary iron source become anemic between 4 and 8 months after birth. The IDA then resolves by one year of age as growth rates slow and the weaned infant is now exclusively consuming solid foods with more bioavailable iron [23]. A similar etiology of ID is also seen in human infants with rapid postnatal growth [24], particularly in those born with low iron stores [25]. Previous studies using this primate model of IDA have demonstrated altered CSF levels of several proteins using proteomic methods and abnormal levels of monoamine neurotransmitters (e.g., dopamine and norepinephrine) via HPLC analysis [26–28]. These changes in critical proteins may also be indexed by changes in CNS metabolism that would reflect a more generalized disturbance in brain function in IDA. The objectives of our study were to determine: 1) whether IDA during infancy and its resolution affect the metabolite profile of CSF and thus, 2) if CSF metabolomics is a sensitive indicator of the CNS changes in IDA.
Materials and Methods
Subjects
Blood and CSF were analyzed from infant rhesus monkeys (Macaca mulatta) born and reared in a large primate colony at the University of Wisconsin. Based on their hematological status, 29 infants were identified as being either iron-sufficient (IS) or IDA at either 4 months or 7–9 months (henceforth denoted as 7 months) of age. Criteria for IDA was MCV <60 fL, with a Hgb <110 g/L [22, 26]. CSF metabolite profiles were analyzed for 13 IS (n=6 at 4 months and n=7 at 7 months) and 16 IDA infants (n=7 at 4 months and n=9 at 7 months). In addition, CSF specimens from 14 monkeys were examined at one year of age, including 7 that were IS for the entire first year of life, and 7 that had been IDA at either 4 or 7 months of age, but now had normal hematology and iron status (labeled as Former IDA). The institutional Animal Care and Use Committee approved the experimental protocols and specimen collection.
Housing and Diet
All infants were mother-reared using controlled husbandry and diet conditions. Specimens from younger monkeys were obtained while they were still nursing and housed with the mother. By 7–8 months of age, all infants were weaned, living in small peer groups of 4–8 animals and independently consuming solid foods. They remained in these stable social groups through one year of age when the CSF was obtained at the oldest age point. Environmental conditions were standardized. The light/dark cycle was 14/10 with lights on at 0600; temperature was maintained at 21°C, and the primary feeding occurred at 0700. The monkeys were fed a fixed allotment of commercial biscuits containing 180 mg of iron/kg diet (Purina 5L1Q, PMI Nutrition International, St. Louis, MO), which is known to predispose 30–40% of infant monkeys to become anemic during the period of rapid postnatal growth [23,29,30]. The nutrient composition of the diet is shown in Table 1.
Table 1.
Ingredient composition as well as mineral and vitamin concentrations of the diet for this comparison of cerebrospinal fluid metabolomics in iron sufficient and iron deficient anemic infant monkeys.
| Ingredient | Minerals | Vitamins | |||
|---|---|---|---|---|---|
| Protein (%) | 15.6 | Iron (mg/kg) | 180 | A (IU/kg) | 20.0 |
| Carbohydrate (%) | 68.9 | Zinc (mg/kg) | 114 | B12 (mg/kg) | 0.022 |
| Fat (%) | 6.0 | Copper (mg/kg) | 20 | C (mg/kg) | 500 |
| Ash (%) | 5.2 | ||||
| Fiber (crude) (%) | 4.6 | ||||
Specimen Collection
Blood samples (1–3 mL) were collected via femoral venipuncture for hematology and iron panels in order to designate the infants as being either IS or IDA. Representative results for the mean corpuscular volumes (MCV) and hemoglobin (Hgb) are shown to support our designation of the two groups. Additional confirmation was obtained by assessing hematocrit and Zinc protoporphyrin/Hgb (ZnPP/Hgb) levels (data not shown). All monkeys were otherwise healthy.
CSF specimens (1–2 mL) were obtained by cervical puncture following acute ketamine sedation (15 mg/kg, intramuscular). The specimen was collected into a sterile syringe with a 25 g needle; immediately placed in a sealed vial on ice, then spun in a refrigerated centrifuge at 2000 rpm. Only the upper portion of the specimen was used in order to ensure the pristine status of the CSF without cellular or tissue matter. Specimens with any visible trace of blood or hemolysis were not analyzed. Following sample collection, the monkeys were administered ketoprofen (5 mg/kg, intramuscular) for post-procedural analgesia. All CSF specimens were collected between 0930 and 1100 on the same morning as the blood specimens used to categorize the monkeys as IS or IDA. All CSF samples were kept frozen at −60°C until analysis.
Metabolomic Analysis of CSF
NMR spectroscopy
Approximately 1 mL of frozen CSF was lyophilized overnight and resuspended in 0.5 mL of D2O at pH 7.2 ± 0.04. 1H NMR spectra were acquired within 24 hours using a 600 MHz Varian Unity INOVA spectrometer at 25 C. A pulse-acquire sequence was utilized under fully relaxed conditions (60 pulse, calibrated in each sample, repetition time TR = 11.4 s, spectral width 8000 Hz, acquisition time 1.9 s) [31]. Residual water resonance was suppressed by low-power presaturation for 1.5 s during the relaxation delay. The number of transients ranged from 256–512.
Metabolite quantification
The contribution of individual metabolites to the spectra was quantified using an automated deconvolution program (LCModel) [32] as described before [33] with the exception of the following parameters: VITRO = T (to specify in vitro data analysis), PPMSHF = 0.1 (to impose a starting referencing shift), NRATIO = 0 (to eliminate the default soft constraints included in LCModel for brain tissue) and DKNTMN(2) = 99 (to impose a flat baseline). The lactate (Lac), acetate (Ace) and citrate (Cit) resonances were used for LCModel line-shape analysis, and Ace was used for referencing. In addition, zero and first order phases of each spectrum were manually determined and starting values for DEGZER and DEGPPM were entered [34]. Small degrees of freedom were left to both zero and first order phase by setting SDDEGZ = 1 and SDDEGP = 0.5. The following 14 metabolites were included in the basis set: Ace, alanine (Ala), -hydroxybutyrate (bHB), Cit, creatine (Cr), creatinine (Crn), glucose (Glc), glutamine (Gln), glutamate (Glu), Lac, myo-inositol (myo-Ins), pyruvate (Pyr), scyllo-inositol (scyllo-Ins), and serine (Ser). The model metabolite spectra were generated based on previously reported chemical shifts and coupling constants [35] with minor adjustments of chemical shifts to accommodate the in vitro sample conditions. Metabolites quantified with Cramer-Rao lower bounds (CRLB, estimated error of quantification) > 50% were classified as not detected. Only bHB and scyllo-Ins were not detected in the majority of samples based on these criteria.
Statistical Analysis
Differences between IS and IDA animals were examined using ANOVA. The comparison of 4- and 7- month old anemic infants was conducted with a 2-factor model, considering Age and Iron Status as between factors. Alpha was set at <0.05 for attaining statistical significance. Post hoc evaluations employed the Scheffe test when needed for probing significant interactions. The results for the yearling animals were examined in separate one way ANOVAs to determine if the Former IDA monkeys were still significantly different than infants that had been continuously IS across the first year. Associations between hematological status and CSF metabolite ratios were examined with the Pearson’s correlation statistic.
Results
The hematological assessments permitted a non-overlapping delineation of IS and IDA monkeys at both 4- and 7-months of age (Fig 1). IDA infants had lower MCV and Hgb values and met diagnostic criteria for clinical anemia, and their blood profiles were below all IS animals that had to have hematological values in the normal range (MCV, F[1,25]=118.7, p<0.001 and Hgb, F[1,25]=61.89, p<0.001). As anticipated, the hematological values for yearling monkeys confirmed that none were still ID. At this older age, the MCV and Hgb levels did not differ between IS and the Former IDA animals (Fig 1).
Fig. 1.
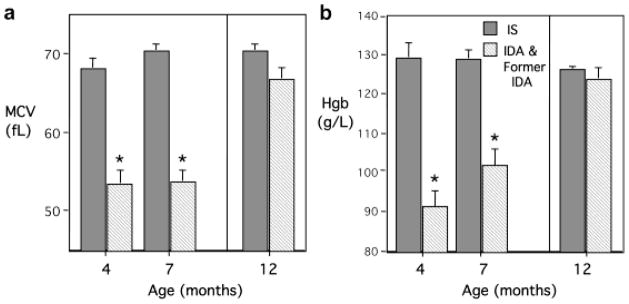
Mean Corpuscular Volumes (MCV) (a) and Hemoglobin (Hgb) (b) for infant rhesus monkeys used for cerebrospinal fluid metabolomic profiling at 4, 7 and 12 months of age. Monkeys were designated as being iron-deficient anemic (IDA) based on diagnostic criteria of MCV< 60 fL and Hgb <110 g/L at 4 months (n=7) or 7 months (n=9) (diagonal striped bars). They were compared with age-matched (n=6 at 4 months and n=7 at 7 months) monkeys that were iron-sufficient (IS) (solid bars). Designation of Former IDA yearlings was based on previously identifying 7 infants as being IDA at 4 months (n=2) or 7 months (n=5) of age. They were compared with 7 yearlings determined to be continuously IS across the first year of life. *p<0.05 vs. IS at corresponding age.
Representative NMR spectra from IS and IDA monkeys are shown in Fig 2. The figure demonstrates the spectral quality achieved and several metabolites relevant to iron biology. A total of 12 compounds, Ace, Ala, Cit, Cr, Crn, Glc, Gln, Glu, Lac, myo-Ins, Pyr, and Ser could be quantified in >95% of samples. Visual inspection suggested there was increased Pyr and Lac, and decreased Cit and Gln peaks in the spectra from the IDA monkey, relative to the IS monkey (Fig 2). Hence, Cit/Pyr, Cit/Lac, Pyr/Gln, Cit/Gln and Lac/Pyr ratios were analyzed.
Fig. 2.
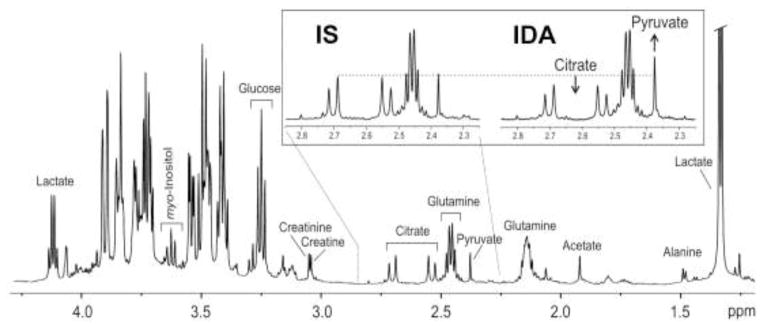
Typical metabolite peaks in cerebrospinal fluid in 4-month old monkeys. Representative spectra are shown from one iron sufficient (IS) animal and one with iron deficiency anemic (IDA).
Three metabolite ratios were significantly shifted in the CSF from IDA infants relative to IS infants (Fig 3). The Cit/Pyr and Cit/Lac ratios were lower in the IDA infants, reduced similarly at both 4 and 7 months of age (Cit/Pyr, F[1,25]=4.7, p<0.045, and Cit/Lac, F[1,25]=4.87, p<0.037). In addition, the Pyr/Gln ratio was higher in the IDA infants (F[1,25]=7.96, p<0.01). The magnitude of this shift in Pyr/Gln ratio was greater at 4 months than at 7 months of age (p<0.05). Age also influenced the Cit/Gln ratio (F[1,25]=21.35. p<0.0001), but Iron Status did not affect these maturational changes. Finally, neither Age nor Iron Status had a main effect on Lac/Pyr ratio.
Fig. 3.

Mean (+SE) Citrate/Pyruvate (Cit/Pyr) (a), Citrate/Lactate (Cit/Lac) (b), Pyruvate/Glutamine (Pyr/Gln) (c) and Citrate/Glutamine (d) ratios determined in the cerebrospinal fluid from iron sufficient (IS) (solid bars), iron deficient anemic (IDA) and formerly IDA infants (diagonal striped bars). Anemic infants at both 4 and 7 months of age had significantly reduced Cit/Pyr and Cit/Lac ratios, and increased Pyr/Gln ratio (*p<0.05). By one year of age, all three ratios had normalized in the Former IDA monkeys and did not differ from the IS animals. There were maturational changes in Cit/Gln ratio (p<0.05), but IDA did not have an effect on this ratio.
No iron-related differences in CSF metabolite ratios were evident in the yearling monkeys when comparing Former IDA with continuously IS monkeys (see Fig 3). Other than some age-related changes in CSF metabolites, the restoration of the hematological indices was associated with a normal CSF metabolite profile at one year. The strength of the association with low and normal Hgb was tested further by examining CSF metabolite ratios for the entire set of animals. Hgb levels were significantly correlated with the Cit/Pyr (r=0.40, p<0.01), Cit/Lac (r=0.32, p<0.04) and Pyr/Gln (r=0.53, p<0.001) ratios. A representative scatter plot is portrayed in Fig 4, illustrating that lower Hgb levels, especially below a threshold value of 110 g/L, were associated with decreased Cit/Pyr and increased Pyr/Gln ratios. A categorical analysis of these metabolite ratios with respect to the clinically relevant Hgb cutoffs of <110 g/L and >125 g/L, indicated that the Cit/Pyr and Pyr/Gln ratios in the high and low Hgb ranges differed significantly (see this categorical partitioning of values in Fig 4)
Fig. 4.
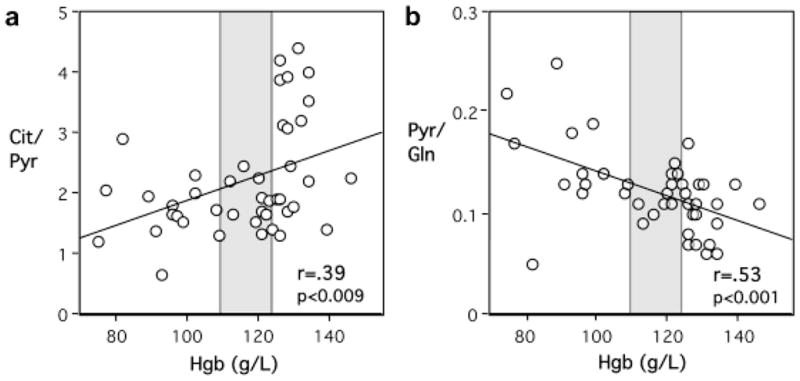
Correlation between Hemoglobin (Hgb) values and Citrate/Pyruvate (Cit/Pyr) (a) and Pyruvate/Glutamine (Pyr/Gln) (b) ratios in the cerebrospinal fluid across the entire set of 43 paired specimens. There are 42 data points in Panel b due to the superimposition of data from two, 4-month-old IDA animals with identical Hgb (102 g/L) and Pyr/Gln ratio (1.4) values. Low Hgb levels, especially below the diagnostic threshold of 110 g/L, were associated with reduced Cit/Pyr ratio and increased Pyr/Gln ratio. Shaded region demarcates low (<110 g/L) and high (>125 g/L) Hgb levels.
Discussion
This study is the first to investigate the effects of IDA and its resolution on CSF metabolomics in infant monkeys. IDA was associated with alterations in three CSF metabolite ratios, which corrected with age following the infant’s consumption of additional dietary iron in the solid food. There was close relationship between the hematological indices and metabolite ratios, indicating that the deficient iron in the periphery had also affected the bioenergetics of the CNS. Collectively, the findings indicate that IDA during infancy can alter CSF metabolomics for an extended period of time and support the urgency of initiating therapeutic interventions in children. Currently, most pediatricians in the United States do not screen for anemia until one year of age [36], which means that some infants have been ID for many months before receiving supplements.
Over the last 20 years, the diagnostic value of metabolomic profiling has been documented for several CNS disorders, including multiple sclerosis and cerebrovascular disease [12–14]. The present study demonstrates that as a novel assessment strategy, CSF metabolomics offers useful biomarkers of the CNS sequelae during IDA. During the period of anemia, the Cit/Pyr and Cit/Lac ratios were decreased, and Pyr/Gln ratio was increased in the IDA infant. The percent decreases in Cit/Pyr (26% and 22%) and Cit/Lac (18% and 22%) ratios at 4 and 7 months were comparable. However, the percent increase in Pyr/Gln ratio was greater at 4 months (60%) than at 7 months (9%). A parsimonious explanation may that brain iron was more severely taxed in infants already anemic by 4 months of age, and that weaning from the mother and consumption of iron-rich solid foods had initiated some improvement in the older anemic infant. Thus, increased Pyr/Gln ratio at 4 months could serve as a sensitive marker of the pressure on body iron stores at the younger age. Conversely, the sustained decrease in Cit/Pyr and Cit/Lac ratios from 4 through 7 months captures the more prolonged impact of IDA on brain energetics over several months. Whether Pyr/Gln ratio was also increased during the pre-anemic stage of ID is not known, but would be important to know for refining preventive supplementation strategies with iron-fortified formulas and food. Tissue iron deficiency, including in the brain, likely precedes the presentation of frank anemia as detected by currently employed diagnostic tests of blood.
The altered metabolite ratios in CSF suggest a general effect of IDA on brain energetics and metabolism, although we know from neurochemistry studies of the rodent brain that there is some regional and tissue specificity to the effects of IDA on these metabolites [37,38]. The ratio changes reflect increased Pyr and Lac and/or decreased Cit and Gln in the IDA state. Collectively, they suggest suppressed tricarboxylic acid (TCA) cycle activity and increased glycolysis. All four enzymes in the mitochondrial electron transport chain contain iron and their levels are decreased in ID [4,39]. Glycolysis becomes the predominant source of energy under these conditions in yeast, plants, mammalian cancer cells and non-CNS tissues, such as the skeletal muscle, and is considered an adaptation [40–43]. The altered CSF metabolite ratios indicate similar homeostatic shifts in regulatory set points and neuronal energetics in the CNS of IDA infants.
Among the TCA cycle enzymes, only aconitase and succinate dehydrogenase are iron-dependent. However, the activities of citrate synthase and isocitrate dehydrogenase, enzymes that mediate the TCA cycle reaction immediately proximal and distal, respectively, to the step involving aconitase also may be suppressed in ID [44], despite not having iron in their structure. Decreased Cit/Pyr and Cit/Lac, and increased Pyr/Gln ratios in the IDA group would be consistent with this interpretation. Indeed, isocitrate dehydrogenase is decreased 20% in the adult rat brain during IDA [45] although citrate synthase is not [46]. However, the effects are likely to be different in the immature brain, where IDA is associated with brain tissue ID and lower cytochrome levels [17,39], unlike the mature brain [4,47]. Moreover, the hypoxia associated with IDA is likely to suppress citrate synthase activity during development [5,6].
Suppressed TCA cycle activity may also be responsible for the increased Pyr/Gln ratio by leading to decreased Glu and Gln production in the anemic infant monkey. Glu and Gln production is coupled to the TCA cycle activity at the -ketoglutarate step [48]. Moreover, glutamate dehydrogenase, the enzyme responsible for Glu production from -ketoglutarate is decreased in IDA [45]. An additional mechanism for decreased Gln is defective glial maturation in IDA. Decreased glial fibrillary acidic protein in the CSF of formerly IDA monkeys supports this possibility and links our metabolomic results to previous information discovered through the proteomic approach [26].
A decreased Cit/Lac ratio suggests that there may be increased cerebral glucose uptake and Lac production in IDA. Glucose uptake and its conversion to Lac are enhanced in the non-CNS tissues during ID [42,43,49]. A selective 70–100% increase in glucose transport across the blood-brain-barrier (BBB) has also been reported during IDA in adult rats [50]. Although the fate of the transported glucose is not known, the statistical trend for a 13% increase in lactate dehydrogenase, the enzyme responsible for Lac production, in the brain of adult rats with IDA [46], suggests that similar to the non-CNS tissues, anaerobic glycolysis may the predominant pathway of glucose utilization in the brain, which would account for increased Lac and Pyr in the CSF during IDA.
Although these marked metabolite changes were evident only during the period of anemia, it should be reiterated that other, more sustained alterations in neurochemistry and protein synthesis have been found in this primate model [26,28]. For example, lower levels of prostaglandin H2D isomerase and increased levels of amyloid beta were found in the CSF, both during and after anemia [28]. Two iron transport proteins, transferrin and divalent metal transporter, remain upregulated for months in the CSF of anemic infants, which has been interpreted as a continued effort by the CNS to acquire iron across the BBB [51]. Similarly, at one year of age, formerly IDA monkeys had higher CSF levels of dopamine and lower levels of norepinephrine [27]. Thus, it is possible that subtle metabolite changes in CNS tissue continue to be evinced by the older infants, but were below the detection threshold of the NMR analysis of CSF. A multimodal assessment, combining proteomics and metabolomics would certainly provide the most comprehensive information [52].
One limitation of our study is lack of information on metabolite concentrations in the plasma at the time of CSF collection. Hence, we do not know yet whether the metabolite changes in CSF reflect concurrent metabolic alterations in the hematological compartment or index more discrete CNS-specific events. Another limitation was the absence of an external standard for quantifying absolute metabolite concentrations in CSF, which would have permitted us to analyze specific metabolites, instead of relying on the analytic strategy of comparing the primary spectral peaks as metabolite ratios.
In summary, IDA altered the CSF metabolomic profile of the infant monkey. Given that IDA is the most prevalent micronutrient deficiency worldwide, impacting up to 70–90% of children in some developing countries, the implications for population health are significant. One major consequence of early life ID is brain dysfunction. Unfortunately, there are no accepted, noninvasive means for evaluating brain iron, nor ways to calibrate the neural effects with respect to standard peripheral blood markers such as Hgb. Our study linking CSF metabolite ratios with Hgb support such a relationship and indicates that CSF metabolomics may be a useful biomarker on its own. At a minimum, these metabolite changes are evident at or below the threshold of a peripheral Hgb of 110 g/L, the standard definition of anemia. The translational relevance is that allowing Hgb to decline further in children before initiating treatment may place the brain at risk. In lieu of direct in vivo NMR spectroscopy of the infant brain, CSF metabolomics offers useful biomarkers of the CNS changes occurring in IDA. With additional refinement, it can be employed to track the response to preventive iron supplements and therapeutic treatments in anemic human infants.
Acknowledgments
This research was supported in part by awards from the National Institute of Health/National Institute of Child Health and Development (R01 HD057064, P01 HD39386) and a Grand Challenges Explorations award from the Bill and Melinda Gates Foundation (Opp1046203). We are grateful to Dr. Stephen Provencher for assistance with LC Model analysis of CSF spectra.
Footnotes
Conflict of Interest
The authors declare that they have no conflict of interest.
References
- 1.Lozoff B, Beard J, Connor J, Barbara F, Georgieff M, Schallert T. Long-lasting neural and behavioral effects of iron deficiency in infancy. Nutr Rev. 2006;64 (5 Pt 2):S34–43. doi: 10.1301/nr.2006.may.S34-S43. [DOI] [PMC free article] [PubMed] [Google Scholar]
- 2.Georgieff MK. Long-term brain and behavioral consequences of early iron deficiency. Nutr Rev. 2011;69(Suppl 1):S43–48. doi: 10.1111/j.1753-4887.2011.00432.x. [DOI] [PMC free article] [PubMed] [Google Scholar]
- 3.Beard JL, Felt B, Schallert T, Burhans M, Connor JR, Georgieff MK. Moderate iron deficiency in infancy: biology and behavior in young rats. Behav Brain Res. 2006;170 (2):224–232. doi: 10.1016/j.bbr.2006.02.024. [DOI] [PubMed] [Google Scholar]
- 4.Dallman PR. Biochemical basis for the manifestations of iron deficiency. Ann Rev Nutr. 1986;6:13–40. doi: 10.1146/annurev.nu.06.070186.000305. [DOI] [PubMed] [Google Scholar]
- 5.Lai JC, White BK, Buerstatte CR, Haddad GG, Novotny EJ, Jr, Behar KL. Chronic hypoxia in development selectively alters the activities of key enzymes of glucose oxidative metabolism in brain regions. Neurochem Res. 2003;28 (6):933–940. doi: 10.1023/a:1023235712524. [DOI] [PubMed] [Google Scholar]
- 6.Raman L, Tkac I, Ennis K, Georgieff MK, Gruetter R, Rao R. In vivo effect of chronic hypoxia on the neurochemical profile of the developing rat hippocampus. Brain Res Dev Brain Res. 2005;156 (2):202–209. doi: 10.1016/j.devbrainres.2005.02.013. [DOI] [PubMed] [Google Scholar]
- 7.Unger EL, Hurst AR, Georgieff MK, Schallert T, Rao R, Connor JR, Kaciroti N, Lozoff B, Felt B. Behavior and monoamine deficits in prenatal and perinatal iron deficiency are not corrected by early postnatal moderate-iron or high-iron diets in rats. J Nutr. 2012 doi: 10.3945/jn.112.162198. (in press) [DOI] [PMC free article] [PubMed] [Google Scholar]
- 8.Lukowski AF, Koss M, Burden MJ, Jonides J, Nelson CA, Kaciroti N, Jimenez E, Lozoff B. Iron deficiency in infancy and neurocognitive functioning at 19 years: evidence of long-term deficits in executive function and recognition memory. Nutr Neurosci. 2010;13 (2):54–70. doi: 10.1179/147683010X12611460763689. [DOI] [PMC free article] [PubMed] [Google Scholar]
- 9.Beard JL, Unger EL, Bianco LE, Paul T, Rundle SE, Jones BC. Early postnatal iron repletion overcomes lasting effects of gestational iron deficiency in rats. J Nutr. 2007;137 (5):1176–1182. doi: 10.1093/jn/137.5.1176. [DOI] [PubMed] [Google Scholar]
- 10.Petry CD, Eaton MA, Wobken JD, Mills MM, Johnson DE, Georgieff MK. Iron deficiency of liver, heart, and brain in newborn infants of diabetic mothers. J Pediatr. 1992;121 (1):109–114. doi: 10.1016/s0022-3476(05)82554-5. [DOI] [PubMed] [Google Scholar]
- 11.Guiang SF, Georgieff MK, Lambert DJ, Schmidt RL, Widness JA. Intravenous iron supplementation effect on tissue iron and hemoproteins in chronically phlebotomized lambs. Am J Physiol. 1997;273 (6 Pt 2):R2124–2131. doi: 10.1152/ajpregu.1997.273.6.R2124. [DOI] [PubMed] [Google Scholar]
- 12.Nagashima H, Morio Y, Meshitsuka S, Yamane K, Nanjo Y, Teshima R. High-resolution nuclear magnetic resonance spectroscopic study of metabolites in the cerebrospinal fluid of patients with cervical myelopathy and lumbar radiculopathy. Eur Spine J. 2010;19 (8):1363–1368. doi: 10.1007/s00586-010-1453-3. [DOI] [PMC free article] [PubMed] [Google Scholar]
- 13.Locasale JW, Melman T, Song S, Yang X, Swanson KD, Cantley LC, Wong ET, Asara JM. Metabolomics of human cerebrospinal fluid identifies signatures of malignant glioma. Mol Cell Proteomics. 2012;11 (6):M111–014688. doi: 10.1074/mcp.M111.014688. [DOI] [PMC free article] [PubMed] [Google Scholar]
- 14.Sinclair AJ, Viant MR, Ball AK, Burdon MA, Walker EA, Stewart PM, Rauz S, Young SP. NMR-based metabolomic analysis of cerebrospinal fluid and serum in neurological diseases--a diagnostic tool? NMR in Biomed. 2010;23 (2):123–132. doi: 10.1002/nbm.1428. [DOI] [PubMed] [Google Scholar]
- 15.Noga MJ, Dane A, Shi S, Attali A, van Aken H, Suidgeest E, Tuinstra T, Muilwijk B, Coulier L, Luider T, Reijmers TH, Vreeken RJ, Hankemeier T. Metabolomics of cerebrospinal fluid reveals changes in the central nervous system metabolism in a rat model of multiple sclerosis. Metabolomics. 2012;8 (2):253–263. doi: 10.1007/s11306-011-0306-3. [DOI] [PMC free article] [PubMed] [Google Scholar]
- 16.Verwaest KA, Vu TN, Laukens K, Clemens LE, Nguyen HP, Van Gasse B, Martins JC, Van Der Linden A, Dommisse R. (1)H NMR based metabolomics of CSF and blood serum: a metabolic profile for a transgenic rat model of Huntington disease. Biochim Biophys Acta. 2011;1812 (11):1371–1379. doi: 10.1016/j.bbadis.2011.08.001. [DOI] [PubMed] [Google Scholar]
- 17.Rao R, Tkac I, Townsend EL, Gruetter R, Georgieff MK. Perinatal iron deficiency alters the neurochemical profile of the developing rat hippocampus. J Nutr. 2003;133 (10):3215–3221. doi: 10.1093/jn/133.10.3215. [DOI] [PubMed] [Google Scholar]
- 18.Rao R, Tkac I, Schmidt AT, Georgieff MK. Fetal and neonatal iron deficiency causes volume loss and alters the neurochemical profile of the adult rat hippocampus. Nutr Neurosci. 2011;14 (2):59–65. doi: 10.1179/1476830511Y.0000000001. [DOI] [PMC free article] [PubMed] [Google Scholar]
- 19.Carlson ES, Fretham SJB, Unger E, O’Connor M, Petryk A, Schallert T, Rao R, Tkac I, Georgieff MK. Hippocampus specific iron deficiency alters competition and cooperation between developing memory systems. J Neurodevelop Disord. 2010;2:133–143. doi: 10.1007/s11689-010-9049-0. [DOI] [PMC free article] [PubMed] [Google Scholar]
- 20.Ward KL, Tkac I, Jing Y, Felt B, Beard J, Connor J, Schallert T, Georgieff MK, Rao R. Gestational and lactational iron deficiency alters the developing striatal metabolome and associated behaviors in young rats. J Nutr. 2007;137 (4):1043–1049. doi: 10.1093/jn/137.4.1043. [DOI] [PMC free article] [PubMed] [Google Scholar]
- 21.Rao R, Tkac I, Unger EL, Ennis K, Hurst A, Schallert T, Connor J, Felt B, Georgieff MK. The iron supplementation dose for perinatal iron deficiency differentially alters the neurochemistry of frontal cortex and hippocampus in adult rats. Pediatr Res. 2012 doi: 10.1038/pr.2012.143. (in press) [DOI] [PMC free article] [PubMed] [Google Scholar]
- 22.Lubach GR, Coe CL. Preconception maternal iron status is a risk factor for iron deficiency in infant rhesus monkeys (Macaca mulatta) J Nutr. 2006;136 (9):2345–2349. doi: 10.1093/jn/136.9.2345. [DOI] [PubMed] [Google Scholar]
- 23.Coe CL, Lubach GR, Busbridge M, Chapman R. Optimal iron fortification of maternal diet during pregnancy and nursing for investigating and preventing iron deficiency in young rhesus monkey. Res Vet Sci. 2012 doi: 10.1016/j.rvsc.2012.11.017. (in press) [DOI] [PMC free article] [PubMed] [Google Scholar]
- 24.Thorsdottir I, Gunnarsson BS, Atladottir H, Michaelsen KF, Palsson G. Iron status at 12 months of age -- effects of body size, growth and diet in a population with high birth weight. Eur J Clin Nutr. 2003;57 (4):505–513. doi: 10.1038/sj.ejcn.1601594. [DOI] [PubMed] [Google Scholar]
- 25.Georgieff MK, Wewerka SW, Nelson CA, Deregnier RA. Iron status at 9 months of infants with low iron stores at birth. J Pediatr. 2002;141 (3):405–409. doi: 10.1067/mpd.2002.127090. [DOI] [PubMed] [Google Scholar]
- 26.Geguchadze RN, Coe CL, Lubach GR, Clardy TW, Beard JL, Connor JR. CSF proteomic analysis reveals persistent iron deficiency-induced alterations in non-human primate infants. J Neurochem. 2008;105 (1):127–136. doi: 10.1111/j.1471-4159.2007.05113.x. [DOI] [PubMed] [Google Scholar]
- 27.Coe CL, Lubach GR, Bianco L, Beard JL. A history of iron deficiency anemia during infancy alters brain monoamine activity later in juvenile monkeys. Develop Psychobiol. 2009;51 (3):301–309. doi: 10.1002/dev.20365. [DOI] [PMC free article] [PubMed] [Google Scholar]
- 28.Patton SM, Coe CL, Lubach GR, Connor JR. Quantitative proteomic analyses of cerebrospinal fluid using iTRAQ in a primate model of iron deficiency anemia. Dev Neurosci. 2012 doi: 10.1159/000341919. (in press) [DOI] [PMC free article] [PubMed] [Google Scholar]
- 29.Bicknese EJ, George JW, Hird DW, Paul-Murphy J, Anderson JA, Roberts JR. Prevalence and risk factors for iron deficiency anemia in weanling rhesus macaques. Lab Anim Sci. 1993;43 (5):434–438. [PubMed] [Google Scholar]
- 30.Kreite MF, Champoux M, Suomi S. Development of iron deficiency anemia in infant rhesus monkeys. Lab Animal Sci. 1995;45:15–21. [PubMed] [Google Scholar]
- 31.Wevers RA, Engelke U, Wendel U, de Jong JG, Gabreels FJ, Heerschap A. Standardized method for high-resolution 1H-NMR of cerebrospinal fluid. Clin Chem. 1995;41 (5):744–751. [PubMed] [Google Scholar]
- 32.Provencher SW. Estimation of metabolite concentrations from localized in vivo proton NMR spectra. Magn Reson Med. 1993;30 (6):672–679. doi: 10.1002/mrm.1910300604. [DOI] [PubMed] [Google Scholar]
- 33.Oz G, Tkac I, Charnas LR, Choi IY, Bjoraker KJ, Shapiro EG, Gruetter R. Assessment of adrenoleukodystrophy lesions by high field MRS in non-sedated pediatric patients. Neurology. 2005;64 (3):434–441. doi: 10.1212/01.WNL.0000150906.52208.E7. [DOI] [PubMed] [Google Scholar]
- 34.Henry PG, Oz G, Provencher S, Gruetter R. Toward dynamic isotopomer analysis in the rat brain in vivo: automatic quantitation of 13C NMR spectra using LCModel. NMR Biomed. 2003;16 (6–7):400–412. doi: 10.1002/nbm.840. [DOI] [PubMed] [Google Scholar]
- 35.Govindaraju V, Young K, Maudsley AA. Proton NMR chemical shifts and coupling constants for brain metabolites. NMR Biomed. 2000;13 (3):129–153. doi: 10.1002/1099-1492(200005)13:3<129::aid-nbm619>3.0.co;2-v. [DOI] [PubMed] [Google Scholar]
- 36.Baker RD, Greer FR. Diagnosis and prevention of iron deficiency and iron-deficiency anemia in infants and young children (0–3 years of age) Pediatrics. 2010;126 (5):1040–1050. doi: 10.1542/peds.2010-2576. [DOI] [PubMed] [Google Scholar]
- 37.Rao R, Tkac I, Townsend EL, Ennis K, Gruetter R, Georgieff MK. Perinatal iron deficiency predisposes the developing rat hippocampus to greater injury from mild to moderate hypoxia-ischemia. J Cereb Blood Flow Metab. 2007;27 (4):729–740. doi: 10.1038/sj.jcbfm.9600376. [DOI] [PMC free article] [PubMed] [Google Scholar]
- 38.Carlson ES, Tkac I, Magid R, O’Connor MB, Andrews NC, Schallert T, Gunshin H, Georgieff MK, Petryk A. Iron is essential for neuron development and memory function in mouse hippocampus. J Nutr. 2009;139 (4):672–679. doi: 10.3945/jn.108.096354. [DOI] [PMC free article] [PubMed] [Google Scholar]
- 39.deUngria M, Rao R, Wobken JD, Luciana M, Nelson CA, Georgieff MK. Perinatal iron deficiency decreases cytochrome c oxidase (CytOx) activity in selected regions of neonatal rat brain. Pediatr Res. 2000;48 (2):169–176. doi: 10.1203/00006450-200008000-00009. [DOI] [PubMed] [Google Scholar]
- 40.Vigani G. Does a similar metabolic reprogramming occur in fe-deficient plant cells and animal tumor cells? Front Plant Sci. 2012;3:47. doi: 10.3389/fpls.2012.00047. [DOI] [PMC free article] [PubMed] [Google Scholar]
- 41.Rellan-Alvarez R, Andaluz S, Rodriguez-Celma J, Wohlgemuth G, Zocchi G, Alvarez-Fernandez A, Fiehn O, Lopez-Millan AF, Abadia J. Changes in the proteomic and metabolic profiles of Beta vulgaris root tips in response to iron deficiency and resupply. BMC Plant Biol. 2010;10:120. doi: 10.1186/1471-2229-10-120. [DOI] [PMC free article] [PubMed] [Google Scholar]
- 42.Henderson SA, Dallman PR, Brooks GA. Glucose turnover and oxidation are increased in the iron-deficient anemic rat. Am J Physiol. 1986;250 (4 Pt 1):E414–421. doi: 10.1152/ajpendo.1986.250.4.E414. [DOI] [PubMed] [Google Scholar]
- 43.Brooks GA, Henderson SA, Dallman PR. Increased glucose dependence in resting, iron-deficient rats. Am J Physiol. 1987;253 (4 Pt 1):E461–466. doi: 10.1152/ajpendo.1987.253.4.E461. [DOI] [PubMed] [Google Scholar]
- 44.Oexle H, Gnaiger E, Weiss G. Iron-dependent changes in cellular energy metabolism: influence on citric acid cycle and oxidative phosphorylation. Biochim Biophys Acta. 1999;1413 (3):99–107. doi: 10.1016/s0005-2728(99)00088-2. [DOI] [PubMed] [Google Scholar]
- 45.Taneja V, Mishra K, Agarwal KN. Effect of early iron deficiency in rat on the gamma-aminobutyric acid shunt in brain. J Neurochem. 1986;46:1670–1674. doi: 10.1111/j.1471-4159.1986.tb08483.x. [DOI] [PubMed] [Google Scholar]
- 46.Tanaka M, Kariya F, Kaihatsu K, Nakamura K, Asakura T, Kuroda Y, Ohira Y. Effects of chronic iron deficiency anemia on brain metabolism. Jpn J Physiol. 1995;45:257–263. doi: 10.2170/jjphysiol.45.257. [DOI] [PubMed] [Google Scholar]
- 47.Mackler B, Person R, Miller LR, Inamdar AR, Finch CA. Iron deficiency in the rat: biochemical studies of brain metabolism. Pediat Res. 1978;12:217–220. doi: 10.1203/00006450-197803000-00011. [DOI] [PubMed] [Google Scholar]
- 48.Sibson NR, Dhankhar A, Mason GF, Rothman DL, Behar KL, Shulman RG. Stoichiometric coupling of brain glucose metabolism and glutamatergic neuronal activity. Proc Nat Acad Sci. 1998;95:316–321. doi: 10.1073/pnas.95.1.316. [DOI] [PMC free article] [PubMed] [Google Scholar]
- 49.Ohira Y, Chen CS, Hegenauer J, Saltman P. Adaptations of lactate metabolism in iron-deficient rats. Proc Soc Exp Biol Med. 1983;173 (2):213–216. doi: 10.3181/00379727-173-41633. [DOI] [PubMed] [Google Scholar]
- 50.Ben-Shachar D, Yehuda S, Finberg JP, Spanier I, Youdim MB. Selective alteration in blood-brain barrier and insulin transport in iron-deficient rats. J Neurochem. 1988;50 (5):1434–1437. doi: 10.1111/j.1471-4159.1988.tb03027.x. [DOI] [PubMed] [Google Scholar]
- 51.Burdo JR, Connor JR. Brain iron uptake and homeostatic mechanisms: an overview. Biometals. 2003;16 (1):63–75. doi: 10.1023/a:1020718718550. [DOI] [PubMed] [Google Scholar]
- 52.van Ommen B. Nutrigenomics: exploiting systems biology in the nutrition and health arenas. Nutrition. 2004;20 (1):4–8. [PubMed] [Google Scholar]