

Abstract
Changes in extracellular osmolality have been shown to alter gene expression patterns and metabolic activity of various cell types, including chondrocytes. However, mechanisms by which physiological or pathological changes in osmolality impact chondrocyte function remain unclear. Here we use quantitative image analysis, electron microscopy, and a DNase I assay to show that hyperosmotic conditions (>400 mOsm/kg) induce chromatin condensation, while hypoosmotic conditions (100 mOsm/kg) cause decondensation. Large density changes (p < 0.001) occur over a very narrow range of physiological osmolalities, which suggests that chondrocytes likely experience chromatin condensation and decondensation during a daily loading cycle. The effect of changes in osmolality on nuclear morphology (p < 0.01) and chromatin condensation (p < 0.001) also differed between chondrocytes in monolayer culture and three-dimensional agarose, suggesting a role for cell adhesion. The relationship between condensation and osmolality was accurately modeled by a polymer gel model which, along with the rapid nature of the chromatin condensation (<20 s), reveals the basic physicochemical nature of the process. Alterations in chromatin structure are expected to influence gene expression and thereby regulate chondrocyte activity in response to osmotic changes.
Introduction
Changes in osmolality have been shown to alter gene expression and the metabolic activity of cells from various tissues, including those of the renal (1), respiratory (2), cardiovascular (3), and musculoskeletal systems (4). In articular cartilage, the variation of fixed charge density due to the increased concentration of negatively charged proteoglycan with depth into the tissue, increases the osmolality from 350 mOsm/kg in the surface zone to 450 mOsm/kg in the deep zone (5). The osmotic environment of chondrocytes also increases when the tissue is under an extended static load or continuous cyclic loading without recovery due to the increase in hydrostatic pressure (0.2 MPa at resting to 4–20 MPa), which induces the loss of fluid and increases the proteoglycan concentration (6–9). The application of prolonged static load increases the osmolality of both deep and surface zones to a similar level (10). Additionally, the chondrocytes also experience an altered osmotic environment of ∼270 mOsm/kg associated with pathological degradation of the extracellular matrix (11).
Alteration of osmolality in cartilage tissue has been shown to affect protein synthesis (12–16). Similarly, osmotic challenge applied to isolated chondrocytes has been shown to affect cellular activity, including alterations in protein synthesis (4,17,18), gene expression (19), calcium signaling (20), and cytoskeletal organization (21,22). The application of hyperosmotic stress leads to a decrease in volume in chondrocytes due to the loss of intracellular fluid, whereas hypoosmotic stress increases the cell volume (23). Furthermore, dynamic osmotic challenge alters the cell volume only when the frequency is lower than 0.0125 Hz, which is much lower than the frequency of normal walking (1 Hz) (24). It remains unclear to what extent these osmotic-induced changes in cell morphology are involved in triggering the downstream metabolic response.
Osmotic challenge has been shown to alter the nuclear morphology of intact chondrocytes and isolated nuclei (25,26). This phenomenon persists even after the cytoskeletal organization is disrupted, which suggests that mechanical translation of cell deformation during osmotic challenge via the cytoskeleton is not the principal factor that alters the nuclear morphology (25). Additionally, previous studies of HeLa and other cell types revealed that the application of hyperosmotic stress gives rise to chromatin condensation (27–29). Gene expression is influenced by chromatin organization, with gene silencing generally associated with the higher levels of compaction known as heterochromatin, compared to the less condensed euchromatin (30,31). This is evident with the developmental silencing observed with lamin-associated heterochromatin, where the silenced genes are translocated to the lamina as higher-order chromatin (32,33).
Osmotically induced alterations of nuclear morphology and chromatin structure may provide a direct biophysical mechanism for controlling cellular metabolism. In this study, we test the hypothesis that osmotic challenge influences the morphology and levels of chromatin condensation in the chondrocyte nucleus. Our results show that osmotic challenge significantly alters the morphology and chromatin structure of chondrocyte nuclei. This occurs in a rapid and reversible manner, fitted by the polymer-gel model, suggesting a physicochemical nature to the phenomena and its importance in cartilage physiology.
Material and Methods
Specimen preparation
Chondrocytes were isolated from the full-depth articular cartilage of the metacarpophalangeal joints of freshly sacrificed 18- to 24-month-old bovine steers via sequential enzymatic digestion, as previously described in Lee and Knight (34). At least two joints were used for each isolation procedure, depending on the number of cells required. Unless stated, the culture medium used in this study was made from low glucose Dulbecco’s modified Eagle’s medium (DMEM) supplemented with 20% fetal calf serum (FCS), 20 mM HEPES, 100 U/mL penicillin, 0.1 mg/mL streptomycin, 2 mM L-glutamine, and 0.85 mM L-ascorbic acid (320 mOsm/kg, all from Sigma-Aldrich, Dorset, UK).
For the monolayer specimens, 8 × 10⁶ freshly isolated chondrocytes were seeded onto 175-cm2 culture flasks and initially cultured for five days, in either standard (320 mOsm/kg) or hyperosmotic conditions (400 or 500 mOsm/kg). For imaging of fixed chondrocytes, the cells were trypsinized and seeded at 5 × 10⁴ cells/cm2 onto glass coverslips, housed in 24-well plates. Alternatively, for imaging of live chondrocytes, cells were seeded onto 35-mm glass-bottom petri dishes (MatTek, Ashland, MA) with the same seeding density. In both cases, the chondrocytes were cultured overnight to allow the cells to adhere. Both the coverslips and the glass-bottom petri dishes were precoated with FCS for 1 h at room temperature before cell seeding.
Three-dimensional agarose specimens were prepared by seeding freshly isolated chondrocytes, 1 × 10⁷ cells/mL, into 3% (w/v) agarose gel (Type VII; Sigma-Aldrich) as previously described in Sawae et al. (35). The three-dimensional agarose specimens were cultured overnight before osmotic challenge.
Osmotic challenge
A base media was prepared consisting of DMEM without sodium bicarbonate, supplemented with 20 mM HEPES, 100 U/mL penicillin, 0.1 mg/mL streptomycin, 2 mM L-glutamine, and 0.85 mM L-ascorbic acid. This had an osmolality of 260 mOsm/kg, which was increased through the addition of D-mannitol (Sigma-Aldrich). Reduction of the osmolality was achieved by dilution with sterile distilled water. All osmolality measurements were performed using a freezing-point depression osmometer (model No. 3250; Advanced Instruments, Norwood, MA). Cells in monolayer were subjected to osmotic challenge by incubation in the requisite osmotic challenge medium for 15 min to allow for chromatin reorganization (27). Cells in the three-dimensional agarose specimens were given a longer incubation period of 30 min.
For fixation, chondrocytes were washed with osmotically balanced phosphate-buffered saline (PBS) and then fixed by incubation in an osmotically balanced fixative, 1% glutaraldehyde (Agar Scientific, Stansted, UK) buffered with 8 mM sodium cacodylate (Sigma-Aldrich), for 30 min. The fixed cells were subsequently washed with PBS and stained with 8 μM Hoechst 33342 (Sigma-Aldrich) at 37°C for 15 min or 30 min for monolayer or three-dimensional agarose specimens, respectively. Afterwards, the specimens were washed with sterile distilled water and mounted onto glass slides by using Prolong Gold (Invitrogen, Paisley, UK).
Live chondrocytes were stained with 8 μM Hoechst 33342 as described above. The cells were incubated in isoosmotic medium (300 mOsm/kg) in a 37°C imaging chamber mounted on the stage of the confocal microscope system. Osmotic challenge was applied by replacing the media.
Confocal microscopy and a van der Waals model of cell volume change
The chondrocyte nuclei were imaged using confocal microscopy (model No. TCS SP2; Leica Microsystems, Wetzlar, Germany), using a 63×/1.4-NA oil immersion objective, a pixel size of 46.5 nm, and an imaging period of 7.68 s/image. A single 512 × 512 pixels (8-bit) optical section was made through the center of each nucleus. For studies with live cells, each nucleus was imaged at 300 mOsm/kg and after a 15-min or 30-min osmotic challenge for monolayer or three-dimensional agarose specimens, respectively.
To measure the response to osmotic challenge in the Z axis, the nuclei were imaged as a Z-series of 32 × 512 pixels images, with a step size of 0.46 μm (0.08 s/image). The Z-stacks images were average-intensity projected to the X-Z plane, thresholded using the iterative self-organizing data algorithm (36), and then the height of the nucleus was measured. For the three-dimensional agarose specimen, the diameter of the cell in X and Y axes was measured from the bright-field images using the software ImageJ (37) (National Institutes of Health, Bethesda, MD). Cell and nuclear volume was then approximated by assuming that the chondrocytes seeded in three-dimensional agarose construct adopted a spherical morphology as previously demonstrated in Lee et al. (38). Using a standard van der Waals equation that lacks the attraction term, osmotic pressure (Π) relates to cell volume (V) as:
| (1) |
where R is the gas constant, T is absolute temperature, and b is the excluded volume. Based on Eq. 1, the change in cell volume (ΔV) with osmotic pressure changes (ΔΠ) was fit with three parameters (A, B, and C) to experiment, giving:
| (2) |
Image analysis
Confocal images of nuclei were manipulated and analyzed using MATLAB (The MathWorks, Natick, MA). Initially, the pixel intensities for each image were redistributed to utilize the entire 8-bit intensity scale. Images were then downsampled to 128 × 128 pixels images. A Sobel digital filter was used to produce an edge map (39), which was thresholded and subjected to a thinning morphological algorithm (40) to reduce the strong edge lines into single-pixel-thickness entities (see Fig. S1, A–D, in the Supporting Material). The area of strong edges, excluding the outer edge of the nucleus, was measured and divided by the cross-sectional area of the nucleus to yield the chromatin condensation parameter.
To measure the nuclear area and perimeter, the images were mode-thresholded (41) to acquire the nuclear outline. The area bounded by this outline was fitted to an ellipse, to render the ellipsoid perimeter. To estimate the degree of nuclear deformation with osmotic loading, the perimeter ratio was calculated by dividing the actual nuclear perimeter by the ellipsoid perimeter (42). When the perimeter ratio increases, the perimeter of the nucleus increases with respect to that of the modeled ellipse, indicating a more deformed outline.
The changes in chromatin condensation parameter, area, perimeter ratio, nuclear height in the lateral plane, and cell volume due to the osmotic challenge were recorded and expressed relative to their original value.
Polymer-gel model of chromatin condensation
The extent of local chromatin heterogeneity was determined in terms of the chromatin condensation parameter, which reflects the edge density (ρ) in the nucleus image. In modeling this, we first consider the osmotic pressure of a polymer solution (43). In the semidilute regime where the volume occupied by the individual chains just covers the total sample volume, the osmotic pressure of a polymer solution is dependent only on monomer concentration which we approximate as proportional to the chromatin condensation parameter:
| (3) |
Confinement within the nucleus adds a basal osmotic pressure, Πb:
| (4) |
| (5) |
In addition, chromatin entanglements and cross-linking lead to a resistance to dilational stretching (as well as shearing) of the chromatin:
| (6) |
This last term could be replaced by a sum of terms with d = 1, 2, 3 as would be appropriate for wormlike chain elasticity, but this will generally introduce more fitting factors. We therefore use the parsimonious model above in fitting the data of chromatin condensation versus osmolality, with confined polymer-gel models similar to Eq. 6 already applied successfully to the mechanics of other membrane-constrained networks (44).
Transmission electron microscopy
For transmission electron microscopy (TEM) imaging, monolayer-cultured and three-dimensional agarose-seeded chondrocytes underwent osmotic challenge as already described. The monolayer specimens were fixed as above-described while the three-dimensional agarose specimens were fixed overnight at 4°C. The specimens were postfixed in 1% osmium tetroxide, dehydrated through a graded alcohol series, cleared in propylene oxide, and infiltrated with Araldite epoxy resin (all from Sigma-Aldrich). Ultrathin sections (60–90 nm) were cut using a Reichert-Jung Ultracut E Ultramicrotome (Reichert, Buffalo, NY) with a diamond knife. The sections were mounted on copper grids before being stained with saturated aqueous uranyl acetate and Reynolds lead citrate stain (all from Sigma-Aldrich). Sections were examined with a model No. EM201 transmission electron microscope (Philips, Amsterdam, Netherlands) fitted with a digital camera (AMT, Woburn, MA).
Real-time deoxyribonuclease I PicoGreen assay
Freshly isolated chondrocytes were centrifuged at 600 × g for 5 min and resuspended in 5 mL of PBS. The cells were centrifuged again and resuspended in 5 mL of isoosmotic medium. The cells were treated with 0.2% IGEPAL CA-630 (Sigma-Aldrich) for 5 min on ice, to isolate the nuclei. The nuclei were pelleted by centrifugation as already described and resuspended in the isoosmotic medium.
Osmotic challenge of 100, 300, and 700 mOsm/kg was applied to the isolated nuclei for 15 min. The nuclei were then centrifuged and resuspended in the corresponding osmotically balanced Deoxyribonuclease I (DNase I) buffer (50 mM HEPES, 10 mM NaCl, 10 mM CaCl2, 5 mM MgOAc, 1 mM Dithiothreitol; all from Sigma-Aldrich). The nuclei were stained by using the Quan-iT PicoGreen reagent (Invitrogen), per manufacturer’s instructions. Briefly, a 200-fold dilution of the PicoGreen concentrate was prepared in the osmotically balanced DNase I buffer and the nuclei were stained for 5 min at room temperature. The nuclei from each osmotic group were placed into a Maxisorp 96-wells plate (NUNC, Roskilde, Denmark) with 100 μL per well. DNase I was added to yield a concentration of 2 U/million nuclei. The level of fluorescence intensity from the nuclei was monitored over a 180-min period at 37°C. To control for changes in DNase I activity due to different osmolality, 3.5 μg λ-DNA (Sigma-Aldrich) was digested by 1 U of DNase I, at different osmolality conditions (100, 300, and 700 mOsm/kg).
Chromatin condensation dynamics in living chondrocytes
Monolayer specimens were prepared by seeding chondrocytes on FCS-coated 35-mm glass-bottom dishes at 5 × 10⁴ cells/cm2. To image chromatin condensation in living cells, chondrocytes were transfected with a fusion construct of Histone H2B and an enhanced Green Fluorescent Protein (H2B-GFP with Addgene plasmid 11680; generously donated by Thomas Cremer, Ludwig Maximilian University, Munich, Germany) using HiFect transfection reagent (Lonza, Basel, Switzerland), per manufacturer’s instructions. Briefly, 3 μg of H2B-GFP was precomplexed with the HiFect reagent (5% of final volume) in serum and antibiotic-free medium. Plasmid-lipofection complexes were added to complete medium (DMEM + 20% FCS) to a final volume of 2.5 mL and transfection was carried out under standard culture conditions for 24 h whereupon media was replaced with 3 mL of fresh DMEM + 20% FCS for an additional 24 h. For the simultaneous imaging of the actin cytoskeleton and the chromatin, chondrocytes were transfected with CellLight H2B-GFP and Actin-RFP, BacMam 2.0 (Invitrogen), per manufacturer’s instructions. Briefly, 2 μL of the transfection reagents (1 × 10⁸ particles/mL) were added to 2 mL complete medium, followed by 18 h of culture.
The specimen was placed in a 37°C imaging chamber and the culture medium was aspirated. Osmotic challenge was achieved using a custom-built medium aspiration and delivery system, which involved two syringe pumps (Harvard Apparatus, Kent, UK), to ensure a constant delivery time (∼7 s at a delivery rate of 1 mL/s for 7 mL medium). Isoosmotic medium was introduced via the delivery system and the cells were incubated for 15 min. Using confocal microscopy (63×/1.4NA objective, 46.5 nm/pixel for nuclear imaging and 186 nm/pixel for simultaneous imaging of nucleus and cytoskeleton, ΔZ = 0.23 μm, 0.407 s/image), an extended Z-stack of images was taken of each nucleus. The isoosmotic medium was aspirated and replaced with the requisite osmotic challenge medium, and the same nucleus was imaged continuously via a series of extended Z-stacks over a 15-min period. After the osmotic challenge, the medium was aspirated. Isoosmotic medium was reintroduced with further imaging for another 15-min period.
Statistical analysis
For data with a normal distribution, the results are shown as mean ± standard error and the statistical significance was calculated by using one-way ANOVA followed by Bonferroni’s correction. In case of nonnormally distributed data, the Mann-Whitney U test with the Bonferroni’s correction was used to measure the level of significance, and the results are shown as median with upper and lower quartiles as the error bars. Curve fitting seen later in Fig. 2 was performed with the software Igor Pro (Ver. 6.22A; WaveMetrics, Portland, OR), using the chromatin condensation parameter data binned in pairs within the osmolality range of reversible nuclear deformation.
Figure 2.
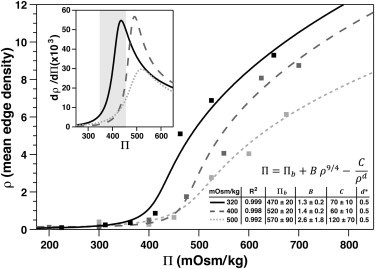
Quantified chromatin condensation parameter fit to a semidilute polymer-gel model with an additional term compensating for chain elasticity (see text; ∗d is constrained to 0.5 to give the best fit for the datasets). Data are binned within the osmolality range of reversible density changes. (Inset) Calculated from the model and, for cells precultured 320 mOsm/kg, a large change in density is observed within the range of osmolalities associated with in vivo articular cartilage (5).
Results
Osmotic changes alter chromatin condensation in monolayer and three-dimensional agarose cultures, fitting to a polymer-gel model
To assess the effect of different osmolalities on the chondrocyte nucleus, monolayer cultures, precultured at 320, 400, or 500 mOsm/kg, were then exposed to media ranging from 100 to 800 mOsm/kg. The cells were then fixed, stained with Hoechst 33342, and imaged by confocal microscopy (Fig. 1 A). DNA staining appeared most homogenous in the nuclei exposed to 100 mOsm/kg, reflected by the lowest level of the chromatin condensation parameter (Fig. 1 B). For the cells precultured in 320 mOsm/kg, a dramatic increase in chromatin condensation was apparent between 400 and 500 mOsm/kg, followed by a more gradual increase at higher osmolalities(Fig. 1 B). When the cells were precultured at 400 and 500 mOsm/kg, chromatin condensation was observed to increase more gradually upon hyperosmotic challenge (Fig. 1 B).
Figure 1.
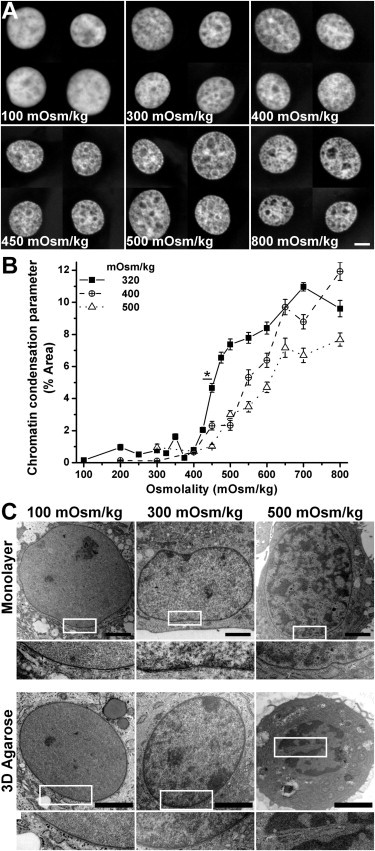
(A) Nuclei of monolayer chondrocytes cultured in 320 mOsm/kg condition, followed with osmotic challenge ranging from 100 mOsm/kg to 800 mOsm/kg and fixation (bar, 5 μm). (B) Chromatin condensation parameter quantified from the nuclei images of each osmotic group (N = 40 nuclei per condition; ∗p < 0.001). Error bars show standard error. (C) TEM images of monolayer and three-dimensional agarose chondrocyte nuclei, exposed to osmolalities of 100, 300, and 500 mOsm/kg (bar, 2 μm).
A polymer-gel model of the relationship between osmolality and chromatin condensation gave an excellent fit to the experimental data (R2 > 0.99 for all cases; see Fig. 2). When the cells were precultured in 320 mOsm/kg condition, the basal osmotic pressure that is applied by the chromatin and the nuclear envelope is ∼470 mOsm/kg. Preculture at higher osmolality causes the response curves to shift to the right. The B and C factors are small, positive, and do not vary significantly, whereas the stretching exponent d is constrained to 0.5, to give the best fit for the datasets. The inset in Fig. 2 shows the first derivative of ρ, with respect to Π, for the cells precultured in 320 mOsm/kg; the steepest chromatin response to osmotic challenge occurs within the range of osmolalities found in physiological loading of in vivo articular cartilage (5). However, preculturing the cells in 400 mOsm/kg shifted the range of the response to ∼500 mOsm/kg, and preculturing in 500 mOsm/kg also reduced its magnitude.
The condensation response to osmotic challenge observed in fixed cells was confirmed in live-imaged cells (Fig. 3 A). Cells in both monolayer and three-dimensional agarose specimens showed reduced level of chromatin condensation with hypoosmotic challenge (300–100 mOsm/kg). Meanwhile, the hyperosmotic challenge (300–500 or 700 mOsm/kg) increased the level of chromatin condensation. However, the monolayer specimens experienced a higher degree of change when compared with the three-dimensional agarose specimens (Fig. 3, A and B). The effects of osmotic challenge on chromatin organization were confirmed by the TEM images of the nuclei (Fig. 1 C). Upon the hypoosmotic challenge, in addition to the loss of peripheral heterochromatin, the nuclei appeared more homogenous with few electron-dense foci, indicating a comparatively decondensed state of chromatin organization. When exposed to hyperosmotic challenge, however, chromatin condensation was observed in electron-dense foci throughout the nuclei in both monolayer and three-dimensional agarose specimens.
Figure 3.
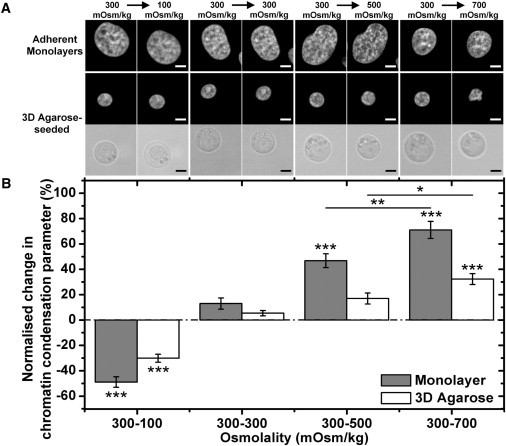
(A) Images of nuclei in chondrocyte monolayers and nuclei and cells in three-dimensional agarose in an isoosmotic environment, followed by osmotic challenge (100, 300, 500, and 700 mOsm/kg) (bar, 5 μm). (B) The normalized change of chromatin condensation parameter quantified from the live monolayer and three-dimensional agarose specimen. Statistical significance test was performed to compare the osmotic challenge groups against the control group (300–300 mOsm/kg) and also between the 500 and 700 mOsm/kg group (N = 37–40 nuclei per condition; ∗p < 0.05, ∗∗p < 0.01, and ∗∗∗p < 0.001). Error bars show standard error.
Cell and nuclear morphology responses to osmotic changes vary with cell adhesion
Hyperosmotic challenge in three-dimensional agarose specimens induced a crumpling of the nuclear envelope (Fig. 3 A), indicated by a statistically significant increase in the perimeter ratio of the nucleus (Fig. 4 A). This phenomenon could also be observed in the decrease of the cross-sectional area of the nucleus by 15–22% (Fig. 4 B) and from the TEM images (Fig. 1 C). By contrast, the perimeter ratio of the nuclei in cells cultured in monolayer remained relatively stable irrespective of osmotic challenge, although a slight reduction in cross-sectional area was observed in monolayer nuclei after hypoosmotic challenge (Fig. 4 B).
Figure 4.
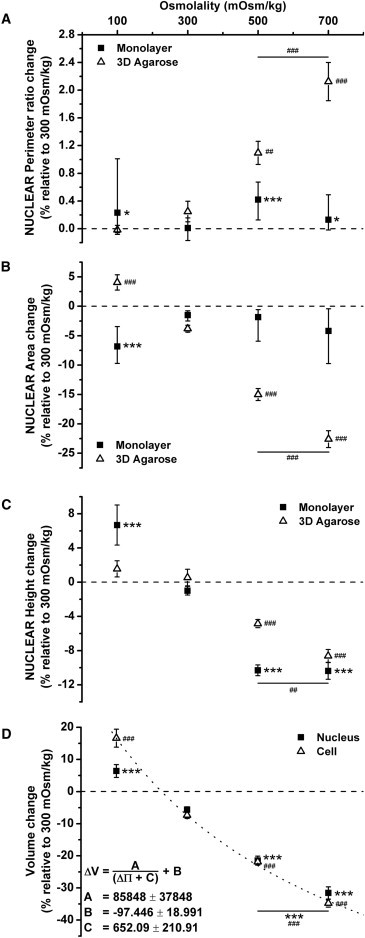
The normalized change of perimeter ratio (A), nuclear cross-section area (B), and height (C) quantified from the live monolayer and three-dimensional agarose specimens. (D) The normalized change of nuclear and cell volume quantified from the three-dimensional agarose-seeded chondrocytes. Change in cell volume fitted to Eq. 2, the van der Waals equation with no attraction (R2 > 0.998). Statistical significance test was performed to compare the osmotic challenge groups against the control group (300–300 mOsm/kg) and also between the 500 and 700 mOsm/kg group (N = 16–40 nuclei per condition; ∗p < 0.05, ##p < 0.01, and ∗∗∗,###p < 0.001). Error bars show standard error, except for perimeter ratio and area data of monolayer specimens, where the error bars show lower and upper quartile.
When chondrocytes in monolayer were exposed to hypoosmotic challenge (100 mOsm/kg), there was a statistically significant increase in the nuclear height by ∼10% (p < 0.01, Fig. 4 C). Upon hyperosmotic challenge, the height of the nucleus decreased by ∼10% at both 500 mOsm/kg and 700 mOsm/kg (p < 0.001). By contrast, nuclear height in three-dimensional agarose was not affected by hypoosmotic conditions (p > 0.05), but exposure to hyperosmotic medium induced a reduction in nuclear height of 5% at 500 mOsm/kg and 9% at 700 mOsm/kg (p < 0.01). Additionally, the cell and nuclear volume of the three-dimensional agarose specimen increased upon hypoosmotic challenge and decreased gradually during hyperosmotic challenge. (Fig. 4 D).
When exposed to iso- and hyperosmotic challenge, the changes in cell and nuclear volume were proportional to each other. However, when compared to the change in nuclear volume, a greater change in cell volume occurred upon hypoosmotic challenge. The three-parameter van der Waals equation (Eq. 2) provided an excellent fit for the change in cell volume (R2 > 0.998). With increased osmolality, cell volume decreased until a minimum was reached. Based on the fit, two-to-threefold higher pressure than the maximum osmotic challenge (700 mOsm/kg) is needed to convincingly see saturation, but such osmolalities are far from physiological. At low osmotic pressure, the cell expanded and contracted over time, due to dynamic volume regulation (45). This might account for the higher variability (shown by the error bars in Fig. 4), and so this limit is likely to be underestimated and inaccurate.
Osmotic challenge alters the DNase I digestion characteristics in isolated nuclei
Our results have shown that osmotic challenge alters chromatin condensation levels in intact chondrocytes. To confirm that osmotic challenge continues to alter the level of chromatin condensation in the absence of the plasma membrane and cytoplasm, we subjected isolated chondrocyte nuclei to controlled DNase I digestion and tracked it in real-time by PicoGreen fluorescence (46). DNase I is an endonuclease that preferentially cleaves the phosphodiester backbone of DNA adjacent to pyrimidine bases. Higher levels of chromatin condensation hinder the enzyme’s access to the DNA backbone; therefore, compacted genomic regions will be more resistant to DNase I digestion (47).
Differences in DNA digestion were apparent between the osmotic groups (p < 0.05 from 40 min onward; see Fig. 5 A). The nuclei exposed to 100 mOsm/kg have the highest level of digestion and 700 mOsm/kg the lowest digestion, indicative of differences in DNase I access: in particular, an increase in osmolality hinders DNase I access to DNA in isolated nuclei, which is consistent with condensation. The DNA digestion for the isolated nuclei was markedly less rapid than for the λ-DNA controls; however, all osmotic conditions showed similar digestion kinetics (Fig. 5 B). A single exponential model provided an excellent fit to the results in all cases (R2 > 0.98).
Figure 5.
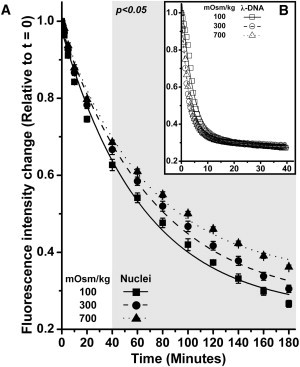
The amount of DNA present in the specimen was represented by the PicoGreen fluorescence intensity. Fluorescence intensities were normalized against the initial intensity and fit to a single exponential function (R2 > 0.98 in all cases). (A) The level of fluorescence intensity from the isolated nuclei exposed to 100, 300, and 700 mOsm/kg, as being digested by DNase I over time. The differences between the osmotic groups are statistically significant from t = 40 min onwards. (B) The DNase I digestion profile for λ-DNA in 100, 300, and 700 mOsm/kg. Only at the first 5.5 min was the fluorescence intensity of λ-DNA exposed to 100 mOsm/kg statistically higher than the other groups. Error bars show standard error.
Instantaneous and reversible effect of osmotic challenge
To investigate the response time of chromatin compaction associated with the osmotic challenge, nuclei were monitored in live cells over a 15-min period. The effect of osmotic challenge on the nucleus was clearly visible within 20 s after the introduction of the osmotic medium (Fig. 6 A) indicated by changes in chromatin condensation levels (Fig. 6 B, and see Fig. S2, Fig. S3, Fig. S4, Fig. S5, and Fig. S6 in the Supporting Material, and Movie S1, Movie S2, Movie S3, Movie S4, and Movie S5 in the Supporting Material) and nuclear height (Fig. 6 C). When chondrocytes were exposed only to the 300 mOsm/kg isoosmotic medium, the level of chromatin condensation and the nuclear height remained unchanged.
Figure 6.
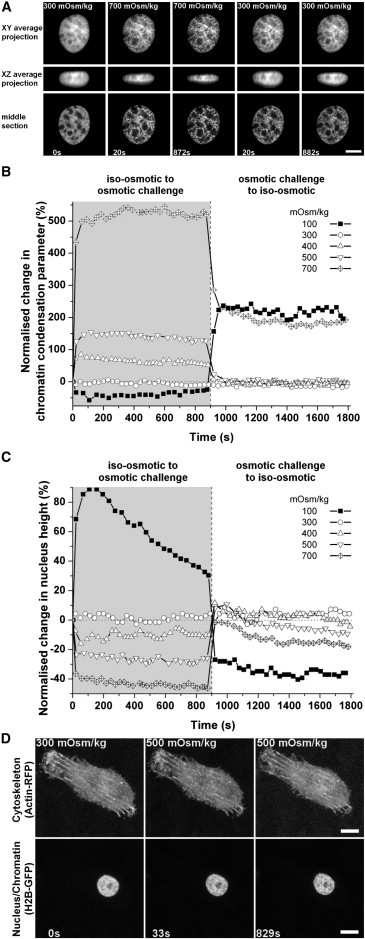
(A) Images of monolayer-cultured chondrocytes expressing H2B-GFP in an isoosmotic environment (300 mOsm/kg), followed by hyperosmotic challenge (700 mOsm/kg), which was then brought back to the isoosmotic conditions. Images were thresholded using the iterative self-organizing data algorithm (bar, 5 μm). (B) Normalized change of the chromatin condensation parameter quantified from live chondrocytes due to osmotic challenge for 15 min (900 s) followed by a return to isoosmotic conditions for an additional 15 min. The chromatin condensation parameter quantification was acquired from the XY average projection images. (C) Normalized change of the nuclear height from the live chondrocyte due to the osmotic challenge. (D) Average projection images of monolayer-cultured cells expressing actin-RFP and H2B-GFP fusion-protein in an isoosmotic environment, followed with hyperosmotic challenge (500 mOsm/kg; bar, 10 μm).
The reintroduction of isoosmotic medium to cells exposed to 400 and 500 mOsm/kg hyperosmotic medium resulted in a rapid and complete reversal of the chromatin condensation (Fig. 6 B, and see Fig. S4 and Fig. S5). By contrast, chromatin condensation level did not fall back to the original value after reintroduction of isoosmotic medium after exposure to 700 mOsm/kg medium (Fig. 6 B and see Fig. S6). Alterations to nuclear height induced by hyperosmotic challenge at all levels were broadly reversible, although there was evidence of a time-dependent reduction in nuclear height after reintroduction of isoosmotic medium (Fig. 6 C, and see Fig. S5 and Fig. S6).
Exposure of the chondrocytes to hypoosmotic medium (100 mOsm/kg) reduced the level of chromatin condensation and increased nuclear height but with a clear time-dependent relaxation over the 15-min observation period (Fig. 6, B and C, and see Fig. S2). Interestingly, when isoosmotic medium was reintroduced, chromatin condensation level increased significantly above the original value before the hypoosmotic challenge and the nucleus height decreased below the original size as well (Fig. 6, B and C, and see Fig. S2). Additionally, no obvious changes in actin-cytoskeletal organization were observed upon hypo-, iso-, and hyperosmotic challenges (100, 300, and 500 mOsm/kg, respectively, see Fig. 6 D; and see Fig. S7, Fig. S8, and Fig. S9; and see Movie S6, Movie S7, and Movie S8).
Discussion
In this study we have measured the extent of chromatin condensation in fluorescently labeled nuclei using an image analysis method adapted from an approach used previously in Knight et al. (48). We show that hyperosmotic challenge induces the chromatin condensation in chondrocytes (Fig. 1), in agreement with findings reported in other cell types (27,28). As in other studies, chromatin condensation occurs in specific localized regions within the nucleus, rather than globally, resulting in an increase in both the interchromosomal compartment and the spatial heterogeneity of staining (27). The confined polymer-gel model fits exceptionally well in the reversible region observed experimentally (300–500 mOsm/kg; Figs. 2 and 6 B), suggesting that the mechanism underlying the chromatin condensation and decondensation is predominantly physico chemical in nature. Indeed, the rapid onset (<20 s) of this condensation and reversible recovery revealed by the live cell imaging is also consistent with this view. This differentiates osmotically induced chromatin condensation from other mechanisms that modify chromatin architecture, which are driven by biochemical modification of DNA or histone tails, for example, and which do not manifest so pervasively in this short timescale.
For cells preincubated in 320 mOsm/kg medium, the most marked condensation occurred between 400 and 500 mOsm/kg, suggesting a set-point where chromatin condensation predominantly occurs (Fig. 1 B). Chromatin condensation also occurred in cells preincubated in hyperosmotic conditions (400 and 500 mOsm/kg) but with a shift in set-point to a higher osmolality, typically between 400 and 600 mOsm/kg. Interestingly, the set-points fall within the physiological range of osmolality in unloaded articular cartilage in vivo (350–450 mOsm/kg) (5) and the osmolality in the surface and deep tissue after the application of extended loading (430–470 mOsm/kg) (10). Accordingly, the chromatin within the nuclei of articular chondrocytes is likely to be subjected to transition between states of greater and lesser condensation during periods of extended loading and unloading. Interestingly, the shift in the range of osmolality where condensation predominantly occurs for cells preincubated at 400 mOsm/kg, a physiological level for chondrocytes, suggests an adaptation of the cells to their in situ osmotic conditions that may reduce the magnitude of load-induced chromatin condensation/decondensation phenomena.
Chromatin condensation upon hyperosmotic challenge and chromatin decondensation upon hypoosmotic challenge was observed in both the monolayer and three-dimensional agarose-seeded chondrocytes experienced. However, differences in other aspects of nuclear morphology were noted. In the three-dimensional agarose specimens, hyperosmotic challenge induced significant deformation of the nucleus in both axial and lateral planes (X-Y-Z). By contrast, in monolayer specimens, significant nuclear deformation was only observed in Z axis (nuclear height). This suggests that the nuclear envelope is constrained in the axial (X-Y) plane in monolayer, potentially associated with the major differences in cytoskeletal organization known to exist between chondrocytes in monolayer and agarose (49).
However, the rapid changes in chromatin condensation level upon osmotic challenge were not associated with alterations in the actin-cytoskeletal organization (Fig. 6 D, and see Fig. S7, Fig. S8, and Fig. S9), which is in contrast with the previous observations on chondrocytes with rounded morphology (21,23), and it suggests a direct effect of osmotic challenge on the nucleus that is not mediated via earlier alterations to the cytoskeleton. The nucleus in cytoskeleton-disrupted epithelial cells has been found to be four-to-fivefold more rigid in micropipette aspiration upon condensation with divalent salts in ionophore-treated cells (50), which is consistent with the decrease seen here in dρ/dΠ above the physiological range of osmotic stress (Fig. 2, inset).
Interestingly, upon hyperosmotic challenge, an irregular deformation of the nuclei in three-dimensional agarose-seeded chondrocytes was observed, in contrast to the uniform shrinking of the cell. Finan and Guilak (51) previously suggested that the nuclear deformation is a direct response of the change in osmolality within the cytoplasm, which increases the osmotic pressure inside the nucleus. According to this model, irregularity suggests that there are regions around or within the nucleus that are more susceptible to deformation (for example, crowding of cytoplasmic organelles, such as the endoplasmic reticulum, the membranes of which are contiguous with the outer nuclear membrane; due to fluid extrusion, may compress the nucleus at particular locations). The effect may also be associated with the regional heterogeneity of chromatin condensation in isoosmotic conditions and/or with hyperosmotically induced condensation. With hypoosmotic challenge, the nuclear volume increases to a lesser extent than the cell volume (Fig. 4 D), which suggests that the swelling of the nucleus is somehow restricted (for example, due to structural limitations imposed by the nuclear envelope/lamina and the cytoskeleton).
The functional consequences of osmotically induced chromatin condensation and decondensation was demonstrated in the DNA digestion studies. The reduced and increased rates of DNA digestion for chondrocyte nuclei subjected to hyperosmotic and hypoosmotic challenge, respectively, are consistent with altered access of the DNase I to the DNA backbone with altered levels of chromatin condensation, as osmolality (alone) does not significantly impact the digestion kinetics of DNase I on naked DNA (Fig. 5 B). Moreover, as these studies were performed using isolated nuclei, clearly osmotically induced chromatin condensation can occur in the absence of a functional plasma membrane and cytosolic compartment. The nuclear envelope does not exhibit the same selective permeability to low-molecular-weight species such as ions, exhibited by the plasma membrane. As such, the physicochemical nature of the chromatin condensation may be driven by the physical entrapment of large macromolecular components of the chromatin rather than the restriction of movement across a membrane of small ions that regulates classic whole-cell osmotic effects. Moreover, the presence of fixed charge associated with the chromatin suggests a mechanism potentially more akin to the Gibbs-Donnan effect that is well documented for aggrecan swelling within cartilage (52).
Upon the reintroduction of isoosmotic medium to the chondrocytes exposed to 400 and 500 mOsm/kg, the chromatin condensation level and nuclear height recovered rapidly to their original value, indicating the reversibility of the osmotically induced alteration. These osmolalities cover the physiological osmotic range and the osmotic range where chromatin condensation predominantly occurred as shown earlier in this study. Extended loading of cartilage, such as in human intervertebral disks over the course of a day, is known to lower the tissue’s fluid content (6), thus increasing the osmolality of the tissue. When the load is removed during resting, rehydration of the tissue occurs, which restoring osmolality to unloaded levels.
This osmotic cycle, in conjunction with the reversible nature of the chromatin condensation, suggests that reversible chromatin condensation and decondensation events likely occur during the cartilage daily loading cycle. When the isoosmotic medium was reintroduced to the chondrocytes exposed to 100 and 700 mOsm/kg, the chromatin condensation level and the nuclear height was not restored to the original values. Interestingly, reintroduction of isoosmotic medium, for cells incubated in 100 mOsm/kg medium, resulted in condensation levels greater than isoosmotic or hypoosmotic. Thus, incubation in 100 and 700 mOsm/kg medium (osmotic extremes outside the physiological range) may induce alterations to the chromatin and/or to structural elements in the nuclear lamina or cytoskeleton in a manner that is nonrecoverable, which may lead to apoptosis (53,54).
In summary, hyperosmotic and hypoosmotic challenges induce rapid chromatin condensation and decondensation, respectively. These effects predominantly fall within a narrow, physiological range of osmolalities and are rapidly reversible within this range, suggesting these phenomena are relevant to the in vivo state. The excellent agreement between experimental data and the polymer-gel model coupled with rapid nature of the chromatin condensation indicate that these effects are predominantly a physico-chemical phenomenon. The known relationship between chromatin condensation and gene silencing suggests that osmotically driven condensation phenomena may regulate transcriptional activity in chondrocytes under various loading regimes.
Moreover, pathologically induced changes in osmolality may induce profound alterations in chromatin condensation within both the loaded and unloaded states, with associated changes in gene expression. Indeed, a recent study from our group has demonstrated a marked alteration in gene expression induced by hyperosmotic challenge, including a major effect on histone expression (55). Further study is required to elucidate the mechanistic relationship between osmotically induced chromatin condensation and transcriptional regulation (for example, to ascertain whether certain gene loci, critical for chondrocyte survival and homeostasis, are shielded from the osmotically induced chromatin condensation). This may involve boundary or insulator elements, regions of noncoding intergenic DNA that bind proteins such as CTCF and other trans-acting factors, that can shield loci from the effects of regulatory regions of neighboring genes and higher-order chromatin structure (56,57).
It is tempting to speculate that the physical limitations imposed on the nucleus by both the lamina and the cytoskeleton may be part of this control mechanism; we propose that this is evidenced by the upper swelling limit demonstrated by hypoosmotic conditions. These osmotically induced alterations in nuclear morphology and chromatin structure present themselves as a potential step in a mechanism that mediates chondrocyte metabolism upon osmotic challenge.
Acknowledgments
The authors thank Thomas Cremer for the H2B-GFP plasmid used in this study.
This study was supported by a Queen Mary, Unversity of London College DTA studentship, Engineering & Physical Sciences Research Council Platform grant No. EP/E046975/1, and Human Frontiers of Science Program grant No. RGP0025-2009.
Supporting Material
References
- 1.Miyakawa H., Woo S.K., Kwon H.M. Cis- and trans-acting factors regulating transcription of the BGT1 gene in response to hypertonicity. Am. J. Physiol. 1998;274:F753–F761. doi: 10.1152/ajprenal.1998.274.4.F753. [DOI] [PubMed] [Google Scholar]
- 2.Fedan J.S., Yuan L.X., Pettit L.L. Osmotic regulation of airway reactivity by epithelium. J. Pharmacol. Exp. Ther. 1999;289:901–910. [PubMed] [Google Scholar]
- 3.Zhou Y.Y., Yao J.A., Tseng G.N. Role of tyrosine kinase activity in cardiac slow delayed rectifier channel modulation by cell swelling. Pflugers Arch. 1997;433:750–757. doi: 10.1007/s004240050341. [DOI] [PubMed] [Google Scholar]
- 4.Urban J.P., Hall A.C., Gehl K.A. Regulation of matrix synthesis rates by the ionic and osmotic environment of articular chondrocytes. J. Cell. Physiol. 1993;154:262–270. doi: 10.1002/jcp.1041540208. [DOI] [PubMed] [Google Scholar]
- 5.Urban J.P. The chondrocyte: a cell under pressure. Br. J. Rheumatol. 1994;33:901–908. doi: 10.1093/rheumatology/33.10.901. [DOI] [PubMed] [Google Scholar]
- 6.Maroudas A. Physico-chemical properties of articular cartilage. In: Freeman M.A.R., editor. Adult Articular Cartilage. Pitman Medical; London: 1979. pp. 215–290. [Google Scholar]
- 7.Freeman M.A.R., Kempson G.E. Load carriage. In: Freeman M.A.R., editor. Adult Articular Cartilage. Pitman Medical; London: 1973. pp. 228–246. [Google Scholar]
- 8.Hodge W.A., Fijan R.S., Mann R.W. Contact pressures in the human hip joint measured in vivo. Proc. Natl. Acad. Sci. USA. 1986;83:2879–2883. doi: 10.1073/pnas.83.9.2879. [DOI] [PMC free article] [PubMed] [Google Scholar]
- 9.Mow V.C., Gu W.Y., Chen F.H. Structure and function of articular cartilage and meniscus. In: Mow V.C., Huiskes R., editors. Basic Orthopaedic Biomechanics and Mechano-Biology. Lippincott Williams & Wilkins; Philadelphia: 2005. [Google Scholar]
- 10.Oswald E.S., Chao P.H., Hung C.T. Dependence of zonal chondrocyte water transport properties on osmotic environment. Cell Mol. Bioeng. 2008;1:339–348. doi: 10.1007/s12195-008-0026-6. [DOI] [PMC free article] [PubMed] [Google Scholar]
- 11.Bush P.G., Hall A.C. The volume and morphology of chondrocytes within non-degenerate and degenerate human articular cartilage. Osteoarthritis Cartilage. 2003;11:242–251. doi: 10.1016/s1063-4584(02)00369-2. [DOI] [PubMed] [Google Scholar]
- 12.Jones I.L., Klämfeldt A., Sandström T. The effect of continuous mechanical pressure upon the turnover of articular cartilage proteoglycans in vitro. Clin. Orthop. Relat. Res. 1982;165:283–289. [PubMed] [Google Scholar]
- 13.Bayliss M.T., Urban J.P., Holm S. In vitro method for measuring synthesis rates in the intervertebral disk. J. Orthop. Res. 1986;4:10–17. doi: 10.1002/jor.1100040102. [DOI] [PubMed] [Google Scholar]
- 14.Schneiderman R., Keret D., Maroudas A. Effects of mechanical and osmotic pressure on the rate of glycosaminoglycan synthesis in the human adult femoral head cartilage: an in vitro study. J. Orthop. Res. 1986;4:393–408. doi: 10.1002/jor.1100040402. [DOI] [PubMed] [Google Scholar]
- 15.Urban J.P., Bayliss M.T. Regulation of proteoglycan synthesis rate in cartilage in vitro: influence of extracellular ionic composition. Biochim. Biophys. Acta. 1989;992:59–65. doi: 10.1016/0304-4165(89)90050-0. [DOI] [PubMed] [Google Scholar]
- 16.Ohshima H., Urban J.P., Bergel D.H. Effect of static load on matrix synthesis rates in the intervertebral disc measured in vitro by a new perfusion technique. J. Orthop. Res. 1995;13:22–29. doi: 10.1002/jor.1100130106. [DOI] [PubMed] [Google Scholar]
- 17.Borghetti P., della Salda L., Borghetti A.F. Adaptive cellular response to osmotic stress in pig articular chondrocytes. Tissue Cell. 1995;27:173–183. doi: 10.1016/s0040-8166(95)80020-4. [DOI] [PubMed] [Google Scholar]
- 18.Hopewell B., Urban J.P. Adaptation of articular chondrocytes to changes in osmolality. Biorheology. 2003;40:73–77. [PubMed] [Google Scholar]
- 19.Hung C.T., LeRoux M.A., Valhmu W.B. Disparate aggrecan gene expression in chondrocytes subjected to hypotonic and hypertonic loading in 2D and 3D culture. Biorheology. 2003;40:61–72. [PubMed] [Google Scholar]
- 20.Erickson G.R., Alexopoulos L.G., Guilak F. Hyper-osmotic stress induces volume change and calcium transients in chondrocytes by transmembrane, phospholipid, and G-protein pathways. J. Biomech. 2001;34:1527–1535. doi: 10.1016/s0021-9290(01)00156-7. [DOI] [PubMed] [Google Scholar]
- 21.Erickson G.R., Northrup D.L., Guilak F. Hypo-osmotic stress induces calcium-dependent actin reorganization in articular chondrocytes. Osteoarthritis Cartilage. 2003;11:187–197. doi: 10.1053/s1063-4584(02)00347-3. [DOI] [PubMed] [Google Scholar]
- 22.Chao P.H., West A.C., Hung C.T. Chondrocyte intracellular calcium, cytoskeletal organization, and gene expression responses to dynamic osmotic loading. Am. J. Physiol. Cell Physiol. 2006;291:C718–C725. doi: 10.1152/ajpcell.00127.2005. [DOI] [PubMed] [Google Scholar]
- 23.Guilak F., Erickson G.R., Ting-Beall H.P. The effects of osmotic stress on the viscoelastic and physical properties of articular chondrocytes. Biophys. J. 2002;82:720–727. doi: 10.1016/S0006-3495(02)75434-9. [DOI] [PMC free article] [PubMed] [Google Scholar]
- 24.Chao P.G., Tang Z., Hung C.T. Dynamic osmotic loading of chondrocytes using a novel microfluidic device. J. Biomech. 2005;38:1273–1281. doi: 10.1016/j.jbiomech.2004.06.016. [DOI] [PubMed] [Google Scholar]
- 25.Oswald E.S., Chao P.H., Hung C.T. Chondrocyte nuclear response to osmotic loading. Conf. Proc. IEEE Eng. Med. Biol. Soc. 2006;1:3659–3661. doi: 10.1109/IEMBS.2006.259394. [DOI] [PubMed] [Google Scholar]
- 26.Finan J.D., Chalut K.J., Guilak F. Nonlinear osmotic properties of the cell nucleus. Ann. Biomed. Eng. 2009;37:477–491. doi: 10.1007/s10439-008-9618-5. [DOI] [PMC free article] [PubMed] [Google Scholar]
- 27.Albiez H., Cremer M., Cremer T. Chromatin domains and the interchromatin compartment form structurally defined and functionally interacting nuclear networks. Chromosome Res. 2006;14:707–733. doi: 10.1007/s10577-006-1086-x. [DOI] [PubMed] [Google Scholar]
- 28.Delpire E., Duchêne C., Gilles R. Effects of osmotic shocks on the ultrastructure of different tissues and cell types. Exp. Cell Res. 1985;160:106–116. doi: 10.1016/0014-4827(85)90240-x. [DOI] [PubMed] [Google Scholar]
- 29.Finan J.D., Leddy H.A., Guilak F. Osmotic stress alters chromatin condensation and nucleocytoplasmic transport. Biochem. Biophys. Res. Commun. 2011;408:230–235. doi: 10.1016/j.bbrc.2011.03.131. [DOI] [PMC free article] [PubMed] [Google Scholar]
- 30.Brown K.E., Guest S.S., Fisher A.G. Association of transcriptionally silent genes with Ikaros complexes at centromeric heterochromatin. Cell. 1997;91:845–854. doi: 10.1016/s0092-8674(00)80472-9. [DOI] [PubMed] [Google Scholar]
- 31.Croft J.A., Bridger J.M., Bickmore W.A. Differences in the localization and morphology of chromosomes in the human nucleus. J. Cell Biol. 1999;145:1119–1131. doi: 10.1083/jcb.145.6.1119. [DOI] [PMC free article] [PubMed] [Google Scholar]
- 32.Kosak S.T., Skok J.A., Singh H. Subnuclear compartmentalization of immunoglobulin loci during lymphocyte development. Science. 2002;296:158–162. doi: 10.1126/science.1068768. [DOI] [PubMed] [Google Scholar]
- 33.Reddy K.L., Zullo J.M., Singh H. Transcriptional repression mediated by repositioning of genes to the nuclear lamina. Nature. 2008;452:243–247. doi: 10.1038/nature06727. [DOI] [PubMed] [Google Scholar]
- 34.Lee D.A., Knight M.M. Mechanical loading of chondrocytes embedded in 3D constructs: in vitro methods for assessment of morphological and metabolic response to compressive strain. Methods Mol. Med. 2004;100:307–324. doi: 10.1385/1-59259-810-2:307. [DOI] [PubMed] [Google Scholar]
- 35.Sawae Y., Shelton J.C., Knight M.M. Confocal analysis of local and cellular strains in chondrocyte-agarose constructs subjected to mechanical shear. Ann. Biomed. Eng. 2004;32:860–870. doi: 10.1023/b:abme.0000030261.38396.c0. [DOI] [PubMed] [Google Scholar]
- 36.Ridler T.W., Calvard S. Picture thresholding using an iterative selection method. IEEE T Syst. Man. Cyb. 1978;8:630–632. [Google Scholar]
- 37.Abramoff M.D., Magalhaes P.J., Ram S.J. Image processing with ImageJ. Biophoton. Int. 2004;11:36–42. [Google Scholar]
- 38.Lee D.A., Knight M.M., Bader D.L. Chondrocyte deformation within compressed agarose constructs at the cellular and sub-cellular levels. J. Biomech. 2000;33:81–95. doi: 10.1016/s0021-9290(99)00160-8. [DOI] [PubMed] [Google Scholar]
- 39.Sobel I. Neighborhood coding of binary images for fast contour following and general binary array processing. Comput. Vision Graph. 1978;8:127–135. [Google Scholar]
- 40.Lam L., Lee S.W., Suen C.Y. Thinning methodologies—a comprehensive survey. IEEE T Pattern Anal. 1992;14:869–885. [Google Scholar]
- 41.Prewitt J.M., Mendelsohn M.L. The analysis of cell images. Ann. N. Y. Acad. Sci. 1966;128:1035–1053. doi: 10.1111/j.1749-6632.1965.tb11715.x. [DOI] [PubMed] [Google Scholar]
- 42.Mulchrone K.F., Choudhury K.R. Fitting an ellipse to an arbitrary shape: implications for strain analysis. J. Struct. Geol. 2004;26:143–153. [Google Scholar]
- 43.Reiter G., Strobl G.R. Springer; Berlin: 2007. Progress in Understanding of Polymer Crystallization. [Google Scholar]
- 44.Discher D.E., Boal D.H., Boey S.K. Simulations of the erythrocyte cytoskeleton at large deformation. II. Micropipette aspiration. Biophys. J. 1998;75:1584–1597. doi: 10.1016/S0006-3495(98)74076-7. [DOI] [PMC free article] [PubMed] [Google Scholar]
- 45.Bush P.G., Hall A.C. Regulatory volume decrease (RVD) by isolated and in situ bovine articular chondrocytes. J. Cell. Physiol. 2001;187:304–314. doi: 10.1002/jcp.1077. [DOI] [PubMed] [Google Scholar]
- 46.Tolun G., Myers R.S. A real-time DNase assay (ReDA) based on PicoGreen fluorescence. Nucleic Acids Res. 2003;31:e111. doi: 10.1093/nar/gng111. [DOI] [PMC free article] [PubMed] [Google Scholar]
- 47.Martins R.P., Platts A.E., Krawetz S.A. Tracking chromatin states using controlled DNase I treatment and real-time PCR. Cell. Mol. Biol. Lett. 2007;12:545–555. doi: 10.2478/s11658-007-0024-z. [DOI] [PMC free article] [PubMed] [Google Scholar]
- 48.Knight M.M., Idowu B.D., Bader D.L. Temporal changes in cytoskeletal organization within isolated chondrocytes quantified using a novel image analysis technique. Med. Biol. Eng. Comput. 2001;39:397–404. doi: 10.1007/BF02345297. [DOI] [PubMed] [Google Scholar]
- 49.Idowu B.D., Knight M.M., Lee D.A. Confocal analysis of cytoskeletal organization within isolated chondrocyte sub-populations cultured in agarose. Histochem. J. 2000;32:165–174. doi: 10.1023/a:1004095207330. [DOI] [PubMed] [Google Scholar]
- 50.Pajerowski J.D., Dahl K.N., Discher D.E. Physical plasticity of the nucleus in stem cell differentiation. Proc. Natl. Acad. Sci. USA. 2007;104:15619–15624. doi: 10.1073/pnas.0702576104. [DOI] [PMC free article] [PubMed] [Google Scholar]
- 51.Finan J.D., Guilak F. The effects of osmotic stress on the structure and function of the cell nucleus. J. Cell. Biochem. 2010;109:460–467. doi: 10.1002/jcb.22437. [DOI] [PMC free article] [PubMed] [Google Scholar]
- 52.Mazzanti M., Bustamante J.O., Oberleithner H. Electrical dimension of the nuclear envelope. Physiol. Rev. 2001;81:1–19. doi: 10.1152/physrev.2001.81.1.1. [DOI] [PubMed] [Google Scholar]
- 53.Dmitrieva N.I., Burg M.B. Analysis of DNA breaks, DNA damage response, and apoptosis produced by high NaCl. Am. J. Physiol. Renal Physiol. 2008;295:F1678–F1688. doi: 10.1152/ajprenal.90424.2008. [DOI] [PMC free article] [PubMed] [Google Scholar]
- 54.Jäckle T., Hasel C., Möller P. Sustained hypoosmotic stress induces cell death: apoptosis by defeat. Am. J. Physiol. Cell Physiol. 2001;281:C1716–C1726. doi: 10.1152/ajpcell.2001.281.5.C1716. [DOI] [PubMed] [Google Scholar]
- 55.Irianto, J., R. P. Martins, …, D. A. Lee. 2013. The effect of osmotic challenge on levels of chromatin condensation and histone expressions in chondrocyte. In Orthopedic Research Society 2013 Annual Meeting. San Antonio, TX.
- 56.Bell A.C., Felsenfeld G. Methylation of a CTCF-dependent boundary controls imprinted expression of the Igf2 gene. Nature. 2000;405:482–485. doi: 10.1038/35013100. [DOI] [PubMed] [Google Scholar]
- 57.Vogelmann J., Valeri A., Nollmann M. Roles of chromatin insulator proteins in higher-order chromatin organization and transcription regulation. Nucleus. 2011;2:358–369. doi: 10.4161/nucl.2.5.17860. [DOI] [PMC free article] [PubMed] [Google Scholar]
Associated Data
This section collects any data citations, data availability statements, or supplementary materials included in this article.