Abstract
Purpose
Iontophoretic mediated transdermal delivery of ferric pyrophosphate (FPP) in combination with microneedle pretreatment was investigated as a potential treatment for iron deficiency anemia (IDA).
Methods
In vitro transdermal delivery studies were performed using hairless rat skin and pharmacodynamic studies were performed in hairless anemic rat model. The hematological and biochemical parameters like hemoglobin, hematocrit and % serum transferrin were monitored in rats at healthy, anemic condition and post treatment. Micropores created by the microneedles were visualized in histological skin sections after staining with hemotoxylin and eosin. The recovery of micropores was investigated in vivo by measuring Transepidermal water loss (TEWL) at different time points.
Results
The passive, microneedle and iontophoresis mediated delivery did not lead to significant improvement in hematological and biochemical parameters in anemic rats, when used individually. When iontophoresis (0.15 mA/cm2 for 4 hours) was combined with microneedle pretreatment (for 2 minutes), therapeutically adequate amount of FPP was delivered and there was significant recovery of rats from IDA.
Conclusions
Microneedle and iontophoresis mediated delivery of iron via transdermal route could be developed as a potential treatment for IDA. The transdermal controlled delivery of iron could become a potential, safe and effective alternative to parenteral iron therapy.
Keywords: Iron deficiency anemia, ferric pyrophosphate, iontophoresis, microneedle, hematology, oxidative stress, noninvasive
Introduction
Iron is an essential trace element for cell growth in human body (1). Most of the body iron circulates as hemoglobin and functions as carrier of oxygen from lungs to tissues. Iron is also a part of many enzymes in the physiological system and involves in the cell proliferation and oxidation-reduction reactions (2, 3). Iron deficiency (ID) develops when body iron is not adequate to meet the physiological needs for growth and development. Iron deficiency anemia (IDA) is caused by dietary deprivation and/or poor absorption of iron or may occur due to chronic blood loss. An estimated 2 billion people are suffering from iron deficiency and IDA worldwide with the majority from developing countries (4, 5). IDA can affect the length and quality of life in patients and can increase morbidity and mortality; more so in combination with other chronic conditions like renal failure. IDA is the most common prevalent nutritional deficiency disease among children especially in premature or low birth weight babies and in menstruating, pregnant and lactating women. IDA is associated with growth retardation and cognitive development in children. IDA, if uncorrected leads to diminished work productivity and behavioral problems in adults (6, 7). Iron is essential for normal development of the immune system and IDA can be aggravated by presence of infectious diseases and vice versa (8, 9). Menstruating women lose 1- 2.5 mg of iron per day on an average through menstrual blood loss. The demand for iron increases several folds in pregnant women to meet the requirements of red blood cell mass expansion and unidirectional transfer of iron from mother to developing fetus (10).
Delivering therapeutically adequate amounts of iron to treat IDA still remains a challenge due to the adverse effects associated with oral and parenteral iron preparations. Oral iron formulations are the choice for first line therapy to replenish body iron stores. But gastric intolerance and poor adherence of the oral therapy by some patients are the common disadvantages associated with it (11). Moreover, oral iron supplements have limitations in IDA treatment because of the poor absorption of iron from gut especially in case of chronic intestinal bleeding. Intravenous bolus iron injection is indicated in such patients with intestinal malabsorption and they are also considered to be superior to replenish large quantities of iron where the ongoing iron losses exceed the absorptive capacity of oral iron. Intravenous bolus iron therapy is also associated with significant side effects like hypotension, arthralgias, and severe allergies and may cause anaphylactic reactions in case of iron overload (12). Therefore, intravenous infusions are preferred over frequent bolus injections. However, intravenous infusion is invasive and associated with high treatment cost. Therefore, there exists an indispensable need for alternative routes of drug delivery for iron compounds and in this direction, transdermal delivery of iron was explored in the past using ferric pyrophosphate (FPP) as a model iron source (13). Transdermal drug delivery was anticipated to be a safer alternative technique to deliver iron compounds because the slow and prolonged delivery of iron could minimize the chances of over saturation of transferrin and iron overload significantly (14). FPP (~log Kstab 22.3), was found to be safe for administration as slow dialysate in maintenance hemodialysis patients (15). Passive delivery of FPP was not successful due to poor permeation properties of FPP due to high molecular weight and hydrophilicity. Therefore, the feasibility of delivery of FPP via transdermal route using iontophoresis termed “Irontophoresis” was explored in the past. Earlier studies have demonstrated the relationship between the electrical dose and amount of FPP delivered by iontophoresis (13). Further, in this direction the effect of microporation combined with iontophoresis was investigated as a potential mode of treatment for IDA.
Materials and Methods
Chemicals
Soluble Ferric pyrophosphate was obtained from Sigma-Aldrich Inc (St. Louis, MO). Phosphate buffered saline (PBS, pH 7.4) premixed powder was obtained from EMD Chemicals (Gibbstown, NJ). Hydroxypropyl methyl cellulose (Methocel® E15 premium LV) was obtained from Dow chemical company (Midland, MI). Ferrover® iron was purchased from Hach Company (Loveland, OH). Serum iron & TIBC kit was procured from Cliniqa Corporation (San Marcos, CA). Lipid peroxidation assay kit (OXI-TEK TBARS assay) was obtained from Enzo Life Sciences (Farmingdale, NY). All other chemicals and solvents used were of pure grade obtained from Fischer scientific (Fairway, NJ).
Experimental animals and preparation of skin
Male hairless rats (Charles River, Wilmington, MA, USA) were used in both in vitro and in vivo experimental studies. The animal studies were approved by the Institutional Animal Care and Use Committee (IACUC) at the University of Mississippi (Protocol # 10-013). All the animals were of eight weeks old and weighing between 250–300 g at the time of arrival. The animals were housed in conventional cages and 12 hour day/light cycles were maintained in the facility. For the preparation of rat skin, the animals were asphyxiated with CO2 and the abdominal skin was excised, subcutaneous fat was removed and the obtained skin pieces were cleaned carefully with normal saline. The rat skin was used on the same day for all in vitro experiments.
Preparation of Hydroxypropyl methyl cellulose (HPMC) gel incorporated with FPP
FPP solution was prepared by dissolving 50 mg of soluble FPP in 1 ml of distilled water and pH was adjusted to 5 using 1 N hydrochloric acid (HCl). HPMC (4% w/v) gel was prepared according to the standard protocol given by the polymer manufacturer; briefly by mixing the hot polymeric aqueous solution to the cold solution of FPP to give a final concentration of 50 mg/ml of drug in the gel.
Microneedles
AdminPen 600 stainless steel microneedles (nanoBioScience LLC. Alameda, CA) having an area of 1cm2 containing 187 microneedles with a needle height of 500 μm were used in all in vitro and in vivo studies.
General experimental set up
Vertical Franz diffusion cell (PermeGear Inc., Hellertown, PA) set up was used to investigate the permeation of FPP across rat skin. The rat skin was sandwiched between the donor and receiver compartment of Franz diffusion cell in such a way that dermal side of skin was in contact with receiver compartment and stratum corneum was facing the donor compartment of the cell. The active diffusion area was 0.64 cm2. Electrical resistance across the skin was used to check the integrity of the barrier. For this set up, Ag/Agcl wires (Alfa-Aesar, Ward hill, MA) made in the form of circular rings and arranged at a distance of 2 mm from skin in both donor and receiver compartment. The donor and receiver compartments were filled with 0.5 ml and 5 ml of PBS having a pH of 7.4 and allowed to equilibrate for one hour. The AC electrical resistance of the skin (Rs) was measured by placing a load resistor RL (100 kΩ) in series with the skin as reported previously (16). The voltage drop across the whole circuit (V0) and across the skin (Vs) was measured using an electrical set up consisting of a wave form generator and a digital multimeter (Agilent Technologies, Santa Clara, CA). Skin resistance was measured by applying a voltage of 100 mV at 10 Hz in the electric setup. Skin pieces maintaining a resistance of ≥20 kΩ /cm2 only were considered for permeation studies.
In vitro drug permeation studies
Passive permeation
After measuring electrical resistance of the skin, the PBS in the donor compartment of the Franz diffusion cell was replaced with 0.5 ml of FPP aqueous solution (50 mg/ml, pH-5) and receiver compartment was filled with 5 ml of PBS adjusted to pH-5 using 1 N hydrochloric acid. During in vitro drug permeation studies, the temperature of receiver compartment was maintained at 37±1°C by water circulation. Permeation studies were carried out for 6 hours and 1 ml of sample was withdrawn from receiver compartment at every hour time point and replaced with fresh buffer solution. The amount of drug permeated was analyzed using Ferrover® iron reagent, using Lambda EZ201 UV spectrophotometer (Perkin Elmer, Waltham, MA) at 510 nm.
Iontophoretic delivery
Cathodal iontophoresis was carried out using Phoresor® iontophoresis unit (Iomed, Salt Lake City, UT) at 0.3 mA/cm2 for 6 hours. The electrodes made up of Ag/AgCl were connected with the lead clips from Phoresor® Unit. Donor chamber was filled with 0.5 ml of FPP aqueous solution and receiver with PBS adjusted to pH-5 using 1 N hydrochloric acid. One ml samples were collected at each hour interval and analyzed for FPP.
Drug permeation studies after pretreatment with microneedles
The rat skin was pretreated with microneedles for 2 minutes and the skin was mounted carefully on Franz diffusion cell and continued with either passive permeation studies or iontophoretic mediated drug delivery (0.3 mA/cm2) as described in passive permeation and iontophoretic delivery sections respectively. Microneedles were inserted into the skin with the thumb, each time with uniform force by same individual to avoid variability in the depth of skin penetration.
Visualization of micropores
The depth of penetration of microneedles was visualized by staining the histological section of the microneedle pretreated skin with hematoxylin and eosin. Freshly excised skin was microporated with the microneedles for 2 minutes. Small skin samples with micropores were fixed in optimum cutting temperature (OCT) medium (Tissue-Tek®) and frozen in dry ice bath and sectioned at 50 μm on a Leica 1800 cryostat. The obtained skin specimens were stained with hematoxylin and eosin stain and observed under high resolution light microscope (Axiolab, A1, Carl Zeiss, USA) at 10X magnification to visualize depth of penetration of microneedles into different layers of skin. Images were captured using a Carl Zeiss camera attached to the microscope.
In vivo studies
In vivo experimental studies were carried out in hairless rats. The rats were acclimated to the vivarium conditions for one week with regular standard diet. Blood samples were drawn from all animals by retro orbital bleeding and analyzed for hematological and biochemical parameters. Initially 200 μl of blood samples were collected in EDTA (ethylenediaminetetraacetic acid) coated Microvette® tubes (Sarstedt, Newton, NC) and 0.5 ml of blood was collected into 1.5 ml centrifuge tubes (Eppendorf, Hauppauge, NY) from all animals. The blood sample collected into EDTA tubes were analyzed for the hematologic parameters like hemoglobin (Hb), Red blood cell (RBC) count, Hematocrit (Hct), Mean corpuscular volume (MCV), Mean corpuscular hemoglobin (MCH), mean corpuscular hemoglobin concentration (MCHC) and red blood cell distribution width (RDWc) using VetScan HM2 hematology system (Abaxis Inc., Union city, CA) (figure 1). Serum was separated from the blood samples collected into centrifuge tubes after centrifugation at 3000 rpm for 10 minutes and analyzed for biochemical parameters. The serum iron, total iron binding capacity of serum and % transferrin saturation (%TS) was calculated using serum iron & TIBC kit (Cliniqa Corporation, San Marcos, CA). Serum lipid peroxidation values were also calculated using OXI-TEK TBARS assay kit (Enzo Life Sciences Inc., Farmingdale, NY). The base line values for all of these parameters in the healthy animals were recorded.
Figure 1.
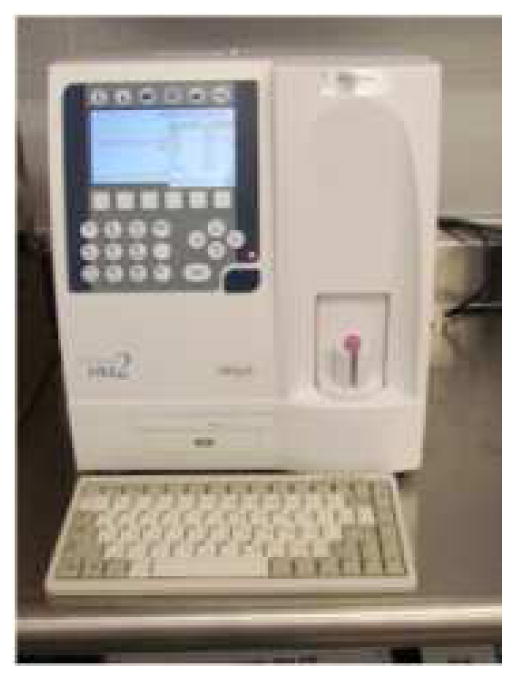
VetScan HM2 Hematology system (Curtsey: Abaxis Inc., Union city, CA)
Induction of iron deficiency anemia
Rats were fed on custom made purified low iron diet having iron concentration as low as 2–6 ppm (Harlan laboratories, Madison, WI) till the end of study period. The composition of the diet was in accordance with AIN-76A guidelines with all vitamin and mineral mix except cellulose and iron in it. Rats were allowed free access to this diet and water all the time. The degree of iron deficiency was monitored by measuring the hematologic parameters (hemoglobin and hematocrit) of blood every week for 5 weeks. Induction of iron deficiency anemia was confirmed after five weeks by measuring all hematologic parameters and biochemical parameters.
In vivo delivery of FPP
FPP treatment was initiated, after confirming that the rats were anemic. Rats were divided randomly into the following 6 groups (n=6) and FPP was administered to animals in different groups as described below. All the in vivo transdermal studies were carried out on alternative days for 4 hours under ketamine (80 mg/kg) and xylazine (10mg/kg) anesthesia administered intraperitoneally. Transdermal patch having an area of 10 cm2 was applied in all groups except group 6 as specified below. FPP was administered transdermally for 4 weeks in groups 2, 3, 4 & 5. Group 6 animals were administered with FPP intraperitoneally.
Group 1: Placebo group
A placebo patch (HPMC gel patch with no FPP incorporated) was placed on the rats for 4 hours.
Group 2: FPP-Passive group
In case of passive delivery, a patch containing FPP-HPMC gel (500 mg) was applied on the back of rat. No current was applied and the FPP was allowed to permeate passively.
Group 3: Iontophoresis group (IN)
For iontophoretic delivery, a custom made iontophoretic patch was prepared using an adhesive 3M™ foam tape (3M Drug Delivery Systems, St. Paul, MN) fitted with a snap type Ag/Agcl electrode. FPP-HPMC gel was loaded on to the patch and secured on the back of the rat’s body and cathodal iontophoresis was applied at a current strength of 0.15 mA/cm2.
Group 4: Microneedle group (MN)
Rats were pretreated with microneedles for 2 minutes using 1 cm2 array over a total area of 10 cm2. Precautions were taken to avoid overlapping of microporation by marking the already pretreated areas. FPP gel patch was applied immediately after pretreatment and permeation studies were initiated.
Group 5: Microneedle + iontophoresis (MN+IN) group
In the MN + IN group, rats were pretreated with microneedles for 2 minutes and cathodal iontophoresis was applied as described above after applying a custom made iontophoretic patch.
Group 6: Intraperitoneal (IP) group
FPP was dissolved in normal saline to give a concentration of 10 mg/ml. Rats were administered with 0.11 ml of this solution via intraperitoneal route for 3 weeks. This group served a positive control for the study.
Blood samples were withdrawn intermittently and at the end of study period from all animals by retro orbital bleeding and all hematologic and biochemical parameters were analyzed.
Recovery of micropores
In a different set of experiment, the TEWL was measured using Vapometer (Delfin Technologies, Kuopio, Finland) in vivo on hairless rat skin after pretreatment with microneedles to check the effect of microneedles on skin and the recovery of barrier property of skin. The TEWL of rat skin before and after pretreatment with microneedles was measured at different time points.
Red blood cell Morphology
Visualization of RBC under high resolution microscopy was performed to study the morphology of RBC of healthy, anemic and treated animals in all groups. Briefly, peripheral blood smear was prepared by wedge slide method using a drop of venous blood collected from healthy, anemic and treated animals. The dried smears were stained with Wright-Giemsa stain and the red cells were visualized under high resolution light microscope (Axiolab A1, Carl Zeiss, USA) at 100x magnification using oil immersion technique. Images were captured using Carl Zeiss camera attached to the microscope.
Statistical analysis
GraphPad InStat 3 software was used for statistical analysis. Unpaired t-test was used to determine the level of significance for correlations between parameters at healthy and anemic conditions and between anemic condition and post treatment condition in all groups. A significance level of p < 0.05 was considered as statistically significant.
Results & Discussion
In vitro transdermal delivery of FPP
The in vitro transdermal passive flux of FPP across hairless rat skin was 1.16 ± 0.16 μg/cm2/h. Soluble FPP is hydrophilic in nature and has a molecular weight of 745 Da, which are likely the reasons for poor passive permeation of FPP. The ability of chemical permeation enhancers as well as the electrical techniques on the transdermal permeation of FPP was assessed in the past (13, 17). These studies suggested that the transdermal delivery of FPP by iontophoresis could be significantly enhanced when the stratum corneum barrier is compromised. Based on previous observations, the present study was planned to investigate the effect of microporation on the passive and iontophoretic delivery of FPP across the skin. The in vitro transdermal transport profile of FPP across rat skin by different modes of delivery is shown in figure 2.
Figure 2.
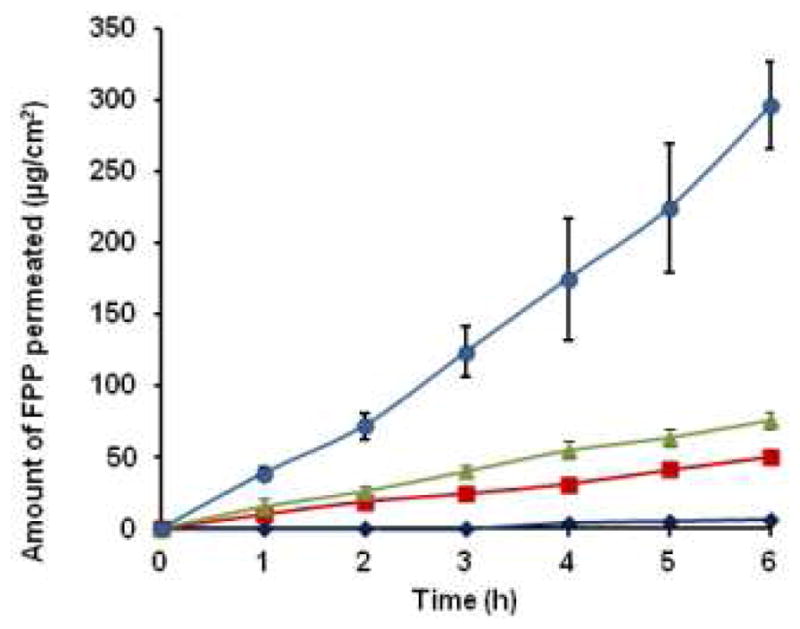
The cumulative amount of FPP permeated across rat skin in case of passive (
 ), iontophoresis (IN) (
 ), microneedle pretreatment (MN) (
 ) and combination of microneedle pretreatment with iontophoresis (MN+IN) (
 ). The data points represented are the average of n= 3 ± S.D.
Successful transdermal delivery of certain hydrophilic compounds and high molecular weight peptide drugs using combination of microneedle pretreatment with iontophoresis has been demonstrated by various groups (18, 19). Both iontophoresis and microneedle treatment are active transdermal drug delivery techniques that enable drugs to permeate across the skin. Iontophoresis utilizes low density electric current to drive charged drugs across the skin. Microneedles create micropores in the startum corneum of the skin and allow drugs to permeate into deeper layers (20). The microneedles used in this study were able to penetrate down to an average depth of 70 ± 10 μm into the skin. The micropores created by microneedles were visualized in the skin sections stained with hematoxylin and eosin which is shown in figure 3. The picture clearly indicated that the microneedles penetrated only through the upper layers of the epidermis. The in vitro flux of FPP after microneedle (MN) pretreatment alone was 12.36 ± 0.16 μg/cm2/h and after iontophoresis (IN) alone was 8.04 ± 0.24 μg/cm2/h which are ~11 fold and ~ 8 fold enhancements compared to the passive flux of FPP respectively. These results from the present iontophoretic drug delivery studies were in accordance with the past results obtained by Murthy et al (13). In case of combination of microneedle pretreatment along with cathodal iontophoresis (MN+IN), there was ~ 44 fold enhancement in the flux (51.24 ± 7.55 μg/cm2/h) over passive permeation. In a separate set of studies, in vitro permeation studies of FPP from HPMC gel across rat skin were performed with MN+IN treatment and the resulting flux was almost the same (~50.45 ± 5.62 μg/cm2/h) as with FPP solution. At this flux, a cumulative dose of ~ 0.3 mg of FPP would be delivered in six hours. Therefore, in case of in vivo studies, cathodal iontophoresis was applied using a current strength of 0.15 mA/cm2 for 4 hours after pretreatment with microneedles on alternative days to deliver the required dose of FPP (1.1 mg of FPP ≈ 0.12 mg of elemental iron).
Figure 3.
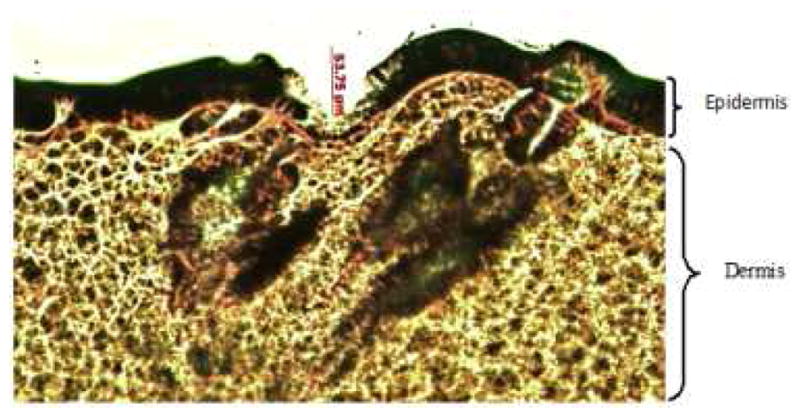
Histological section of skin treated with microneedles and stained with hematoxylin and eosin stain shown at 10x magnification. The epidermis and dermal layers were shown clearly in this picture.
In vivo studies
Recovery of micropores
In the present study, the duration for the recovery of micropore created with microneedles was investigated by measuring TEWL. Immediately following pretreatment with microneedles, there was an increase in TEWL of skin from 13.6 ± 1.42 g/m2.h to 28.75 ± 2.68 g/m2.h owing to micropore formation and the values returned to normal (14.1 ± 2.22 g/m2.h) within 8–12 hours (figure 4). This study suggests that the skin barrier remains in the compromised state through at least 8 hours even in unoccluded condition. On the other hand, the recovery of skin barrier is almost complete within 8–12 hours after removal of the patch/device. One should recall here that earlier studies have clearly shown that the pores reseal relatively faster in case of non-occluded condition than when occluded (21, 22).
Figure 4.
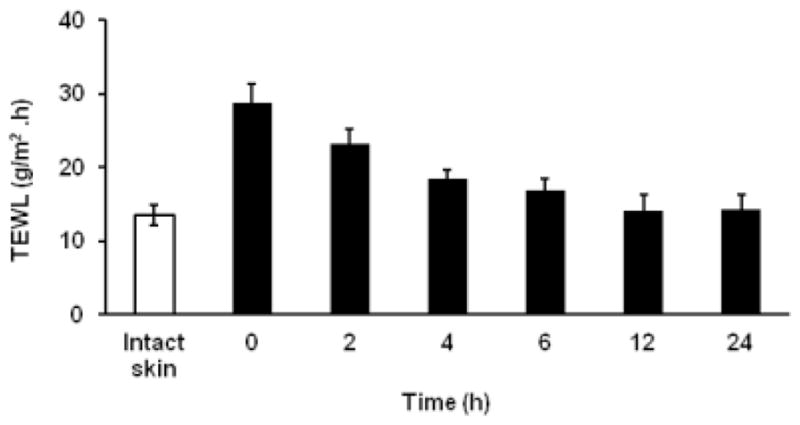
The In vivo TEWL measurements after microporation at different time points. The unfilled bar (□) represents the TEWL of intact skin before microporation. The data points represented are the average of n= 6 ± S.D.
Induction of anemia and diagnosis
Various conventional laboratory tests are available for successful diagnosis of iron deficiency anemia. In the present work, hematologic and biochemical parameters were assessed to confirm the induction of anemia and recovery following transdermal FPP treatment. The custom made purified low iron diet contains only trace quantities of iron (~ 4 ppm). After five weeks on this diet, there was a significant difference in the hematological parameters of the animals compared to basal values indicating induction of anemia. There was decrease in hemoglobin concentration and MCV along with other red blood indices. The serum iron and % transferrin saturation also decreased, whereas the TIBC values increased in anemic condition. The observed hematological parameters and biochemical parameters in healthy and anemic rats are shown in table I.
Table I.
Observed mean hematological and biochemical parameters in rats at healthy state (prior to iron free diet plan) and at anemic condition
| Parameter | Basal values | Anemic condition |
|---|---|---|
| Hematological parameters | ||
| Hemoglobin (g/dl) | 14.31 ± 2.47 | 10.58 ± 1.61† |
| HCT (%) | 41.35 ± 8.33 | 32.4 ± 3.72† |
| MCV (fl) | 56.25 ± 2.12 | 38 ± 2.86††† |
| MCH (pg) | 19.56 ± 1.57 | 12.4 ± 1.22††† |
| MCHC (g/dl) | 34.83 ± 1.61 | 28.22 ± 2.24†† |
| RBC (1012/l) | 8.40 ± 0.83 | 6.61 ± 0.75† |
| RDWc (%) | 16.71 ± 2.22 | 28.33 ± 2.73††† |
| Biochemical parameters | ||
| Serum Iron (μg/dl) | 179.53 ± 15.84 | 83.46 ± 17.02††† |
| TIBC ((μg/dl) | 374.86 ± 56.33 | 483.84 ± 57.91† |
| % TS | 46.28 ± 7.04 | 16.59 ± 2.11†† |
| Lipid peroxidation [equivalent to MDA conc (nmol/ml)] | 8.58 ± 1.72 | 14.51 ± 3.92† |
The difference in all parameters in rats between healthy (basal values) and anemic conditions is statistically significant.
p<0.05
p<0.001
p<0.0001
Measurement of hemoglobin concentration and hematocrit are considered to be most appropriate indicators of IDA. Even the most common definitions of anemia by WHO and CDC are based on the levels of hemoglobin. The mean basal hemoglobin value of the rats at healthy state was 14.31 ± 2.47 g/dl, decreased to 10.58 ± 1.61 g/dl (p = 0.01) at anemic condition and the mean % hematocrit value decreased from 41.35 ± 8.33 % to 32.4 ± 3.72 % (p = 0.03). A decrease in hemoglobin level implies the decrease in amount of functional iron that is circulating in the blood. Hematocrit indicates the proportion of whole blood occupied by the red blood cells and depends on the hemoglobin concentration in red blood cells (23). MCV is the average volume of a single red blood cell and it serves as an important diagnostic tool in the differential diagnosis of anemia. Anemia is classified as macrocytic (increased MCV), normocytic (normal MCV) or microcytic (decreased MCV) on the basis of MCV. Iron deficiency usually associated with microcytic anemia and decrease in MCV is one of the specific indicators for iron-deficiency anemia (23). There was a difference in mean MCV about 14.15 ± 0.74 fl from healthy to anemic state, in the rats. There was a reduction in mean RBC count from 8.4 ± 0.83 × 10¹²/l to 6.61 ± 0.75 × 10¹²/l (p = 0.002). Red blood cells play a crucial role in the support of tissue metabolism and enough RBC must be available to maintain tissue oxygenation and sustain a normal acid-base balance in the system (24). MCH and MCHC values indicate the average amount and concentration of hemoglobin in red blood cells. MCHC is also an important parameter that gives information about cellular hydration status and the values usually decrease in IDA (hypochromia). There was a 7.16 ± 0.35 pg difference in the mean MCH and 6.61 ± 0.6 g/dl in the mean MCHC between healthy and anemic conditions in rats. The RDWc measures the variation in red blood cell size and the mean values at healthy condition were 16.71 ± 2.22%, increased to 28.33 ± 2.73 % at anemic condition (p < 0.0001), which might be due to the production of increased number of smaller RBCs due to iron deficiency. The increase in RDWc along with decrease in MCV is a precise diagnostic characteristic of iron deficiency anemia (24). In this study a peripheral smear with microcytic and hypochromic erythrocytes shown in figure 5b clearly confirms this aspect.
Figure 5.
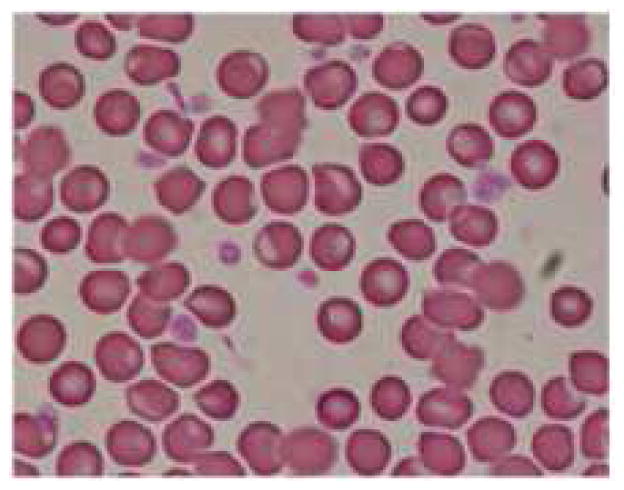
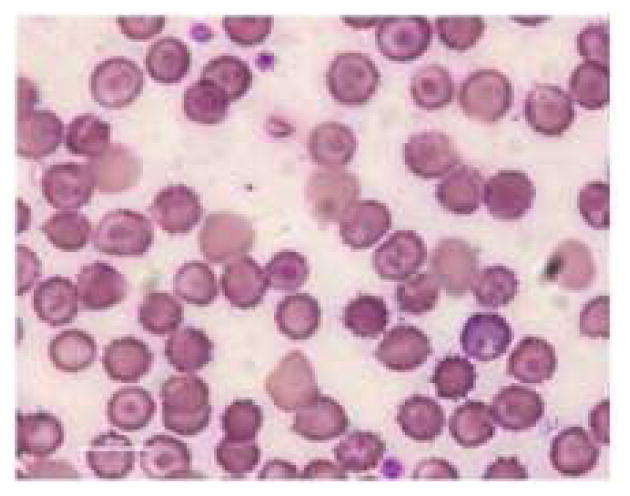
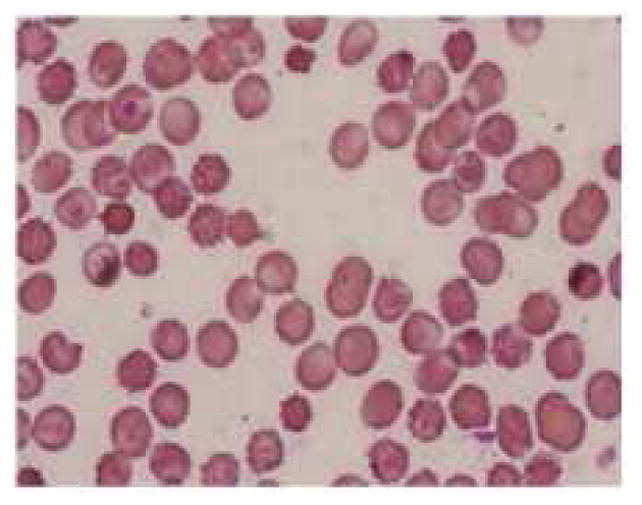
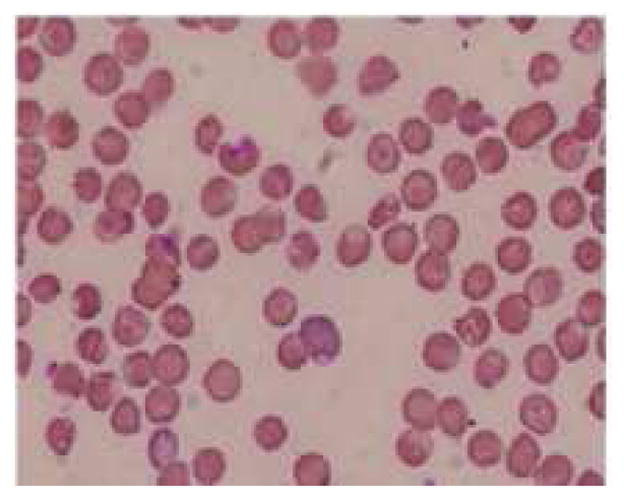
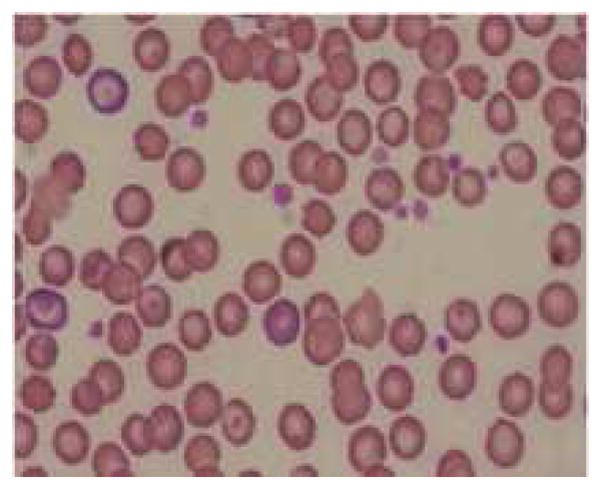
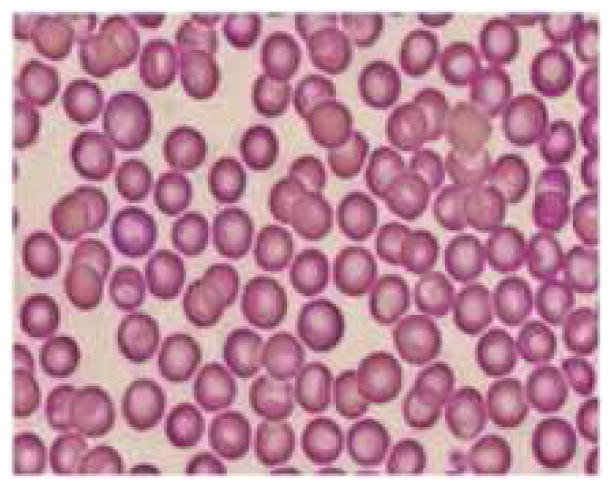
Representative pictures of morphology of RBCs (a) RBCs in healthy rats (b) RBCs of anemic rats (Microcytic and hypochromic RBC shown with ↑ marks) (c) RBCs in group 3 administered with FPP by iontophoresis (IN) (d) RBCs in rats administered with FPP following microneedle (MN) pretreatment (group 4) (e) RBCs of the rats administered with FPP using combination of iontophoresis and microneedle pretreatment (MN+IN) (group 5) and (f) RBCs of rats that received FPP through IP injection (group 6).
The serum iron concentration values decreased from 179.53 ± 15.84 μg/dl to 83.46 ± 17.02 μg/dl (p <0.0001) and TIBC values increased from 374.86 ± 56.33 μg/dl to 483.84 ± 57.91 μg/dl (p=0.008) after feeding the rats with custom made low iron diet. Serum iron concentration is a measure of the total amount of iron in the serum bound to transferrin. Transferrin is an iron transport protein, which carry iron to the bone marrow. Measurement of serum iron concentration alone might not be a useful indicator in the diagnosis of IDA because of its low sensitivity. Moreover, many factors could affect the serum iron concentration such as a meal, presence of infections or inflammations and existence of diurnal variations. TIBC measures the total amount of iron needed to saturate serum transferrin. %TS is a ratio of serum iron concentration and TIBC. TIBC and transferrin saturation (% TS) reflects the extent of vacant iron-binding sites on transferrin. In the present experiment, the mean %TS value in rats at healthy state was 46.28 ± 7.04, which decreased to 16.59 ± 2.11 (p < 0.001) in anemic condition.
Oxidative stress arises due to an imbalance between the formation and neutralization of pro oxidants which in turn leads to lipid peroxidation. Previously some researchers reported higher lipid peroxide levels in anemic condition. On the other hand, there are some conflicting reports as well which showed lower or unchanged lipid peroxide levels in anemic condition (25–28). In the present study, the lipid peroxide level in anemic and treated animals were determined using an in vitro diagnostic kit, which measures the increase in thiobarbituric acid reactive substances (TBARS) due to oxidative stress. In this test TBARS are expressed in terms of malondialdehyde (MDA) equivalents and the mean concentration of MDA in blood was 8.58 ± 1.72 nmol/ml at healthy condition. There was a significant improvement (p=0.0068) in MDA concentration to 14.51 ± 3.92 nmol/ml at anemic condition, which agrees with reports that explain the generation of lipid peroxides in case of IDA. According to numerous scientific reports, various physiological mechanisms might be responsible for the development of oxidative stress and lipid peroxidation in anemic animal models (29–31). The main reason for this observation was speculated to be due to accumulation of free copper in liver cells or increase in the triglycerides concentration and increased fragility of mitochondrial membranes (28, 32). Balagopalakrishna et al (33) and Nagababu et al (34) demonstrated that the increase in oxidative stress of RBC might be due to decrease in the oxygenation of hemoglobin and resultant increase in auto oxidation of hemoglobin, which further causes the generation of methemoglobin and superoxides.
Transdermal delivery of FPP in vivo
The anemic rats were segregated into different groups based on the mode of delivery and the FPP was administered for four weeks. The hemoglobin and hematocrit were measured intermittently during the treatment to assess the improvement. There was no significant improvement in the hematologic parameters in case of placebo group and passive treatment groups (group 1 and 2 respectively). Rats in both of these groups had rather turned more anemic likely because of negligible iron supplementation. Inevitably, the treatment was terminated after two weeks in case of group 1 and 2. In vitro, cathodal iontophoresis and microneedles were found to enhance the delivery of FPP considerably. However, in vivo, there was no significant improvement in hematologic parameters (Table II) or morphology of RBC in groups 3 & 4 (figure 5c, 5d), again indicating that the amount of FPP delivered in these groups was sub therapeutic.
Table II.
The mean hematologic and biochemical parameters observed at the end of treatment period in rats administered with FPP via different modes of administration.
| Parameter | IN | MN | MN+IN* | IP |
|---|---|---|---|---|
| Hematological parameters | ||||
| Hemoglobin (g/dl) | 10.42 ± 1.11 | 10.55 ± 0.9 | 13.12 ± 0.6† | 14.37 ± 0.41† |
| HCT (%) | 34.62 ± 2.45 | 28.67 ± 1.52 | 40.18 ± 4.24† | 42.0 ± 1.30†† |
| MCV (fl) | 39.2 ± 1.93 | 40.2 ± 1.4 | 46.45 ± 4.39† | 46 ± 1.73†† |
| MCH (pg) | 11.1 ± 1.16 | 13.14 ± 2.21 | 15.32 ± 2.51† | 15.8 ± 0.62† |
| MCHC (g/dl) | 30 ± 1.21 | 30.8 ± 2.44 | 32.9 ±1.39† | 34.3 ± 0.43† |
| RBC (1012/l) | 7.05 ± 1.01 | 6.99 ± 1.10 | 7.72 ± 0.3† | 9.11 ± 0.15† |
| RDWc (%) | 25.73 ± 2.24 | 24.71 ± 3.43 | 22.58 ± 2.9† | 19.47 ± 2.23†† |
| Biochemical parameters | ||||
| Serum Iron (μg/dl) | 102.74 ± 10.22† | 109.52 ± 14.2† | 124.7± 8.8†† | 139.53 ± 13.6††† |
| TIBC ((μg/dl) | 405.43 ± 21.67† | 399.5 ± 32.7† | 393.22 ± 25.3† | 354.81 ± 36.3†† |
| % TS | 25.3 ± 3.71†† | 29.47 ± 4.82†† | 31.86 ± 3.4††† | 39.37 ± 2.2††† |
| Lipid Peroxidation [equivalent to MDA conc. (nmol/ml)] ¶ | 13.13 ± 1.32 | 12.32 ± 2.54 | 12.42 ± 1.8 | 11.37± 2.2 |
The difference in all parameters (except lipid peroxidation) in MN+IN group animals after treatment is significantly different from those before treatment.
Not significant- There was no significant difference between lipid peroxidation levels at anemic condition and post treatment in all groups.
IN- Iontophoretic treatment group, MN-Microneedle treatment group, MN+IN- Iontophoresis combined with microneedle pretreatment and IP- FPP administered as intraperitoneal injection.
p<0.05
p<0.001
p<0.0001
The amount of iron required to restore the levels in IDA was calculated by different investigators using different approaches based on the body weight and hemoglobin deficit. Various mathematical relationships were derived based on the required hemoglobin to replenish for oral and parenteral formulations (1, 35). In the case of oral iron formulations the daily required dose was calculated based on the amount of elemental iron present in these formulations. According to CDC guidelines, an iron dosage containing 60 mg of elemental iron, one to two times a day for adults with anemia is recommended assuming that at least about 10 % will be absorbed orally. For rats weighing ~250–300 gm, an oral dose of about 0.3 mg elemental iron a day is required. In the current study, we targeted to deliver a cumulative amount of 0.12 mg of elemental iron on alternate days (about ~ 60 μg on daily basis), using 10 cm2 iontophoretic patch and a current strength of 0.15 mA/cm2 for 4 hours transdermally. Murthy et al (13) have demonstrated an excellent correlation between total electrical dose and the amount of FPP delivered across skin. The FPP used in this study contains ~11.7 % elemental iron. The combination of microneedle pretreatment along with iontophoresis resulted in significant improvement in the hematologic and biochemical parameters within four weeks. There was an improvement in the mean hemoglobin concentration by ~2.5 g/dl from anemic condition to post treatment. It has been reported that, a successful iron replenishment therapy would result in improving hemoglobin concentration to 1–2 gm % in 2–3 weeks. Here, in rats that received iron via iontophoresis after microneedle pretreatment (group 5), the mean RBC count increased from 6.61 ± 0.75 ×10¹²/l (in anemic condition) to 7.72 ± 0.5 × 10¹²/l (p=0.013) after treatment, indicating that the delivered iron was sufficient to meet the requirements for regeneration of red cells. The mean hematocrit values also increased from 32.4 ± 3.72 % to 40.18 ± 4.24 % (p=0.0068) after treatment. Similarly, significant improvement in MCV, MCH and MCHC was observed after four weeks of treatment in this group. A decrease in the RDWc was also observed after treatment indicating a significant reduction in the abnormal size and shaped RBCs owing to transdermal delivery of FPP in group 5 (Figure 5e). The serum iron concentration and % TS and TIBC values in the treated rats in group 5 provided validity to the fact that adequate amount of iron was delivered when iontophoresis was combined with microneedle pretreatment. The difference in lipid peroxidation after treatment was not significantly different from that of anemic condition in the same rats, indicating that FPP is not likely to increase the oxidative stress.
Intraperitoneal delivery of FPP
FPP was administered intraperitoneally to rats for 2 weeks (positive control). There was a significant improvement in all hematological and biochemical parameters in these animals at end of treatment period. The improvement in the morphology of RBC in this group of animals is evident in figure 5f.
Conclusions
FPP can be delivered via transdermal route using iontophoresis in combination with microneedle pretreatment. The results of the study suggest that microneedle and iontophoresis mediated delivery of iron via transdermal route could be developed as a potential treatment for IDA. The transdermal controlled delivery of iron could become a potential, safe and effective alternative to parenteral iron therapy.
Acknowledgments
This project was funded by Grant # HD061531A from Eunice Kennedy Shriver National Institute of Child Health & Human development (NICHD).
The authors would like to thank Dr. Mohammad Khalid Ashfaq (Senior Research Scientist, NCNPR, The University of Mississippi) for the VetScan HM2 Hematology instrument and Mr. Rajnish Sahu (NCNPR, The University of Mississippi) for his help with RBC morphology studies. The authors also would like to acknowledge the valuable input from Dr. Phaniraj Cegu, Pharmacist, Walgreens, Memphis, TN.
Abbreviations
- ID
Iron deficiency
- IDA
Iron deficiency anemia
- FPP
Ferric pyrophosphate
- Hb
Hemoglobin
- Hct
Hematocrit
- MCV
Mean corpuscular volume
- MCH
Mean corpuscular hemoglobin
- MCHC
Mean corpuscular hemoglobin concentration
- RDWc
Red blood cell width
- SI
Serum iron
- TIBC
Total iron binding capacity
- %TS
%transferrin saturation
- TBARS
Thiobarbituric acid reactive substances
- MDA
Malondialdehyde
- HPMC
Hydroxypropyl methyl cellulose
- TEWL
Transepidermal water loss
References
- 1.Alleyne M, Horne MK, Miller JL. Individualized treatment for iron-deficiency anemia in adults. Am J Med. 2008;121:943–948. doi: 10.1016/j.amjmed.2008.07.012. [DOI] [PMC free article] [PubMed] [Google Scholar]
- 2.Provan D. Mechanisms and management of iron deficiency anaemia. Br J Haematol. 1999;105(Suppl 1):19–26. [PubMed] [Google Scholar]
- 3.Kohgo Y, Ikuta K, Ohtake T, Torimoto Y, Kato J. Body iron metabolism and athophysiology of iron overload. Int J Hematol. 2008;88(1):7–15. doi: 10.1007/s12185-008-0120-5. [DOI] [PMC free article] [PubMed] [Google Scholar]
- 4.Al-Sayes F, Gari M, Qusti S, Bagatian N, Abuzenada A. Prevalence of iron deficiency nd iron deficiency anemia among females at university stage. J Med Lab Diagn. 2011;2(1):5–11. [Google Scholar]
- 5.W.H. Organization. Iron deficiency anaemia: assessment, prevention and control. World Health Organization; 2001. Vol. WHO/NHD/01.3. [Google Scholar]
- 6.Nissenson AR, Goodnough LT, Dubois RW. Anemia: not just an innocent bystander? Arch Intern Med. 2003;163(12):1400–1404. doi: 10.1001/archinte.163.12.1400. [DOI] [PubMed] [Google Scholar]
- 7.Pasricha SR, Flecknoe-Brown SC, Allen KJ, Gibson PR, McMahon LP, Olynyk JK, Roger SD, Savoia HF, Tampi R, Thomson AR, Wood EM, Robinson KL. Diagnosis and management of iron deficiency anaemia: a clinical update. Med J Aust. 2010;193 (9):525–532. doi: 10.5694/j.1326-5377.2010.tb04038.x. [DOI] [PubMed] [Google Scholar]
- 8.Ekiz C, Agaoglu L, Karakas Z, Gurel N, Yalcin I. The effect of iron deficiency anemia on the function of the immune system. Hematol J. 2005;5:579–583. doi: 10.1038/sj.thj.6200574. [DOI] [PubMed] [Google Scholar]
- 9.Afzal M, Qureshi SM, Lutafullah M, Iqbal M, Sultan M, Khan SA. Comparative study of efficacy, tolerability and compliance of oral iron preparations (iron edetae, iron polymatose complex) and intramuscular iron sorbitol in iron deficiency anaemia in children. J Pak Med Assoc. 2009;59(11):764–768. [PubMed] [Google Scholar]
- 10.al-Momen AK, al-Meshari A, al-Nuaim L, Saddique A, Abotalib Z, Khashogji T, Abbas M. Intravenous iron sucrose complex in the treatment of iron deficiency anemia during pregnancy. Eur J Obstet Gynecol Reprod Biol. 1996;69(2):121–124. doi: 10.1016/0301-2115(95)02538-3. [DOI] [PubMed] [Google Scholar]
- 11.Silverstein SB, Rodgers GM. Parenteral iron therapy options. Am J Hematol. 2004;76:74–78. doi: 10.1002/ajh.20056. [DOI] [PubMed] [Google Scholar]
- 12.Johnson-Wimbley TD, Graham DY. Diagnosis and management of iron deficiency anemia in the 21st century. Therap Adv Gastroenterol. 2011;4(3):177–184. doi: 10.1177/1756283X11398736. [DOI] [PMC free article] [PubMed] [Google Scholar]
- 13.Murthy SN, Vaka SR. Irontophoresis: transdermal delivery of iron by iontophoresis. J Pharma Sci. 2009;98(8):2670–2676. doi: 10.1002/jps.21641. [DOI] [PubMed] [Google Scholar]
- 14.Kosch M, Bahner U, Bettger H, Matzkies F, Teschner M, Schaefer Rm. A randomized, controlled parallel group trial on efficacy and safety of iron sucrose (Venofer®) vs iron gluconate (Ferrlecit®) in hemodialysis patients treated with rHuEpo. Nephrol Dial Transplant. 2001;16:1239–1244. doi: 10.1093/ndt/16.6.1239. [DOI] [PubMed] [Google Scholar]
- 15.Gupta A, Amin NB, Besarab A, Vogel SE, Divine GW, Yee J, Anandan JV. Dialysate iron therapy: infusion of soluble ferric pyrophosphate via the dialysate during hemodialysis. Kidney Int. 1999;55(5):1891–1898. doi: 10.1046/j.1523-1755.1999.00436.x. [DOI] [PubMed] [Google Scholar]
- 16.Sammeta SM, Vaka SR, Murthy SN. Transcutaneous sampling of ciprofloxacin and 8-methoxypsoralen by electroporation (ETS technique) Int J Pharm. 2009;369(1–2):24–29. doi: 10.1016/j.ijpharm.2008.10.017. [DOI] [PMC free article] [PubMed] [Google Scholar]
- 17.Vaka SR, Shivakumar HN, Murthy SN. Constant voltage ‘Iron’ tophoresis. Pharma Dev Technol. 2011;16(5):483–488. doi: 10.3109/10837450.2010.492219. [DOI] [PMC free article] [PubMed] [Google Scholar]
- 18.Vemulapalli V, Yang Y, Friden PM, Banga AK. Synergistic effect of iontophoresis and soluble microneedles for transdermal delivery of methotrexate. J Pharm Pharmacol. 2008;60(1):27–33. doi: 10.1211/jpp.60.1.0004. [DOI] [PubMed] [Google Scholar]
- 19.Wu XM, Todo H, Sugibayashi K. Enhancement of skin permeation of high molecular compounds by a combination of microneedle pretreatment and iontophoresis. J Control Release. 2007;118(2):189–195. doi: 10.1016/j.jconrel.2006.12.017. [DOI] [PubMed] [Google Scholar]
- 20.Prausnitz MR. Microneedles for transdermal drug delivery. Adv Drug Deliv Rev. 2004;56(5):581–587. doi: 10.1016/j.addr.2003.10.023. [DOI] [PubMed] [Google Scholar]
- 21.Kalluri H, Banga AK. Formation and Closure of Microchannels in Skin Following Microporation. Pharm Res. 2011;28:82–94. doi: 10.1007/s11095-010-0122-x. [DOI] [PubMed] [Google Scholar]
- 22.Gupta J, Gill HS, Andrews SN, Prausnitz MR. Kinetics of skin resealing after insertion of microneedles in human. J Control Release. 2011;154:148–155. doi: 10.1016/j.jconrel.2011.05.021. [DOI] [PMC free article] [PubMed] [Google Scholar]
- 23.CDC. Recommendations to prevent and control iron deficiency in the United States. MMWR. 1998;47:1–29. [PubMed] [Google Scholar]
- 24.Carley A. Anemia: when is it iron deficiency? Pediatr Nurs. 2003;29(2):127–133. [PubMed] [Google Scholar]
- 25.Soliman GZA, Mahfouz MH, Emara IA. Effect of Different Types of Oral Iron Therapy Used for the Treatment of Iron Deficiency Anemia and Their Effects on Some Hormones and Minerals in Anemic Rats. J Am Sci. 2010;6(6):109–118. [Google Scholar]
- 26.Kurtoglu E, Ugur A, Baltaci AK, Undar L. Effect of iron supplementation on oxidative stress and antioxidant status in iron-deficiency anemia. Biol Trace Elem Res. 2003;96(1–3):117–123. doi: 10.1385/BTER:96:1-3:117. [DOI] [PubMed] [Google Scholar]
- 27.Sundaram RC, Selvaraj N, Vijayan G, Bobby Z, Hamide A, Rattina Dasse N. Increased plasma malondialdehyde and fructosamine in iron deficiency anemia: effect of treatment. Biomed Pharmacother. 2007;61(10):682–685. doi: 10.1016/j.biopha.2007.06.013. [DOI] [PubMed] [Google Scholar]
- 28.Knutson MD, Walter PB, Ames BN, Viteri FE. Both iron deficiency and daily iron supplements increase lipid peroxidation in rats. J Nutr. 2000;130(3):621–628. doi: 10.1093/jn/130.3.621. [DOI] [PubMed] [Google Scholar]
- 29.Masini A, Trenti T, Caramazza I, Predieri G, Gallesi D, Ceccarelli D. Dietary iron deficiency in the rat. II. Recovery from energy metabolism derangement of the hepatic tissue by iron therapy. Biochimi Biophys Acta. 1994;1188(1–2):53–57. doi: 10.1016/0005-2728(94)90021-3. [DOI] [PubMed] [Google Scholar]
- 30.Uehara M, Chiba H, Mogi H, Suzuki K, Goto S. Induction of increased phosphatidylcholine hydroperoxide by an iron-deficient diet in rats. J Nutr Biochem. 1997;8(7):385–391. [Google Scholar]
- 31.Shermanand AR, Moran PE. Copper metabolism in iron-deficient maternal and neonatal rats. J Nutr. 1984;114(2):298–306. doi: 10.1093/jn/114.2.298. [DOI] [PubMed] [Google Scholar]
- 32.Bremner I. Manifestations of copper excess. Am J Clin Nutr. 1998;67 (5 Suppl):1069S–1073S. doi: 10.1093/ajcn/67.5.1069S. [DOI] [PubMed] [Google Scholar]
- 33.Balagopalakrishna C, Manoharan PT, Abugo OO, Rifkind JM. Production of superoxide from hemoglobin-bound oxygen under hypoxic conditions. Biochemistry. 1996;35(20):6393–6398. doi: 10.1021/bi952875+. [DOI] [PubMed] [Google Scholar]
- 34.Nagababu E, Gulyani S, Earley CJ, Cutler RG, Mattson MP, Rifkind JM. Iron-deficiency anaemia enhances red blood cell oxidative stress. Free Radic Res. 2008;42(9):824–829. doi: 10.1080/10715760802459879. [DOI] [PMC free article] [PubMed] [Google Scholar]
- 35.Forbes A. Iron and parenteral nutrition. Gastroenterology. 2009;137(5 Suppl):S47–54. doi: 10.1053/j.gastro.2009.08.013. [DOI] [PubMed] [Google Scholar]


