

Abstract
Bacteriophages are the most abundant biological life forms on Earth. However, relatively little is known regarding which bacteriophages infect and exploit which bacteria. A recent meta-analysis showed that empirically measured phage-bacteria infection networks are often significantly nested, on average, and not modular. A perfectly nested network is one in which phages can be ordered from specialist to generalist such that the host range of a given phage is a subset of the host range of the subsequent phage in the ordering. The same meta-analysis hypothesized that modularity, in which groups of phages specialize on distinct groups of hosts, should emerge at larger geographic and/or taxonomic scales. In this paper, we evaluate the largest known phage-bacteria interaction data set, representing the interaction of 215 phage types with 286 host types sampled from geographically separated sites in the Atlantic Ocean. We find that this interaction network is highly modular. In addition, some of the modules identified in this data set are nested or contain submodules, indicating the presence of multi-scale structure, as hypothesized in the earlier meta-analysis. We examine the role of geography in driving these patterns and find evidence that the host range of phages and the phage permissibility of bacteria is driven, in part, by geographic separation. We conclude by discussing approaches to disentangle the roles of ecology and evolution in driving complex patterns of interaction between phages and bacteria.
Keywords: microbial ecology, viruses, biogeography, networks
Introduction
Bacteriophages can have a significant effect on microbial communities and ecosystems (Wilhelm and Suttle, 1999; Wommack and Colwell, 2000; Suttle, 2005, 2007; Brussaard et al., 2008). Bacteriophages are responsible for a significant fraction of bacterial mortality (Suttle and Chan, 1994; Weinbauer, 2004), engage in coevolutionary arms races with their hosts (Buckling and Rainey, 2002; Andersson and Banfield, 2008; Held and Whitaker, 2009; Marston et al., 2012), and redirect organic material to the microbial loop via a process known as the viral shunt (Wilhelm and Suttle, 1999; Middelboe and Lyck, 2002; Jiao et al., 2010). A key event in all of these ecological functions is the interaction with and exploitation of a bacterium by a phage. It is widely hypothesized that phages can infect a very limited subset of bacteria in a given environment. However, given the high diversity of bacteria in natural environments (Rusch et al., 2007; Quince et al., 2008), even infecting a limited subset can nonetheless represent a heterogeneous range of hosts. Indeed, there is a long record of evidence to suggest that phages commonly infect multiple distinct bacterial types in natural environments (for example, Wichels et al., 1998; Holmfeldt et al., 2007), including examples where individual phages can infect hosts from distinct genera (for example, cyanophages infecting hosts from Prochlorococcus and Synechoccoccus (Sullivan et al., 2003)). Recently, we utilized a network-based approach in order to identify and characterize patterns within published data sets of infection and exploitation of bacteria by phages (Flores et al., 2011).
The key interaction patterns examined in Flores et al., (2011) were nestedness (Rodriguez-Girones and Santamaria, 2006; Ulrich and Gotelli, 2007; Almeida-Neto et al., 2008; Ulrich et al., 2009) and modularity (Newman, 2006b; Barber, 2007). In the context of phage-bacteria interactions, nestedness indicates the extent to which the host ranges of phages are subsets of one another. In a maximally nested network, the most specialized phage could infect hosts most permissive to infection. Then, the next most specialized phage could infect the host most permissive to infection as well as one additional host, and so on. Nestedness is thought to emerge in coevolutionary arms race dynamics in which hosts evolve resistance to current and past pathogens, while pathogens evolve counter resistance that enables them to infect past hosts (Agrawal and Lively, 2002), for example, as observed between the bacterium Pseudomonas fluorescens SB25 and the DNA phage SBW25Φ2 (Buckling and Rainey, 2002). Similarly, modularity indicates the extent to which interactions, in this case an infection of a bacterium by a phage, can be partitioned into groups with many interactions within them and few interactions between them. These groups are referred to as modules. In a maximally modular network, there would be no cross-infections between phages of one module and hosts of another module. There are many possible drivers of modularity, including geographic isolation, which can facilitate the divergent coevolution of interacting species (Thompson, 1999; Gómez and Buckling, 2011).
In our re-analysis of published studies, we found that infection networks tended to be nested and not modular (Flores et al., 2011). However, we hypothesized that modularity should be expected when a greater diversity of bacteria and phages interact. The work described here follows up on our earlier study by analyzing a previously published cross-infection data set (Moebus and Nattkemper, 1981) not included in our earlier analysis. The Moebus and Nattkemper (1981) data set is the largest phage-bacteria infection network available in the literature (as far as we are aware), representing interactions between marine phages and bacteria in the Atlantic Ocean. The data set contains cross-infection and geographic information but no sequence information. As such, we focus our analysis on the following questions: (i) how do patterns of infection change at different scales, that is, when examining the entire network (large scale) vs subcomponents of the network (small scale); (ii) what role does geographic separation have in shaping cross-infection? Despite the cosmopolitan nature of viruses (Breitbart et al., 2004; Angly et al., 2006) (for an exception see (Desnues et al., 2008)), multiple lines of evidence suggest that phages are often better adapted to hosts from the same location than they are to hosts from a different location (Held and Whitaker, 2009; Vos et al., 2009; Gómez and Buckling, 2011; Koskella et al., 2011). Hence, by examining explicit cross-infections among many microbes isolated across a large geographic range, we hope to shed light on the structure of phage-bacteria infection networks.
Materials and methods
Data set
We analyzed the cross-infection data set of Moebus and Nattkemper (1981). This data include phage and bacteria collected from February to April 1979 in the Atlantic Ocean between the European continental shelf and the Sargasso Sea (Moebus, 1980). Bacteria were cultured and isolated using seawater-based media and bacteriophages were enriched from the same water sample (Moebus, 1980). In the original analysis of cross-infection (Moebus and Nattkemper, 1981), the authors describe cross-reaction tests among 733 bacteria and 258 phage strains collected at 48 stations separated, in some cases, some 200 miles apart (Supplementary Figure S1). However, the authors do not report results from strains, which have both (i) identical infection patterns and (ii) that were isolated from the same station. The reported data set is included as a fold-out table in the main text (see Supplementary Figure S2). We digitized and automatically extracted the positive infection results and then manually curated the results, yielding a network of 286 bacteria strains and 215 phage strains with 1332 positive infection outcomes out of a possible 61 490=215*286 interactions (see Supplementary Text S1 for more details). The interactions were classified in the original study as either (i) ‘More or less clear spots due to lysis of bacteria' (ii) ‘More or less turbid spots'. We classified all interactions as either positive (either clear or turbid spots) or negative (neither clearing nor turbid spots). We refer to this data set as the MN (Moebus and Nattkemper) matrix. The resulting digitized data set is shown in Figure 1.
Figure 1.

Digitized version of the MN matrix with 286 hosts (rows) and 215 phages (columns) in the same orientation as originally published (Moebus and Nattkemper, 1981). The 1332 black cells represent positive interactions between hosts and phages (see Materials and methods). The connectance of the network (interactions/total size) is approximately 0.022≈1332/61490.
Network analysis
Disjoint components
An interaction network is considered bipartite when it contains two types of agents that interact, for example, bacteria and phages. Any bipartite network can be decomposed into disjoint components such that no cross-infections are found between components. Formally, each disjoint component in a bipartite network of host-viral cross-infection is defined in terms of a set of hosts, H, and viruses V, such that: (i) there is no virus V' outside of V that can infect any host in H; (ii) there is no host H' outside of H that can be infected by any virus in V; (iii) for each virus in V there is at least one host in H that it can infect.
Modularity
We used the standard BRIM (Bipartite Recursively Induced Modules) algorithm (Barber, 2007), which utilizes a local search heuristic to maximize a bipartite modularity value Q (see Supplementary Text S2 for more details). The value of Q represents how often a particular ordering of phages and bacteria into modules corresponds to interactions that are primarily inside a module (Q≈1 or modular), primarily outside of modules (Q≈−1 or antimodular) or somewhere in between (−1<Q<1). BRIM helps find the arrangement of phages and bacteria in modules that maximize Q. We used two different approaches of the BRIM algorithm depending on the size of the matrix. For the entire matrix, we extended the BRIM algorithm to first partition the network into different isolated modules and then subsequently recursively subdivide the network as has been done in the case of unipartite networks (Newman, 2006a, 2006b), that is, networks with only one type of node. Our approach (described in Supplementary Text S2) yields higher values of Q than both BRIM and LP-BRIM (Liu and Murata, 2009). Within each module, we used the adaptive heuristic of the BRIM algorithm (Barber, 2007), which has been verified to perform well in small matrices (Liu and Murata, 2009).
Nestedness
We utilized two algorithms to measure the extent to which hosts and phage interactions have a nested pattern.
Nestedness temperature calculator
The nestedness temperature calculator (NTC) algorithm was originally developed by (Atmar and Patterson, 1993) and has been reviewed elsewhere (Rodríguez-Gironés and Santamaría 2006). In the present context, the ‘temperature', T, of an interaction matrix is estimated by resorting the row order of hosts and the column order of phages such that as many of the interactions occur in the upper left portion of the matrix. In doing so, the value of T quantifies the extent to which interactions only take place in the upper left (T≈0), or are equally distributed between the upper left and the lower right (T≈100). Perfectly nested interaction matrices can be resorted to lie exclusively in the upper left portion and hence have a temperature of 0. The value of temperature depends on the size, connectance and structure of the network. Because the temperature value quantifies departures from perfect nestedness, we define the nestedness, NNTC, of a matrix to range from 0 to 1, NNTC=(100−T)/100, such that NNTC=1 when T=0 (perfect nested pattern) and NNTC=0 when T=100 (chessboard pattern).
Nestedness metric based on overlap and decreasing filling
NODF is a nestedness metric introduced by Almeida-Neto et al. (2008). NODF is independent of row and column order. This algorithm measures the nestedness across hosts by assigning a value  to each pair i, j of hosts (rows) in the interaction matrix, which is defined as:
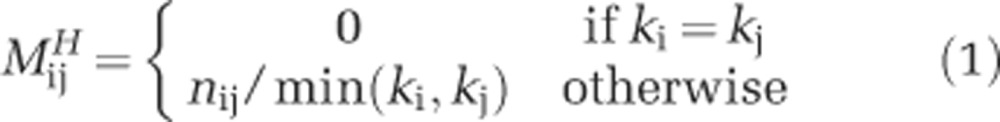 |
where ki and kj are the degree of hosts i and j respectively, and nij is the number of common interactions between them. ‘Degree' is a standard network science term that is defined as the number of interactions that a given type has (Newman, 2010). For example, in this context, the degree of a host is the number of viruses that can infect it and the degree of a virus is the number of hosts it can infect. The same method is used to calculate nestedness across phages, such that the total nestedness value is:
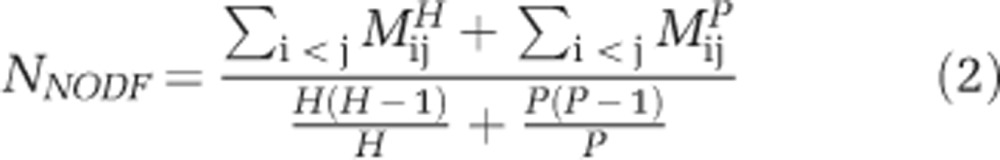 |
The meaning of nestedness as calculated by NODF is that higher values denote matrices whose (i) pairs of rows are typically subsets of each other, that is, host pairs share some, but not all, viruses that can infect them; (ii) pairs of columns are typically subsets of each other, that is, viral pairs share some, but not all, hosts that they can infect.
Null models
We utilized two null models in order to measure the statistical significance of modularity and nestedness. The first is a Bernoulli random null model in which the null matrix has the same total number of interactions as the original matrix, albeit randomly positioned. The second is a probabilistic degree null model in which each interaction between host i and phage j in the null matrix is assigned with a probability pij according to:
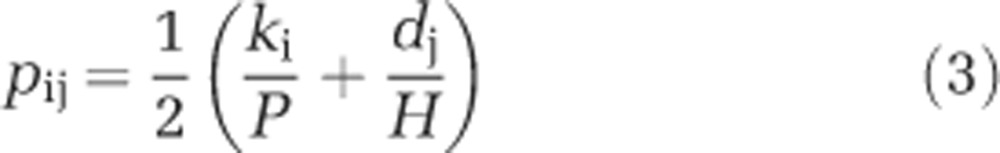 |
where the degree ki is the number of phages that infect host i, the degree dj is the number of hosts infected by phage j, P is the number of phages and H is the number of hosts. In all cases, we utilize 100 000 random matrices to evaluate the statistical significance of modularity and nestedness. Finally, given the two null models, we evaluate modularity using two significant tests, and we evaluate nestedness using four significance tests (two each for the NTC and NODF).
Multi-scale analysis
Nestedness metrics may overestimate the statistical significance of nestedness, particularly when the fraction of realized interactions of a network becomes either very large or very small, for example, Fischer and Lindenmayer (2002). In addition, in cases where a network is comprised of nested modules, we expect that some nestedness measures will spuriously identify the entire network as nested (see for example, Figure 7 of Flores et al. (2011)). We developed two approaches to characterize nestedness given a large, sparsely connected network. These two approaches are consistent with recent calls to take a local, rather than a strictly global, approach to identifying community structure (Fortunato and Barthélemy, 2007). First, in the case of nestedness as calculated using NTC, we identify modules in the original matrix, and then constrain the row/column re-ordering so that rows and columns cannot break the modular structure. Hence, we still sort the rows and columns, but only inside modules. In addition, we permit random permutations of the modular blocks along the main matrix diagonal and select the configuration that minimizes temperature (maximizes nestedness). Second, in the case of nestedness as calculated using NODF, we again identified modules and then restricted the comparisons of overlap to rows and columns across modules. In this way, we can evaluate the overall nestedness of the original matrix without considering the nestedness contribution that comes from inside of modules. More details are found in Supplementary Text S3.
Geographic analysis
Modules identified in our network analysis include hosts and phages collected at potentially different sample sites. The sample site of each phage and host corresponds to different ‘stations' in the Atlantic Ocean. We estimated the geographic diversity of stations within a given module using Shannon (Hk) and Simpson indices (Dk) (Shannon, 1948; Simpson, 1949) where the subscript k denotes the module number. Both indices measure the variability in the stations of isolation of phages and hosts within a given module. In addition, both indices were applied to hosts and phages separately. The diversity indices of a given module are:
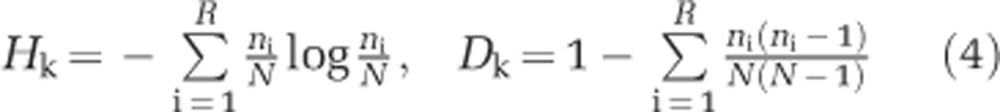 |
where N are the number of different strains inside the module, R are the number of stations inside the module, and ni are the number of strains from station i. Low values in both indices indicate low geographical diversity. We determined the significance of a measured diversity value by comparing observations with an ensemble of randomized matrix assignations of station labels to modules (see Supplementary Text S4 for details).
Results
Characteristics of a large-scale phage-bacteria infection network
The network properties of the MN phage-host infection data set are shown in Table 1. We find that only a small percentage of the cross-infections yield a positive result (2.17%=1332/61490), in contrast to a previous meta-analysis where many cross-infections yielded positive results (36.6%=4365/11944) (Flores et al., 2011). However, in agreement with the prior meta-analysis we find that phages can infect multiple hosts (average of 6.20, median of 4 in the present study, average of 8.75, median of 6 in the prior meta-analysis). Similarly, we find that hosts are infected by multiple phages (average of 4.66, median of 3 in the present study, average of 4.34, median of 3 in the prior meta-analysis). These averages and medians were calculated over all strains in the current study and by aggregating strains from the prior analysis. Importantly, the degree distribution of this network is not unimodal, that is, it does not have a single peak. Instead, we find long-tailed distributions of the number of hosts that a phage can infect, and similarly, the number of phages that can infect a host (see Supplementary Figure S3). Hence, there exists a spectrum of viral types spanning specialists to generalists; we find there are many more specialists than generalist viral types in this study. Similarly, hosts can span a spectrum of types from permissive to resistant types; we find there are many more resistant types than permissive types in this study.
Table 1. General properties of the curated phage-bacteria interaction network.
| General properties | Definition | Value |
|---|---|---|
| NC | Number of components | 38 |
| H | Number of hosts | 286 |
| P | Number of phages | 215 |
| I | Number of interactions | 1332 |
| S=H+P | Number of species | 501 |
| M=HP | Size | 61490 |
| C=I/M | Connectance or fill | 0.0217 |
| Host interactions | ||
| LH=I/H | Mean host degree | 4.6573 |
| Max(ki) | Max host degree | 20 |
| Min(ki) | Min host degree | 1 |
| Phage interactions | ||
| LP=I/P | Mean phage degree | 6.1953 |
| Max(di) | Max phage degree | 31 |
| Min(di) | Min phage degree | 1 |
Evaluating modularity at the whole-network scale
The MN matrix is comprised of 38 disjoint components, that is, sets of phages and bacteria, which have cross-infections within a component but no cross-infections between components (see Figure 2). Given the finding of disjoint components, we expect that the MN matrix is significantly modular. We confirm this via a modularity analysis using the BRIM algorithm in which we identify 49 separate modules (see Supplementary Table S2). The 49 modules include the subdivision of some of the 38 disjoint components as identified in the BRIM analysis such that the overall modularity value Q is increased. These results enable in-depth resolution of the specialization within the system, in contrast to the conclusion by Moebus and Nattkemper (1981) via visual inspection that ‘two large groups of bacteriophage-host systems were encountered' and ‘8 small ones were found'. Figure 3 shows the modularity sorting of the MN matrix resulting from the BRIM algorithm, in which rows and columns inside modules were sorted in order to highlight the possible nested structure within modules. Remarkably, 1219/1332=91.52% of the interactions occurs within modules rather than between modules. The calculated modularity of the MN matrix (Q=0.7950) is larger than any of the 105 realizations in either null model (P<10−5, which is a conservative upper bound). As a point of reference, the highest value of any of the random matrices was Q=0.4503. The Z-score, representing the relative number of standard deviations the actual modularity is larger than the mean of the random ensemble, as calculated for modularity was 87.55 using the Bernoulli null model and 51.02 using the probabilistic degree null model. It is important to note that although most interactions occur within a module, these modules include phages and bacteria from multiple stations. Hence, we find that 76% (∼1012/1332) of infections transcend the site of isolation (see Supplementary File 1 and subsequent section on geographic analysis).
Figure 2.

Network representation of the study. We observe 38 isolated components. Black nodes represent phages, and white nodes represent hosts. The station IDs of each host and phage are contained in the center of each node.
Figure 3.

Modularity sorting of the network. We detect 49 modules (shaded rectangles). The 15 largest modules discussed in the main document begin at the left of the matrix. Black symbols represent those interactions within a module. Gray symbols represent those occurring between modules. The P-value for the observed modularity is smaller than 10−5.
Evaluating nestedness at the whole-network scale
We evaluated the nestedness of the MN matrix using a combination of algorithms and null models. First, we resorted the row and columns in order of increasing degree, a heuristic that tends to maximize nestedness using the temperature calculator. Visually, it would seem that the MN matrix is not nested (see Figure 3 and Supplementary Figure S4). We showed in a previous study that a community of nested modules can lead to apparent nestedness at the whole-matrix scale (Flores et al., 2011). Indeed, for the four nestedness tests (two null models and two algorithms) we find that the MN matrix is apparently significantly nested in all cases except for the NODF algorithm using the probabilistic interaction null model. We argue that the apparent finding of nestedness is driven by the fact that the matrix contains nested modules, rather than a nested arrangement of hosts and phages spanning the entire matrix. We applied a multi-scale network analysis to evaluate this hypothesis (see Materials and methods and Supplementary Text S3). The results of the conventional and multi-scale nestedness analysis are summarized in Table 2. The multi-scale analysis enables us to reject the finding of nestedness for both algorithms when using the probabilistic degree null model. Nestedness can also be rejected even in the case of the Bernoulli null model for NODF and for one of the multi-scale analysis methods using NTC.
Table 2. Significance of the nestedness of the MN matrix using alternative algorithms.
|
NTC algorithm |
NODF algorithm |
|||||
|---|---|---|---|---|---|---|
| NNTC | Bernoulli | Probabilistic degree | NNODF | Bernoulli | Probabilistic degree | |
| Normal analysis | 0.9541 | P<1e-5 | P<1e-5 | 0.0341 | P<1e-5 | P=0.2336 |
| Multi-scale analysis | 0.93590.92630.8568 | P<1e-5 P<1e-5 P=1 | P=1 P=1 P=1 | 0.0062 | P=1 | P=1 |
Abbreviations: MN matrix, Moebus and Nattkemper matrix; NODF, nestedness metric based on overlap and decreasing filling; NTC, nestedness temperature calculator; The P-value denotes the fraction of random matrices that have a larger value of nestedness, N, than the observed MN matrix. In the ‘normal' analysis, the NTC algorithm and NODF algorithms are used to estimate nestedness using alternative null models (see Materials and methods). For the multi-scale analysis three values have been reported for analyzing the significance of nestedness using the NTC algorithm: (1) Modules are sorted according to the sort heuristic described in Supplementary Text S3; (2) Modules are sorted in descending order of the number of phages; (3) Modules are sorted in ascending order of the number of phages. See Supplementary Figure S6 for the details of sorting. Note that the values of nestedness can differ depending on the algorithm used, it is their relative value to the null model that determines significance.
Network analysis at the intra-module scale
We performed a network analysis of the 15 largest modules extracted from the modularity sort (see Table 3 for summary statistics and Supplementary Table S2 for information on all 49 modules). Figures 4 and 5 show the modularity and nestedness sorting, respectively. We detected that 9/15 modules are statistically modular in at least one of the two null models, whereas 5/15 are modular using both of the null models. In addition, we find that 8/15 of the modules are statistically nested in at least one combination of NTC/NODF vs Bernoulli/Probabilistic degree null models. The fact that 8 of 15 modules are statistically nested in at least one case is an indication that nestedness is present at smaller scales. This supports the hypothesis that modularity may be characteristic at large scales (the scale of the entire network), whereas nestedness may be observed at small scales (at the scale of an individual module) (Flores et al., 2011). However, here we note that small-scale structure includes nestedness and modularity.
Table 3. Network properties of the largest 15 modules identified using the modularity analysis (see Table 1 for definitions of all quantities).
| No. | H | P | S | I | M | C | Lp | Lh |
|---|---|---|---|---|---|---|---|---|
| 1 | 42 | 23 | 269 | 65 | 966 | 0.28 | 6.40 | 11.70 |
| 2 | 39 | 12 | 138 | 51 | 468 | 0.29 | 3.54 | 11.50 |
| 3 | 31 | 31 | 233 | 62 | 961 | 0.24 | 7.52 | 7.52 |
| 4 | 23 | 13 | 61 | 36 | 299 | 0.20 | 2.65 | 4.69 |
| 5 | 16 | 20 | 114 | 36 | 320 | 0.36 | 7.13 | 5.70 |
| 6 | 15 | 5 | 30 | 20 | 75 | 0.40 | 2.00 | 6.00 |
| 7 | 12 | 7 | 27 | 19 | 84 | 0.32 | 2.25 | 3.86 |
| 8 | 11 | 8 | 52 | 19 | 88 | 0.59 | 4.73 | 6.50 |
| 9 | 8 | 6 | 38 | 14 | 48 | 0.79 | 4.75 | 6.33 |
| 10 | 8 | 11 | 57 | 19 | 88 | 0.65 | 7.13 | 5.18 |
| 11 | 7 | 5 | 15 | 12 | 35 | 0.43 | 2.14 | 3.00 |
| 12 | 7 | 7 | 17 | 14 | 49 | 0.35 | 2.43 | 2.43 |
| 13 | 7 | 9 | 49 | 16 | 63 | 0.78 | 7.00 | 5.44 |
| 14 | 6 | 7 | 21 | 13 | 42 | 0.50 | 3.50 | 3.00 |
| 15 | 6 | 6 | 27 | 12 | 36 | 0.75 | 4.50 | 4.50 |
| Mean | 15.87 | 11.33 | 76.53 | 27.20 | 241.47 | 0.46 | 4.51 | 5.82 |
| Median | 11 | 8 | 49 | 19 | 84 | 0.40 | 4.50 | 5.44 |
Figure 4.

Modular sort of the internal structure of the 15 largest modules, in the same order as they appear in Figure 3. The significance of modularity is denoted as follows: A/a=statistically modular/antimodular using Bernoulli null model, B/b=statistically modular/antimodular using probabilistic degree null model. X=no significant modular or antimodular.
Figure 5.

Nestedness sort of the 15 largest modules. The gray line represents the isocline of the NTC algorithm. A/B=statistically nested using NTC and Bernoulli/probabilistic degree null model, C/D=statistically nested using NODF and Bernoulli/ probabilistic degree null model. X=no significance was found.
Geographical diversity of interactions
We find that, on average, there is less geographic diversity in each of the largest 15 modules identified in Figure 3 than would be expected by chance. The result of the geographic diversity test is shown in Figure 6. Specifically for phages, 11 of 15 modules exhibit statistically significant lower diversity than is expected by chance using Simpson diversity, and 12 of 15 modules are found to be statistically significant when using Shannon diversity (see Supplementary Figure S7 and Supplementary Table S3). Moreover, the two largest modules have lower geographic diversity of phages than average, but not significantly lower than might be expected by chance. Similar results hold for hosts, where 10 of 15 modules exhibit statistical significant lower diversity using Simpson and 11 of 15 using Shannon diversity (again see Supplementary Figure S7). These results imply that strains within modules are overrepresented by phages and hosts that belong to the same subset of stations. However, it is important to point out that this data set includes many positive infections (1012 of 1332) of hosts by phages that were not isolated from the same sample site.
Figure 6.

Geographical representation of the 15 largest modules. Each module is considered in a separate panel. Large filled circles represent the stations included in the corresponding module; open circles represent the stations not included in the corresponding module. Red and green small circles representing phages and bacteria, respectively, were randomly placed around their corresponding station for improved visibility. A gray line between a red and green circle denotes an interaction between a virus and bacteria.
To what extent are the interactions between phages and hosts at a given site more likely to occur than those between sites? First, we find that the probability of a phage infecting and exploiting a host from a different station is lower (0.017) than it is of infecting and exploiting a host from the same station (0.17). This is a 10-fold effect in geographic isolation. We caution that the isolation procedures for phages are heavily biased toward obtaining this effect as phages were isolated from hosts at a given station. As one means to control for this effect, we reduced the number of internal station interactions by the total number of viruses and re-perform this analysis. In doing so, we find a revised probability of 0.061 within modules, which is a 3.6-fold increase when compared with interactions between modules. Finally, in Supplementary Figure S8, we show that the fraction of shared interactions for both hosts and phages is larger within stations than it is between stations. Altogether these results show geographic location, whether at a given site or among a subset of sites, have an important role in driving infection patterns.
Discussion
We performed the first multi-scale analysis of a phage-bacteria infection network, comprised of 286 bacteria and 215 phages isolated from the Atlantic Ocean. First, we found that bacteria and viruses were highly variable in their interactions, corresponding to a spectrum of generalist and specialist viruses as well as hard-to-infect to permissive bacteria (Supplementary Figure S3). Second, we found that the infection network was modular at a large scale and had multi-scale structure such that modules were themselves nested and/or had further modular organization. Network studies have suggested that modularity can be topological, for example, functional modularity as found in protein–protein interaction networks (Rives and Galitski, 2003) or transcriptional regulatory networks (Ihmels et al., 2002). Here, a geographic diversity analysis revealed that the modular signal observed was driven, in part, by geographic isolation. However, it is important to point out that cross-infections that transcend site of isolation were common, indeed approximately 76% of observed interactions occurred between a phage and a bacterium isolated at different sites. We discuss the relevance and implications of each of these results below.
The observation has been made on multiple occasions that the number of hosts a virus can infect can vary substantially, (for example, Moebus and Nattkemper, 1981; Wichels et al., 1998; Comeau et al., 2006; Holmfeldt et al., 2007; Middelboe et al., 2009). Variability in the host range of phages is consistent with the notion that phages have evolved evolutionary strategies ranging from specialists to generalists. Similarly, variability in the number of viruses that can infect a given host is consistent with the notion that hosts have evolved evolutionary strategies ranging from well defended to permissive. It is thought that the relative ecological success of such strategies depends on environmental conditions, for example, bacterial defense specialists may be favored when resources are abundant and competition strategists may be favored when resources are limited (Winter et al., 2010). However, such conclusions are often based on models of interaction dynamics, such as Kill-the-Winner (Thingstad and Lignell, 1997; Thingstad, 2000), that do not include significant cross-infection. Combining cross-infection networks into dynamic models could help develop predictions relating infection structure to community composition (Weitz and Wilhelm, 2012).
Although we identified generalist viruses, the most generalist virus could infect 31 of the 286 total hosts in the network, suggesting that nestedness at the whole-network scale is unlikely. Indeed, the MN matrix is comprised of disjoint components (Figure 2) of which some of these components exhibit additional modular structure within a component (Figure 3). These modules may themselves have further modularity and/or nestedness (Figures 4 and 5). This is the first instance, of which we are aware, of detection of such multi-scale structure in microbial interaction networks. This result can be interpreted in a number of ways. First, the finding of modules within modules suggests multiple levels of specialization that may be present in the community. Second, the finding of nestedness and modularity are not exclusive. In our prior study (Flores et al., 2011), we found nearly perfectly nested networks that appear ‘modular' using the standard BRIM metric (Barber, 2007). This warrants separate examination to develop metrics that can disentangle these two network properties. We developed one such approach here, by suggesting that estimates of nestedness could be performed under modular constraints, and in so doing find that modularity at the scale of the entire MN network and observe nestedness at a local scale (that is, within modules).
What is the biological basis for modules? Given the data available, we evaluate the role of geography in structuring infection. Moebus and Nattkemper (1981) hypothesized, based on visual inspection, that geographic location drove part of the interaction signal. Recent work has suggested that viruses are more likely to infect hosts from the same site than they are hosts isolated at different sites (Vos et al., 2009; Gómez and Buckling, 2011; Koskella et al., 2011). We found a similar result, in that viruses were at least three times more likely to infect a host isolated from the same location than a host isolated from a different location, even after accounting for isolation bias. However, infection across sample sites was observed frequently, and modules typically contained hosts and phages from multiple sample sites. Using a geographic diversity method, we found that modules tend to have phages and hosts from a much smaller number of sample sites than would be expected by chance. Hence our study is consistent with recent calls for greater attention to spatial structure to viral biogeography (Desnues et al., 2008; Held and Whitaker, 2009). One interpretation of our results is that interactions between phages and host may be endemic despite a consensus that viruses are usually cosmopolitan, that is, they can be observed across a broad range of locations (Breitbart et al., 2004; Angly et al., 2006). This may be the case because geographically separated sites are comprised of relatively distinct microbes (for example, microbes differ at the genus level or higher) so that isolated viruses are unlikely to infect the taxa of microbes across sites. Or, it may be that geographically separated sites have relatively similar microbial isolates (for example, communities are dominated by culturable microbes related at the species level or lower) but that their geographic separation facilitated local coevolution to take place, which enabled divergences in functional interactions (Held and Whitaker, 2009; Paterson et al., 2010; Breitbart, 2012).
The finding of multi-scale structure also suggests that different processes may drive the emergence of functional interactions at different scales. For example, in the gene-for-gene model of coevolutionary adaptation (Agrawal and Lively, 2002), hosts and phages accumulate differences in defense and counter defense that are consistent with the emergence of nestedness. However, innovations by hosts may also have an important, albeit less frequent, role in permitting hosts to escape from phage infection and selective pressure. Similarly, innovations by phages may also permit them to re-establish access to a host population (Meyer et al., 2012). A number of evolutionary models of phages and hosts have proposed mechanisms by which coevolutionary dynamics unfold (Thingstad, 2000; Weitz et al., 2005; Rodriguez-Valera et al., 2009; Childs et al., 2012). We suggest that examining resultant phage-bacteria interaction networks will be an important means to quantify functional complexity in natural systems and to identify signatures that could discriminate between alternative coevolutionary models.
Ecological patterns depend on the scale of inquiry (Levin, 1992). In the case of phage-bacteria infection networks, relevant scales may be taxonomic, environmental and/or geographic. Hence, measurements of interaction networks coupled with information on geography, taxa and environmental conditions (for example, Poisot et al., 2011) could help disentangle the relative importance of drivers of microbial interactions, in much the same way that biogeographic studies are beginning to quantify the relative importance of drivers of microbial species distributions (Martiny et al., 2006). Of course, in doing so, new methods to measure cross-infection will be needed. First, our discussion of phage-host interactions in this paper has largely focused on the antagonistic mode. However, the MN matrix includes turbid plaques, which could be interpreted as indicative of infection by temperate phages. Follow-up studies on the differences and similarities between virulent vs temperate phages in natural environments are worthwhile. Second, it was recently noted that ‘the true host range for most marine phages is completely uncharacterized' (Breitbart, 2012). Previously published cross-infection assays, including the MN matrix examined here, use traditional spot-assay or plaque-assay based methods for assessing interactions between cultured bacteria and phages. In moving forward, we suggest that methods to evaluate the functional interaction between hosts and phages that do not rely on cultured isolates (Tadmor et al., 2011; Deng et al., 2012) will represent an important step to assessing the general structure of interactions in natural communities. We hope that the network approach developed here will be of use in such an effort.
Acknowledgments
JSW holds a Career Award at the Scientific Interface from the Burroughs Wellcome Fund and acknowledges the support of the James S. McDonnell Foundation. We thank Justin Meyer, Melissa Duhaime, Karin Holmfeldt, and three anonymous reviewers for feedback on the paper.
Footnotes
Supplementary Information accompanies the paper on The ISME Journal website (http://www.nature.com/ismej)
Supplementary Material
References
- Agrawal A, Lively CM. Infection genetics: gene-for-gene versus matching-alleles models and all points in between. Evol Ecol Res. 2002;4:79–90. [Google Scholar]
- Almeida-Neto M, Guimarães P, Guimarães PR, Loyola RD, Ulrich W. A consistent metric for nestedness analysis in ecological systems: reconciling concept and measurement. Oikos. 2008;117:1227–1239. [Google Scholar]
- Andersson AF, Banfield JF. Virus population dynamics and acquired virus resistance in natural microbial communities. Science. 2008;320:1047–1050. doi: 10.1126/science.1157358. [DOI] [PubMed] [Google Scholar]
- Angly FE, Felts B, Breitbart M, Salamon P, Edwards RA, Carlson C, et al. The marine viromes of four oceanic regions. PLoS Biol. 2006;4:2121–2131. doi: 10.1371/journal.pbio.0040368. [DOI] [PMC free article] [PubMed] [Google Scholar]
- Atmar W, Patterson BD. The measure of order and disorder in the distribution of species in fragmented habitat. Oecologia. 1993;96:373–382. doi: 10.1007/BF00317508. [DOI] [PubMed] [Google Scholar]
- Barber MJ. Modularity and community detection in bipartite networks. Phys Rev E. 2007;76:066102. doi: 10.1103/PhysRevE.76.066102. [DOI] [PubMed] [Google Scholar]
- Breitbart M, Miyake JH, Rohwer F. Global distribution of nearly identical phage-encoded DNA sequences. FEMS Microbiol Lett. 2004;236:249–256. doi: 10.1016/j.femsle.2004.05.042. [DOI] [PubMed] [Google Scholar]
- Breitbart M. Marine viruses: truth or d. are. Annu Rev Marine Sci. 2012;4:425–448. doi: 10.1146/annurev-marine-120709-142805. [DOI] [PubMed] [Google Scholar]
- Brussaard CPD, Wilhelm SW, Thingstad F, Weinbauer MG, Bratbak G, Heldal M, et al. Global-scale processes with a nanoscale drive: the role of marine viruses. ISME J. 2008;2:575–578. doi: 10.1038/ismej.2008.31. [DOI] [PubMed] [Google Scholar]
- Buckling A, Rainey PB. Antagonistic coevolution between a bacterium and a bacteriophage. Proc R Soc Lond B Biol Sci. 2002;269:931–936. doi: 10.1098/rspb.2001.1945. [DOI] [PMC free article] [PubMed] [Google Scholar]
- Childs LM, Held NL, Young MJ, Whitaker RJ, Weitz JS. Multi-scale model of CRISPR-induced coevolutionary dynamics: diversification at the interface of Lamarck and Darwin. Evolution. 2012;66:2015–2029. doi: 10.1111/j.1558-5646.2012.01595.x. [DOI] [PMC free article] [PubMed] [Google Scholar]
- Comeau AM, Chan AM, Suttle CA. Genetic richness of vibriophages isolated in a coastal environment. Environ Microbiol. 2006;8:1164–1176. doi: 10.1111/j.1462-2920.2006.01006.x. [DOI] [PubMed] [Google Scholar]
- Deng L, Gregory A, Yilmaz S, Poulos BT, Hugenholtz P, Sullivan MB. Contrasting strategies of viruses that infect photo- and heterotrophic bacteria revealed by viral-tagging. mBio. 2012;3:e00373–12. doi: 10.1128/mBio.00373-12. [DOI] [PMC free article] [PubMed] [Google Scholar]
- Desnues C, Rodriguez-Brito B, Rayhawk S, Kelley S, Tran T, Haynes M, et al. Biodiversity and biogeography of phages in modern stromatolites and thrombolites. Nature. 2008;452:340–343. doi: 10.1038/nature06735. [DOI] [PubMed] [Google Scholar]
- Fischer J, Lindenmayer DB. Treating the nestedness temperature calculator as a “black box” can lead to false conclusions. Oikos. 2002;99:193–199. [Google Scholar]
- Flores CO, Meyer JR, Valverde S, Farr L, Weitz JS. Statistical structure of host–phage interactions. Proc Natl Acad Sci USA. 2011;108:E288–E297. doi: 10.1073/pnas.1101595108. [DOI] [PMC free article] [PubMed] [Google Scholar]
- Fortunato S, Barthélemy M. Resolution limit in community detection. Proc Natl Acad Sci USA. 2007;104:36–41. doi: 10.1073/pnas.0605965104. [DOI] [PMC free article] [PubMed] [Google Scholar]
- Gómez P, Buckling A. Bacteria-phage antagonistic coevolution in soil. Science. 2011;332:106–109. doi: 10.1126/science.1198767. [DOI] [PubMed] [Google Scholar]
- Held NL, Whitaker RJ. Viral biogeography revealed by signatures in Sulfolobus islandicus genomes. Environ Microbiol. 2009;11:457–466. doi: 10.1111/j.1462-2920.2008.01784.x. [DOI] [PubMed] [Google Scholar]
- Holmfeldt K, Middelboe M, Nybroe O, Riemann L. Large variabilities in host strain susceptibility and phage host range govern interactions between lytic marine phages and their Flavobacterium hosts. Appl Environ Microbiol. 2007;73:6730–6739. doi: 10.1128/AEM.01399-07. [DOI] [PMC free article] [PubMed] [Google Scholar]
- Ihmels J, Friedlander G, Bergmann S, Sarig O, Ziv Y, Barkai N. Revealing modular organization in the yeast transcriptional network. Nat Genet. 2002;31:370–377. doi: 10.1038/ng941. [DOI] [PubMed] [Google Scholar]
- Jiao N, Herndl GJ, Hansell DA, Benner R, Kattner G, Wilhelm SW, et al. Microbial production of recalcitrant dissolved organic matter: long-term carbon storage in the global ocean. Nat Rev Microbiol. 2010;8:593–599. doi: 10.1038/nrmicro2386. [DOI] [PubMed] [Google Scholar]
- Koskella B, Thompson JN, Preston GM, Buckling A. Local biotic environment shapes the spatial scale of bacteriophage adaptation to bacteria. Am Nat. 2011;177:440–451. doi: 10.1086/658991. [DOI] [PubMed] [Google Scholar]
- Levin SA. The problem of pattern and scale in ecology. Ecology. 1992;73:1943–1967. [Google Scholar]
- Liu X, Murata T. Community detection in large-scale bipartite networks. Proc 2009 IEEE/WIC/ACM Inte J Conf Web Intell Intell Agent Technol. 2009;1:50–57. [Google Scholar]
- Marston MF, Pierciey FJ, Shepard A, Gearin G, Qi J, Yandava C, et al. Rapid diversification of coevolving marine Synechococcus and a virus. Proc Natl Acad Sci USA. 2012;109:4544–4549. doi: 10.1073/pnas.1120310109. [DOI] [PMC free article] [PubMed] [Google Scholar]
- Martiny JBH, Bohannan BJM, Brown JH, Colwell RK, Fuhrman JA, Green JL, et al. Microbial biogeography: putting microorganisms on the map. Nat Rev Micro. 2006;4:102–112. doi: 10.1038/nrmicro1341. [DOI] [PubMed] [Google Scholar]
- Meyer JR, Dobias DT, Weitz JS, Barrick JE, Quick RT, Lenski RE. Repeatability and contingency in the evolution of a key innovation in phage lambda. Science. 2012;335:428–432. doi: 10.1126/science.1214449. [DOI] [PMC free article] [PubMed] [Google Scholar]
- Middelboe M, Lyck PG. Regeneration of dissolved organic matter by viral lysis in marine microbial communities. Aquat Microb Ecol. 2002;27:187–194. [Google Scholar]
- Middelboe M, Holmfeldt K, Riemann L, Nybroe O, Haaber J. Bacteriophages drive strain diversification in a marine Flavobacterium: implications for phage resistance and physiological properties. Environ Microbiol. 2009;11:1971–1982. doi: 10.1111/j.1462-2920.2009.01920.x. [DOI] [PubMed] [Google Scholar]
- Moebus K. A method for the detection of bacteriophages from ocean water. Helgol Meeresunters. 1980;34:1–14. [Google Scholar]
- Moebus K, Nattkemper H. Bacteriophage sensitivity patterns among bacteria isolated from marine waters. Helgol Meeresunters. 1981;34:375–385. [Google Scholar]
- Newman MEJ. Networks: An Introduction. Oxford University Press: Oxford, UK; 2010. [Google Scholar]
- Newman MEJ. Finding community structure in networks using the eigenvectors of matrices. Phys Rev E. 2006a;74:036104. doi: 10.1103/PhysRevE.74.036104. [DOI] [PubMed] [Google Scholar]
- Newman MEJ. Modularity and community structure in networks. Proc Natl Acad Sci USA. 2006b;103:8577–8582. doi: 10.1073/pnas.0601602103. [DOI] [PMC free article] [PubMed] [Google Scholar]
- Paterson S, Vogwill T, Buckling A, Benmayor R, Spiers AJ, Thomson NR, et al. Antagonistic coevolution accelerates molecular evolution. Nature. 2010;464:275–278. doi: 10.1038/nature08798. [DOI] [PMC free article] [PubMed] [Google Scholar]
- Poisot T, Lepennetier G, Martinez E, Ramsayer J, Hochberg ME. Resource availability affects the structure of a natural bacteria-bacteriophage community. Biol Lett. 2011;7:201–204. doi: 10.1098/rsbl.2010.0774. [DOI] [PMC free article] [PubMed] [Google Scholar]
- Quince C, Curtis TP, Sloan WT. The rational exploration of microbial diversity. ISME J. 2008;2:997–1006. doi: 10.1038/ismej.2008.69. [DOI] [PubMed] [Google Scholar]
- Rives AW, Galitski T. Modular organization of cellular networks. Proc Natl Acad Sci USA. 2003;100:1128–1133. doi: 10.1073/pnas.0237338100. [DOI] [PMC free article] [PubMed] [Google Scholar]
- Rodríguez-Gironés MA, Santamaría L. A new algorithm to calculate the nestedness temperature of presence-absence matrices. J Biogeogr. 2006;33:924–935. [Google Scholar]
- Rodriguez-Valera F, Martin-Cuadrado AB, Rodriguez-Brito B, Pašić L, Thingstad TF, Rohwer F, et al. Explaining microbial population genomics through phage predation. Nat Rev Microbiol. 2009;7:828–836. doi: 10.1038/nrmicro2235. [DOI] [PubMed] [Google Scholar]
- Rusch DB, Halpern AL, Sutton G, Heidelberg KB, Williamson S, Yooseph S, et al. The Sorcerer II Global Ocean Sampling expedition: Northwest Atlantic through Eastern Tropical Pacific. PLoS Biol. 2007;5:e77. doi: 10.1371/journal.pbio.0050077. [DOI] [PMC free article] [PubMed] [Google Scholar]
- Shannon CE. A mathematical theory of communication. Bell Syst Techl J. 1948;27:623–656. [Google Scholar]
- Simpson EH. Measurement of diversity. Nature. 1949;163:688–688. [Google Scholar]
- Sullivan MB, Waterbury JB, Chisholm SW. Cyanophages infecting the oceanic cyanobacterium. Prochlorococcus. Nature. 2003;424:1047–1051. doi: 10.1038/nature01929. [DOI] [PubMed] [Google Scholar]
- Suttle CA, Chan AM. Dynamics and distribution of cyanophages and their effect on marine Synechococcus spp. Appl Environ Microbiol. 1994;60:3167–3174. doi: 10.1128/aem.60.9.3167-3174.1994. [DOI] [PMC free article] [PubMed] [Google Scholar]
- Suttle CA. Viruses in the sea. Nature. 2005;437:356–361. doi: 10.1038/nature04160. [DOI] [PubMed] [Google Scholar]
- Suttle CA. Marine viruses - major players in the global ecosystem. Nat Rev Microbiol. 2007;5:801–812. doi: 10.1038/nrmicro1750. [DOI] [PubMed] [Google Scholar]
- Tadmor AD, Ottesen EA, Leadbetter JR, Phillips R. Probing individual environmental bacteria for viruses by using microfluidic digital PCR. Science. 2011;333:58–62. doi: 10.1126/science.1200758. [DOI] [PMC free article] [PubMed] [Google Scholar]
- Thingstad TF, Lignell R. Theoretical models for the control of bacterial growth rate, abundance, diversity and carbon demand. Aquat Microb Ecol. 1997;13:19–27. [Google Scholar]
- Thingstad TF. Elements of a theory for the mechanisms controlling abundance, diversity, and biogeochemical role of lytic bacterial viruses in aquatic systems. Limnol Oceanogr. 2000;45:1320–1328. [Google Scholar]
- Thompson JN. Specific hypotheses on the geographic mosaic of coevolution. Am Nat. 1999;153:S1–S14. [Google Scholar]
- Ulrich W, Gotelli NJ. Null model analysis of species nestedness patterns. Ecology. 2007;88:1824–1831. doi: 10.1890/06-1208.1. [DOI] [PubMed] [Google Scholar]
- Ulrich W, Almeida-Neto M, Gotelli NJ. A consumer's guide to nestedness analysis. Oikos. 2009;118:3–17. [Google Scholar]
- Vos M, Birkett PJ, Birch E, Griffiths RI, Buckling A. Local adaptation of bacteriophages to their bacterial hosts in soil. Science. 2009;325:833–833. doi: 10.1126/science.1174173. [DOI] [PubMed] [Google Scholar]
- Weinbauer MG. Ecology of prokaryotic viruses. FEMS Microbiol Rev. 2004;28:127–181. doi: 10.1016/j.femsre.2003.08.001. [DOI] [PubMed] [Google Scholar]
- Weitz JS, Hartman H, Levin SA. Coevolutionary arms races between bacteria and bacteriophage. Proc Natl Acad Sci USA. 2005;102:9535–9540. doi: 10.1073/pnas.0504062102. [DOI] [PMC free article] [PubMed] [Google Scholar]
- Weitz JS, Wilhelm SW. Ocean viruses and their effects on microbial communities and biogeochemical cycles. F1000 Biol Rep. 2012;4:17. doi: 10.3410/B4-17. [DOI] [PMC free article] [PubMed] [Google Scholar]
- Wichels A, Biel SS, Gelderblom HR, Brinkhoff T, Muyzer G, Schütt C. Bacteriophage diversity in the North Sea. Appl Environ Microbiol. 1998;64:4128–4133. doi: 10.1128/aem.64.11.4128-4133.1998. [DOI] [PMC free article] [PubMed] [Google Scholar]
- Wilhelm SW, Suttle CA. Viruses and nutrient cycles in the Sea. BioScience. 1999;49:781–788. [Google Scholar]
- Winter C, Bouvier T, Weinbauer MG, Thingstad TF. Trade-offs between competition and defense specialists among unicellular planktonic organisms: the “Killing the Winner” hypothesis revisited. Microbiol Mol Biol Rev. 2010;74:42–57. doi: 10.1128/MMBR.00034-09. [DOI] [PMC free article] [PubMed] [Google Scholar]
- Wommack KE, Colwell RR. Virioplankton: viruses in aquatic ecosystems. Microbiol Mol Biol Rev. 2000;64:69–114. doi: 10.1128/mmbr.64.1.69-114.2000. [DOI] [PMC free article] [PubMed] [Google Scholar]
Associated Data
This section collects any data citations, data availability statements, or supplementary materials included in this article.