

Abstract
The present-day concept of drug efficacy has changed completely from its original description as the property of agonists that causes tissue activation. The ability to visualize the multiple behaviours of seven transmembrane receptors has shown that drugs can have many efficacies and also that the transduction of drug stimulus to various cellular stimulus–response cascades can be biased towards some but not all pathways. This latter effect leads to agonist ‘functional selectivity’, which can be favourable for the improvement of agonist therapeutics. However, in addition, biased agonist potency becomes cell type dependent with the loss of the monotonic behaviour of stimulus–response mechanisms, leading to potential problems in agonist quantification. This has an extremely important effect on the discovery process for new agonists since it now cannot be assumed that a given screening or lead optimization assay will correctly predict therapeutic behaviour. This review discusses these ideas and how new approaches to quantifying agonist effect may be used to circumvent the cell type dependence of agonism. This article, written by a corresponding member of the International Union of Basic and Clinical Pharmacology Committee on Receptor Nomenclature and Drug Classification (NC-IUPHAR), reviews our current understanding of the interaction of ligands with seven transmembrane receptors. Further information on these pharmacological concepts is being incorporated into the IUPHAR/BPS database http://GuideToPharmacology.org.
Linked Articles
This article is the second in a series of reviews on pharmacological themes commissioned by NC-IUPHAR and accompanies the long-standing series of articles on pharmacological nomenclature published in Pharmacological Reviews. For a listing of all publications of NC-IUPHAR see http://www.iuphar-db.org/nciupharPublications.jsp. Pharmacological Reviews articles on the principles and terminology of functional selectivity for GPCRs and on the principles of allosterism are being prepared for publication in early 2013.
Keywords: receptor theory, agonism, efficacy, drug discovery
This is the second in a series of reviews written by committees of experts of the Nomenclature Committee of the International Union of Basic and Clinical Pharmacology (NC-IUPHAR). A listing of all articles in the series and the Nomenclature Reports from IUPHAR published in Pharmacological Reviews can be found at http://www.GuideToPharmacology.org. This website, created in a collaboration between the British Pharmacological Society (BPS) and the International Union of Basic and Clinical Pharmacology (IUPHAR), is intended to become a “one-stop shop” source of quantitative information on drug targets and the prescription medicines and experimental drugs that act on them. We hope that the Guide to Pharmacology will be useful for researchers and students in pharmacology and drug discovery and provide the general public with accurate information on the basic science underlying drug action.
‘The distinction between affinity and intrinsic activity therefore seems of general importance …’
EJ Ariens, 1954
Historical view of efficacy
Arguably, drugs are defined by three types of properties: their affinity for the biological target (receptor), their ability to bind for a period of time sufficient to affect target behaviour (dissociation rate, target coverage) and their ability to change target behaviour. This latter term defines the essence of what drugs do and what will be discussed in this paper as efficacy. The concept of ‘efficacy’ has evolved over the years; as a preface to a discussion of present ideas describing efficacy, it is useful to summarize the changes.
Efficacy (intrinsic activity) is system-dependent: Nearly 75 years ago, AJ Clark pointed out the need to differentiate ‘the capacity to bind and the capacity to excite’ (Clark, 1937). This was put on a more formal footing 17 years later by EJ Ariens, who described an ‘effect per unit of pharmacon-receptor complex’ as intrinsic activity with a scale from zero (no visible agonism) to one (full tissue agonism) (Ariens, 1954). Molecules that produced a fractional intrinsic activity were classified as partial agonists within this system of nomenclature. This idea has obvious enormous importance, but it necessarily links the drug property of ‘efficacy’ with the particular system used to observe it; for example, while the α-adrenoceptor agonist norepinephrine is a full agonist in both rat annoccocygeus muscle and vas deferens, oxymetazoline is a full agonist in the first system and a partial agonist in the second (Kenakin, 1984). This limits the scale of intrinsic activity as a descriptor of drugs, a fact that was pointed by Ariens in his original publication. Specifically, he stated that intrinsic activity is useful as a molecular description of agonism only in the special cases where receptor occupancy is linearly related to drug response (a limited situation). Of course, for full agonists (and many partial agonists), this condition does not hold, so intrinsic activity is limited as a descriptor of agonism to values within a defined organ system.
Near the same time frame, another treatment of agonism was given by RP Stephenson, who reported the results of experiments with a series of closely related alkyltrimethylammonium compounds as agonists in guinea pig ileum (Stephenson, 1956). Specifically, he noted that compounds of essentially equal potency produced different functional maximal responses. This indicated to him that there was a property that differentiated them as agonists beyond affinity for the receptor; he named the property efficacy. An important part of Stephenson's thesis was that the relationship between receptor occupancy and tissue response need not be linear. This important idea defined ‘spare receptor capacity’ as the ability of agonists to produce maximal tissue response through occupancy of only fractions of the available receptor population in a system. This was confirmed in experimental systems such as guinea pig ileum for histamine through alkylation experiments with β-haloalkylamines (Nickerson, 1956). Stephenson's efficacy still was inexorably linked to the tissue where it is measured; Furchgott (1966) refined the idea somewhat to ‘intrinsic efficacy’, which defined a unit per receptor as a scale for efficacy. However, this too is linked to the particular tissue in which it is measured. An important distinction between intrinsic activity and efficacy (and intrinsic efficacy) is the fact that ratios of efficacies cancel the tissue-related effects on efficacy (providing that the estimates are made in the same system under the same conditions). This provided a powerful tool (namely agonist potency ratios) for receptor and agonist classification that has been invaluable in pharmacology over the past 50 years.
In addition to the fact that it is related to system sensitivity, there are two important concepts relating to Stephenson's efficacy that are relevant to this present discussion. The first relates to the link between what pharmacologists define as efficacy and the nature of the assay used to measure agonism. The Merriam-Webster dictionary defines efficacy as ‘the power to produce an effect’; this associates the property with the ability to see it. This linking of efficacy with observed effect dominates pharmacology since the efficacy of a given drug is defined only by the ability of an assay to demonstrate an effect. With passing years, the complexity of the term efficacy has increased in parallel with the ability to observe complex receptor behaviours. In Stephenson's world, there were limited eyes to see receptor activation, in his case guinea pig ileal contraction. Presently, pharmacologists have a variety of ways to view receptor activation and the resulting sequelae of events; these multiple eyes to see have revolutionized pharmacological definitions of efficacy as will be discussed later in this paper.
The second important concept relates to the use of ratios of efficacy (or agonist potency ratios) as system-independent measures of the relative power of agonists to induce a response. This is only true when the stimulus–response mechanism linking receptor activation to tissue response is monotonic; that is, there is only one y value for every value of x. If this condition is not met, then potency ratios lose their system independence, and they cannot be used to classify agonists. This actually has become increasingly important in the quantification of biased agonist effects (where stimulus–response functions may not be monotonic) and will be dealt with later in this paper.
b. Efficacy is linked to physiology: Mathematically, efficacy was a somewhat arbitrary proportionality factor introduced to reconcile differences between observed potencies of agonists and the concentrations binding to the receptor. Sixteen years after the concept was addressed by Stephenson, the arbitrary nature of the concept was reduced by the expression of agonism in the Black/Leff operational model of receptor function (Black and Leff, 1983). Specifically, this model treats the tissue as a virtual Michaelis–Menten enzyme system and gives a more physiological basis to agonism. The descriptor of efficacy in this model is the term τ, which embodies the intrinsic power of a molecule to induce response and also the sensitivity of the tissue as it converts this power to observed cellular effect. From this standpoint, τ is still linked to the tissue, but as with Stephenson's and Furchgott's efficacy, ratios of τ values become extremely valuable parameters that can be used to predict agonism in therapeutic systems from measurements made in test systems. However, as with efficacy, for ratios of τ values obtained from whole cell response to be truly system independent, there still must be a monotonic stimulus–response function relating receptor activation to cell response. Unlike efficacy ratios obtained from whole cell response, the Black/Leff model describes potential ways around this requirement when dealing with biased agonists (vide infra).
c. Efficacy becomes vectorial (inverse agonism). Twenty-three years after Stephenson defined efficacy, Costa and Herz (1989) demonstrated its vectorial nature. Although ligands had previously been shown to depress spontaneously elevated activity in systems containing benzodiazepine receptors, the paper by Costa and Herz (1989) was the first to describe seven transmembrane receptor (7TMR) constitutive activity and the reduction thereof by a ligand. In particular, the reduction of elevated basal δ-opioid receptor mediated GTP-ase activity in NG108-15 neuroblastoma-glioma cells by ICI174864 ([N,N′-diallyl-Tyr1, Aib2,3]Leu5enkephalin) and the demonstration that this ‘inverse’ agonism was blocked by the antagonist MR2266 (2,6-methano-3-benzazocin-8-ol, 1,2,3,4,5,6-hexahydro-6,11-diethyl-3(3-furanylmethyl) HCl) with exactly the same pKB as normal DADLE (d-Ala2,d-Leu5]encephalin)-induced agonism, elegantly revealed the secret life of 7TMRs as spontaneously activated beings. In addition to inspiring Tommaso Costa to introduce a mandatory revision of the ternary complex model (Samama et al., 1993), the linking of the effect to a ligand-induced observable response clearly showed efficacy to be vectorial; that is, as well as being positive for cell activation, it could be negative. By implication, previous literature viewed efficacy as excitatory since it was observed as a change of apparently quiescently behaviour of cellular systems. With the discovery of inverse agonism and the realization that receptors could form an activated state spontaneously came a re-definition of efficacy as the property of a drug molecule that causes a receptor to change its behaviour towards the cell. This will be discussed in terms of the molecular mechanism of 7TMR efficacy further in this paper.
d. Efficacy becomes pluridimensional: With advances in assay technology came the demonstration that 7TM receptors are pleiotropic with respect to the number of cellular elements with which they can interact (e.g. multiple G-proteins; Prather et al., 1994; 2000; Offermanns et al., 1994; Gudermann et al., 1996; Wise et al., 1999; reviewed in Hermans, 2003). Furthermore, improvements in assay technology (i.e. imaging, dynamic mass distribution, electrical impedance, GTP-ase activity, β-arrestin recruitment, receptor internalization, ERK activation, receptor phosphorylation, etc) have provided a plethora of views of 7TM receptor behaviour in cells beyond simple changes in cellular activity (Kenakin, 2009a). This revolution has provided a surprising texture in what pharmacologists call efficacy. For example, before 7TM receptor internalization could be viewed directly with imaging, it was necessarily linked to the desensitization and waning of ligand-induced cellular response. This being the case, the efficacy for receptor internalization was tacitly assumed to mirror the efficacy to produce response. This was resoundingly refuted by data showing that antagonists can induce receptor internalization without producing cellular activation (Roettger et al., 1997; Gray and Roth, 2011). Thus, two types of efficacy (one for cellular agonism and one for 7TM receptor internalization) were shown to diverge. A number of other efficacies followed suit with the uncovering of ligand bias and functional selectivity (vide infra), leading to the notion that efficacy is essentially defined by the pharmacological eyes we have to see it. Seen in this light, ligands could have a number of efficacies (depending on the response being monitored), a phenomenon succinctly described by Galandrin and Bouvier as ‘pluridimensional efficacy’ (Galandrin and Bouvier, 2006).
e. Potency ratios show variability: The concept of a monotonic function linking agonist receptor occupancy and cellular response was enormously valuable to drug discovery since it allowed the quantification of test agonist activity in a system-independent manner. However, over the past 25 years, reports have emerged to question the simple relationship between occupancy and response predicted by monotonic efficacy systems (Roth and Chuang, 1987; Mottola et al., 1991; Roerig et al., 1992; Fisher et al., 1993; Gurwitz et al., 1994; Lawler et al., 1994; 1999; Ward et al., 1995; Heldman et al., 1996; Mailman et al., 1998). Some notable examples of data that clearly are incompatible with the predictions of the then current receptor theory were reported for dopamine (Mailman et al., 1998; Mottola et al., 2002) and serotonin (Berg et al., 1998). The earliest mechanism proposed for this variability was the idea that agonists stabilize different receptor conformations, and that these go on to differentially activate cellular signalling pathways (Kenakin, 1995a). This concept was termed ‘stimulus trafficking’ and was postulated as a mechanism for agonist bias in functional systems. Under these circumstances, the minimal pharmacological unit for agonism is the agonist-bound receptor active state and not the receptor per se. An active state-based response system necessarily predicts that different agonists can bias their signalling to the cell in different ways; these ideas have been discussed in numerous reviews (vide infra) and will be considered in more detail in this paper as it pertains to the definition of pharmacological efficacy. At the least, the data published in the 1980s and 1990s compelled a more complex view of efficacy than it being a proportionality factor linking agonist receptor occupancy and cellular response.
At present, efficacy can be considered vectorial and ligand dependent. In addition, a number of ‘efficacies’ can be associated with antagonists and other molecules that do not necessarily activate signalling pathways in cells. These data strengthen counter-arguments to the historical view that only agonists possess efficacy and alternatively suggests that all ligands with affinity also have efficacy (see discussion vide infra). This takes us to the present state of understanding of the phenomenon of efficacy as a general property of (all) drugs. To discuss further refinements of efficacy, it is useful to consider its molecular mechanism within the context of 7TM receptor function.
Molecular mechanisms of efficacy
Implicit in pharmacological models of receptor function is the idea that agonist binding leads to changes in the receptor that, in turn, cause the cell to respond. Seven transmembrane receptors are allosteric proteins designed to transmit information through changes in tertiary conformation; thus, it is logical to assume that the change in the receptor produced by the agonist is a change in tertiary conformation. If that conformation triggers cellular response or a change in the behaviour of the protein towards the cell, it is generally referred to as an ‘active state’. Two opposing mechanisms proposed on theoretical grounds to account for this process are ‘conformational induction’ (whereby the ligand causes a deformation of the protein to a new conformation) and ‘conformational selection’ (whereby the ligand selectively stabilizes one of, at least, two pre-existing conformations that are in equilibrium with each other) (Burgen, 1981).
The idea that a molecule alters the conformation of the protein to suit its nature is intuitively attractive and in keeping with Koshland's original concept of ‘induced fit’; as put by Koshland: ‘The substrate may cause an appreciable change in the three-dimensional relationship of the amino acids at the active site’ (Koshland, 1958). The concepts of induction and selection are two expressions of the same molecular mechanism of protein conformational change (see Figure 1). However, support for conformational selection comes from considerations of the high levels of energy required to cause a protein to adopt a conformation that is not present in its native library of spontaneously formed conformations. Selection is also supported by kinetic features of the production of receptor active states that are required for cellular function. Considering the scheme in Figure 1, the time course of ligand-induced receptor active state production is given by the integration of the differential equations d[AR]/dt = k1[A][R] − k-1[AR] and d[AR*]/dt = k2[AR] – k-2[AR*] (Bosshard, 2001). Given that the formation of a complex between the agonist and the inactive receptor complex will be weak, a reasonable estimate for k1 is 104 M−1 s−1. Considering values for conformational changes in proteins of 102 s−1 and integration of the differential equations yields a half-time for the formation of [AR] of 2.5 h (equilibrium would be reached only after a day). In contrast, utilizing reasonable rate constants, a mechanism of conformational selection yields a half-time of approximately 80 s (Bosshard, 2001). Thus, while conformational induction could lead to agonism, the time course would be unacceptably long for cellular life. Pharmacological evidence also supports conformational selection with the discovery of spontaneous formation of receptor active states that are detected by cellular response proteins (Costa and Herz, 1989). In these systems, a receptor active state is produced in the absence of ligand, thereby precluding conformational induction as a mechanism. In general, conformational selection furnishes a simple and economical mechanism of agonism, whereby an agonist preferentially stabilizes a receptor active state. It should be noted that the stabilization of a protein conformation that is only rarely made spontaneously would closely resemble, but not be, conformational induction (Kenakin, 1996).
Figure 1.
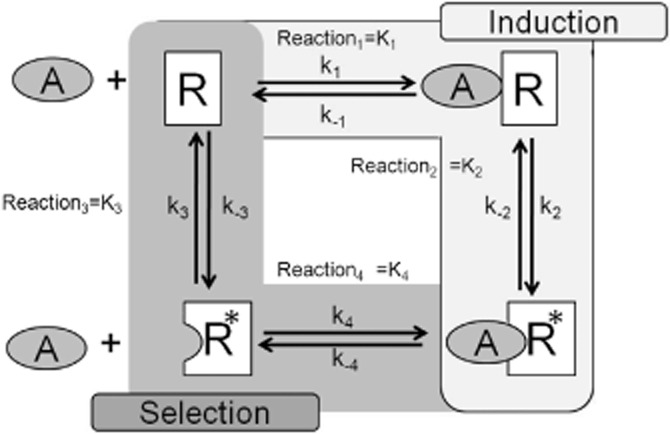
Scheme for binding of a ligand (A) to a receptor (R) that can exist in two states R and R*. It is assumed that the ligand-directed endpoint is production of the R* state through binding to form AR*. A mechanism of selection is through a selective binding of A to the R* state to cause an enrichment of AR*. A mechanism of induction has A binding to the R state followed by a conformational change to the R* state.
The most parsimonious model of agonism by conformational selection is to define only two receptor states: one ‘inactive’ in that it does nothing to the cell and one ‘active’ that triggers cellular response. In terms of conformational selection, agonist efficacy would be defined as the selective affinity of the agonist for the two receptor states in equilibrium with each other as Ri and Ra controlled by an allosteric constant L.

It can be shown that a differential affinity (defined as the term α where α ≠ 1 in Figure 2A) necessarily will lead to a change in the system from that present in the absence of the ligand through the ratio ρ∞/ρ0 (where ρ0 is the fraction of receptors in the Ra state in the absence of ligand, and ρ∞ is the fraction in the presence of a saturating concentration of ligand) in the two-state equation:
Figure 2.
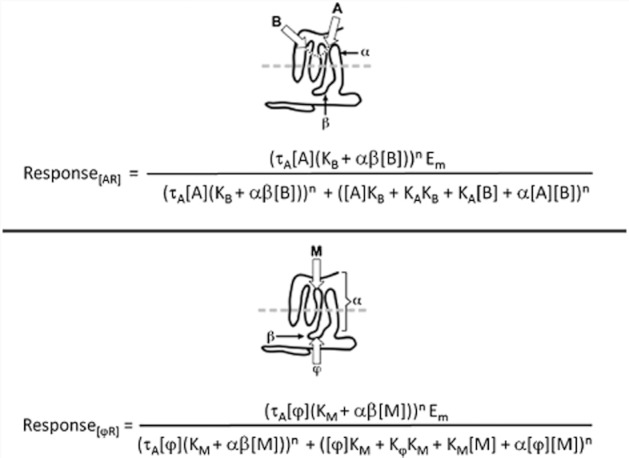
7TMR agonism as an allosteric system. (A) Classic guest allosterism whereby the effects of a ligand A are modified by the binding of a modulator B to a separate site on the receptor. The affinity of A is altered by a factor α upon binding of B; similarly, the efficacy of A is altered by a factor β. The effects of A are reciprocated on the affinity and efficacy of B. The equation yields the response to the ligand A in terms of the Black/Leff operational model with A as an agonist of affinity KA−1 and efficacy τA. (B) 7TMR agonism with the agonist as a modulator M and cytosolic signalling protein φ as the allosteric guest. The equation yields response as the Black/Leff fucntion with the receptor/signal protein complex ([φR]) as the agonist species.
| (1) |
Such a system will re-equilibrate according to Le Chatelier's principle towards enrichment of the protein species for which the ligand has the greater affinity. Thus, if α > 1, the active state will be enriched, and positive agonism will result. If α < 1, then the inactive state will be enriched, and inverse agonism will result. It can be seen that no change in the relative concentrations of the two states occurs only in the case where α = 1 (the ligand A has identical affinities for both states).
The next question is how does the active state cause cellular response? Several lines of evidence involving the ternary complex (DeLean et al., 1980) hypothesis for 7TM receptors support an allosteric mechanism, whereby the active state of the receptor has an altered reactivity towards a signalling protein, causing it to further activate signalling cascades within the cytosol. In this regard, it is useful to consider 7TM receptors as conduits in an allosteric system, whereby the agonist functions as a modulator and the signalling protein a ‘guest’ (Kenakin and Miller, 2010). Thus, binding of the modulator causes a change in the conduit to alter its affinity for the guest. This mechanism is shown schematically in the extended ternary complex (ETC) model of 7TM receptors (Samama et al., 1993):
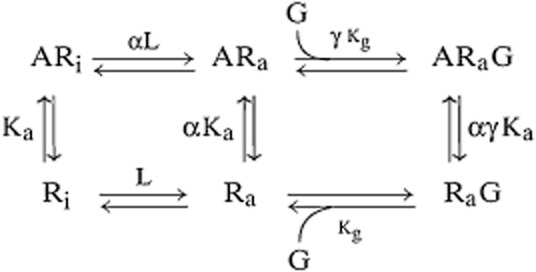
Within this scheme, signalling proteins such as G-proteins bind to the active state of the receptor (with affinity Kg) and to the agonist-bound active state of the receptor with another (and presumably enhanced) affinity γKg. Implicit in this model is the fact that different agonists can impart a different value of γ to the receptor; thus, efficacy becomes a complex function of both α and γ. Under these circumstances, the ‘two-state’ model shown above for spontaneously formed receptor states also functions as a multi-state model in the presence of agonists (the multi-aspect coming from ligand specific values of γ). It should be noted that the ETC model also implicitly states that the binding of the G-protein to the activarted receptor automatically leads to activation. In view of data to show that non-signalling ternary complexes with ligands have been detected in some systems (see Kenakin et al., 2000), a more complete linkage model of 7TM function is described by the cubic ternary complex model (CTC model; Weiss et al., 1996a; b; c). However, for the purposes of this discussion of efficacy, the distinction between the ETC and CTC model is not relevant.
The ETC model was proposed to describe the most commonly measured 7TM receptor response at the time, namely the activation of G-proteins, but theoretically it applies to the binding of any signalling protein (i.e. β-arrestin) to the receptor leading to response. The appearance of the ternary ARaG species in the extended ternary complex model highlights a key feature of 7TM receptors, namely that they are allostseric proteins. Before discussing efficacy further, it is useful to consider this property in describing agonism since allosterism is particularly noted for probe dependent effects (the allosteric effect of a molecule on one receptor probe can be completely different from its effect on another, vide infra).
Efficacy and the allosteric nature of 7TMRs
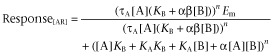
As noted previously, 7TMRs are allosteric proteins. Defining energy as the interaction of a modulator through a conduit (receptor protein) to affect that conduit's interaction with another molecule (termed the guest) further defines agonism as an allosteric vector. Agonism is that vector directed towards the cytosol with the modulator as agonist and signalling proteins as guests. Therefore, agonism should follow the same rules as classical guest allosterism described for allosteric modulators (such as allosteric antagonists and positive allosteric modulator PAMs) (see Figure 2A). The model to describe the latter type of system is a melding of the Ehlert model for allosteric interaction of a ligand [A], modulator [B] and receptor (R) (Ehlert, 1988) and the Black/Leff operational model for functional agonist response (Black and Leff, 1983). The resulting model (Ehlert, 2005; Kenakin, 2005; Price et al., 2005) provides an equation for the effects of any allosteric modulator on the response produced by an agonist. A concise and convenient form of this equation is given by Leach et al. (2007):
 |
(2) |
where Em is the maximal response of the system; KA and KB are the equilibrium dissociation constants of the agonist and modulator, respectively; n is the Hill coefficient of the dose–response curve; α is the effect of the modulator on agonist affinity; β is the effect of the modulator on agonist efficacy; and τA is the efficacy of the agonist. A redefinition of the components of the allosteric system leads to an equation of identical form to describe selective functional agonism (see Figure 2B). Thus, defining the agonist as modulator [M] and the guest as a signalling protein denoted φ, it can be seen that the amount of ligand-bound receptor complex to the signalling protein is given by an equation of the same form as that shown in equation 3 by the following equation (see Figure 2B):
 |
(3) |
Within this scheme, unliganded receptors induce pathway activation through the efficacy parameter τ. Equation 3 shows how biased agonism is the same as the phenomenon of probe dependence, a well-known property of guest allosterism, through the properties of α and β. Probe dependence dictates that the effects of a given modulator can be very different for different receptor guests (Kenakin and Miller, 2010; Suratman et al., 2011). For example, the CCR5 HIV allosteric entry inhibitor aplaviroc reduces the binding of the chemokine CCL3 to the receptor but does not affect the binding of another chemokine (CCL5) (Maeda et al., 2004; Watson et al., 2005). Biased signalling also could furnish a way in which apparently redundant natural ligands can provide finely tuned selective signalling. For example, the natural chemokine CCL19 produces phosphorylation of the chemokine receptor CCR7 through GRK3 and GRK6; while another natural chemokine for this receptor, CCL21, only utilizes GRK6. While both phosphorylation events lead to β-arrestin-2 recruitment, they produce different functional consequences in that CCL19, but not CCL21, produces receptor redistribution of CCR7 receptor into endocytic vesicles (Zidar et al., 2009).
Any binding ligand theoretically can produce an allosteric effect on 7TMRs; and this, in turn, can lead to probe dependence. For example, the PAM NOVO2 produces a 25-fold potentiation of the GLP-1 receptor agonist oxyntomodullin but only a 1.5-fold potentiation of the agonist GLP-1(7–36)NH2 (Koole et al., 2010). This is formally identical to having a biased agonist as the modulator producing a given effect of the receptor interaction with one guest (i.e. G-protein) through the parameters α and β, and a completely different effect on another guest such as β-arrestin (with yet another set of α and β values). Thus, it can be seen how agonist efficacy is compatible with allosteric theory describing effects through the parameters α and β.
One of the most interesting aspects of allosteric modulation of affinity (α) and efficacy (β) is the independence of these effects. This can lead to advantageous therapeutic properties. For example, allosteric antagonists that increase the affinity but decrease the efficacy of natural agonists become more active with increasing activation of the system; that is, they get more potent when they need to. This behaviour is seen with the NMDA receptor antagonist ifenprodil (Kew et al., 1996) and the cannabinoid receptor antagonist Org27569 (5-chloro-3-ethyl-1H-indole-2-carbox-ylic acid [2-(4-piperidin-1-ylphenyl)ethyl]amide) (Price et al., 2005). Strikingly different effects on agonist efficacy (from positive to negative through values of β ranging from fractions to >1) with a uniform increase in affinity have recently been reported for the muscarinic receptor ligand LY2033298 on various muscarinic receptor subtypes (Valant et al., 2012).
Not only can allosteric ligands change the quantity of efficacy of an agonist but also the quality of efficacy. In cases where receptors mediate pleiotropic signalling (i.e. interact with multiple signalling proteins such as G-proteins, β-arrestin, etc.), allosteric changes in receptor conformation may produce unpredictable changes in the way natural and synthetic agonists signal through the receptor. For example, GLP-1 agonists produce increases in cAMP, phosphoERK1/2 and calcium effects through activation of the GLP-1 receptor. The PAM NOVO2 potentiates cAMP effects but otherwise does not alter the calcium signalling characteristics of GLP-1 agonists (Koole et al., 2010).
The allosteric nature of 7TMRs opens ideas about screening for new ligands. Specifically, since guest molecules control the affinity of modulators, specific signalling pathways may be targeted for screening through production of conduit–guest complexes in screening assays. In this regard, 7TMR screening would be similar to recent strategies for selective nuclear receptor screening (Norris et al., 2009). At this point, it is worth considering some practical aspects of bias signalling as it pertains to defining efficacy and quantifying it for therapeutic advantage.
Molecular dynamics of 7TM receptors
The discussion of γ in the ETC model raises the spectre of possible multiplicity of receptor states (as defined by their varying affinity for G-proteins). Two-state models economically described agonism with the least number of assumptions until experimental evidence emerged from a number of types of studies to unequivocally show that receptors can form numerous ‘active’ states. First, there is direct evidence to show that agonist-bound receptors yield active states different from the natural spontaneously formed constitutive active states. One of the most striking examples of this is the demonstration of ‘protean agonism’ for some ligands. In these cases, molecules function as positive agonists in quiescent (non-constitutive) receptor systems and inverse agonists in constitutively active systems (Kenakin, 1995b; 2001). The most simple explanation of this effect is that the ligand stabilizes an active state of lower intrinsic efficacy than the spontaneously formed consitutive active state. Further examples of differences between the constitutively active and ligand-bound β2-adrenoceptor can be observed in the respective signalling pathways activated by each receptor species. For example, in a system consisting of TG4 transgenic murine cardiomyocytes, constitutively activated β2-adrenoceptors produce elevation of cAMP and no change in the cardiac L-type Ca2+ current (ICa). In contrast, the agonist zinterol elevates ICa. These data show that the active states of the β2-adrenoceptor differ in their signalling characteristics (Zhou et al., 1999). Similarly, the photolabelling studies of Gα subunits with azidoanilido-[α32P]GTP in GH3 cells has shown that agonist bound μ-opioid receptors ([D-Ala2,N-MePhe4,Gly-ol5]ekephalin) activate G-proteins differently from constitutively active μ-opioid receptors (Liu et al., 2001). In addition, it has been shown that the constitutively active (agonist-independent) μ-opioid receptor undergoes phosphorylation at Ser363, but the agonist-activated μ-opioid receptor (DAMGO-bound) undergoes phosphorylation at Thr370 (Doll et al., 2011; Lau et al., 2011).
There also is a great deal of data to show that different ligands produce different receptor conformations. The data can be categorized with the means by which these different conformations are detected, namely by the cell or through physicochemical experiments. Since receptors are allosteric proteins that are probed by cellular signalling proteins from the cytoplasm, different receptor conformations can be detected through differences in cellular signalling. While the therapeutic significance of these actions is still in question, the effects have been validated in many systems with numerous receptors (see reviews Kenakin, 2002a,b; 2006; 2007; Hermans, 2003; Kukkonen, 2004; Perez and Karnick, 2005). Therefore, the fact that biased signalling occurs is consistent with the stabilization of different 7TMR active states by ligands as this is the most simple explanation of the effect (Kenakin, 1995a). These phenomena have been described under the general term(s) biased agonism and/or functional selectivity and will specifically be discussed later in this paper (vide infra).
In addition to cellular readouts of selective receptor conformations, various chemical and structural approaches have demonstrated ligand-specific differences in receptor conformation. Thus, techniques such as fluorescent resonance energy transfer (Vilardaga et al., 2003; 2005; Swaminath et al., 2004; 2005; Granier et al., 2007; Lohse et al., 2008; Zurn et al., 2009), bioluminescence resonance energy transfer (Galandrin et al., 2008; Lohse et al., 2008), circular dichroism (Baneres et al., 2005), antibody binding (Tutor et al., 2007), kinetic studies (Swaminath et al., 2004), fluorescent receptor probes (Gether et al., 1995; Ghanouni et al., 2001; Kobilka and Gether, 2002), plasmon waveguide resonance spectroscopy (Hruby and Tollin, 2007; Georgieva et al., 2008), X-ray crystallography (Okada and Palczewski, 2001), 19F-NMR (Liu et al., 2012) and site-directed mutagenesis (Pellissier et al., 2009) all have shown that 7TMRs can form different tertiary conformations upon binding to different ligands. Computational methods also indicated how numerous receptor conformations can be formed. For example, ligand-induced rotational orientation changes in 7TMR helices of the β2-adrenoceptor demonstrate the production of agonist-selective 7TMR conformations. Specifically, the changes produced by agonists such as norepinephrine and dopamine (breaking of the ionic lock between R1313.5 and the intracellular end of TM3 and E2686.30 on TM6) and engagement of the rotamer switch (toggle switch on W2866.48) are not produced by the agonists salbutamol (which only breaks the ionic lock) or catechol (which only engages the rotamer toggle switch) (Bhattacharya et al., 2008). In light of the data to show 7TMRs have the intrinsic ability to form numerous conformations, it is useful to describe receptor systems in terms of molecular dynamics and probability functions. This considers proteins as dynamic systems of interchangeable conformations, the sum of which is referred to as an ensemble (Onaran and Costa, 1997; Onaran et al., 2002).
Multiple receptor states can be described with linkage models by defining additional receptor species that go on to interact with signalling proteins; for example, a three state model of receptor signalling has been proposed (Scaramellini and Leff, 2002). However, a limitation to reconciling newly obtained data with early descriptions of efficacy is the need to define and incorporate these new species into equations. In cases of multiple receptor states, this becomes unwieldy and requires too many un-verifiable parameters. Molecular dynamic techniques can be used to estimate the probability of multiple protein states and can facilitate thinking in terms of multiple conformation states, efficacies and biased signalling. Probability partition functions have shown that ligand binding is not a passive process but rather that it actively modifies the conformational makeup of receptor ensembles (Onaran and Costa, 1997; Kenakin and Onaran, 2002; Onaran et al., 2002). A useful view is to envision receptor proteins as rolling on an ‘energy landscape’ sampling a number of conformations as low energy wells within this landscape (Fraunfelder et al., 1988; 1991; Woodward, 1993; Hilser and Freire, 1997; Freire, 1998; Hilser et al., 1998; 2006; Ma et al., 2002). As discussed previously and as shown by equation 1, if a ligand has different affinity for two receptor states (α ≠ 1) and if the states are in reversible equilibrium with one another, then the presence of the ligand necessarily will change the makeup of the system (relative amounts of each conformation). This effect is compounded for a receptor ensemble since there are many more options for the ligand to choose. For example, the effect of a saturating concentration of ligand on an ensemble of 1 to n states on the fraction of receptors not in any chosen state (e.g. state i) is given by:
 |
(4) |
It can be seen from equation 4 that only in the case where α1 = α2 = α3 = … = αi = 1 (the ligand has identical affinity for all states) will the ratio of states not change upon ligand binding. Considering that it is unlikely that the ligand will have identical affinities for a large number of receptor states, this suggests that every ligand that binds to a receptor will in some way also alter the composition of the ensemble that is presented to the cell. This alteration in the composition of the receptor ensemble is the manifestation of ligand efficacy. On theoretical grounds, it has been shown through the application of probability partition functions to virtual data that affinity and efficacy are necessarily correlated (Kenakin and Onaran, 2002). These ideas further strengthen the notion that all drugs have affinity and efficacy (and that these pluridimensional efficacies may need to be observed through specifically designed assays).This also predicts that if a ligand binds to a receptor, it necessarily will change the behaviour of that receptor; that is, it will have some form of efficacy.
The idea that the process of drug binding to a receptor necessarily will change its conformation to cause a detectable effect (all drugs may have some form of efficacy) forms the rationale for generic ligand detection approaches utilizing bioluminescence resonance energy transfer (BRET) technology on separate proteins (Kocan and Pfleger, 2009; 2011), fusion proteins (Kocan et al., 2011) or dual BRET probes on receptors (Dacres et al., 2011). The collorary to this idea is that any ligand that binds to a receptor should be tested in every possible functional assay for that receptor in order to detect possibly useful therapeutic activity. For example, it has been known for a number of years that desipramine binds to α2-adrenoceptors but produces no overt α2-adrenoceptor response. However, recently, this binding has been linked to arrestin recruitment with no concomitant α2-adrenoceptor signalling. The β-3 arrestin recruitment has been linked to internalization of the α2-adrenoceptor which may, in turn, be associated with a useful clinical phenotypic profile in depressive disorders (Cottingham et al., 2011).
In terms of agonist efficacy and cell signalling, the alteration of receptor ensembles is compatible with different agonists producing unique patterns of cellular signalling through stabilization of sets of receptor conformations. The definition of a 7TMR active state should be reconsidered in terms of this idea. Specifically, regions of proteins move independently; thus, it cannot be assumed that a defined conformation in one region of the protein will always be formed with another defined conformation in another region of the protein. For example, if a given region of the receptor is in a fixed conformation, there will be an ensemble of conformations (some more prevalent than others) associated with that fixed regional conformation. If a region is fixed through ligand (see Figure 3A), there will be a selectively stabilized ensemble of conformations available for binding of guest molecules associated with that stabilized conformation (Figure 3B). The stabilization of certain preferred conformations by any given ligand will define the subsequent conformations of the cellular (guest) regions of the receptor to affect the conformations of the receptor presented to the cell. Thus, a ligand-stabilized receptor conformation could mean that a restricted and enriched ensemble of conformations will be presented to the cell cytosol to interact with signalling proteins. It would be unrealistic to assume that two ligands would stabilize identical proportions of these conformations, suggesting, in turn, that ligands will have a unique ‘bias’ towards the active states they present to cellular systems.
Figure 3.
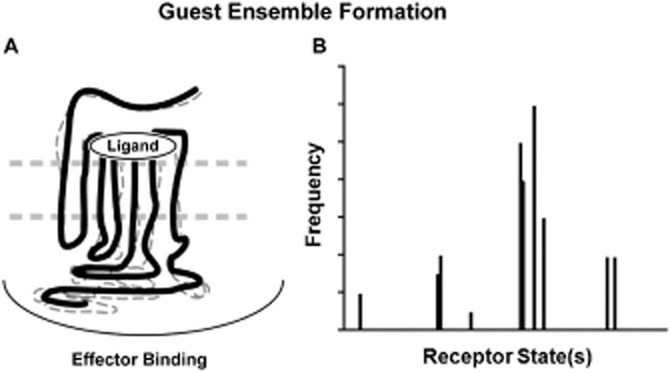
Keeping the conformation of a region of the 7TMR relatively fixed (through binding of a ligand) will lead to a biased ensemble of conformations throughout the protein. Insofar as some of those are associated with coupling to cellular signalling proteins, this will define the pharmacologic action of the ligand when the receptor is in the cell membrane. These various signalling regions of the receptor will adopt an ‘active state’ conformation with a range of probabilities depending on the nature of the ligand (histogram in panel B). Specifically, the frequency of occurrence of any given conformation will be influenced by the nature of the ligand binding to the receptor leading to a unique frequency distribution of conformations associated with that ligand.
It is worth considering the question, how does a given ligand express a physiological activity through 7TMR conformation stabilization within an ensemble environment? Given that receptor proteins explore their energy landscape, at any single instant, a snapshot of the basal ensemble would show a distribution of various conformations. Within this distribution would be conformations that lead to a cellular function (i.e. G-protein activation, β-arrestin binding, phosphorylation, etc.). As discussed previously, there would a distribution around these pharmacologically active conformations due to the fact that amino acid residues move independently. Therefore, there would be a small distribution of conformations around the region relevant to signal protein binding in other regions of the protein (see Figure 4). As noted, ligands contribute energy to this system through binding to selected conformations (Figure 3B). Those ligand-stabilized conformations that are coincident with pharmacologically active conformations will therefore provide the ligand with its pharmacological profile (Kenakin, 2002a). It should be noted that there are no data to indicate that there would only be one specific active state conformation responsible for the activation of a given signalling pathway but rather a preferred distribution of pathways. Thus, agonism would be the interaction of an agonist-stabilized population of conformations and a preferred population of active states for a particular signalling pathway. Figure 4 shows three hypothetical ligands that stabilize various conformations within the basal ensemble. The conformations coincident with two pharmacologically relevant ensembles (labelled G1 activation and β-arrestin) also are shown. The prevalence of these ensembles (either through the quantity that is stabilized and/or time spent in that conformation) defines the relative propensity of each ligand to produce activation of the pathway. The relative activation, in turn, makes up each ligands bias towards those signalling pathways (Figure 4). A further sophistication of this effect occurs if the guest molecule itself can form a range of conformations. For instance, it has been shown that β-arrestin can form a number of active conformations that can be stabilized by different ligand–receptor complexes (Shukla et al., 2008).
Figure 4.

Receptor concormational ensembles as frequency distributions. Top panel shows distributions of the unliganded receptor for a defined instant in time (lines identify relative quantity of a distribution). Grey distributions define the arrays of conformations that have an identifiable cellular function (i.e. activation of G-proteins, phosphorylation of receptor protein, etc.). Presence of a conformation coincident with a conformation in the pharmacologically functional ensemble indicates the basal activity of the system. For the unliganded receptor, few spontaneously formed conformations produce cellular efect. Middle panels show the effects of the binding of three separate ligands (A, B and C). With ligand binding comes clustering of conformations coincident with pharmacologically active ensembles. The presence of these pharmacologically active conformations define the observed activity of the ligand. Lower panels show how differences in ligand-stabilized clusters of conformations result in varying ratios of pharmacological activity for different pathways.
Efficacy and biased signalling
Agonist bias can be described as the ability of an agonist to differentially activate some cellular signalling pathways over others. However, this must be put into context that differentiates system bias from ligand bias. The former idea recognizes that not all cellular pathways will be coupled equally in any given cell; that is, the efficiency of coupling of signalling pathways will be wired according to the specific needs of a particular cell. For example, cardiac inotropy (increased isometric force of contraction) and lusitropy (rate of relaxation) are differentially coupled in a guinea pig atrium (Kenakin et al., 1991) such that dose–response curves to β-adrenoceptor agonists for lusitropy lie approximately threefold to the left of inotropic curves. This may suggest that it requires less intracellular cAMP to initiate relaxation that it does inotropy in this particular tissue. This is not a therapeutically useful bias as it will be unique to the particular system being tested and cannot be relied upon to be true in humans. In addition, this system bias will be operative for all agonists. Therefore, the agonists pirbuterol and isoproterenol both are subject to system bias but are identical in their ability to produce the two responses (Kenakin et al., 1991); they demonstrate no ligand bias. Within system bias, there can be ligand bias if agonists differ in their propensity to activate pathways within a given system bias; this reflects the stabilization of unique receptor conformations and constitutes ligand bias. These types of effects would be expected to remain with the agonist–receptor pairs and carry over into a useful therapeutic bias. Therefore, ligand bias must be expressed relative to a reference agonist in any given system. It could be argued that the natural agonist would be a good choice, since differences seen for a synthetic agonist would then predict possible differences from endogenous signalling.
The foregoing discussions have shown how cytosol-directed allosteric probe dependence can lead to selective activation of signalling pathways by agonists; this topic has been reviewed recently in a number of publications (Perez and Karnick, 2005; Leach et al., 2007; Mailman, 2007; Kenakin and Miller, 2010). It is worth considering the positive and negative aspects of these phenomena. On the positive side, biased ligands have the potential to be better therapeutic entities than unbiased ligands (Maudsley et al., 2005; DeWire and Violin, 2011). For example, two major 7TMR pathways are G-protein activation and β-arrestin binding. Insofar as β-arrestin-2 binding is known to be a switch to turn off G-protein signalling, ligands biased to not recruit β-arrestin would be proposed to yield more persistent G-protein-based signalling and less desensitization (i.e. opioid receptor analgesia, Varga et al., 2004; Raehal et al., 2005; Groer et al., 2007). On the other hand, long-term low-level β-arrestin-based signalling has been identified as potentially useful for some receptors such as the PTH receptor for ligands aimed at treating osteoporosis (Ferrari et al., 2005; Gesty-Palmer et al., 2009), angiotensin ligands treating heart failure (Violin and Lefkowitz, 2007; Violin et al., 2010; Boerrigter et al., 2011) and GPR109-mediated treatment of displidaemia (Walters et al., 2009). The possible beneficial effects of β-arrestin signalling in cardiac function recently have been discussed (Tilley, 2011). Such unique profiles are not confined to agonists since allosteric antagonists and PAMs also have the potential to be superior therapies through signalling bias (Kenakin, 2010).
While offering possible therapeutic advantage, biased signalling also raises challenges to new drug discovery and the quantification of agonism. The fact that some agonists may stabilize different states of pleiotropically coupled receptors can lead to the degeneration of the simple monotonic relationship between agonist receptor occupancy and tissue response. Specifically, if the total cell response is a composite of several stimuli (i.e. entry of extracellular calcium plus release of intracellular calcium stores, ERK activation through G-protein plus β-arrestin stimulation, etc.), then the relative stoichiometry between the various signalling elements and receptors comes into play unless the agonists produce identical receptor states (as measured by identical activation of the pleiotropic signalling systems). For example, Figure 5 shows a receptor coupled to two signalling proteins activated by two agonists A and B. These agonists stabilize different active states such that agonist A is relatively unbiased towards effector pools 1 and 2, while agonist B is biased towards effector pool 2. Such variances in pathway activation are becoming well known such as the differences in the PTH receptor agonists [Trp1]PTHrp-1–36 and PTH-1A. Specifically, [Trp1]PTHrp-1–36 activates ERK mainly through G-protein pathways whereas the agonist PTH-1A activates ERK mainly through β-arrestin (Gesty-Palmer et al., 2006). For the example shown in Figure 5, the relative potency of agonists A and B may then vary depending on the relative emphasis of the stimulus coming from effector pools 1 and 2. Thus, the activity of agonist B will be disproportionately augmented in cells with a higher relative stoichiometry of effector pool B (see Figure 5). In this way variations in the availability of signalling components become a clear potential mechanism for cell-based variation in agonist efficacy. An example of this has been reported for 5-HT2A receptor agonists. Specifically, it has been shown that RSK2 (p90 ribosomal S6 kinase) attenuates 5-HT2A signalling through phosphorylation (Sheffler et al., 2006; Strachan et al., 2009). Accordingly, some but not all 5-HT2A agonists demonstrate augmented responses in RSK2 knockout mouse embryonic fibroblasts paralleling their relative dependence on this pathway (Strachan et al., 2010). The relative stoichiometry between receptors and pools of signalling molecules has been shown to be a factor in vitro with expression levels of the human calcitonin receptor. Low expression levels of calcitonin receptor in HEK 293 cells produce cells that, when activated by calcitonin agonists, only yield elevations in cAMP; whereas higher expression levels produce cells responding with elevated cAMP and calcium levels (Kenakin, 1997). This type of receptor density effect may even be extended to the special pattern of receptor expression on the cell surface. Thus, in spatially oriented intestinal epithelial cells, apical and basolateral proteinase-activated receptor-2 (PAR-2) receptors function as distinct pools in terms of receptor signalling (Lau et al., 2010). Cell-based variance in efficacy have been seen experimentally with differences in cell type (Table 1A), signal coupling stoichiometry (Table 1B) and assay format (Table 1C). In addition, cell-based agonist variability is observed in whole cell phosphorylation patterns. For instance, the muscarinic M3 receptor is differentially phosphorylated in different cell and tissue types, indicating a role for cell-specific phosphorylation in cell-specific signalling (Butcher et al., 2011).
Figure 5.
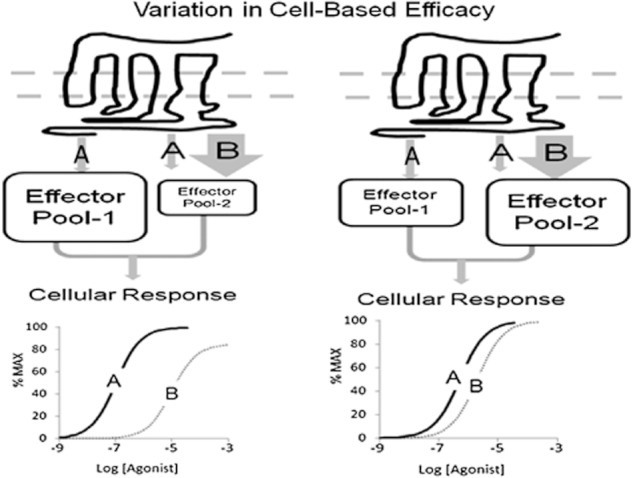
Effects of varying receptor/coupling protein stoichiometry on relative agonist activity. The receptor mediates cellular response through activation of two effectors 1 and 2. Agonist A produces a relatively uniform activation of both response effectors, whereas agonist B is biased towards effector-2. In cells with an increased stoichiometric ratio of receptor to effector 2, the response to agonist B will be disporportionateloy augmented to yield a different relative potency ratio for the two agonists in the two systems.
Table 1.
Systems where cell type (A), receptor/G-protein stoichiometry (B) or assay technology (C) produce variability in agonist potency ratios
| (A) Difference in host cells | ||||
|---|---|---|---|---|
| Agonist | CHO Cells (hCalcitonin R) | COS Cells (hCalcitonin R) | ΔPR (COS to CHO) | Reference |
| pCal | 1 | 1 | 1 | Christmanson et al., 1994 |
| hCal | 2.6 × 10⁻³ | 0.1 | 38.5 | |
| hCGRP | 1.48 × 10⁻⁵ | 0.024 | 1621 | |
| (B) Difference in signal coupling stoichiometry | ||||
|---|---|---|---|---|
| Wild Type HEK (hCalcitonin R) | Gαs-enriched HEK (hCalcitonin R) | ΔPR (HEK to HEKGαs) | ||
| pCal | 1 | 1 | 1 | Watson et al., 2000 |
| ECal | 3.53 | 0.17 | 20.8 | |
| (C) Difference in assay technology and signalling pathway(s) | ||||
|---|---|---|---|---|
| CDSa CHO (DopamineD2S R) | CHO cAMP (DopamineD2S R) | ΔPR (cAMP to CDS) | ||
| 7OH-DPAT pergolide dopamine bromocryptene | 1 | 1 | 1 | Peters et al., 2007 |
| 0.5 | 1 | 2 | ||
| 0.2 | 0.08 | 0.4 | ||
| 0.08 | 0.01 | 0.125 | ||
Cellular dielectric spectroscopy (Cell Key).
pCAL, porcine calcitonin; Ecal, Eel calcitonin; hCal, human calcitonin; hCGRP, calcitonin gene related peptide; 7OH-DPAT, 7-hydroxy-N,N-dipropyl aminotetralin.
As a general rule, the farther from the initial receptor binding event a signalling cascade is viewed, the more likely it will have the capability of detecting texture in efficacy. For example, the angiotensin agonist SII promotes the recruitment of β-arrestin to the angiotensin receptor. However, this single event can then be shown to promote the global receptor-mediated phosphorylation of proteins by angiotensin receptor activation to yield changes in the phosphorylation of 35 proteins (Xiao et al., 2010). It will be interesting to see if these complex patterns of global phosphorylation change with stimulation with different agonists.
Increases in the number of agonist-mediated cellular processes also can yield texture in overall efficacy measurements (i.e. differences between agonists will more likely be observed). For example, Evans et al. (2010) have shown that β-adrenoceptor ligands produce different patterns in the levels of various intracellular signalling molecules. They express these with a novel 10-axis graph representing a ‘web of efficacy’. Consideration of the complete ‘web’ brings out unique features of each ligands' efficacy. For example, while the ligands nebivolol and SR59230A have identical efficacy for elevation of levels of activator protein-1 (AP-1), they yield completely different efficacies for altering levels of NF-κB and cAMP (Evans et al., 2010). Such variation also will likely be seen in response systems where multiple stimuli converge to yield a total outcome (i.e. whole cell response). In view of the increasing prevalence of label free assay systems (Kenakin, 2009a; Fang, 2010a,b; Schröder et al., 2010), it would be predicted that label free agonist potency ratios will vary with cell type and other conditions. Furthermore, not considered in these discussions is the influence of real-time kinetics (Sykes et al., 2009; Guo et al., 2012) and the impact of pathophysiology on cell signalling mechanisms. These effects may well influence label-free responses in primary cell systems.
The loss of uniformity of whole cell agonist potency ratios poses a problem for drug discovery since agonists usually are optimized in test systems for use in therapeutic ones. In monotonic stimulus–response systems, agonist potency ratios allow prediction of relative agonist activity in any system. However, in systems where biased agonism is encountered, cell-based relative potencies may not provide system-independent measures of agonism. Since these are required for successful drug discovery, this raises the question how can biased efficacy be quantified in a system-independent manner?
Quantification of biased efficacy
For calculation of agonist activity ratios, a single number for each agonist is optimal. For full agonists producing the system maximal response, ratios of EC50 values (the effective concentration producing 50% of the maximal response to the agonist) are adequate as a single number since the maximal responses for two agonists will not be an issue. However, in general, agonism is characterized by a maximal response and a potency; therefore, the maximal response must be considered for partial agonists. EC50 values become ambiguous as single descriptors of agonism for two agonists of differing maximal response. For instance, a greater response will be observed from a concentration of 10 nM of an agonist of pEC50 8.0 and maximum of 90% than one with a pEC50 of 9.0 and a maximum of 15%, yet the ratio of EC50 values would indicate otherwise. Thus, both affinity and efficacy must be considered for a single number of agonism to be of value. This problem is solved for dose–response curves of unit slope with the application of relative activity (RA) ratios. Proposed by Ehlert and colleagues (Ehlert, 2005; Figueroa et al., 2009; Tran et al., 2009), the RA value is the maximal response of the agonist divided by the EC50. This furnishes a single number reflecting the power of a molecule to produce agonism in any system.
The value of ratios of agonism such as relative RA values is that they can be determined in a test system for prediction of relative agonism in the therapeutic one; that is, they should be transferrable across systems. Ignoring the problem of non-monotonic stimulus–response coupling for the moment, an analysis of RA ratios, in terms of the Black/Leff operational model, shows how relative RA ratios are transferrable across systems in cases where the slope of the dose–response curve is unity. Thus the Black/Leff operational model defines response as (Black and Leff, 1983):
| (5) |
where Em represents the maximal response capability of the system, KA is the equilibrium dissociation constant of the agonist–receptor complex, n is the slope of the dose–response curve and τ is the efficacy. This final term represents the receptor density and molecular interaction of the agonist–receptor complex interaction with the stimulus–response system of the cell, which itself has ligand-specific elements (efficacy of the ligand) and system-specific elements (efficiency of coupling of receptors to signalling pathway).
A theoretically complete term to describe the power of a ligand to active a cellular pathway is the term τ/KA; this incorporates both elements of efficacy and affinity. Considering that the most common difference between systems is receptor density, ratios of τ/KA account for these and should be system-independent measures of the relative power of ligands to activate pathways. In fact, it has been shown experimentally that τ/KA values for muscarinic agonists do not change with a change in receptor density (Kenakin et al., 2012). In terms of the maximal response and EC50 for dose–response curves in the Black Leff operational model (see Black et al., 1985), it can be shown that RA represents the relation:
| (6) |
For dose–response curves of unit slope (n = 1), it can be seen that RA reduces to the term Em(τ/KA). Ratios of these terms for particular agonists cancel the Em term and are therefore system independent. However, when n ≠ 1, equation 6 shows that RA values become system dependent (and therefore less useful as universal descriptors of agonism). For this reason, in these cases, the direct fitting of data to the Black/Leff operational model (equation 5) and estimation of τ/KA values is a theoretically more sound method of reducing agonism to a single index (Kenakin, 2009b; Kenakin and Miller, 2010; Evans et al., 2011; Tschammer et al., 2011; Kenakin et al., 2012). Values of τ/KA have the added advantage of circumventing another issue with full agonists, namely the fact that an infinite variety of combinations of efficacy and affinity can describe any given curve to a full agonist (there is no unique value of efficacy that can be identified unless the curve indicates partial agonism). It has been shown that the potency of an agonist can be described by the Black/Leff model as (Black et al., 1985):
| (7) |
Therefore, for high-efficacy full agonists (as τ values get large), a limiting value for KA is the EC50 (i.e. a first approximation for curve fitting would be to set KA to values >EC50). Subsequent iteration then identifies a unique ratio τ/KA that characterizes the full agonist response.
A very similar method for the quantification of ligand bias has been published, which yields a factor σlig that is essentially a τ value for a given signalling pathway (Rajagopal et al., 2011). This method relies on an independent estimate for KA. Theoretically this can be obtained from binding experiments however a major shortcoming of this approach is that allosteric binding affinity is dependent upon the nature of the co-binding ligand. Specifically, it can be shown that the concentration of ligand–receptor complex (expressed as a fraction of total receptor) for an allosteric system is given by:
| (8) |
where [A] is the co-binding ligand; KB and KA refer to the equilibrium dissociation constants of the allosteric and co-binding ligand, respectively; and α is the co-operativity factor for affinity between the allosteric and co-binding ligand. The observed (and operative) affinity, which will be the reciprocal of KB(oper.) of the allosteric ligand (for operational theory this will be the 7TMR agonist), from equation 8 is given by:
| (9) |
It can be seen from equation 9 that if the co-binding ligand does not impose cooperativity on the allosteric ligand (i.e. if α = 1), then the operational affinity will equal KB, and it will be system independent. However, if α ≠ 1, then the affinity of the allosteric ligand (the 7TMR agonist) necessarily will depend on both the nature of the co-binding ligand (α) and its concentration. For example, the operational affinity of the NMDA receptor antagonist ifenprodil changes by a factor of 5.17 when the concentration of the co-binding ligand (in this case, NMDA) is increased by a factor of 10 (Kew et al., 1996). Similarly, binding studies with the allosteric ligand [3H]dimethyl-W84 (N,N-bis[3-(1,3-dihydro-1,3-dioxo-4-methyl-2H-isoindol-2-yl)propyl]-N,N,N′,N′-tetramethyl-1,6-hexanediaminium diiodide) show that the affinity of the allosteric ligand gallamine for the free muscarinic M2 receptor is pKi = 8.27 ± 0.39, while in the presence of 1 μM of the co-binding N-methylscopolamine, it changes by a factor of 47 to pKi = 6.6 ± 0.19 (Trankle et al., 1999).
It is well known that signalling proteins co-binding to receptors produce changes in the affinity of agonist ligands. For example, peptide fusion experiments in Sf9 membranes show a 27-fold (β2AR Ki = 116 nM; β2AR-Gαs fusion Ki = 4.3 nM) increased affinity for isoproterenol with the presence of nucleotide-free Gs heterorimer protein to β2-adrenoceptors (Rasmussen et al., 2011). Studies utilizing the substituted cysteine accessibility method (SCAM) with κ-opioid receptors have shown clear changes in receptor conformation in transmembrane domains 6 and 7 with binding of Gα16 and/or Gαi2 G-protein subunits. These changes in conformation lead to substantial changes in the binding affinity for κ-opioid ligands (e.g. salvanorin shows an 18-fold change in affinity) (Yan et al., 2008). Recent studies on ghrelin receptors reconstituted into lipid discs labelled with a fluorescent reporter show clear presence of different receptor conformations upon addition of Gq to nanodiscs. Similarly, double exponential fluorescent lifetime decay analysis indicates the creation of yet different conformations upon addition of β-arrestin in the presence of ghrelin (Mary et al., 2012).
For 7TMR agonists, the ‘co-binding ligand’ is the signalling coupling protein. Therefore, there is no basis to believe that KA estimates made in binding will have any relevance to the KA for the specific signalling molecule (guest) in the cell for a given pathway. The operational affinity for the specific pathway must be used to adequately estimate the correct τ value for activation of that pathway. Through utilization of an operational KA obtained through fitting the functional data, the τ value is scaled to a unique value when Log(τ/KA) (or Log(RA) values for systems where the slope of dose–response curves is not significantly different from unity) estimates are used. The use of σlig ratios is formally identical to Log(τ/KA) values if the true pathway KA is known (and not simply obtained through binding). If a uniform estimate of affinity (or an estimate from binding studies is) is used to calculate σlig values, it can be shown that an error will result equal to the difference in the affinities of the agonist for the receptor when it is coupled to each of the signalling pathways:
 |
(10) |
where KA-Apath1 and KA-Apath2 refer to the relative affinity values for an agonist A for 2 pathways path1 and path2, and KA-Bpath1 and KA-Bpath2 refer to the relative affinity values for an agonist B for 2 pathways path1 and path2. A summary of some simple methods to quantify agonist bias is given in Table 2.
Table 2.
Methods to quantify agonist bias
| DR curve Array | Log EC50 Ratios | Log RA values | Log (τ/KA) values |
|---|---|---|---|
| 2 Full agonists | √ | √ | √ |
| 1 Full + 1 Partial Agonist (n = 1)a | X | √ | √ |
| 1 Full + 1 Partial Agonist (n ≠ 1)a | X | X | √ |
Hill coefficient of the dose–response curve.
Receptor occupancy and efficacy-driven phosphorylation barcodes
While biased signalling usually is discussed in terms of active trafficking of cellular stimulus to various pathways, there are two other aspects of biased effects that can contribute significantly to overall selective ligand profiles in vivo; these are (1) the physical occupancy of the endogenous ligand binding site by the biased ligand and (2) the pattern of phosphorylation of the receptor by cellular kinases controlled by the ligand-specific conformation. In terms of receptor occupancy, it should be recognized that a biased ‘agonist’ will function as an antagonist of endogenous molecules. Thus, the biased β-arrestin angiotensin molecule SII prevents angiotensin-mediated G-protein activation through angiotensin II receptors by its presence on the receptor. In addition, SII activates β-arrestin pathways; therefore, in this sense, SII could also be seen as a ‘biased antagonist’. As predicted for SII, the receptor antagonism by biased ligands may be an important aspect of the overall therapeutic value of biased ligands through diminution of angiotensin-induced activation of G-protein pathways that lead to a debilitating vasoconstriction in heart failure. Another such biased ‘agonist-antagonist’ is the histamine H4 antagonist JNJ7777120 (1-[(5-chloro-1H-indol-2-yl) carbonyl]-4-methylpiperazine); this ligand blocks G-protein-mediated signalling ([35S]GTPgS binding) but actively promotes histamine receptor recruitment of β-arrestin (Rosethorne and Charlton, 2011). Another example of where this type of profile of activity may yield therapeutic benefit is with the dopamine D2 receptor β-arrestin biased agonist UNC9975 (7-(4-(4-(2,3-dichlorophenyl)-1,4-diazepan-1-yl)butoxy)-3,4-dihydro-1,8-naphthyridin-2(1H)-one). This molecule is a partial agonist that blocks the Gi-protein-mediated cAMP of dopamine. It has been shown that this unique profile of β-arrestin agonism and Gi-protein antagonism leads to responses predicting antipsychotic activity in inbred C57B/6 mice in vivo without induction of debilitating motor side effects (Allen et al., 2011).
There are functions of receptors that appear to require a memory of past signalling events (i.e. desensitization with or without internalization, recycling to the cell surface versus degradation of receptors, etc.). There are numerous lines of evidence to implicate specific receptor phosphorylation in the coding of receptor function after ligand binding (for reviews see Tobin, 2008; Tobin et al., 2008). Advances in biochemical technology of protein phosphorylation (i.e. tryptic phosphopeptide maps, phosphor-specific antibodies, mass spectrometry) (Butcher et al., 2011; Kelly, 2011) have allowed the demonstration of agonist-selective direct phosphorylation of receptor states. For example, the μ-opioid receptor agonists DAMGO and etonitazene stimulate the phosphorylation of both Thr370 and Ser375, whereas morphine leads to phosphorylation of only Thr370 (Doll et al., 2011). These patterns of phosphorylation ‘barcode’ receptor for future disposition within the cytosol (Butcher et al., 2011; Nobles et al., 2011). In general, agonist functional selectivity in vivo should be considered a combined effect of unique efficacy due to stabilization of receptor conformations (stimulus bias and receptor phosphorylation) and antagonism due to receptor occupancy (see Figure 6).
Figure 6.

General view of three mechanisms for agonist selectivity in vivo. Thus, stabilization of unique receptor conformations can lead to bias of interaction of the receptor with cellular signalling molecules (stimulus trafficking) and presentation of conformations to GRKs for selective barcoding through phosphorylation. Binding of the agonist to the receptor interferes with the interaction of the receptor with the endogenous agonist.
Therapeutic application of signalling bias
There are an increasing number of examples of the successful development of biased agonists and antagonists; what presently is still not clear is the therapeutic significance of these new molecules. One of the main questions to be answered is how in vitro profiles of signalling bias will translate to in vivo conditions. It is evident that in a defined cell type (with set receptor density, relative stoichiometry of signalling elements and set efficiencies of receptor coupling), quantitative differences in cellular signals can be produced by different agonists (i.e. agonist-specific signalling profiles). However, the agonist will interact with a wide range of systems of varying receptor density. In addition, the concentration of agonist in vivo will be a changing quantity as the ligand is absorbed and cleared in vivo. Both of these effects can lead to varying ranges of signalling bias in the body with time. Figure 7 shows two agonists with a defined bias towards two signalling pathways; specifically, agonist A has high affinity and efficacy for both pathways, while agonist B has a high affinity but low efficacy for pathway 2 (over pathway 1). It can be seen from the bias plot (which simply expresses the response for pathway 2 for a given response for pathway 1) that agonist B reverses its relative bias over a concentration range. In general, as agonists are exposed to a range of cell types and change their relative concentration in vivo, it will be predicted that the overall signalling patterns produced will be extremely complex. This can be demonstrated further by calculating relative bias for agonists in a range of tissues with changing receptor densities. Figure 8 shows the signal produced by a biased agonist in a range of tissues of differing receptor density. In this case, the overall signal is taken to be the arithmetic difference of the two signalling pathways (obtained from the individual dose–response curves for each receptor system as the dotted and solid lines in Figure 8), but the nature of the forcing function uniting the various pathways into a whole cellular response is immaterial to the prediction. In general, it can be seen that the signals can vary dramatically over ranges of concentration and tissue types. Differences in receptor density have been shown to affect the predominance of agonism in signalling pathways. For example, in CHO cells containing high and low levels of expression of β3-adrenoceptors, the dominant signalling pathways changes from cAMP to p38 MAPK; and this, in turn, leads to differences in the bias of the ligands CL316243 ((R,R)-5-[2-[[2-(3-chlorophenyl)-2-hydroxyethyl]-amino]-propyl]1,3-benzodioxole-2,2-decarboxylate) and SR59230A (3-(2-ethylphenoxy)-1-[(1,S)-1,2,3,4-tetrahydronapth-1-ylamino]-2S-2-propanol oxalate) (Sato et al., 2007). In practical terms, the difficulty in predicting in vivo bias necessitates testing exemplar agonists (extremes of bias as determined in vitro) in the therapeutic system as early as possible in the discovery and development process.
Figure 7.
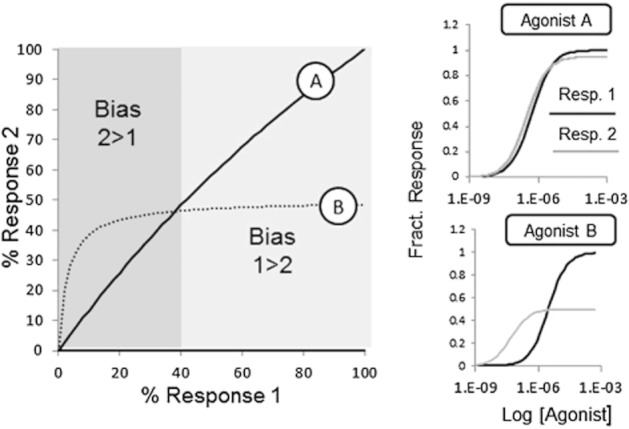
Bias plot for two agonists: A (relatively equal efficacy for pathways 1 and 2) and agonist B (higher affinity but lower efficacy for response 2). Panels on the right show the dose–response curves for both agonists for the two signalling pathways. The bias plot shows the response of each agonist for pathway 2 as a function of the response for pathway 1. For this particular tissue, agonist A produces relatively uniform activation of both pathways, while agonist B produces a selective effect for pathway 2 at low levels of stimulation followed by a saturated and lower level of response 2 at higher stimulation levels. Thus, bias is concentration and system dependent in that low concentrations of agonist B are biased 2 > 1, while higher concentrations the bias is reversed.
Figure 8.

Relative agonist response (calculated as the arithmetic difference of pathway stimulations indicated by dotted and solid dose–response curves in separate panels) for a wide range of tissues of differing receptor density. At low receptor density, the agonist produces primarily response denoted by the dotted dose–response curve, while at high receptor densities, a more balanced stimulation is obtained. The surface shows the complexity of overall stimulation to the range of systems with varying receptor densities.
Efficacy as a receptor property
The discovery that receptors can spontaneously form an active state that leads to constitutive cellular activity necessitates the notion that the receptor itself must have efficacy. This would be defined as the difference in the receptor behaviour towards the cell when it spontaneously forms an active state from cell activity with receptors present in the inactive state. The magnitude of receptor efficacy would be related to the allosteric constant controlling the spontaneous ability of the receptor to form the active state (allosteric constant = L = [Ra]/[Ri], where [Ra] and [Ri] refer to the concentrations of the active and inactive states respectively). Through transient transfection of receptors, it has been shown that receptors have varying propensity to produce constitutive activity (i.e. form the active state) (Fathy et al., 1999; Chen et al., 2000; Leeb-Lundberg et al., 2001). The ability of the spontaneously formed active state conformation to interact with cellular signalling proteins defines the relative cellular signalling ‘efficacies’ of this spontaneous active state. It already has been noted that there are data to indicate that the spontaneously formed active state(s) of the β2-adrenoceptor (Zhou et al., 1999) and the μ-opioid receptor (Liu et al., 2001; Doll et al., 2011; Lau et al., 2011) differ in their signalling characteristics from their agonist-bound counterparts. The efficacy of the intrinsic receptor will be related its amino acid sequence and tertiary structure. An extreme example of this variation is the activity of DREADDs (designer receptors exclusively activated by designer drugs, also referred to as RASSLs, receptors activated solely by synthetic ligands); these are engineered receptors that, by virtue of their structure, have lost their ability to be activated by natural agonists but are activated by synthetic agonists (Conklin et al., 2008; Pei et al., 2008; Dong et al., 2010; AlvarezCurto et al., 2011).
There is no reason a priori to assume that the spontaneous receptor active state will not have a bias in its own right that differs from the ligand-bound signalling bias. For example, it has been shown that post-transcriptional mRNA editing can produce mutations of the 5-HT2C receptor, and that these edits differentially alter ligand-dependent and independent signalling (Berg et al., 2008). This suggests that the very same strategies and tools used to quantify receptor bias can be used to do the same for mutant receptors. An example of how receptor mutation can produce quantifiable differences in ligand bias can be seen in the dopamine D2L receptor (Tschammer et al., 2011). As shown in Table 3, the relative bias of seven dopamine agonists for cAMP versus ERK1/2 signalling seen in the wild-type receptor differs considerably from the bias of these agonists in a mutant counterpart (H3936.55A). This bias signature indicates a basic change in the signalling properties of the protein upon mutation of His3936.55 to alanine (Tschammer et al., 2011).
Table 3.
Agonist Bias for the wild-type Dopamine D2L receptor versus its H3936.55A mutant counterpart
| (A) D2L wild-type receptor | |||||
|---|---|---|---|---|---|
| cAMP Log(τ/KA) | cAMP Δlog(τ/KA) | ERK1/2 Log(τ/KA) | ERK1/2 Δlog(τ/KA) | BIAS ΔΔLog(τ/KA) | |
| Quinpirole | 8.68 | 0 | 8.41 | 0 | 0 |
| 7-OH-DPAT | 8.73 | 0.05 | 9.17 | 0.76 | −0.71 |
| Dopamine | 8.7 | 0.02 | 8.62 | 0.21 | −0.19 |
| Aripiprazole | 7.16 | −1.52 | 6.67 | −1.74 | 0.22 |
| FAUC335 | 7.13 | −1.55 | 7.29 | −1.12 | −0.43 |
| FAUC321 | 7.7 | −0.98 | 8.19 | 0.22 | −1.2 |
| FAUC346 | 6.18 | −2.5 | 5.91 | −2.5 | 0 |
| (B) D2L H2936.55 A receptor | |||||
|---|---|---|---|---|---|
| cAMP Log(τ/KA) | cAMP Δlog(τ/KA) | ERK1/2 Log(τ/KA) | ERK1/2 Δlog(τ/KA) | BIAS (ΔΔLog(τ/KA) | |
| Quinpirole | 6.69 | 0 | 7.36 | 0 | 0 |
| 7-OH-DPAT | 7.55 | 0.86 | 7.71 | 0.35 | 0.51 |
| Dopamine | 6.75 | 0.06 | 6.45 | −0.91 | 0.97 |
| Aripiprazole | 6.25 | −0.44 | 6.91 | −0.45 | 0.01 |
| FAUC335 | 7.06 | 0.38 | 7.53 | 0.17 | 0.21 |
| FAUC321 | 7.78 | 1.09 | 8.26 | 0.9 | 0.19 |
| FAUC346 | 6.96 | 0.27 | 7.48 | 0.12 | 0.15 |
ΔLog(τ/KA) values taken with Quinpirole as the reference standard agonist. Bias values represent the relative activation of the cAMP pathway versus the ERK1/2 pathway (ΔΔLog(τ/KA)).
FAUC335 = N-[3-[4-(2-methylsulfanylphenyl)piperazin-1-yl]propyl] pyrazolo-[1,5-a]pyridine-3-carboxamide.
FAUC321 = N-[3-[4-(2-methoxyphenyl)piperazin-1-yl]pyrazolo-[1,5-a] pyridine-3-carboxamide.
FAUC346 = N-[4-[4-(2-methoxyphenyl)piperazin-1-yl]butyl] benzo[b]thiophene −2-carboxamide.
Conferring efficacy to receptor states is a useful concept when considering ionic effects on receptors. For example, functional effects are observed with the orphan receptor GPR39 with Zn2+. As described by Storjohann et al. (2008), the effect of ions such as Zn2+ can be described as the stabilization of a constitutively active receptor state. Seen within this context, ionic stabilization of receptor states is formally similar to receptor mutation and can be described in terms of efficacy.
Linking efficacy to drug labels
Traditionally, pharmacology has actively been involved in the taxonomy of biologically active molecules (i.e. the classification and naming of drugs). These classifications have been linked with efficacy. Historically, this was a fairly simple procedure involving the target (receptor type and subtype) and most prominent observed effect (agonist, antagonist). However, as the number of vantage points available to view receptor behaviour increases, so too does the list of observed pharmacological actions, and these often lead to a plethora of conflicting labels (Kenakin, 2008). For example, the CB1 cannabinoid ligand desacetyllevonantradol is a positive agonist for Gi1 and Gi2 but an inverse agonist for Gi3. Similarly, (R)-methanandamide is an inverse agonist for Gi1 and Gi2 but a positive agonist for Gi3 (Mukhopadhyay and Howlett, 2005). As discussed previously, drugs can even change their classifications with cellular conditions as in the case of protean agonists. Thus, the β-adrenoceptor protean agonist dichloroisoproterenol can produce partial agonism in some systems and inverse agonism in others (Chidiac et al., 1996). Simple labels based on single efficacies of ligands can become obstructive to the understanding of valuable therapeutic phenotypes. For example, the constellation of efficacies belonging to carvedilol (beyond its activity as a β-blocker) may be its most important feature as a treatment for congestive heart failure (Metra et al., 2004). These ideas suggest that as pluridimensional efficacies are identified for drugs, classifications and labels for drugs must be adjusted accordingly. This complicates the future for nomenclature compendia, such as the Guide to Receptors and Channels (Alexander et al., 2011) and http://GuideToPharmacology.org.
Conclusions
The simple concept of efficacy as a measure of the power of an agonist to produce cellular activation through a 7TM receptor has undergone radical modification over the past 20 to 25 years. These changes have both opened new therapeutic horizons for 7TMR drugs and also made the process of discovering and developing these new therapies more challenging. These new ideas related to efficacy have changed pharmacological approaches to new drug discovery in specific ways to indicate the following concepts:
Simple cell-based potency ratios may not be sufficient for prediction of therapeutic agonism in all systems.
Efficacy has quality as well as quantity in that textured and non-uniform signalling may be produced by synthetic agonists.
‘Hits’ from screens should not be assumed to produce equal quality of response.
Efficacy is pluridimensional, and it may be the complete set of efficacies for any given compound that contribute to its overall therapeutic value.
Pharmacological assays are the key to observing unique efficacy patterns.
Finally, at this point in time, there are compounds in late stage development that may allow the translational process of relating biased efficacy to therapeutic phenotypes.
Conflict of interest
The author declares no conflict of interest in writing this paper.
References
- Alexander SPH, Mathie A, Peters JA. Guide to Receptors and Channels (GRAC), 5th edition. Br J Pharmacol. 2011;164(Suppl. 1):S1–S324. doi: 10.1111/j.1476-5381.2011.01649_1.x. [DOI] [PMC free article] [PubMed] [Google Scholar]
- Allen JA, Yost JM, Setola V, Chen X, Sassano MF, Chen M, et al. Discovery of β-arrestin-biased dopamine D2 ligands for probing signal transduction pathways essential for antipsychotic activity. Proc Natl Acad Sci U S A. 2011;108:18488–18493. doi: 10.1073/pnas.1104807108. [DOI] [PMC free article] [PubMed] [Google Scholar]
- AlvarezCurto E, Prihandoko R, Tautermann CS, Zwier JM, Pediani JD, Lohse MJ, et al. Developing chemical genetic approaches to explore G protein-coupled receptor function: validation of the use of a receptor activated solely by synthetic ligand (RASSL) Mol Pharmacol. 2011;80:1033–1046. doi: 10.1124/mol.111.074674. [DOI] [PMC free article] [PubMed] [Google Scholar]
- Ariens EJ. Affinity and intrinsic activity in the theory of competitive inhibition. Arch Int Pharmacodyn Ther. 1954;99:32–49. [PubMed] [Google Scholar]
- Baneres J-L, Mesnier D, Martin A, Joubert L, Dumuis A, Bockaret J. Molecular characterization of a purified 5-HT4 receptor. J Biol Chem. 2005;280:20253–20260. doi: 10.1074/jbc.M412009200. [DOI] [PubMed] [Google Scholar]
- Berg KA, Maayani S, Goldfarb J, Scaramelli C, Leff P, Clarke WP. Effect pathway-dependent relative efficacy at serotonin type 2A and 2C receptors: evidence for agonist-directed trafficking of receptor stimulus. Mol Pharmacol. 1998;54:94–104. [PubMed] [Google Scholar]
- Berg KA, Dunlop J, Sanchez T, Silva M, Clarke WP. A conservative, single-amino acid substitution in the second cytoplasmic domain of the human serotonin2C receptor alters both lignd-dependent and –independent receptor signaling. J Pharmacol Exp Ther. 2008;324:1084–1092. doi: 10.1124/jpet.107.131524. [DOI] [PubMed] [Google Scholar]
- Bhattacharya S, Hall SE, Li H, Vaidehi N. Ligand-stabilized conformational states of human β2 adrenergic receptor: insight into G-protein-coupled receptor activation. Biophys J. 2008;94:2017–2042. doi: 10.1529/biophysj.107.117648. [DOI] [PMC free article] [PubMed] [Google Scholar]
- Black JW, Leff P. Operational models of pharmacological agonist. Proc R Soc Lond [Biol] 1983;220:141–162. doi: 10.1098/rspb.1983.0093. [DOI] [PubMed] [Google Scholar]
- Black JW, Leff P, Shankley NP. An operational model of pharmacological agonism: the effect of E/[A] curve shape on agonist dissociation constant estimation. Br J Pharmacol. 1985;84:561–571. doi: 10.1111/j.1476-5381.1985.tb12941.x. [DOI] [PMC free article] [PubMed] [Google Scholar]
- Boerrigter G, Lark MW, Whalen EJ, Soergel DG, Violin JD, Burnett JC. Cardiorenal actions of TRV120027, a novel β-arrestin-biased ligand at the angiotensin II Type I receptor, in healthy and heart failure canine: a novel therapeutic strategy for acute heart failure. Circ Heart Fail. 2011;4:770–778. doi: 10.1161/CIRCHEARTFAILURE.111.962571. [DOI] [PubMed] [Google Scholar]
- Bosshard HR. Molecular recognition by induced fit: how fit is the concept? News Physiol Sci. 2001;16:171–173. doi: 10.1152/physiologyonline.2001.16.4.171. [DOI] [PubMed] [Google Scholar]
- Burgen ASV. Confomrational changes and drug action. Fed Proc. 1981;40:2723–2728. [PubMed] [Google Scholar]
- Butcher AJ, Prihandoko R, Kong KC, McWilliams P, Edwards JM, Bottrill A, et al. Differential G-protein-coupled receptor phosphorylation provides evidence for a signaling barcode. J Biol Chem. 2011;286:11506–11518. doi: 10.1074/jbc.M110.154526. [DOI] [PMC free article] [PubMed] [Google Scholar]
- Chen G, Way J, Armour S, Watson C, Queen K, Jayawickreme C, et al. Use of constitutive G protein-coupled receptor activity for drug discovery. Mol Pharmacol. 2000;57:125–134. [PubMed] [Google Scholar]
- Chidiac P, Nouet P, Bouvier M. Agonist-induced modulation of inverse agonist efficacy at the beta-2 adrenergic receptor. Mol Pharmacol. 1996;50:662–666. [PubMed] [Google Scholar]
- Christmanson L, Westermark P, Betsholtz C. Islet amyloid polypeptide stimulates cyclic AMP accumulation via the porcine calcitonin receptor. Biochem Biophys Res Commun. 1994;205:1226–1235. doi: 10.1006/bbrc.1994.2796. [DOI] [PubMed] [Google Scholar]
- Clark AJ. General Pharmacology: in: ‘Heffner's Handbuch Der Experimentellen Pharmacologie Ergänzungsband, Band 4. Berlin: Springer-Verlag; 1937. [Google Scholar]
- Conklin BR, Hsiao EC, Claeyson S, Dumuis A, Srinivasan S, Forsayeth JR, et al. Engineering GPCR signaling pathways with RASSLs. Nat Methods. 2008;5:673–678. doi: 10.1038/nmeth.1232. [DOI] [PMC free article] [PubMed] [Google Scholar]
- Costa T, Herz A. Antagonists with negative intrinsic activity at δ-opioid receptors coupled to GTP-binding proteins. Proc Natl Acad Sci U S A. 1989;86:7321–7325. doi: 10.1073/pnas.86.19.7321. [DOI] [PMC free article] [PubMed] [Google Scholar]
- Cottingham C, Chen Y, Wang Q. The antidepressant desipramine is an arrestin-biased ligand at the a2-adrenergic receptor driving receptor down-regulation in vitro and in vivo. J Biol Chem. 2011;286:36063–36075. doi: 10.1074/jbc.M111.261578. [DOI] [PMC free article] [PubMed] [Google Scholar]
- Dacres H, Wang J, Leitch V, Horne I, Anderson AR, Trowell SC. Greatly enhanced detection of a volatile ligand at femtomolar levels using bioluminescence resonance energy transfer (BRET) Biosens Bioelectron. 2011;29:119–124. doi: 10.1016/j.bios.2011.08.004. [DOI] [PubMed] [Google Scholar]
- DeLean A, Stadel JM, Lefkowitz RJ. A ternary complex model explains the agonist-specific binding properties of adenylate cyclase coupled β-adrenergic receptor. J Biol Chem. 1980;255:7108–7117. [PubMed] [Google Scholar]
- DeWire S, Violin JD. Biased ligands for better cardiovascular drugs. Dissecting G-protein-coupled receptor pharmacology. Circ Res. 2011;109:205–216. doi: 10.1161/CIRCRESAHA.110.231308. [DOI] [PubMed] [Google Scholar]
- Doll C, Konietzko F, Pöll F, Köch T, Holt V, Schultz S. Agonist-selective patterns of m-opioid receptor phosphorylation revealed by phosphosite-specific antibodies. Br J Pharmacol. 2011;164:298–307. doi: 10.1111/j.1476-5381.2011.01382.x. [DOI] [PMC free article] [PubMed] [Google Scholar]
- Dong S, Rogan SC, Roth BL. Directed molecular evolution of DREADDs: a generic approach to creating next-generation RASSLs. Nat Protoc. 2010;5:561–573. doi: 10.1038/nprot.2009.239. [DOI] [PubMed] [Google Scholar]
- Ehlert FJ. Estimation of the affinities of allosteric ligands using radioligand binding and pharmacological null methods. Mol Pharmacol. 1988;33:187–194. [PubMed] [Google Scholar]
- Ehlert FJ. Analysis of allosterism in functional assays. J Pharmacol Exp Ther. 2005;315:740–754. doi: 10.1124/jpet.105.090886. [DOI] [PubMed] [Google Scholar]
- Evans BA, Sato M, Sarwar M, Hutchinson DS, Summers RJ. Ligand-directed signaling at β-adrenoceptors. Br J Pharmacol. 2010;159:1022–1038. doi: 10.1111/j.1476-5381.2009.00602.x. [DOI] [PMC free article] [PubMed] [Google Scholar]
- Evans BA, Broxton N, Merlin J, Sato M, Hutchinson DS, Christopoulos A, et al. Quantification of Functional Selectivity at the Human α1A-Adrenoceptor. Mol Pharmacol. 2011;79:298–307. doi: 10.1124/mol.110.067454. [DOI] [PubMed] [Google Scholar]
- Fang Y. Live cell optical sensing for high throughput applications. Adv Biochem Eng Biotechnol. 2010a;118:153–164. doi: 10.1007/10_2009_4. [DOI] [PubMed] [Google Scholar]
- Fang Y. Label-free receptor assays. Drug Disc Today. 2010b;7:e5–e11. doi: 10.1016/j.ddtec.2010.05.001. [DOI] [PMC free article] [PubMed] [Google Scholar]
- Fathy DB, Lee L, Mathis SA, Leeb-Lundberg LMF. Spontaneous human B2 bradykinin receptor activity determines the action of partial agonists as agonists or inverse agonists. J Biol Chem. 1999;274:29603–29606. doi: 10.1074/jbc.274.42.29603. [DOI] [PubMed] [Google Scholar]
- Ferrari SL, Pierroz DD, Glatt V, Goddard DS, Bianchi EN, Lin FT, et al. Bone response to intermittent parathyroid hormone is altered in mice bull for (beta) arrestin 2. Endocrinol. 2005;146:1854–1862. doi: 10.1210/en.2004-1282. [DOI] [PubMed] [Google Scholar]
- Figueroa KW, Griffin MT, Ehlert FJ. Selectivity of agonists for the active state of M1 to M4 muscarinic receptor subtypes. J Pharmacol Exp Ther. 2009;328:331–342. doi: 10.1124/jpet.108.145219. [DOI] [PMC free article] [PubMed] [Google Scholar]
- Fisher A, Heldman E, Gurwitz D, Haring R, Barak D, Meshulam H, et al. Selective signaling via unique M1 muscarinic agonists. Ann N Y Acad Sci. 1993;695:300–303. doi: 10.1111/j.1749-6632.1993.tb23070.x. [DOI] [PubMed] [Google Scholar]
- Fraunfelder H, Parak F, Young RD. Conformational substrates in proteins. Annu Rev Biophys Biophys Chem. 1988;17:451–479. doi: 10.1146/annurev.bb.17.060188.002315. [DOI] [PubMed] [Google Scholar]
- Fraunfelder H, Sligar SG, andWolynes PG. The energy landscapes and motions of proteins. Science. 1991;254:1598–1603. doi: 10.1126/science.1749933. [DOI] [PubMed] [Google Scholar]
- Freire E. Statistical thermodynamic linkage between conformational and binding equilibria. Adv Protein Chem. 1998;51:255–279. doi: 10.1016/s0065-3233(08)60654-3. [DOI] [PubMed] [Google Scholar]
- Furchgott RF. The use of β-haloalkylamines in the differentiation of receptors and in the determination of dissociation constants of receptor-agonist complexes. In: Harper NJ, Simmonds AB, editors. Advances in Drug Research. Vol. 3. New York: Academic Press; 1966. pp. 21–55. [Google Scholar]
- Galandrin S, Bouvier M. Distinct signaling profiles of b1 and b2 adrenergic receptor ligands toward adenylyl cyclase and mitogen-activated protein kinase reveals the pluridimensionality of efficacy. Mol Pharmacol. 2006;70:1575–1158. doi: 10.1124/mol.106.026716. [DOI] [PubMed] [Google Scholar]
- Galandrin S, Oligny-Longpre G, Bonin H, Ogawa K, Gales C, Bouvier M. Conformational rearrangements and signaling cascades invovled in ligand-based mitogen-activated protein kinase singaling through the β1-adrenergic recepor. Mol Pharmacol. 2008;74:162–172. doi: 10.1124/mol.107.043893. [DOI] [PubMed] [Google Scholar]
- Georgieva T, Devanathan S, Stropova D, Park PK, Salamon Z, Tollin G, et al. Unique agonist-bound cannabinoid CB1 receptor conformations indicate agonist specificity in signaling. Eur J Pharmacol. 2008;581:19–29. doi: 10.1016/j.ejphar.2007.11.053. [DOI] [PMC free article] [PubMed] [Google Scholar]
- Gesty-Palmer D, Chen M, Reiter E, Ahn S, Nelson CD, Wang S, et al. Distinct β-Arrestin- and G protein-dependent pathways for parathyroid hormone receptor-stimulated ERK1/2 activation. J Biol Chem. 2006;281:10856–10864. doi: 10.1074/jbc.M513380200. [DOI] [PubMed] [Google Scholar]
- Gesty-Palmer D, Flanner P, Yuan L, Corsino L, Spurney R, Lefkowitz RJ, et al. A b-arrestin-biased agonist of the parathyroid hormone receptor (PTHR1) promotes bone formation independent of G protein activation. Sci Transl Med. 2009;1:1ra1. doi: 10.1126/scitranslmed.3000071. [DOI] [PMC free article] [PubMed] [Google Scholar]
- Gether U, Lin S, Kobilka BK. Fluorescent labeling of purified β2-adrenergic receptor: evidence for ligand specific conformational changes. J Biol Chem. 1995;270:28268–28275. doi: 10.1074/jbc.270.47.28268. [DOI] [PubMed] [Google Scholar]
- Ghanouni P, Gryczynski Z, Steenhuis JJ, Lee TW, Farrens DL, Lakowicz JR, et al. Functionally different agonists produce distinct conformations in G-protein coupling domains of the β2-adrenergic receptor. J Biol Chem. 2001;276:24433–24436. doi: 10.1074/jbc.C100162200. [DOI] [PubMed] [Google Scholar]
- Granier S, Kim T, Shafer AM, Ratnala VR, Fung JJ, Zare RN, et al. Structure and conformational changes in the C-terminal domain of the beta2-adrenoceptor: insights from fluorescence resonance energy transfer studies. J Biol Chem. 2007;282:13895–13905. doi: 10.1074/jbc.M611904200. [DOI] [PubMed] [Google Scholar]
- Gray JA, Roth BL. Paradoxical trafficking and regulation of 5-HT(2A) receptors by agonists and antagonists. Brain Res Bull. 2001;56:441–451. doi: 10.1016/s0361-9230(01)00623-2. [DOI] [PubMed] [Google Scholar]
- Groer CE, Tidgewell K, Moyer RA, Harding WW, Rothman RB, Prisinzano TE, et al. An opioid agonist that does not induce mu opioid receptor-arrestin interactions or receptor internalization. Mol Pharmacol. 2007;71:549–557. doi: 10.1124/mol.106.028258. [DOI] [PMC free article] [PubMed] [Google Scholar]
- Gudermann T, Kalbrenner F, Schultz G. Diversity and selectivity of receptor-G protein interaction. Annu Rev Pharmacol Toxicol. 1996;36:429–459. doi: 10.1146/annurev.pa.36.040196.002241. [DOI] [PubMed] [Google Scholar]
- Guo D, Mulder-Krieger T, IJzerman AP, Heitman LH. Functional efficacy of adenosine A2A receptor agonists is positively correlated to their receptor residence time. Br J Pharmacol. 2012;166:1846–1859. doi: 10.1111/j.1476-5381.2012.01897.x. [DOI] [PMC free article] [PubMed] [Google Scholar]
- Gurwitz D, Haring R, Heldman E, Fraser CM, Manor D, Fisher A. Discrete activation of transduction pathways associated with acetylcholine M1 receptor by several muscarinic ligands. Eur J Pharmacol. 1994;267:21–31. doi: 10.1016/0922-4106(94)90220-8. [DOI] [PubMed] [Google Scholar]
- Heldman E, Barg J, Fisher A, Levy R, Pittel Z, Zimlichman R, et al. Pharmacological basis for functional selectivity of partial muscarinic receptor agonists. Eur J Pharmacol. 1996;297:283–291. doi: 10.1016/0014-2999(95)00745-8. [DOI] [PubMed] [Google Scholar]
- Hermans E. Biochemical and pharmacological control of the multiplicity of coupling at G-protein coupled receptors. Pharmacol Ther. 2003;99:25–44. doi: 10.1016/s0163-7258(03)00051-2. [DOI] [PubMed] [Google Scholar]
- Hilser J, Freire E. Predicting the equilibrium protein folding pathway: structure-based analysis of staphylococcal nuclease. Prot Struct Func Genet. 1997;27:171–183. doi: 10.1002/(sici)1097-0134(199702)27:2<171::aid-prot3>3.0.co;2-j. [DOI] [PubMed] [Google Scholar]
- Hilser J, Dowdy D, Oas TG, Freire E. The structural distribution of cooperative interactions in proteins: analysis of the native state ensemble. Proc Natl Acad Sci U S A. 1998;95:9903–9908. doi: 10.1073/pnas.95.17.9903. [DOI] [PMC free article] [PubMed] [Google Scholar]
- Hilser VJ, Garcia-Moreno EB, Oas TG, Kapp G, Whitten ST. A statistical thermodynamic model of protein ensembles. Chem Rev. 2006;106:1545–1558. doi: 10.1021/cr040423+. [DOI] [PubMed] [Google Scholar]
- Hruby VJ, Tollin G. Plasmon-waveguide resonance (PWR) spectroscopy for directly viewing rates of GPCR/G-protein interactions and quantifying affinities. Curr Opin Pharmacol. 2007;7:507–514. doi: 10.1016/j.coph.2007.08.001. [DOI] [PMC free article] [PubMed] [Google Scholar]
- Kelly E. The subtleties of μ-opioid receptor phosphorylation. Br J Pharmacol. 2011;164:294–297. doi: 10.1111/j.1476-5381.2011.01387.x. [DOI] [PMC free article] [PubMed] [Google Scholar]
- Kenakin T. Receptor conformational induction versus selection: all part of the same energy landscape.[Editorial] Trends Pharmacol Sci. 1996;17:190–191. [Google Scholar]
- Kenakin TP. The relative contribution of affinity and efficacy to agonist activity: organ selectivity of noradrenaline and oxymetazoline with reference to the classification of drug receptors. Br J Pharmacol. 1984;81:131–143. doi: 10.1111/j.1476-5381.1984.tb10753.x. [DOI] [PMC free article] [PubMed] [Google Scholar]
- Kenakin TP. Agonist-receptor efficacy II: Agonist-trafficking of receptor signals. Trends Pharmacol Sci. 1995a;16:232–238. doi: 10.1016/s0165-6147(00)89032-x. [DOI] [PubMed] [Google Scholar]
- Kenakin TP. Pharmacological proteus trends. Pharmacol Sci. 1995b;16:256–258. doi: 10.1016/s0165-6147(00)89037-9. [DOI] [PubMed] [Google Scholar]
- Kenakin TP. Agonist-specific receptor conformations. Trends Pharmacol Sci. 1997;18:416–417. doi: 10.1016/s0165-6147(97)01127-9. [DOI] [PubMed] [Google Scholar]
- Kenakin TP. Inverse, protean, and ligand-selective agonism: matters of receptor conformation. FASEB J. 2001;15:598–611. doi: 10.1096/fj.00-0438rev. [DOI] [PubMed] [Google Scholar]
- Kenakin TP. Efficacy at G Protein coupled receptors. Annu Rev Pharmacol Toxicol. 2002a;42:349–379. doi: 10.1146/annurev.pharmtox.42.091401.113012. [DOI] [PubMed] [Google Scholar]
- Kenakin TP. Efficacy at G Protein coupled receptors. Nat Rev Drug Discov. 2002b;1:103–109. doi: 10.1038/nrd722. [DOI] [PubMed] [Google Scholar]
- Kenakin TP. New concepts in drug discovery: collateral efficacy and permissive antagonism. Nature Rev Drug Disc. 2005;4:919–927. doi: 10.1038/nrd1875. [DOI] [PubMed] [Google Scholar]
- Kenakin TP. Collateral efficacy as pharmacological problem applied to new drug discovery. Expert Opin Drug Disc. 2006;1:635–652. doi: 10.1517/17460441.1.7.635. [DOI] [PubMed] [Google Scholar]
- Kenakin TP. Functional selectivity through protean and biased agonism: who steers the ship? Mol Pharmacol. 2007;72:1393–1401. doi: 10.1124/mol.107.040352. [DOI] [PubMed] [Google Scholar]
- Kenakin TP. Pharmacological onomastics: what's in a name? Br J Pharmacol. 2008;153:432–438. doi: 10.1038/sj.bjp.0707407. [DOI] [PMC free article] [PubMed] [Google Scholar]
- Kenakin TP. Cellular assays as portals to seven-transmembrane receptor-based drug discovery. Nature Rev Drug Disc. 2009a;8:617–626. doi: 10.1038/nrd2838. [DOI] [PubMed] [Google Scholar]
- Kenakin TP. 7TM receptor allostery: putting numbers to shapeshifting proteins. Trends Pharmacol Sci. 2009b;30:460–469. doi: 10.1016/j.tips.2009.06.007. [DOI] [PubMed] [Google Scholar]
- Kenakin TP. Perspectives in pharmacology: functional selectivity and biased receptor signaling. J Pharmacol Exp Ther. 2010;336:296–302. doi: 10.1124/jpet.110.173948. [DOI] [PubMed] [Google Scholar]
- Kenakin TP, Miller LJ. Seven transmembrane receptors as shapeshifting proteins: the impact of allosteric modulation and functional selectivity on new drug discovery. Pharmacol Rev. 2010;62:265–304. doi: 10.1124/pr.108.000992. [DOI] [PMC free article] [PubMed] [Google Scholar]
- Kenakin TP, Onaran O. The ligand paradox between affinity and efficacy: can you be there and not make a difference? Trends Pharmacol Sci. 2002;23:275–280. doi: 10.1016/s0165-6147(02)02036-9. [DOI] [PubMed] [Google Scholar]
- Kenakin TP, Ambrose JR, Irving PE. The relative efficiency of β-adrenoceptor coupling to myocardial inotropy and diastolic relaxation: organ selective treatment for diastolic dysfunction. J Pharmacol Exp Ther. 1991;257:1189–1197. [PubMed] [Google Scholar]
- Kenakin TP, Morgan P, Lutz M, Weiss J. The evolution of drug-receptor models: the cubic ternary complex model for G-protein coupled receptors. In: Kenakin TP, Angus JA, editors. Handbook of Experimental Pharmacology, Vol 148, General Pharmacology: The Pharmacology of Functional, Biochemical, and Recombinant Receptor Systems'. Berlin: Springer-Verlag; 2000. pp. 147–166. [Google Scholar]
- Kenakin TP, Watson C, Muniz-Medina V, Christopoulos A, Novick S. A simple method for quantifying functional selectivity and agonist bias. ACS Chem Neurosci. 2012;3:193–203. doi: 10.1021/cn200111m. [DOI] [PMC free article] [PubMed] [Google Scholar]
- Kew JNC, Trube G, Kemp JA. A novel mechanism of activity-dependent NMDA receptor antagonism describes the effect of ifenprodil in rat cultured cortical neurons. J Physiol. 1996;497.3:761–772. doi: 10.1113/jphysiol.1996.sp021807. [DOI] [PMC free article] [PubMed] [Google Scholar]
- Kobilka BK, Gether U. Use of fluorescence spectroscopy to study conformational changes in the beta-adrenoceptor. Methods Enzymol. 2002;343:170–182. doi: 10.1016/s0076-6879(02)43134-5. [DOI] [PubMed] [Google Scholar]
- Kocan M, Pfleger KDG. Detection of GPCR/β-arrestin interactions in live cells using bioluminescence resonance energy transfer technology. In: Leifert WR, editor. G Protein-Coupled Receptors in Drug Discovery. Vol. 552. New York: Human Press; 2009. pp. 305–317. [DOI] [PubMed] [Google Scholar]
- Kocan M, Pfleger KDG. Study of GPCR-protein interactions by BRET. In: Willars GB, Challiss J, editors. Meth. Mol. Biol., Receptor Signal Transduction Protocols. 3rd edn. Vol. 746. Totowa, NJ: Human Press; 2011. pp. 357–371. [DOI] [PubMed] [Google Scholar]
- Kocan M, Dalrymple MB, Seeber RM, Feldman BJ, Pfleger KDG. Enhanced BRET technology for the monitoring of agonist-induced and agonist-independent interactions between GPCRs and arrestins. Frontiers Endocrinol. 2011;1:1–9. doi: 10.3389/fendo.2010.00012. [DOI] [PMC free article] [PubMed] [Google Scholar]
- Koole C, Wootten D, Simms J, Valant C, Sridhaar R, Woodman OL, et al. Allosteric ligands of the glucagon-like peptide 1 receptor (GLP-1R) differentially modulate endogenous and exogenous peptide responses in a pathway-selective manner: implications for drug screening. Mol Pharmacol. 2010;78:456–465. doi: 10.1124/mol.110.065664. [DOI] [PMC free article] [PubMed] [Google Scholar]
- Koshland DE., Jr Application of a theory of enzyme specificity to protein synthesis. Proc Natl Acad Sci U S A. 1958;44:98–104. doi: 10.1073/pnas.44.2.98. [DOI] [PMC free article] [PubMed] [Google Scholar]
- Kukkonen JP. Regulation of receptor-coupling to (multiple) G proteins: a challenge for basic research and drug discovery. Receptors Channels. 2004;10:167–183. doi: 10.3109/10606820490926151. [DOI] [PubMed] [Google Scholar]
- Lau E, Lytle C, Straus DS, DeFea KA. Apical and basolateral pools of proteinase-activated receptor-2 direct distinct signaling events in intestinal epithelium. Am J Physiol Cell Physiol. 2010;300:C113–C123. doi: 10.1152/ajpcell.00162.2010. [DOI] [PMC free article] [PubMed] [Google Scholar]
- Lau EK, Trester-Zedlitz M, Trinidad JC, Kotowski SJ, Krutchinsky AN, Burlingame AL, et al. Quantitative encoding of the effect of a partial agonist on individual opioid receptors by multisite phosphorylation and threshold detection. Sci Signal. 2011;4:1–11. doi: 10.1126/scisignal.2001748. Available at: http://www.ScienceSignaling.org (accessed 16 November 2012) [DOI] [PMC free article] [PubMed] [Google Scholar]
- Lawler CO, Watts VJ, Booth RG, Southerland SB, Mailman RB. Discrete functional selectivity of drugs: OPC-14597, a selective antagonist for post-synaptic dopamine D2 receptors. Abstr. Soc Neurosci. 1994;20:525. [Google Scholar]
- Lawler CP, Prioleua C, Lewis MM, Mak C, Jiang D, Schetz JA, et al. Interactions of the Novel Antipsychotic Aripiprazole (OPC-14597) with Dopamine and Serotonin Receptor Subtypes. Neuropsychopharmacology. 1999;20:612–627. doi: 10.1016/S0893-133X(98)00099-2. [DOI] [PubMed] [Google Scholar]
- Leach K, Sexton PM, Christopoulos A. Allosteric GPCR modulators: taking advantage of permissive receptor pharmacology. Trends Pharmacol Sci. 2007;28:382–389. doi: 10.1016/j.tips.2007.06.004. [DOI] [PubMed] [Google Scholar]
- Leeb-Lundberg LMF, Kang DS, Lamb ME, Fathy DB. The human B1 bradykinin receptor exhibits high ligand-independent, constitutive activity. J Biol Chem. 2001;276:8785–8792. doi: 10.1074/jbc.M007396200. [DOI] [PubMed] [Google Scholar]
- Liu JG, Ruckle MB, Prather PL. Constitutively active m-opioid receptors inhibit adenylyl cyclase activity in intact cells and activate G-proteins differently than the agonist [D-Ala2,N-MePhe4, Gly-ol5]enkephalin. J Biol Chem. 2001;276:37779–37786. doi: 10.1074/jbc.M106104200. [DOI] [PubMed] [Google Scholar]
- Liu JJ, Horst R, Katritch V, Stevens RC, Wuthrich K. Biased signaling pathways in β2-adrenergic receptor characterized by 19F-NMR. Science. 2012;335:1106–1110. doi: 10.1126/science.1215802. [DOI] [PMC free article] [PubMed] [Google Scholar]
- Lohse MJ, Hein P, Hoffmann C, Nikolaev VO, Vilardaga JP, Bunemann M. Kinetics of G-protein-coupled receptor signals in intact cells. Br J Pharmacol. 2008;153:S125–S132. doi: 10.1038/sj.bjp.0707656. [DOI] [PMC free article] [PubMed] [Google Scholar]
- Ma B, Shatsky M, Wolfson HJ, Nussinov R. Multiple diverse ligands binding at a single protein site: a matter of pre-existing conformations. Protein Sci. 2002;11:184–197. doi: 10.1110/ps.21302. [DOI] [PMC free article] [PubMed] [Google Scholar]
- Maeda K, Nakata H, Koh Y, Miyakawa T, Ogata H, Takaoka Y, et al. Spirodiketopiperazine-based CCR5 inhibitor which preserves CC-chemokine/CCR5 interactions and exerts potent activity against R5 human immunodeficiency virus type 1 in vitro. J Virol. 2004;78:8654–8662. doi: 10.1128/JVI.78.16.8654-8662.2004. [DOI] [PMC free article] [PubMed] [Google Scholar]
- Mailman RB. GPCR functional selectivity has therapeutic impact. Trends Pharmacol Sci. 2007;28:390–396. doi: 10.1016/j.tips.2007.06.002. [DOI] [PMC free article] [PubMed] [Google Scholar]
- Mailman RB, Lawler CP, Lewis MM, Blake B. Functional effects of novel dopamine ligands: dihydrexidine and Parkinson's disease as a first step. In: Jenner P, Demirdamar R, editors. Dopamine Receptor Subtypes: From Basic Science to Clinical Application. Fairfox, CA: IOS Press; 1998. pp. 112–119. [Google Scholar]
- Mary S, Damian M, Louet M, Floquet N, Fehrentz J-A, Marie J, et al. Ligands and signaling proteins govern the conformational landscape explored by G protein-coupled receptor. Proc Natl Acad Sci U S A. 2012;109:8304–8309. doi: 10.1073/pnas.1119881109. pnas1119881109. [DOI] [PMC free article] [PubMed] [Google Scholar]
- Maudsley S, Martin B, Luttrell LM. The origins of diversity and specificity in G protein-coupled recetor signaling. J Pharmacol Exp Ther. 2005;314:485–494. doi: 10.1124/jpet.105.083121. [DOI] [PMC free article] [PubMed] [Google Scholar]
- Metra M, Cas LD, di Lenarda A, Poole-Wilson P. Beta-blockers in heart failure: are pharmacological differences clinically important? Heart Fail Rev. 2004;9:123–130. doi: 10.1023/B:HREV.0000046367.99002.a4. [DOI] [PubMed] [Google Scholar]
- Mottola DM, Cook LL, Jones SR, Booth RG, Nichols DE, Mailman RB. Dihydrexidine, a selective dopamine receptor agonist that may discriminate postsynaptic D2 receptors. Abstr. Soc Neurosci. 1991;17:818. [Google Scholar]
- Mottola DM, Kilts JD, Lewis MM, Connery HS, Walker QD, Jones SR, et al. Functional selectivity of dopamine receptor agonists. I. Selective activation of postsynaptic dopamine D-1 receptors linked to adenylate cyclase. J Pharmacol Exp Ther. 2002;301:1166–1178. doi: 10.1124/jpet.301.3.1166. [DOI] [PubMed] [Google Scholar]
- Mukhopadhyay S, Howlett AC. Chemically distinct ligands promote differential CB1 cannabinoid receptor-Gi protein interactions. Mol Pharmacol. 2005;67:2016–2024. doi: 10.1124/mol.104.003558. [DOI] [PubMed] [Google Scholar]
- Nickerson M. Receptor occupancy and tissue response. Nature. 1956;4535:697–698. doi: 10.1038/178697b0. [DOI] [PubMed] [Google Scholar]
- Nobles KN, Xiao K, Ahn S, Shukla AK, Lam CM, Rajagopal S, et al. Distinct phosphorylation sites on the β-adrenergic receptor establish a barcode that encodes differential fucntions of β-arrestin. ScienceSignaling. 2011;4:1–10. doi: 10.1126/scisignal.2001707. [DOI] [PMC free article] [PubMed] [Google Scholar]
- Norris JD, Joseph JD, Sherk AB, Juzumiene D, Turnbull PS, Rafferty SW, et al. Differential presentation of protein interaction surfaces on the androgen receptor defines the pharmacological actions of both ligands. Chem Biol. 2009;16:452–460. doi: 10.1016/j.chembiol.2009.01.016. [DOI] [PMC free article] [PubMed] [Google Scholar]
- Offermanns S, Wieland T, Homann D, Sandmann J, Bombien D, Spicher K, et al. Transfected muscarinic acetylcholine receptors selectively couple to Gi-type proteins and Gq/11. Mol Pharmacol. 1994;45:890–898. [PubMed] [Google Scholar]
- Okada T, Palczewski K. Crystal structure of rhodopsin: implications for vision and beyond. Curr Opin Struct Biol. 2001;11:420–426. doi: 10.1016/s0959-440x(00)00227-x. [DOI] [PubMed] [Google Scholar]
- Onaran HO, Costa T. Agonist efficacy and allosteric models of receptor action. Ann N Y Acad Sci. 1997;812:98–115. doi: 10.1111/j.1749-6632.1997.tb48150.x. [DOI] [PubMed] [Google Scholar]
- Onaran HO, Scheer A, Cotecchia S, Costa T. A look at receptor efficacy. From the signaling network of the cell to the intramolecular motion of the receptor. In: Kenakin TP, Angus JA, editors. The Pharmacology of Functional, Biochemical, and Recombinant Systems Handbook of Experimental Pharmacology. Vol. 148. Heidelberg: Springer; 2002. pp. 217–280. [Google Scholar]
- Pei Y, Rogan SC, Yan F, Roth BL. Engineered GPCRs as tools to modulate signal transduction. Physiology. 2008;23:313–321. doi: 10.1152/physiol.00025.2008. [DOI] [PubMed] [Google Scholar]
- Pellissier LP, Sallander J, Campillo M, Gaven F, Queffeulou E, Pillot M, et al. Conformational toggle switches implicated in basal constitutive and agonist-induced activated states of 50hysdroxytryptamine-4 receptors. Mol Pharmacol. 2009;75:982–990. doi: 10.1124/mol.108.053686. [DOI] [PubMed] [Google Scholar]
- Perez DM, Karnick SS. Multiple signaling states of G-protein coupled receptors. Pharmacol Rev. 2005;57:147–161. doi: 10.1124/pr.57.2.2. [DOI] [PubMed] [Google Scholar]
- Peters MF, Knappenberger K, Wilkins D, Sygowski LA, Lazor LA, Liu J, et al. Evaluation of cellular dielectric spectroscopy, a whole-cell, label-free technology for drug discovery on Gi-coupled GPCRs. J Biomol Screen. 2007;12:312–319. doi: 10.1177/1087057106298637. [DOI] [PubMed] [Google Scholar]
- Prather PL, Loh HH, Lew PY. Interaction of δ-opioid receptors with multiple G-proteins: a non-relationship between agonist potency to inhibit adenylate cyclase and to activate G-proteins. Mol Pharmacol. 1994;45:997–1003. [PubMed] [Google Scholar]
- Prather PL, Martin NA, Breivogel CS, Childers SR. Activation of cannabinoid receptors in rat brain by WIN 55212-2 produces coupling to multiple G-protein α-subunits with different potencies. Mol Pharmacol. 2000;57:1000–1010. [PubMed] [Google Scholar]
- Price MR, Baillie GL, Thomas A, Stevenson LA, Easson M, Goodwin R, et al. Allosteric modulation of the cannabinoid CB1 receptor. Mol Pharmacol. 2005;68:1484–1495. doi: 10.1124/mol.105.016162. [DOI] [PubMed] [Google Scholar]
- Raehal KM, Walker JKL, Bohn LM. Morphine side effects in b-arrestin 2 knockout mice. J Pharmacol Exp Ther. 2005;314:1195–1201. doi: 10.1124/jpet.105.087254. [DOI] [PubMed] [Google Scholar]
- Rajagopal S, Ahn S, Rominger DH, Gowen-MacDonald W, Lam CM, DeWire SM, et al. Quantifying ligand bias at seven-transmembrane receptors. Mol Pharmacol. 2011;80:367–377. doi: 10.1124/mol.111.072801. [DOI] [PMC free article] [PubMed] [Google Scholar]
- Rasmussen SGF, DeVree BT, Zou Y, Kruse AC, Chung KY, Kobilka TS, et al. Crystal structure of the β2 adrenergic receptor-Gs protein complex. Nature. 2011;477:549–557. doi: 10.1038/nature10361. [DOI] [PMC free article] [PubMed] [Google Scholar]
- Roerig SC, Loh HH, Law PY. Identification of three separate guanine nucleotide- binding proteins that interact with the δ-opioid receptor in NG108-15 X glioma hybrid cells. Mol Pharmacol. 1992;41:822. 831. [PubMed] [Google Scholar]
- Roettger BF, Ghanekar D, Rao R, Toledo C, Yingling J, Pinon D, et al. Antagonist-stimulated internalization of the G protein-coupled cholecystokinin receptor. Mol Pharmacol. 1997;51:357–362. [PubMed] [Google Scholar]
- Rosethorne EM, Charlton SJ. Agonist-biased signaling at the histamine H4 receptor: JNJ7777120 recruits β-arrestin without activating G proteins. Mol Pharmacol. 2011;79:749–757. doi: 10.1124/mol.110.068395. [DOI] [PubMed] [Google Scholar]
- Roth BL, Chuang D-M. Multiple mechanisms of serotonergic signal transduction. Life Sci. 1987;41:1051–1064. doi: 10.1016/0024-3205(87)90621-7. [DOI] [PubMed] [Google Scholar]
- Samama P, Cotecchia S, Costa T, Lefkowitz RJ. A mutation-induced activated state of the β2-adrenergic receptor: extending the ternary complex model. J Biol Chem. 1993;268:4625–4636. [PubMed] [Google Scholar]
- Sato M, Horinouchi T, Hutchinson DA, Evans BA, Evans RJ. Ligand-directed signaling at the b3-adrenoceptor produced by 3-(2-ethylphenoxy)-1-[(1,S)-1,2,3,4-tetrahydronapth-1-ylamino]-2S-2-propanol oxalate (SR59230A) relative to receptor agonists. Mol Pharmacol. 2007;72:1359–1368. doi: 10.1124/mol.107.035337. [DOI] [PubMed] [Google Scholar]
- Scaramellini C, Leff P. Theoretical implications of receptor coupling to multiple G proteins based on analysis of a three state model. Meth Enzymol. 2002;343:17–29. doi: 10.1016/s0076-6879(02)43125-4. [DOI] [PubMed] [Google Scholar]
- Schröder R, Janssen N, Schmidt J, Kebig A, Merten N, Hennen S, et al. Deconvolution of complex G protein–coupled receptor signaling in live cells using dynamic mass redistribution measurements. Nat Biotechnol. 2010;28:943–949. doi: 10.1038/nbt.1671. [DOI] [PubMed] [Google Scholar]
- Sheffler DJ, Kroeze WK, Garcia BG, Deutch AY, Hufeisen SJ, Leahy P, et al. p90 ribosomal S6 kinase exerts a tonic brake on G protein coupled receptor signaling. Proc Natl Acad Sci U S A. 2006;103:4717–4722. doi: 10.1073/pnas.0600585103. [DOI] [PMC free article] [PubMed] [Google Scholar]
- Shukla AK, Violin JD, Whalen EJ, Gesty-Palmer D, Shenoy SK, Lefkowitz RJ. Distinct conformational changes in β-arrestin report biased agonism at seven transmembrane receptors. Proc Natl Acad Sci U S A. 2008;105:9988–9993. doi: 10.1073/pnas.0804246105. [DOI] [PMC free article] [PubMed] [Google Scholar]
- Stephenson RP. A modification of receptor theory. Br J Pharmacol. 1956;11:379–393. doi: 10.1111/j.1476-5381.1956.tb00006.x. [DOI] [PMC free article] [PubMed] [Google Scholar]
- Storjohann L, Holst B, Schwartz TW. Molecular mechanism of Z2+ agonism in the extracellular domain of GPR39. FEBS Lett. 2008;582:2583–2588. doi: 10.1016/j.febslet.2008.06.030. [DOI] [PubMed] [Google Scholar]
- Strachan RT, Dheffler DJ, Willard B, Kinter M, Kiselar JG, Roth BL. Ribosomal S6 kinase 2 directly phosphorylates the 5-hydroxytryptamine 2A (5-HT2A) serotonin receptor, thereby modulating 5-HT2A signaling. J Biol Chem. 2009;284:5557–5573. doi: 10.1074/jbc.M805705200. [DOI] [PMC free article] [PubMed] [Google Scholar]
- Strachan RT, Sciaky N, Cronan MR, Kroeze WK, Roth BL. Genetic deletion of p90 Ribosomal S6 kinase 2 alters patterns of 5-hydroxytryptamine2A serotonin receptor functional selectivity. Mol Pharmacol. 2010;77:327–338. doi: 10.1124/mol.109.061440. [DOI] [PMC free article] [PubMed] [Google Scholar]
- Suratman S, Leach K, Sexton PM, Felder CC, Loiacono RE, Christopoulos A. Impact of species variability and ‘probe-dependence’ on the detection and in vivo validation of allosteric modulation at the M4 muscarinic acetylcholine receptor. Br J Pharmacol. 2011;162:1659–1670. doi: 10.1111/j.1476-5381.2010.01184.x. [DOI] [PMC free article] [PubMed] [Google Scholar]
- Swaminath G, Xiang Y, Lee TW, Steenhuis J, Parnot C, Kobilka BK. Sequential Binding of Agonists to the 2 Adrenoceptor: kinetic evidence for intermediate conformational states. J Biol Chem. 2004;279:686–691. doi: 10.1074/jbc.M310888200. [DOI] [PubMed] [Google Scholar]
- Swaminath G, Deupi X, Lee TW, Zhu W, Thian FS, et al. Porbing the β2-adrenoceptor binding site with catechol reveals differences in binding and activation by agonists and partial agonists. J Biol Chem. 2005;280:22165–22171. doi: 10.1074/jbc.M502352200. [DOI] [PubMed] [Google Scholar]
- Sykes DA, Dowling MR, Charlton SJ. Exploring the mechanism of agonist efficacy: a relationship between efficacy and agonist dissociation rate at the muscarinic M3 receptor. Mol Pharmacol. 2009;76:543–551. doi: 10.1124/mol.108.054452. [DOI] [PubMed] [Google Scholar]
- Tilley DG. G protein-dependent and G protein-independent signaling pathways and their impact on cardiac function. Circ Res. 2011;109:217–230. doi: 10.1161/CIRCRESAHA.110.231225. [DOI] [PMC free article] [PubMed] [Google Scholar]
- Tobin AB. G-protein-coupled receptor phosphorylation: where, when and by whom. Br J Pharmacol. 2008;153:S167–S176. doi: 10.1038/sj.bjp.0707662. [DOI] [PMC free article] [PubMed] [Google Scholar]
- Tobin AB, Butcher AJ, Kong KC. Location, location, location…site-specific GPCR phosphorylation offer a mechanism for cell-type-specific signaling. Trends Pharmacol Sci. 2008;29:413–420. doi: 10.1016/j.tips.2008.05.006. [DOI] [PMC free article] [PubMed] [Google Scholar]
- Tran JA, Chang A, Matsui M, Ehlert FJ. Estimation of relative microscopic affinity constants of agonists for the active state of the receptor in functional studies on m2 and m3 muscarinic receptors. Mol Pharmacol. 2009;75:381–396. doi: 10.1124/mol.108.051276. [DOI] [PMC free article] [PubMed] [Google Scholar]
- Trankle C, Weyand A, Schroter A, Mohr K. Using a radioalloster to test predictions of the cooperativity model for gallamine binding to the allosteric site of muscarinic acetylcholine (m2) receptors. Mol Pharmacol. 1999;56:962–965. doi: 10.1124/mol.56.5.962. [DOI] [PubMed] [Google Scholar]
- Tschammer N, Bollinger S, Kenakin T, Gmeiner P. Histidine 6.55 Is a Major Determinant of Ligand-Biased Signaling in Dopamine D2L Receptor. Mol Pharmacol. 2011;79:575–585. doi: 10.1124/mol.110.068106. [DOI] [PubMed] [Google Scholar]
- Tutor A, Penela P, Mayor F. Anti-β1-adrenergic receptor autoantibodies are potent stimulators of the ERK1/2 pathway in cardiac cells. Cardiovasc Res. 2007;76:51–60. doi: 10.1016/j.cardiores.2007.05.022. [DOI] [PubMed] [Google Scholar]
- Valant C, Felder CC, Sexton PM, Christopoulos A. Probe dependence in the allosteric modulation of a G protein-coupled receptor: implications for detection and validation of allosteric ligand effect. Mol Pharmacol. 2012;81:41–52. doi: 10.1124/mol.111.074872. [DOI] [PubMed] [Google Scholar]
- Varga EV, Navratilova E, Stropova D, Jambrosic J, Roeske WR, Yamamura HI. Agonist-specific regulation of the d-opioid receptor. Life Sci. 2004;76:599–612. doi: 10.1016/j.lfs.2004.07.020. [DOI] [PubMed] [Google Scholar]
- Vilardaga JP, Steinmeyer R, Harms GS, Lohse MJ. Molecular basis of inverse agonism in a G-protein coupled receptor. Nat Chem Biol. 2005;1:25–28. doi: 10.1038/nchembio705. [DOI] [PubMed] [Google Scholar]
- Vilardaga JP, Bunemann M, Krasel C, Castro M, Lohse MJ. Measurement of the millisecond activation switch of G-protein-coupled receptors in living cells. Nat Biotechnol. 2003;21:807–812. doi: 10.1038/nbt838. [DOI] [PubMed] [Google Scholar]
- Violin JD, Lefkowitz RJ. β-Arrestin biased ligands at seven transmembrane receptors. Trends Pharmacol Sci. 2007;28:416–422. doi: 10.1016/j.tips.2007.06.006. [DOI] [PubMed] [Google Scholar]
- Violin JD, deWire SM, Yamashita D, Rominger DH, Nguyen L, Sciller K, et al. Selectively engaging b-arrestins at the AT1R reduces blood pressure and increases cardiac performance. J Pharmacol Exp Ther. 2010;335:572–579. doi: 10.1124/jpet.110.173005. [DOI] [PubMed] [Google Scholar]
- Walters RW, Shukla A, Kovacs JJ, Violin JD, DeWire SM, Lam CM, et al. β-arrestin 1 mediates nicotinic acid-induced flushing, but not its antilipolytic effect, in mice. J Clin Invest. 2009;119:1312–1321. doi: 10.1172/JCI36806. [DOI] [PMC free article] [PubMed] [Google Scholar]
- Ward JS, Merrit L, Calligaro DO, Bymaster FP, Shannon HE, Sawyer BD, et al. Functionally selective M1 muscarinic agonists. 3. Side chains and azacycles contributing to functional muscarinic selectivity among pyrazacycles. J Med Chem. 1995;38:3469–3481. doi: 10.1021/jm00018a007. [DOI] [PubMed] [Google Scholar]
- Watson C, Chen G, Irving PE, Way J, Chen W-J, Kenakin TP. The use of stimulus-biased assay systems to detect agonist-specific receptor active states: implications for the trafficking of receptor stimulus by agonists. Mol Pharmacol. 2000;58:1230–1238. doi: 10.1124/mol.58.6.1230. [DOI] [PubMed] [Google Scholar]
- Watson C, Jenkinson S, Kazmierski W, Kenakin TP. The CCR5 Receptor-based mechanism of action of 873140, a potent allosteric non-competitive HIV entry-inhibitor. Mol Pharmacol. 2005;67:1268–1282. doi: 10.1124/mol.104.008565. [DOI] [PubMed] [Google Scholar]
- Weiss JM, Morgan PH, Lutz MW, Kenakin TP. The cubic ternary complex receptor-occupancy model. I. Model description. J Theor Biol. 1996a;178:151–167. doi: 10.1006/jtbi.1996.0139. [DOI] [PubMed] [Google Scholar]
- Weiss JM, Morgan PH, Lutz MW, Kenakin TP. The cubic ternary complex receptor-occupancy model. II. Understanding apparent affinity. J Theor Biol. 1996b;178:169–182. doi: 10.1006/jtbi.1996.0139. [DOI] [PubMed] [Google Scholar]
- Weiss JM, Morgan PH, Lutz MW, Kenakin TP. The cubic ternary complex receptor-occupancy model. III. Resurrecting Efficacy. J Theoret Biol. 1996c;181:381–397. doi: 10.1006/jtbi.1996.0139. [DOI] [PubMed] [Google Scholar]
- Wise A, Sheehan M, Rees S, Lee M, Milligan G. Comparative analysis of the efficacy of A1 adenosine receptor activation of Gi/0α G proteins following coexpression of receptor and G protein and expression of A1 adenosine receptor Gi/oα fusion proteins. Biochemistry. 1999;38:2272–2278. doi: 10.1021/bi982054f. [DOI] [PubMed] [Google Scholar]
- Woodward C. Is the slow-exchange core the protein folding core? Trends Biochem Sci. 1993;18:359–360. doi: 10.1016/0968-0004(93)90086-3. [DOI] [PubMed] [Google Scholar]
- Xiao K, Sun J, Kim J, Rajagopal S, Zhai B, Villen J, et al. Global phosphorylation analysis of β-arrestin mediated signaling downstream of a seven transmembrane recetor (7TMR) Proc Natl Acad Sci U S A. 2010;107:15299–15304. doi: 10.1073/pnas.1008461107. [DOI] [PMC free article] [PubMed] [Google Scholar]
- Yan F, Mosier PD, Westkaemper RB, Roth BL. Gα-subunits differentially alter the conformation and agonist affinity of k-opioid receptors. Biochem. 2008;47:1567–1578. doi: 10.1021/bi701476b. [DOI] [PubMed] [Google Scholar]
- Zhou Y-Y, Cheng H, Song L-S, Wang D, Lakatta EG, Xiao RP. Spontaneous β2-adrenergic signaling fails to modulate L-type nCa2+ current in mouse ventricular myocytes. Mol Pharmacol. 1999;56:485–493. doi: 10.1124/mol.56.3.485. [DOI] [PubMed] [Google Scholar]
- Zidar DA, Violin JD, Whalen EJ, Lefkowitz RJ. Selective engagement of G protein coupled receptor kinases (GRKs) encodes distinct functions of biased ligands. Proc Natl Acad Sci U S A. 2009;106:9649–9654. doi: 10.1073/pnas.0904361106. [DOI] [PMC free article] [PubMed] [Google Scholar]
- Zurn A, Zabel U, Vilardaga JP, Schindlein H, Lohse MJ, Hoffmann C. Fluorescence resonance energy transfer analysis of α2a-adrenergic receptor activation reveals distinct agonist-specific conformational changes. Mol Pharmacol. 2009;75:534–541. doi: 10.1124/mol.108.052399. [DOI] [PubMed] [Google Scholar]