

Abstract
Trans-to-cis isomerization, the key reaction in photoactive proteins, cannot usually occur through the standard one-bond-flip mechanism. Due to spatial constraints imposed by a protein environment, isomerization is likely to proceed via a “volume-conserving” mechanism in which highly-choreographed atomic motions are expected, the details of which have not yet been directly observed. Here we employ time-resolved X-ray crystallography to structurally visualize isomerization of the p-coumaric acid chromophore in photoactive yellow protein with 100 picosecond time resolution and 1.6 Å spatial resolution. The structure of the earliest intermediate (IT) resembles a highly-strained transition state in which the torsion angle is located halfway between the trans and cis isomers. The reaction trajectory of IT bifurcates into two structurally distinct cis intermediates via hula-twist and bicycle-pedal pathways. The bifurcating reaction pathways can be controlled by weakening the hydrogen bond between the chromophore and an adjacent residue via E46Q mutation, which switches off the bicycle-pedal pathway.
The ability to convert light into molecular action is indispensible to many forms of life, as for example light-activated signal transduction in mobile bacteria and vision in animals. These tasks are accomplished by signaling photoreceptor proteins in which light activation often triggers geometrical isomerization of a prosthetic chromophore group, typically a π-conjugated organic molecule buried within the host protein. The isomerization pathway in the gas and solution phases, where the chromophore is free from host constraints, is thought to proceed via the one-bond-flip mechanism1 (Fig. 1a). When the chromophore is embedded in a cavity within a photoreceptor, this mechanism may no longer hold because interactions with the surrounding side chains of the protein, including hydrogen-bonding interactions and steric constraints, severely restrict the conformational mobility of the chromophore1,2. Instead, “volume-conserving” isomerization mechanisms3,4 should be considered where the pathway of isomerization proceeds along a trajectory that minimizes the volume swept out by the atoms of the chromophore5 (Fig. 1a). For example, molecular dynamics (MD) simulations of the retinal chromophore in rhodopsin suggest that it isomerizes via a volume-conserving bicycle-pedal (BP) mechanism2,6–8. Likewise, infrared (IR) spectroscopic9–12 and crystallographic studies5,13–17 of the p-coumaric acid (pCA) chromophore of Photoactive Yellow Protein (PYP) suggest the BP mechanism. An alternative volume-conserving mechanism, the hula-twist (HT)1, has been observed in various small molecule and bio-macromolecular systems18 but not directly in PYP5. Both BP and HT isomerization involve correlated motion along numerous internal coordinates, but the highly-choreographed atomic motion required by each mechanism has not been observed experimentally.
Figure 1.
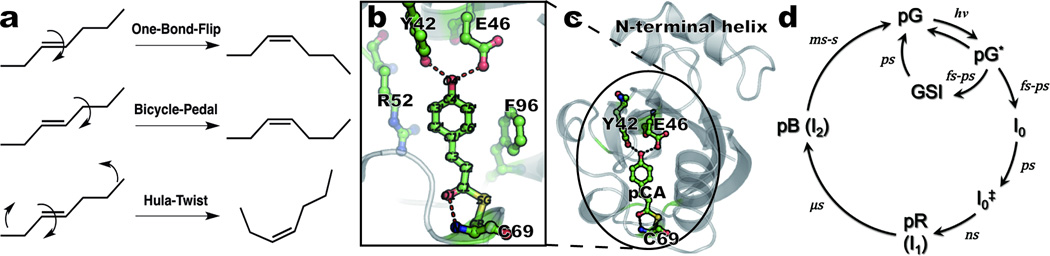
Isomerization mechanisms and overview of photoactive yellow protein. (a) Schematic description of three isomerization mechanisms discussed in this work. (b) Close-up of the pCA chromophore and neighboring residues; dashed lines denote hydrogen-bond interactions. Carbon, oxygen, sulfur, and nitrogen atoms are shown in green, red, yellow, and blue, respectively. (c) Structure of the protein (ribbon) and the pCA (ball-and-stick) in the chromophore binding pocket. (d) Photocycle and corresponding kinetics, as derived from time-resolved spectroscopy measurements at ambient temperature10–12,25,49.
PYP is a photoreceptor whose activation is believed to lead to negative phototaxis of the bacterium Halorhodospira halophila19. Due to its small size, stability, and well-ordered crystals20, PYP provides an excellent model system for investigating structure-function relations in photoreceptor proteins. The pCA chromophore occupies a cavity inside the protein (Fig. 1). It is covalently anchored at one end to Cys69 through a thioester bond, and forms hydrogen bonds with the side chains of Tyr42 and Glu46 and the backbone amide of Cys69. Absorption of a blue photon triggers photoisomerization of pCA, which drives a fully-reversible photocycle in which the signaling state persists long enough to be recognized by the organism19. This photocycle has been investigated extensively by spectroscopy10–12,21–27 and crystallography13,16,17,28,29 using cryogenic and time-resolved techniques (Fig. 1d). Ambient temperature transient absorption spectroscopy revealed two distinguishable early intermediates, I0 and I0‡, on a sub-nanosecond (ns) time scale which evolve into later intermediates, I1 (or pR) and I2 (or pB).21,22,25 According to time-resolved FT-IR studies10,11, a GSI (ground state intermediate) forms on a femtosecond time scale and decays to the ground state on a picosecond time scale. The structures of these short-lived intermediates are still lacking, as previous time-resolved crystallography studies at ambient temperature17,28 were done with 5–10 ns resolution, and thus lacked the time resolution required to capture these earliest intermediates. Here, we report results of time-resolved crystallographic experiments with 100 picosecond (ps) time resolution that track the trans to cis photoisomerization of the pCA for both wild-type (WT) PYP and its E46Q mutant. Isomerization occurs via a highly distorted intermediate whose reaction trajectory appears to bifurcate along the BP and HT pathways to produce two structurally distinct cis intermediates. One of the bifurcating pathways can be blocked by weakening the hydrogen bond from residue 46; the BP pathway is blocked in the E46Q mutant.
Results and Discussion
Time-dependent density maps
Electron density maps of the chromophore binding pocket for representative time delays (−20 ns, 100 ps, 3.16 ns and 1 µs for WT, and −20 ns, 100 ps and 31.6 ns for E46Q) are shown in Fig. 2 (For complete time series see Supplementary Fig. S1~S3 and Supplementary Movies S1~S3). Superposition of magenta-green color-coded (thresholdless) maps30 for the ground state (magenta) and extrapolated photoactivated state (green) are shown for the chromophore binding pocket in front (Fig. 2a) and side views (Fig. 2b) for WT-PYP. These two colors blend to white where they overlap and the magenta-to-green color gradient indicates the direction of atomic motions. The −20 ns time point provides a control in which the X-ray pulse arrives in advance of the laser pulse and therefore records the structure of the resting, dark state. At the earliest time delays, structural changes are largely confined to the chromophore binding pocket (see Supplementary Figures S1 – S3). The magenta-green maps reveal correlated motions of the pCA chromophore and the surrounding protein as the chromophore undergoes isomerization. Yellow arrows and circles in Fig. 2 indicate motions at each time point. For example, the WT-PYP 100-ps side view in Fig. 2b depicts a highly twisted structure in which the phenolate ring has shifted to the left, the C2-C3 atoms have shifted to the right, and the carbonyl O1 has rotated out of the plane of the chromophore. In the 100-ps front view in Fig. 2a, the movement of the carbonyl O1 is also clearly visible and the movements of the surrounding residues are apparent. The fact that the Tyr42 and Glu46 side chains follow the phenolate suggests that their hydrogen-bonding network with the pCA remains intact. Because of their close-packed arrangement, Arg52, Phe96 and Met100 follow the motion of the phenolate and C2-C3 atoms. In the 3.16-ns front view of WT-PYP in Fig. 2a, the carbonyl O1 has rotated to the opposite side of the tail of the chromophore, as in previously reported cryo-trapped structures (I013, PYPB14 and ICP15). In the 1-µs map, the movement of the sulfur atom for pRCW intermediate is visible as reported previously17. In the case of the E46Q mutant (Figs. 2c and 2d), similar movements of pCA and nearby residues at 100 ps are observed. In the nanosecond time regime represented by the 31.6-ns map, the movement of the phenolate ring is more pronounced than in WT but some movements such as the rotation of the carbonyl O1 the opposite side of the tail of the chromophore are missing. The movements are also delayed relative to those in WT-PYP. This provides direct, qualitative evidence that the kinetics and intermediates in E46Q differ from those in WT-PYP. Visual inspection of the time-dependent electron density maps provides useful but nevertheless qualitative structural insights into the reaction mechanism. In particular, individual maps are likely to contain a mixture of multiple intermediates. Elucidating the structures of transient intermediates involved in the reaction mechanism requires quantitative analysis, as described in the next section.
Figure 2.

Time-resolved electron density maps of pCA in the chromophore binding pocket. For clarity, only 100 ps, 3.16 ns, and 1 μs maps for WT (or 100 ps and 31.6 ns maps for E46Q mutant) are shown (the complete time series is shown as static images in Supplementary Fig. S1~S3 and Supplementary Movies S1~S3 in the SI). (a~d) Superposition of thresholdless electron density maps30 for the ground state (magenta) and extrapolated photoactivated state (green). These two colors blend to white where they overlap; the direction of molecular motion follows the magenta-to-green color gradient; solid and dotted circles indicate the appearance and disappearance of density, respectively. (a) and (c) Front view of chromophore binding pocket for WT-PYP and E46Q-PYP, respectively. (b) and (d) Side view of (a) and (c), respectively.
Extracting intermediate structures and determining kinetics
To determine the time-independent structures of intermediates and associated kinetics required to reproduce the entire series of experimental time-dependent electron density maps, we analyzed difference electron density maps using singular value decomposition (SVD) and further kinetic analysis (see SI for details)31. The analysis of WT-PYP density maps recovered three time-independent electron density maps, suggesting three intermediate states and two apparent relaxation times. The electron density map extrapolated to 100% photoactivation (see SI) for the first intermediate state (Fig. 3a) is well described by a single homogeneous structure. In contrast, the map for the second state (Fig. 3b) is structurally heterogeneous, suggesting a mixture of two distinct intermediate structures arising from bifurcation of the earlier structure. The map for the third intermediate state (Fig. 3c) is also a mixture of two structures, one of which is one of the two structures of the second intermediate state. The four structures apparent in these three time-independent electron density maps were refined against these maps via extrapolated refinement28 (see SI). We denote these four intermediate structures as IT (Intermediate with Twisted structure), ICT (Intermediate with Cis-Twisted structure), pR1, and pR2. More specifically, the maps associated with the first, second and third intermediate states were used to refine the IT, ICT + pR1, and pR1 + pR2 structures, respectively, and they are shown in Figs. 3a, 3b and 3c. The pR1 structure was independently refined against both the second and third density maps, and the two refined pR1 structures have identical geometry (with root mean square deviation between the two pR1 structures of ~0.23 Å). IT and ICT were unknown prior to this work. ICT is closely related to the previously-reported intermediate ICP17 but is less planar. pR1 and pR2 correspond directly to pRE46Q and pRCW17. Similar analysis of density maps of the E46Q mutant of PYP resulted in two time-independent density maps, both of which are structurally homogeneous and correspond to IT (Fig. 3d) and pR1 (Fig. 3e). Intermediates ICT and pR2 are therefore absent in the E46Q pathway. Selected structural parameters for the stable, dark state and all transient intermediates are shown in Table 1.
Figure 3.

Time-independent intermediates for WT-PYP and E46Q-PYP recovered from SVD analysis of time-dependent difference electron density maps. Three time-independent electron density maps are recovered for WT-PYP and two for E46Q-PYP. The densities shown have been extrapolated to 100% photoactivation (see SI). The surfaces are contoured at +1 σ (cyan) and +3 σ (blue) where σ denotes root-mean-square deviation of electron density. The first (a), second (b) and third (c) WT-PYP intermediates (extracted from SVD analysis of experimental WT-PYP difference electron density maps collected at ESRF) were modeled with IT, ICT + pR1, and pR1 + pR2, respectively. The first (d) and second (e) E46Q-PYP intermediates (extracted from E46Q-PYP difference maps collected at APS) were modeled with IT and pR1, respectively. The structures corresponding to each map are superimposed to the map with the following color coding: IT (orange), ICT (cyan), pR1 (dark blue) and pR2 (green).
Table 1.
Geometrical parameters (distances, torsion angle and planarity angle) of the pCA chromophore in the ground state (pG) and intermediates (IT, ICT, pR1, pR2, and pB).
| pG | IT | ICT | pR1 | pR2 | pB | |
|---|---|---|---|---|---|---|
| O1-Cys69, Å | 2.8 | 2.9 | 4.7 | 3.3 | 4.1 | 2.9 |
| O4’-Tyr42, Å | 2.5 | 2.6 | 2.4 | 3.2 | 2.8 | 5.0 |
| O4’-Glu46, Å | 2.6 | 2.8 | 3.3 | 5.4 | 3.4 | 7.8 |
| C1-C2-C3-C1’, ° | 169 | 85 | −1 | 1 | 3 | −24 |
| Planarity angle, ° | 22 | 85 | 45 | 35 | 45 | 51 |
O1, the chromophore carbonyl oxygen; O4’, the chromophore phenolate oxygen; Tyr42, the hydroxyl oxygen of Tyr42; Glu46, the Oε2 of Glu46; Cys69, the backbone amide nitrogen of Cys69; Planarity angle denotes the angle between the carbonyl bond (C1—O1) and the plane of the chromophore phenolate ring; the angle is 90 degrees when this bond is normal to the plane.
To further characterize the kinetics of the transitions between the four intermediate structures, the time-dependent WT-PYP experimental density maps were fitted against density maps generated by a plausible mechanism involving the intermediate structures IT, ICT, pR1, and pR2. For a reaction mechanism consistent with the time-resolved structural changes (Figs. 4a and 4c), such posterior analysis31 (details in the SI) yields associated time constants of 1.7 ± 0.5 ns, 3 ± 1 ns and 20 ± 7 ns. In this reaction mechanism, IT bifurcates into pR1 (via an HT pathway) and ICT (via a BP pathway) with time constants of 3 ns and 1.7 ns, respectively (ICT : pR1 ~ 6 : 4). ICT further decays into pR2 with a time constant of 20 ns. Other possible mechanisms were tested but none fit the experimental maps satisfactorily. Posterior analysis against the E46Q-PYP density maps recovered a simple sequential kinetic model in which the first intermediate, IT, transforms to pR1 (via an HT pathway) with a time constant of 11 ± 1 ns (Figs. 4b and 4d).
Figure 4.

Structures of pCA intermediates, reaction pathways and kinetics. (a) A photocycle consistent with WT-PYP time-resolved electron density maps. Carbon atoms of the refined pG, IT, ICT, pR1 and pR2 intermediate structures are shown in gray, orange, cyan, dark blue, and green, respectively. Oxygen, sulfur, and nitrogen atoms are shown in red, yellow, and blue, respectively. Arrows indicate significant atomic movement from one intermediate to the next. (b) A photocycle consistent with E46Q-PYP density maps. All color schemes are identical to (a). The pathway from IT to ICT via bicycle-pedal mechanism is blocked due to the weaker hydrogen bond between pCA and Q46. (c) Time-dependent concentrations of intermediates consistent with (a). The color code is as in (a). The solid lines are from the posterior analysis with time constants: τ1 = 1.7 ns, τ2 = 3 ns, and τ3 = 20 ns. (d) Time-dependent concentrations of intermediates consistent with (b). The color code is as in (a). The solid lines are from the posterior analysis with a time constant τ1 = 11 ns. (e) The reaction pathways of the entire photocycle of WT-PYP. The reaction pathways for late time delays involving pB states and their returning to pG are adopted from previous studies17,33.
Structural Dynamics for Trans-Cis Isomerization (Bicycle-Pedal and Hula-Twist Models)
The refined structures of intermediates and their kinetics characterize the trans-cis isomerization with atomic detail. To visually highlight structural differences, color-coded skeletal structures of pG and IT are superimposed with ICT in Fig. 5a and with pR1 in Fig. 5b. Comparison of the white (pG) and orange (IT) structures reveals the changes associated with the pG to IT transition, which is seen most clearly in the side views. The IT structure is highly non-planar (planarity angle of 85°) and the torsion angle of 85° around its C2-C3 bond lies between the trans (169° in pG) and cis values (−1°, 1° in ICT and pR1, respectively). Thus IT lies on the junction of the pathways leading from pG to ICT and pR1. The pCA chromophore becomes severely bent in which the C1’ atom of the phenolate ring acts as a pivot and the carbonyl O1 swings out of the plane of the phenolate moiety. IT bifurcates along two pathways to produce two different cis intermediates (ICT and pR1) via the BP and HT pathways, respectively. The isomerization trajectory leading to pR1 occurs via the HT mechanism (leftmost pathway in Fig. 4a; see also Fig. 5b), in which the carbonyl O1 returns to the same side of the ground state chromophore as in the ground state pG, by breaking the hydrogen bond between the phenolate oxygen and Glu46; the pCA again becomes planar. Isomerization to ICT occurs via the BP mechanism (rightmost pathway in Fig. 4a; see also Fig. 5a), in which the carbonyl O1 completes its excursion to the opposite side of the chromophore by breaking the hydrogen bond between O1 and the backbone amide of Cys69, and the pCA still remains highly bent. ICT further evolves to generate pR2 via another BP-like rotation about the single bonds flanking the sulfur atom. The Cruickshank DPI values and B-factors in Supplementary Tables S4 – S6 show that these structural changes associated with the BP and HT pathways are most certainly significant. As reported in a previous ns time-resolved crystallographic study17, the structures denoted pR1 and pR2 are populated in a ratio of ~4:6, and both ultimately convert to pB, the long-lived, putative signaling state. The co-existence of pR1 and pR2 is also consistent with recent studies with pH-dependent time-resolved X-ray crystallography32 and pump-probe X-ray solution scattering33. The reaction pathways of the entire photocycle for WT-PYP can be summarized as shown in Fig. 4e.
Figure 5.

Hula-twist and bicycle-pedal pathways and a comparison of experimental and theoretical IT structure. (a) Front and side views of the pCA structural transformation according to the bicycle-pedal pathway (pG → IT → ICT). (b) Same as (a), but according to the hula-twist pathway (pG → IT → pR1). Movies of both pathways are shown side-by-side in Supplementary Movie S4. (c,d) Schematic representation of (c) bicycle-pedal and (d) hula-twist mechanism. (e) Comparison of experimental IT structure (orange) with an energy-minimized structure (yellow) computed using density functional theory (B97-1/6-31G(d) + 3-21G). Residues included to stabilize are not shown for clarity (see the SI for detail).
The isomerization pathway within the chromophore binding pocket that constitutes a “protein cage” is quite different from that in the gas phase, where chromophores are free from host constraints and may isomerize via the geometrically simpler one-bond-flip pathway34. Surprisingly, both the BP and HT pathways (Figs. 5a and 5b) appear to be operative in the protein cage, though they eventually converge to the same signaling state, pB (Figs. 4a and 4e). Although a kinetic model containing parallel pathways has been proposed in previous cryogenic35 and room-temperature36 spectroscopic studies, the three-dimensional structures could not be determined and the BP and HT pathways could not be elucidated. The high non-planarity of IT and its unusual C1-C2-C3-C1’ torsion angle lying between the trans and cis values indicate that IT closely resembles a highly strained transition state. The specific hydrogen bonds and hydrophobic interactions between the pCA chromophore and the protein cage could stabilize such a structure that could not exist in stable form in a solvent cage or gas phase lacking such structurally-specific interactions37,38. Indeed, density functional theory (DFT) calculations (see SI) show that the optimized IT structure (Fig. 5e) has no imaginary vibrational frequency when interactions involving Cys69, Tyr42, Glu46, Thr50, Arg52, Ala67, Thr70, and Phe96 are included, and thus suggest that the IT structure is stabilized as an intermediate rather than a transition state. Since IT forms on a time scale much shorter than the time resolution available in this study, the possibility that IT is a mixture of multiple intermediates cannot be ruled out. However the DFT result strongly supports our interpretation of IT as a single intermediate. In the case of the E46Q mutant, the BP pathway becomes unfavorable since the hydrogen bond to Gln46 is both longer39 and weaker than that to Glu46, and only the HT pathway through IT and pR1 is operative (Figs 4b and 4d). Evidently the bifurcated pathway of isomerization within the protein cage can be redirected by modifying a single hydrogen bond.
During the preparation of the final version of this paper, we became aware of an article40 in which photoisomerization of PYP was studied with the same techniques applied to WT-PYP crystals grown under rather different conditions, in high salt (1.1 M NaCl) and D2O. The first intermediate reported in that article is similar to IT but in structure refinement the torsion angles around C2=C3 were restrained in the cis configuration whereas we gradually released such constraints. The first intermediate does not bifurcate into two cis intermediates and the HT pathway was not observed. The second intermediate is similar to ICT but is more planar, and thus more closely resembles ICP17.
Structure of Intermediates and Comparison with Previous Experimental Observations
Cryogenic crystallographic studies13–15 generally trap a mixture of chromophore structures which cannot be represented accurately by a single structure. Even if individual chromophore structures are dissected from this mixture15, these structures are substantially distorted in their central C1-C2=C3-C1’ ethylene moiety, and the carbonyl oxygen is rotated towards the opposite side of the chromophore. Compared with cryogenic structures, the unusual IT structure found here possesses distinct characteristics. The ethylene moiety is more distorted and lies further out of the chromophore plane than in those cryogenic structures13–15 (see C1-C2=C3-C1’ dihedral angle in Table 1). Its high non-planarity accompanies translocation of the electronic charge from the phenolate oxygen to the C2=C3 ethylene bond41. The pCA carbonyl is rotated nearly 90o relative to its resting state and the hydrogen bond between the carbonyl oxygen and the backbone amide of Cys69 is maintained, indicating a similar strength of hydrogen bond. As the phenolate ring in IT is displaced in a direction opposite to C2=C3 movement, the hydrogen bonds between the phenolate oxygen and to Tyr42 and Glu46 are slightly weakened but remain intact (see Table 1). These structural characteristics indicate that IT is analogous to a previously predicted10,11,42,43 twisted structure resembling a transition-state-like structure. For example, femtosecond IR spectroscopic studies10,11 hinted at sub-ns structural changes involving central C2=C3 ethylene bond distortion, carbonyl group movement, a weakened hydrogen bond to Cys69, and phenolate ring movement. MD simulations42,44,45 of PYP after photoexcitation also suggest a distorted structure of the chromophore, in which the central C=C double torsion angle is predicted to be close to 90 degrees. A low-temperature IR study24 identified an early cryogenic intermediate (denoted PYPH) where the carbonyl O1 rotation is incomplete, again consistent with a major structural feature of IT.
The position of the C1-C2=C3-C1’ ethylene moiety in ICT is similar to that in the IT structure, and the two hydrogen bonds with Ty42 and Glu46 of ICT are maintained as in IT (see Table 1), but the carbonyl O1 in ICT has completed its full rotation to the opposite side. These structural aspects of ICT are consistent with the spectrum appearing on the ns time scale assigned to I1 in femtosecond IR studies10,11. Cryo-crystallographic studies targeting early intermediates13–15 and ns time-resolved17 crystallography identified essentially one structure (denoted PYPB14 or ICP15,17), which resembles ICT in that the carbonyl group is completely rotated and the hydrogen bonds with Tyr42 and Glu46 remain intact. However, the central C1-C2=C3-C1’ ethylene moiety is distorted in ICT which makes the chromophore in ICT highly non-planar, whereas this moiety in PYPB14 and ICP15 is planar. The time resolution of the ns time-resolved crystallography study17 did not allow the IT structure to be captured. The density map at the earliest time delay (1 ns) was assigned to a single structure denoted ICP which nevertheless did not fully account for all the density, leaving some unexplained residual density (see SI for more discussion).
The pR1 structure here is identical to pRE46Q identified in a previous ns time-resolved study17. Unlike ICT which retains its hydrogen bonds to Tyr42 and Glu46, the chromophore in pR1 maintains only its hydrogen bonds to Tyr42 and the backbone amide of Cys69, but loses its hydrogen bond to Glu46. A second pR-like intermediate (pR2), whose structure is identical to pRCW identified in a previous cryo-crystallographic study15 and time-resolved crystallography17,32, is produced from ICT via another BP-like rotation about the bonds connected to the Cys69 sulfur atom. The sulfur atom remains stationary in IT, ICT, and pR1 but moves significantly in pR2. Movement of the sulfur atom subsequent to C=O rotation is consistent with MD simulations42.
Time-resolved UV/visible spectroscopy studies24,46 reported that a spectroscopic intermediate denoted I0, decayed with a lifetime of 220 ps to another denoted I0‡, which decayed to I1 with a lifetime of 3 ns. To account for the time constants, one may assign the spectroscopic intermediate I0 to the structure IT, I0‡ to a mixture of two structures ICT and pR1, and I1 to a mixture of pR1 and pR2. Ultrafast vibrational spectroscopy studies10–12 at ambient temperature, which afford sensitivity to transient stretching modes of the chromophore and protein residues, identified only I0 and I1 intermediates in the sub-ns and ns time regime. In addition, femtosecond-IR spectroscopy studies10,11 detected a new intermediate (GSI) that forms on a femtosecond time scale and decays to the ground state with a time constant of 6 ps. The current time resolution of ~100 ps does not allow us to capture the GSI. According to femtosecond-IR results10,11 as reflected in the Glu46 C=O mode, the hydrogen bond between Glu46 and the chromophore may change slightly in strength during the I0 to I1 transition with a sub-ns time constant. In our mechanism, IT retains the hydrogen bond to Glu46 and then converts to a mixture of ICT and pR1. Since the hydrogen bond to Glu46 is broken in pR1, but is intact in ICT, the IR signal associated with the Glu46 C=O mode would be sensitive to the conversion of IT to pR1 but not to the conversion of IT to ICT. In addition, the subsequent conversion of ICT to pR2 may also escape detection by IR spectroscopy, since the movement of the sulfur atom (C1-S-Cβ-Cα) does not exhibit a clear spectral signature. These results suggest that I0 and I1 from the IR studies can be identified with IT and a mixture of ICT, pR1 and pR2, respectively. Nearby residues such as Arg52, Phe96, and Met100 within the protein pocket move substantially to accommodate the twisted structure of IT and move further in the transition from IT to subsequent intermediates (ICT, pR1, and pR2) (see Fig. 2 and Supplementary Movie S2). Transient IR spectra seem to be less sensitive to movement of these residues12.
Conclusions
Time-resolved Laue crystallography has unveiled for the first time a long-hypothesized, highly-twisted intermediate along the trans to cis isomerization pathway. This structure is crucial for the proper interpretation of results from computational studies and time-resolved spectroscopic studies. The detailed structures of intermediates and their dynamics provide insights that tie together and help reconcile previous experimental observations from various techniques. The fact that the lifetime of the IT intermediate is sufficiently long to be resolved with 100 ps time resolution is testimony to the specific, highly stabilizing interplay between the pCA chromophore and the protein cage that surrounds it. The detailed structural transitions indicate that the hydrogen bonds between the chromophore and the surrounding side chains play important roles; indeed, the number of hydrogen bonds progressively decreases as the reaction proceeds. The IT intermediate acts as the gate, bifurcating into two different cis intermediates; and reaction pathways can thus be controlled by modifying the environment of the chromophore.
Methods
Data collection protocol
Time-resolved Laue diffraction images were acquired at beamline ID09B at the European Synchrotron Radiation Facility (ESRF) and at BioCARS beamline 14-IDB at the Advanced Photon Source (APS) using the pump-probe method: a laser pulse triggered a photochemical reaction in a PYP crystal (pump) and a time-delayed X-ray pulse produced a diffraction pattern on a Mar165 CCD detector (probe). The excitation laser pulse was generated by stretching 400-nm, ~120 femtosecond (fs) pulses to ~100 picosecond (ps) via silica rod and optical fiber (for ESRF), or by tuning the fs pulse train 780-nm pulses to ~35 ps 390-nm laser pulses via TOPAS optical parametric amplifier and echelon (for APS). To maximize the number of X-ray photons in a single probe pulse, the experiment was scheduled in a 4-bunch mode (ESRF) or a hybrid mode (APS). Diffraction images were acquired at all desired time delays before rotating the crystal to a new angular setting. Numerous orientations, each of which sampled a different region of reciprocal space, could be acquired from each rod-shaped PYP crystal. The time series consisted of a negative time point (−20 ns) and several positive time points (from 0 ps to 1 μs).
Data processing
The data are highly redundant and the resolution cut-off extends below 1.6 Å. Indexing, integration, scaling, and merging of all data sets was performed with LaueView46 and yielded the structure factor amplitudes (|F(hkl, t)|) and the associated errors (σ(hkl)) for each reflection and time point. The values of |F(hkl, reference)| were used to represent the amplitude of the dark state. The time-dependent difference structure factor amplitudes were obtained by scaling to calculated (absolute) amplitude from ground state structure (Fcdark) and by subtraction: ΔF(hkl, t) = |F(hkl, t)| − |F(hkl, reference)|. Weighted difference structure factor amplitudes were generated by scaling ΔF(hkl, t) by a weight factor w(hkl) = 1/(1+(ΔF(hkl)2/<ΔF2>)+(σ(hkl)2/<σ2>))16. Weighted difference structure factors (w(hkl)∙ΔF(hkl, t)) from different volumes on the same crystal and from multiple crystals were merged to produce a single, highly redundant and complete data set at each time point.
Singular value decomposition (SVD) analysis
To identify the kinetic mechanism and the structure of intermediates during the early time photocycle of PYP, we extracted time-independent difference electron densities from the mixture of time-dependent densities at each time point using the method of SVD31. The SVD results show that only the first three lSVs (for WT-PYP) or the first two lSVs (for E46Q-PYP) have significant singular values and positive auto-correlation factors. Linear combinations of these lSVs reproduced the experimental data with high fidelity. To extract the time-independent difference electron-density maps, we performed kinetic analyses using a simple three-state (for WT-PYP) or two-state (for E46Q-PYP) sequential model. Assuming a simple kinetic pathway that involves three (for WT-PYP) or two (for E46Q-PYP) states, three (for WT-PYP) or two (for E46Q-PYP) time-independent electron-density maps for three (for WT-PYP) or two (for E46Q-PYP) intermediates can be constructed from simple linear combinations of the three (for WT-PYP) or two (for E46Q-PYP) components with refined time constants (see the Supplementary Information for details). The time-independent difference maps recovered from SVD analysis (Fig. 3) were used to refine the time-independent structures.
Structure refinement
All refinements and the model building were performed with SHELX-9747 and XtalView48 (Fig. 3). 5% of the total reflections were used to calculate a free R-factor. The refinement of intermediate structures was performed against electron density maps that had been extrapolated to 100% photoactivation. The structures of three intermediates for WT-PYP were refined against the three data sets of time-independent, extrapolated structure factor amplitudes. The first of the three extrapolated maps is structurally homogeneous; i.e. it is well modeled by a single structure (IT). The second map is structurally heterogeneous, suggesting a mixture of two distinct intermediates, and refinement employed a mixture of two structures (ICT + pR1). The third map is also structurally heterogeneous and was refined using a mixture of pR1 and pR2. For E46Q-PYP, the structures of two intermediates were refined against the two time-independent extrapolated structure factor amplitudes. Both maps are structurally homogeneous and the first and second maps were modelled by IT and pR1, respectively. The values of R- (R-free) factor in Supplementary Table S4~S6 represent a good quality of the structure refinement.
Posterior Analysis
In order to explore kinetic mechanisms consistent with our data, posterior analysis17,31 was applied with time-independent difference density maps, which were derived from previously refined intermediate structures (IT, ICT, pR1, and pR2). Since we determined previously the time-independent mixture of these two structures, we explored a bifurcation mechanism in which the first intermediate, IT, converts into ICT and pR1 (and subsequently ICT further transforms to pR2) (Fig 4). The fit between these calculated difference density maps and the experimental difference density maps resulted in three (for WT-PYP) or one (for E46Q-PYP) associated time constants (see the Supplementary Information for details).
Supplementary Material
Acknowledgements
We acknowledge extensive support by Michael Wulff of beamline ID09 at ESRF during data collection there. We thank Philip Anfinrud, Friedrich Schotte and Hyun Sun Cho for their earlier contributions to this research. This work was supported by the Research Center Program of IBS (Institute for Basic Science) in Korea. This work was supported by Creative Research Initiatives (Center for Time-Resolved Diffraction) of MEST/NRF. M.S. is supported by NSF grant 0952643 (Career) and grant 0843459. K.M. is supported by NIH grant GM036452. Use of the BioCARS Sector 14 at the APS was supported by the National Institutes of Health, National Institute of General Medical Sciences grant P41GM103543. Time-resolved set-up at Sector 14 was funded in part through a collaboration with Philip Anfinrud (NIH/NIDDK) through the Intramural Research Program of NIDDK. Use of the Advanced Photon Source was supported by the U.S. Department of Energy, Basic Energy Sciences, Office of Science, under Contract No. DE-AC02-06CH11357.
Footnotes
Supplementary Information is linked to the online version of the paper at www.nature.com/nature
Author contributions H.I. designed the study, Y.O.J. and H.I. purified, crystallized, collected and analyzed X-ray data. V.S. helped with analysis of X-ray data. Y.O.J. and J.H.L., and M.S. performed kinetic analysis of time-dependent data. J.K. performed DFT calculation. Y.O.J., K.M., and H.I. wrote the paper. All authors discussed the results and commented on the manuscript.
Author Information Atomic coordinates and structure factor amplitudes have been deposited in the Protein Data Bank under accession codes: 3VE3 (IT), 3VE4 (ICT + pR1), and 4HY8 (pR1 + pR2) for WT-PYP, ESRF; 4I38 (IT), 4I39 (ICT + pR1), and 4I3A (pR1 + pR2) for WT-PYP, APS; 4I3I (IT) and 4I3J (pR1) for E46Q-PYP, APS. Reprints and permissions information is available at www.nature.com/reprints.
References
- 1.Liu RS, Asato AE. The primary process of vision and the structure of bathorhodopsin: a mechanism for photoisomerization of polyenes. Proc. Natl. Acad. Sci. U. S. A. 1985;82:259–263. doi: 10.1073/pnas.82.2.259. [DOI] [PMC free article] [PubMed] [Google Scholar]
- 2.Warshel A, Barboy N. Energy storage and reaction pathways in the first step of the vision process. J. Am. Chem. Soc. 1982;104:1469–1476. [Google Scholar]
- 3.Muller AM, Lochbrunner S, Schmid WE, Fuss W. Low-temperature photochemistry of previtamin D: A hula-twist isomerization of a triene. Angew. Chem. Int. Ed. 1998;37:505–507. doi: 10.1002/(SICI)1521-3773(19980302)37:4<505::AID-ANIE505>3.0.CO;2-U. [DOI] [PubMed] [Google Scholar]
- 4.Liu RS, Yang LY, Liu J. Mechanisms of photoisomerization of polyenes in confined media: from organic glasses to protein binding cavities. Photochem. Photobiol. 2007;83:2–10. doi: 10.1562/2006-01-27-RA-786. [DOI] [PubMed] [Google Scholar]
- 5.Imamoto Y, Kataoka M, Liu RS. Mechanistic pathways for the photoisomerization reaction of the anchored, tethered chromophore of the photoactive yellow protein and its mutants. Photochem. Photobiol. 2002;76:584–589. doi: 10.1562/0031-8655(2002)076<0584:mpftpr>2.0.co;2. [DOI] [PubMed] [Google Scholar]
- 6.Andruniow T, Ferre N, Olivucci M. Structure, initial excited-state relaxation, and energy storage of rhodopsin resolved at the multiconfigurational perturbation theory level. Proc. Natl. Acad. Sci. U. S. A. 2004;101:17908–17913. doi: 10.1073/pnas.0407997101. [DOI] [PMC free article] [PubMed] [Google Scholar]
- 7.Frutos LM, Andruniow T, Santoro F, Ferre N, Olivucci M. Tracking the excited-state time evolution of the visual pigment with multiconfigurational quantum chemistry. Proc. Natl. Acad. Sci. U. S. A. 2007;104:7764–7769. doi: 10.1073/pnas.0701732104. [DOI] [PMC free article] [PubMed] [Google Scholar]
- 8.Schapiro I, Weingart O, Buss V. Bicycle-pedal isomerization in a rhodopsin chromophore model. J. Am. Chem. Soc. 2009;131:16–17. doi: 10.1021/ja805586z. [DOI] [PubMed] [Google Scholar]
- 9.Xie A, Hoff WD, Kroon AR, Hellingwerf KJ. Glu46 donates a proton to the 4-hydroxycinnamate anion chromophore during the photocycle of photoactive yellow protein. Biochemistry. 1996;35:14671–14678. doi: 10.1021/bi9623035. [DOI] [PubMed] [Google Scholar]
- 10.van Wilderen LJ, et al. Ultrafast infrared spectroscopy reveals a key step for successful entry into the photocycle for photoactive yellow protein. Proc. Natl. Acad. Sci. U. S. A. 2006;103:15050–15055. doi: 10.1073/pnas.0603476103. [DOI] [PMC free article] [PubMed] [Google Scholar]
- 11.Groot ML, et al. Initial steps of signal generation in photoactive yellow protein revealed with femtosecond mid-infrared spectroscopy. Biochemistry. 2003;42:10054–10059. doi: 10.1021/bi034878p. [DOI] [PubMed] [Google Scholar]
- 12.Heyne K, et al. Structural evolution of the chromophore in the primary stages of trans/cis isomerization in photoactive yellow protein. J. Am. Chem. Soc. 2005;127:18100–18106. doi: 10.1021/ja051210k. [DOI] [PMC free article] [PubMed] [Google Scholar]
- 13.Genick UK, Soltis SM, Kuhn P, Canestrelli IL, Getzoff ED. Structure at 0.85 A resolution of an early protein photocycle intermediate. Nature. 1998;392:206–209. doi: 10.1038/32462. [DOI] [PubMed] [Google Scholar]
- 14.Kort R, Hellingwerf KJ, Ravelli RB. Initial events in the photocycle of photoactive yellow protein. J. Biol. Chem. 2004;279:26417–26424. doi: 10.1074/jbc.M311961200. [DOI] [PubMed] [Google Scholar]
- 15.Anderson S, Srajer V, Moffat K. Structural heterogeneity of cryotrapped intermediates in the bacterial blue light photoreceptor, photoactive yellow protein. Photochem. Photobiol. 2004;80:7–14. doi: 10.1562/2004-03-15-RA-115.1. [DOI] [PubMed] [Google Scholar]
- 16.Ren Z, et al. A molecular movie at 1.8 A resolution displays the photocycle of photoactive yellow protein, a eubacterial blue-light receptor, from nanoseconds to seconds. Biochemistry. 2001;40:13788–13801. doi: 10.1021/bi0107142. [DOI] [PubMed] [Google Scholar]
- 17.Ihee H, et al. Visualizing reaction pathways in photoactive yellow protein from nanoseconds to seconds. Proc. Natl. Acad. Sci. U. S. A. 2005;102:7145–7150. doi: 10.1073/pnas.0409035102. [DOI] [PMC free article] [PubMed] [Google Scholar]
- 18.Andresen M, et al. Structure and mechanism of the reversible photoswitch of a fluorescent protein. Proc. Natl. Acad. Sci. U. S. A. 2005;102:13070–13074. doi: 10.1073/pnas.0502772102. [DOI] [PMC free article] [PubMed] [Google Scholar]
- 19.Sprenger WW, Hoff WD, Armitage JP, Hellingwerf KJ. The eubacterium Ectothiorhodospira halophila is negatively phototactic, with a wavelength dependence that fits the absorption spectrum of the photoactive yellow protein. J. Bacteriol. 1993;175:3096–3104. doi: 10.1128/jb.175.10.3096-3104.1993. [DOI] [PMC free article] [PubMed] [Google Scholar]
- 20.Borgstahl GE, Williams DR, Getzoff ED. 1.4 A structure of photoactive yellow protein, a cytosolic photoreceptor: unusual fold, active site, and chromophore. Biochemistry. 1995;34:6278–6287. doi: 10.1021/bi00019a004. [DOI] [PubMed] [Google Scholar]
- 21.Ujj L, et al. New photocycle intermediates in the photoactive yellow protein from Ectothiorhodospira halophila: picosecond transient absorption spectroscopy. Biophys. J. 1998;75:406–412. doi: 10.1016/S0006-3495(98)77525-3. [DOI] [PMC free article] [PubMed] [Google Scholar]
- 22.Hoff WD, et al. Measurement and global analysis of the absorbance changes in the photocycle of the photoactive yellow protein from Ectothiorhodospira halophila. Biophys. J. 1994;67:1691–1705. doi: 10.1016/S0006-3495(94)80643-5. [DOI] [PMC free article] [PubMed] [Google Scholar]
- 23.Brudler R, Rammelsberg R, Woo TT, Getzoff ED, Gerwert K. Structure of the I1 early intermediate of photoactive yellow protein by FTIR spectroscopy. Nature Struct. Biol. 2001;8:265–270. doi: 10.1038/85021. [DOI] [PubMed] [Google Scholar]
- 24.Imamoto Y, et al. Low-temperature Fourier transform infrared spectroscopy of photoactive yellow protein. Biochemistry. 2001;40:8997–9004. doi: 10.1021/bi010021l. [DOI] [PubMed] [Google Scholar]
- 25.Devanathan S, et al. Femtosecond spectroscopic observations of initial intermediates in the photocycle of the photoactive yellow protein from Ectothiorhodospira halophila. Biophys. J. 1999;77:1017–1023. doi: 10.1016/S0006-3495(99)76952-3. [DOI] [PMC free article] [PubMed] [Google Scholar]
- 26.Unno M, Kumauchi M, Hamada N, Tokunaga F, Yamauchi S. Resonance Raman evidence for two conformations involved in the L intermediate of photoactive yellow protein. J. Biol. Chem. 2004;279:23855–23858. doi: 10.1074/jbc.C400137200. [DOI] [PubMed] [Google Scholar]
- 27.Takeshita K, Imamoto Y, Kataoka M, Tokunaga F, Terazima M. Themodynamic and transport properties of intermediate states of the photocyclic reaction of photoactive yellow protein. Biochemistry. 2002;41:3037–3048. doi: 10.1021/bi0110600. [DOI] [PubMed] [Google Scholar]
- 28.Schmidt M, et al. Protein kinetics: structures of intermediates and reaction mechanism from time-resolved x-ray data. Proc. Natl. Acad. Sci. U. S. A. 2004;101:4799–4804. doi: 10.1073/pnas.0305983101. [DOI] [PMC free article] [PubMed] [Google Scholar]
- 29.Rajagopal S, et al. A structural pathway for signaling in the E46Q mutant of photoactive yellow protein. Structure. 2005;13:55–63. doi: 10.1016/j.str.2004.10.016. [DOI] [PubMed] [Google Scholar]
- 30.Schotte F, et al. Watching a protein as it functions with 150-ps time-resolved x-ray crystallography. Science. 2003;300:1944–1947. doi: 10.1126/science.1078797. [DOI] [PubMed] [Google Scholar]
- 31.Schmidt M, Rajagopal S, Ren Z, Moffat K. Application of singular value decomposition to the analysis of time-resolved macromolecular x-ray data. Biophys. J. 2003;84:2112–2129. doi: 10.1016/S0006-3495(03)75018-8. [DOI] [PMC free article] [PubMed] [Google Scholar]
- 32.Tripathi S, Srajer V, Purwar N, Henning R, Schmidt M. pH dependence of the photoactive yellow protein photocycle investigated by time-resolved crystallography. Biophys. J. 2012;102:325–332. doi: 10.1016/j.bpj.2011.11.4021. [DOI] [PMC free article] [PubMed] [Google Scholar]
- 33.Kim TW, et al. Protein structural dynamics of photoactive yellow protein in solution revealed by pump-probe X-ray solution scattering. J. Am. Chem. Soc. 2012;134:3145–3153. doi: 10.1021/ja210435n. [DOI] [PubMed] [Google Scholar]
- 34.Liu RS, Hammond GS. The case of medium-dependent dual mechanisms for photoisomerization: one-bond-flip and hula-twist. Proc. Natl. Acad. Sci. U. S. A. 2000;97:11153–11158. doi: 10.1073/pnas.210323197. [DOI] [PMC free article] [PubMed] [Google Scholar]
- 35.Imamoto Y, Kataoka M, Tokunaga F. Photoreaction cycle of photoactive yellow protein from Ectothiorhodospira halophila studied by low-temperature spectroscopy. Biochemistry. 1996;35:14047–14053. doi: 10.1021/bi961342d. [DOI] [PubMed] [Google Scholar]
- 36.Imamoto Y, Kataoka M, Tokunaga F, Asahi T, Masuhara H. Primary photoreaction of photoactive yellow protein studied by subpicosecond-nanosecond spectroscopy. Biochemistry. 2001;40:6047–6052. doi: 10.1021/bi002437p. [DOI] [PubMed] [Google Scholar]
- 37.Ryan WL, Gordon DJ, Levy DH. Gas-phase photochemistry of the photoactive yellow protein chromophore trans-p-coumaric acid. J. Am. Chem. Soc. 2002;124:6194–6201. doi: 10.1021/ja017505p. [DOI] [PubMed] [Google Scholar]
- 38.Espagne A, Paik DH, Changenet-Barret P, Martin MM, Zewail AH. Ultrafast photoisomerization of photoactive yellow protein chromophore analogues in solution: influence of the protonation state. ChemPhysChem. 2006;7:1717–1726. doi: 10.1002/cphc.200600137. [DOI] [PubMed] [Google Scholar]
- 39.Sugishima M, et al. Structure of photoactive yellow protein (PYP) E46Q mutant at 1.2 A resolution suggests how Glu46 controls the spectroscopic and kinetic characteristics of PYP. Acta Crystallogr. 2004;D60:2305–2309. doi: 10.1107/S0907444904024084. [DOI] [PubMed] [Google Scholar]
- 40.Schotte F, et al. Watching a signaling protein function in real time via 100-ps time-resolved Laue crystallography. Proc. Natl. Acad. Sci. U. S. A. 2012;109:19256–19261. doi: 10.1073/pnas.1210938109. [DOI] [PMC free article] [PubMed] [Google Scholar]
- 41.Premvardhan LL, van der Horst MA, Hellingwerf KJ, van Grondelle R. Stark spectroscopy on photoactive yellow protein, E46Q, and a nonisomerizing derivative, probes photo-induced charge motion. Biophys. J. 2003;84:3226–3239. doi: 10.1016/S0006-3495(03)70047-2. [DOI] [PMC free article] [PubMed] [Google Scholar]
- 42.Groenhof G, et al. Photoactivation of the photoactive yellow protein: why photon absorption triggers a trans-to-cis Isomerization of the chromophore in the protein. J. Am. Chem. Soc. 2004;126:4228–4233. doi: 10.1021/ja039557f. [DOI] [PubMed] [Google Scholar]
- 43.Espagne A, et al. Ultrafast light-induced response of photoactive yellow protein chromophore analogues. Photochem. Photobiol. Sci. 2007;6:780–787. doi: 10.1039/b700927e. [DOI] [PubMed] [Google Scholar]
- 44.Henry ER. The use of matrix methods in the modeling of spectroscopic data sets. Biophys. J. 1997;72:652–673. doi: 10.1016/s0006-3495(97)78703-4. [DOI] [PMC free article] [PubMed] [Google Scholar]
- 45.Boggio-Pasqua M, Robb MA, Groenhof G. Hydrogen bonding controls excited-state decay of the photoactive yellow protein chromophore. J. Am. Chem. Soc. 2009;131:13580–13581. doi: 10.1021/ja904932x. [DOI] [PMC free article] [PubMed] [Google Scholar]
- 46.Ren Z, Moffat K. Quantitative Analysis of Synchrotron Laue Diffraction Patterns in Macromolecular Crystallography. J. Appl. Crystallogr. 1995;28:461–481. [Google Scholar]
- 47.Sheldrick GM. A short history of SHELX. Acta Crystallogr. 2008;A64:112–122. doi: 10.1107/S0108767307043930. [DOI] [PubMed] [Google Scholar]
- 48.McRee DE. XtalView/Xfit--A versatile program for manipulating atomic coordinates and electron density. J. Struct. Biol. 1999;125:156–165. doi: 10.1006/jsbi.1999.4094. [DOI] [PubMed] [Google Scholar]
- 49.Devanathan S, Lin S, Cusanovich MA, Woodbury N, Tollin G. Early intermediates in the photocycle of the Glu46Gln mutant of photoactive yellow protein: femtosecond spectroscopy. Biophys. J. 2000;79:2132–2137. doi: 10.1016/S0006-3495(00)76460-5. [DOI] [PMC free article] [PubMed] [Google Scholar]
Associated Data
This section collects any data citations, data availability statements, or supplementary materials included in this article.