Abstract
Membrane protein systems are important computational research topics due to their roles in rational drug design. In this study, we developed a continuum membrane model utilizing a level set formulation under the numerical Poisson-Boltzmann framework within the AMBER molecular mechanics suite for applications such as protein-ligand binding affinity and docking pose predictions. Two numerical solvers were adapted for periodic systems to alleviate possible edge effects. Validation on systems ranging from organic molecules to membrane proteins up to 200 residues, demonstrated good numerical properties. This lays foundations for sophisticated models with variable dielectric treatments and second-order accurate modeling of solvation interactions.
Keywords: membrane proteins, continuum membrane model, Poisson-Boltzmann, implicit solvation
Introduction
Energetic analyses of solvated systems are of fundamental importance in theoretical and computational studies of molecular biophysics. Due to the sizes of many biologically relevant compounds and systems, and the need for extensive sampling required to recover observable properties, explicit inclusion of solvent molecules can become quite demanding. Implicit/continuum solvation methods allow energetic calculations to be computed with far less computational expense by approximating discrete solvent molecules with a continuum. These types of methods have been routinely applied in many biomolecular applications such as protein-ligand binding affinity and docking pose predictions (1,2).
Recent interest in membrane proteins has spurred extension of continuum solvation treatments to incorporate membrane models (3–8). To implement a continuum membrane, an additional solvent region must be incorporated into the solvation model. Since most membranes are typically non-polar at the interior, energy terms that would be accounted for in an aqueous system by using solute volume or surface area can be adapted to include a membrane by taking the union of the solute and membrane regions. This manuscript focuses on treatment of the electrostatic energy contributions. Electrostatic energy contributions can be accounted for by treating the membrane as a region with a low dielectric constant, often close to that of the solute. While this approach is relatively straightforward on the surface, the solvent region now includes a heterogeneity that may have significant bearing on handling boundary conditions and interface conditions.
The Poisson-Boltzmann equation (PBE) is the basis of electrostatic energy calculations for many continuum solvation methods (9–26). However, closed-form analytical solution is only possible for a few special cases, such as systems with radial symmetry. Indeed the popular Generalized-Born (GB) methods are derived from PBE by making specific simplifying assumptions to allow a closed-form approximated solution to be obtained (27,28). Although GB is very fast compared to most full numerical solution techniques, its inherent assumptions are often a source of debate and the methods have been shown to result in undesirable errors in some cases (29). Furthermore, application to heterogeneous cases such as membrane protein systems, while possible, poses significant challenges (4,5,30). In most cases the only recourse is to seek a numerical solution. Many methods have been proposed and investigated for this purpose. Finite-difference (FD) (31–33) methods are amongst the most popular. Despite their somewhat lower adaptivity compared to finite-element (34) or boundary-element methods (13,16,35–38), they are often preferred for large-scale computations due to their speed, efficiency, and ease of implementation (39).
Current numerical methods often assume free or zero potential boundary conditions. Systems with more complex setups, e.g. when a membrane region is included, may suffer from artifacts due to edge effects when these boundary conditions are used. The problem is particularly profound in the FD methods. For such systems, periodic boundaries become an attractive alternative. Implementation of the periodic boundary condition requires modifying the algebraic equations generated for grid nodes at the FD grid edges to include terms imposing periodicity. An additional benefit of imposing periodicity, however, is that it eliminates the need for adding boundary charge distributions required for the free boundary conditions. Additionally, Fourier transform based solvers become an attractive option due to their innately periodic formulation and log-linear scaling (40). Apparently, limitation of these algorithms to use for constant coefficient equations prevents them from solving the general PBE with inhomogeneous coefficients. The augmented Immersed Interface Method (IIM) allows this limitation to be overcome for systems where each region has a distinct uniform dielectric constant (41).
In the following, we first present a continuum membrane model based on the level set formulism and a pseudo density function approach (42). This is followed with the description of two periodic FD solvers, the finite volume/periodic conjugate gradient (FV/PCG) and augmented Immersed Interface Method/Fast Fourier Transform solver (IIM/FFT) to solve the PBE for the continuum membrane systems. Finally a detailed validation of the new continuum model and analysis of the numerical algorithms are presented.
Method
Membrane Setup
Dielectric Model Setup and Interface Location via Level Set
Continuum solvation can be extended to include a membrane by modeling it as an additional dielectric region. We first focused on the case where the membrane dielectric matches the solute’s dielectric, so that the membrane region is simply an extension of the solute region. This requires us to derive, define, and merge a membrane level set into the molecular level set originally used to generate a dielectric mapping for globular proteins (42). Further modification to allow unique membrane dielectric constant can make use of this infrastructure, but will be left to a future study. The resulting linear systems were then solved assuming the periodic boundary condition.
Solute-Solvent Level Set Construction
We begin by reviewing the level set formulation for globular proteins. The level set is defined such that it will be positive on one side of the interface (solvent region in this case), negative on the other side (solute or membrane region) and zero on the interface. The interface is thus the locus of all points where the level set is zero.
Earlier attempts used the “signed” distance function as the level set, which was defined as the distance to the molecular surface (42). However, the straightforward definition prohibits the use of higher accuracy methods, such as IIM (41,43), which requires smooth and continuous level set functions. In this study a smooth and continuous density function (42) was used instead. In this approach, the solute-solvent level set ϕ at a point [p] is derived from the sum of atomic density contributions defined by the equations:
| (1) |
| (2) |
| (3) |
where the natm is the number of atoms in our system and ρi[p] is the density function for atom i at [p]. The density ρi[p] is computed based upon the signed distance between [p] and the solvent accessible surface of the atom. Function fspline is a splined density function as defined and optimized in (42), and k is the constant needed to ensure the function smoothness across the interface. Lastly, di is the signed distance to the interfacial surface for atom i, where ri is the distance from atom i to [p] and Ri is the atomic cavity radius.
Membrane Level Set
To implement a continuum membrane model, a corresponding level set function is needed to merge with the solute – solvent level set. The simplest membrane resembles a slab-like region with two planar interfaces parallel to the x-y plane. Thus the total level set function, considering both the solute and membrane, can be expressed as
| (4) |
| (5) |
| (6) |
| (7) |
Here ρm[p] is the membrane level set density contribution at [p] and fspline is the same as the spline function for atomic contributions. The function gmemb is a monotonic, concave up, cubic polynomial function constructed to transition the level set to a constant value near the membrane center while preserving smoothness and continuity. Coefficients a, b, and c were parameterized to ensure that 1) the first derivative of gmemb with respect to dm matched the first derivative at dm = 0, and 2) 0 > dm > Rp. The coefficient e must remain 0 since we want fspline[0] = gmemb[0]=0. See Figure 1 for an illustration of the construction of ρm[p] and the corresponding level set density sum contribution starting from dm[p]. Finally dm[p] is the distance from [p] to the nearest membrane surface, where zmctr is the z coordinate of the membrane center, [p]z is the z coordinate of [p] and m is the membrane thickness.
Figure 1. Construction Of Solute And Membrane Level Set Densities.
Illustrations of level set construction starting from signed distance functions. Signed distance to van Der Waals surface is shown in red. Summation contribution computed using spline and/or polynomial scaling functions is shown in green. Final level set function is shown in blue. Left: Diagram for solute level set function construction. Right: Diagram for membrane level set function construction
Inclusion of Channels
The simple slab-like membrane setup may cause problems if a solute contains pore- or channel-like region(s) that need to retain a solvent dielectric constant. To describe these proteins more accurately, an appropriate cylindrical region will be removed from the membrane region (8).
Removal of a cylindrical region could lead to sharp changes in the level set if not properly transitioned. Use of gmemb in (5) rather than a linear function as in (2) ensures that there will not be a cusp at the membrane center. What remains is to transition the level set contribution smoothly at the excluded region’s surface. The membrane density is thus modified as follows when a cylindrical region is needed
| (8) |
| (9) |
Here dp is the signed distance to the surface of the cylindrical region, where c is the coordinates of the center of the cylindrical region. Again, fspline and gmemb scale the signed distances to match a density summation approach. Distances dm[p] and dp[p] are defined from point [p] to the membrane and cylindrical region interfacial surfaces respectively. Finally rp[p] is the distance to the centeral axis of the cylindrical region running along x = cx and y = cy.
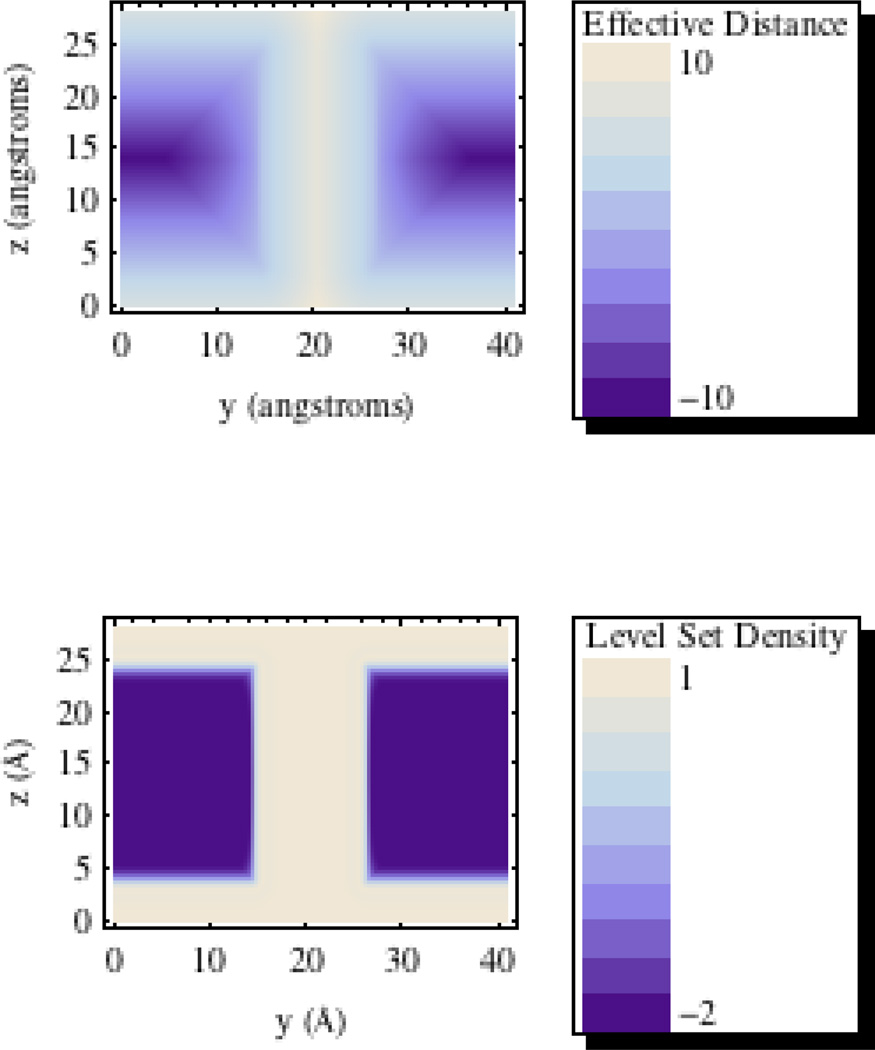
The upper expressions in equation (8) represents the region that is assigned solvent dielectric constant. This includes the region above or below the membrane or within the cylidnrical region (pore) of the membrane. The top most equation is used for the region just above the cylindrical exclusion region and is used to transition the level set smoothly as the distance to the upper or lower edge of the intersection of the cylinder and membrane regions. Finally the last equation uses a geometric average to provide a smooth transition between the membrane interior level set and the cylindrical regions level set for points residing near the interfacial surface interior to the membrane. See Figure 2 for an illustration of the construction of (9) from signed distances dm[p] and dp[p] for a model channel membrane setup on a 200×200 cross-sectional grid.
Figure 2. Effective Signed Distance (Å) And Level Set Density Distribution Cross Sections For Model Membrane.
Signed distance and level set density distributions on the cross section of a 20 Å model membrane containing a cylindrical exclusion region with a radius of 6 Å. Top: Signed distance distribution. Bottom: Level set density distribution.
Once the membrane level set is computed and added to the solute-solvent level set, the existing dielectric map setup procedure can be used to map the needed dielectric distribution on the FD grid (15,17).
Adaptation of the Numerical FD Solvers for Periodic Boundary Conditions
Now that we have an appropriate model for the discretization for the dielectric map of our membrane, solvent, and solute regions, we must implement an appropriate method to solve the resulting systems of equations. However, unlike the globular protein model wherein non-uniformity in the dielectric constant was confined to the interior of our system, the membrane model extends the solute dielectric constant to the edges of the grid. To overcome potential computational artifacts due to edge effects, a periodic boundary formulation is used when a membrane model is employed. This requires adapting our solver methods from the isolated free-boundary formulation to a periodic boundary formulation. In this study we first consider the Finite Volume / Periodic Conjugate Gradient and the Immersed Interface Method / FFT approaches.
Periodic Conjugate Gradient Solver
The existing conjugate gradient solvers, either unconditioned or conditioned, can be used to solve the algebraic equations from the finite volume discretization. This approach, reviewed in the supplemental material section, was initially developed for isolated systems when the free boundary condition is used. Briefly, the effect of the dielectric is modeled using a dielectric map, which assigns a dielectric value to each edge connecting a pair of grid nodes in a regular rectangular lattice. The dielectric map is then used to construct a series of algebraic equations based on an appropriate stencil according to the finite volume representation of the linearized PBE. To utilize this method under free boundary conditions, pseudo charges would need to be computed and mapped to the boundary of the grid. This is unnecessary for a periodic system. Implementation involves modifying the linear system by coupling grid nodes on one edge with “adjacent” nodes on the opposite edge (see equation 9 of supplementary materials). For the unconditioned conjugate gradient method, this can be accomplished with a single pass over each edge node performed prior to the main pass of each iteration step.
FFT Solver
The augmented immersed interface method (41,43,44), briefly reviewed in the supplementary materials, provides an alternative to the finite volume discretization. Under this approach, the effect of the non-uniform dielectric constant of the system is modeled by introducing an effective surface charge distribution along the interface(s) between regions with differing dielectric constants. This results in introduction of potential and field jump conditions. The field jump condition is used as an augmented variable which is converged iteratively. This requires solving PBE for a system with point charges, a surface charge distribution and uniform dielectric constant, at each step. This proves to be the most time consuming step of each iteration. Periodicity may be implemented by implementing periodic boundary conditions for the Poisson’s equation solver. However, since the system now has a uniform dielectric constant, we may employ a rapid ellipitical fast fourier transform based solver to accelerate this step (40). Due to the nature of the fast fourier transform approach, the resulting solutions will naturally be periodic without any further modification. The details of the development and implementation of our FFT based solver are reviewed in the supplementary materials.
Computational Details
For the FV/PCG method, edges connecting points within a dielectric region are assigned to that region’s value, and edges that cross an interface are assigned a value using a weighted harmonic average (45,46). For the IIM/FFT method, dielectric is modeled using surface charges and corresponding surface jump conditions (41). For both approaches, a level set function provides the means of locating the interface(s). To provide a consistent testing framework, the PBSA module in the AMBER 12 simulation and modeling package (47) was used to implement our methods. In each case, single point electrostatic energy calculations were computed. The atomic cavity radii were set to be the default mbondi set in the Amber package, except all hydrogen radii were set to be 1.0Å. A classical two-dielectric model was used to set the dielectric distribution where region within the solute/membrane is set to 1 and region outside is set to 80. Default options were used for all parameters except those specifically noted here or in the corresponding discussion in the results and discussion section. All models except for the quadrapole system and aquaporin C-terminal coil system were parameterized directly from their corresponding models from pdb entries. The quadrapole system was modeled as a single sphere of 2.0 Ångstroms and four point charges of zero net charge and zero net dipole moment. The aquaporin coil system was constructed by excising the last 19 C-terminal residues of the aquaporin model (1IH5).
Biomolecular systems were implemented in a realistic membrane with a thickness of 20 Ångstroms. In all cases except the aquaporin systems, a simple slab-like membrane was sufficient. For the aquaporin system, both a simple slab-like model and cylindrical exclusion pore model were tested. The pore radius was set to 6.0 Ångstroms to ensure that no solvent in the channel region would be overwritten.
Results and Discussion
Consistency between Periodic FD Solvers
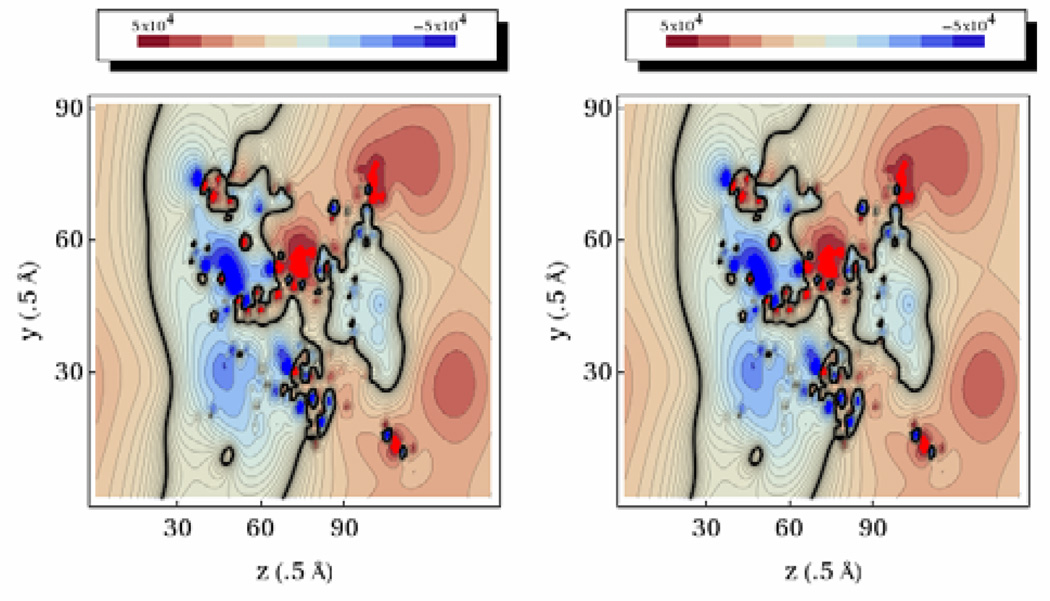
The FFT solver may be used to calculate potentials for in vacuo systems without the augmented IIM method. This allows us to compare the FFT and PCG solvers for in vacuo systems directly. To ensure that both methods give consistent results, electrostatic potential distributions were generated for the complete aquaporin system in vacuum. Contour plots were generated using the Mathematica software package and are shown in Figure 3. As is evident from the contour plots, the two methods yield equivalent electrostatic potential distribution in vacuum, even for the tested large complex molecule. Electrostatic energies reported for AMBER were also identical for both solvers (Table 1). More detailed analysis shows that discrepancy in computed energies is below the corresponding tolerance set for PCG. Given their high numerical consistency, we next proceed to validate our numerical models in more complex dielectric setups.
Figure 3. Electrostatic Potential Distribution (Kcal/Mol-E) Of Aquaporin In Vacuum.
Left: Results for the FFT solver. Right: Results for the PCG solver. Contours are taken along the yz plane through the center of the finite-difference grid.
Table 1.
Electrostatic Potentials for Continuum Water and Water + Membrane Solvation for Various Systems
| System | Vacuum | FFT Total | PCG Total | FFT Rxn | PCG Rxn | FFT Δ | PCG Δ |
|---|---|---|---|---|---|---|---|
| Quadrapole Water | −0.713 | −12.914 | −12.930 | −12.201 | −12.217 | NA | NA |
| Quadrapole Water + Memb. |
−0.713 | −4.175 | −4.133 | −3.461 | −3.420 | 8.739 | 8.797 |
| Aquaporin C-term. Coil Water |
−1385.22 | −1670.02 | −1668.51 | −284.797 | −283.295 | NA | NA |
| Aquaporin C-term. Coil Water + Memb. |
−1385.22 | −1587.68 | −1587.03 | −202.456 | −201.814 | 82.341 | 81.480 |
| Inf HAFD Water | −1723.99 | −2130.11 | −2135.61 | −406.114 | −411.618 | NA | NA |
| Inf HAFD Water + Memb. |
−1723.99 | −1878.14 | −1890.20 | −154.143 | −166.207 | 251.971 | 245.410 |
| Rr LHC Water | −3358.85 | −4084.69 | −4094.11 | −725.843 | −735.258 | NA | NA |
| Rr LHC Water + Memb. |
−3358.85 | −4042.27 | −4062.88 | −683.419 | −704.028 | 42.424 | 31.231 |
| SFV MBP Water | −1235.18 | −1719.84 | −1722.70 | −484.655 | −487.521 | NA | NA |
| SFV MBP Water + Memb. |
−1235.18 | −1575.80 | −1585.48 | −340.616 | −350.299 | 144.039 | 137.223 |
| OMPX Water | −10584.29 | −12219.19 | −12270.85 | −1634.91 | −1686.57 | NA | NA |
| OMPX Water + Memb |
−10584.29 | −11811.29 | −11858.25 | −1227.01 | −1273.96 | 407.900 | 412.606 |
Results for electrostatic energy calculations with IIM/FFT and FV/PCG for various systems, in kcal/mol. Vacuum energies are shown as reference in the first column. Rxn refers to reaction field energies. The “FFT Δ” and “PCG Δ” columns show the difference between the reaction field energies solvated in water and in water + membrane. All membranes except for the Influenza Hemmagglutination Fusion Domain (Inf HAFD) and the Semiliki Forest Virus Membrane Binding Peptide (SFV MBP) were centered on the protein/peptide. For Inf HAFD and SFV MBP, the membrane was offset by 5 Å in the negative z direction to simulate partial insertion from the top of the membrane rather than transmembrane behavior as with the other systems.
Quadrapole in a Membrane
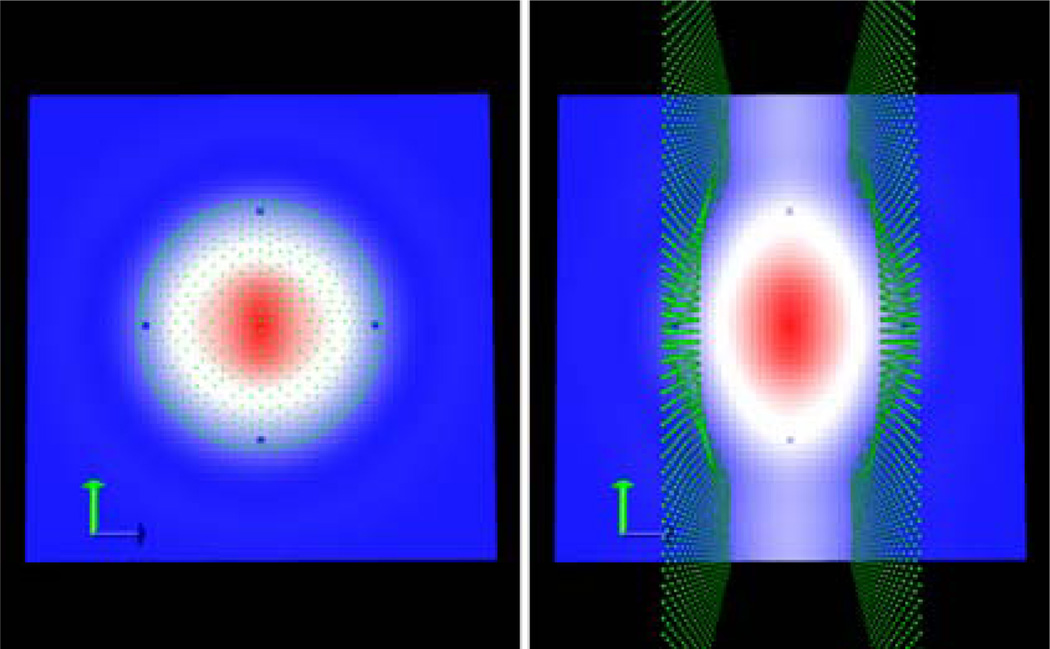
We first used a simple quadrapole system in a 2 Ångstrom low dielectric sphere as an initial test case for the membrane setup. The membrane region was represented as a rectangular slab oriented with its normal running parallel to the z axis, and centered on the middle of the simulation box with dielectric constant equal to that of the solute (e.g. acting as an extension of the solute region). Cross-sectional electrostatic potential distributions for the water only and water + membrane systems were generated using VMD and displayed with the solute/solvent boundary grid points overlaid as shown in Figure 4. Comparison of the left and right panels clearly shows that the low dielectric solute region is indeed being extended to include the slab-like membrane. It is also evident that the level set density method leads to smoothing out of what would otherwise be a sharp transition between the spherical solute and the rectangular membrane.
Figure 4. Level Set Cross Sections And Boundary Grid Points For Quadrapole System.
Left: System solvated in water. Right: System solvated in water and 2 Å slab-like membrane. Boundary grid points are overlaid as green points. For both plots, red indicates the solute/membrane interior region, and blue indicates the solvent region.
Small to Mid-Sized Membrane Peptides and Proteins
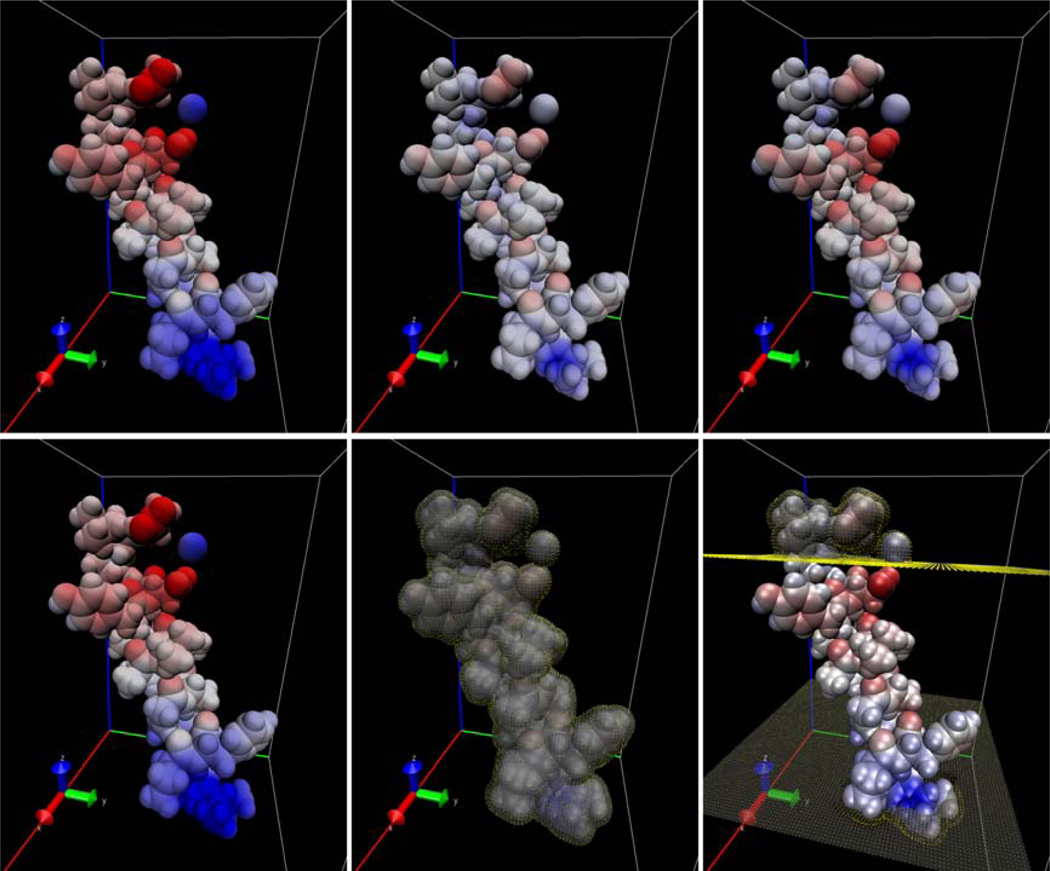
To test the numerical setups for moderate-sized membrane protein systems, we first ran computations on the C-terminal trans-membrane alpha helix of aquaporin. Computations were run for vacuum, continuum water, and continuum water + 20 Ångstrom membrane. The results are visualized in Figure 5 where molecule itself is visualized using the van Der Waals surface with the electrostatic potential distribution mapped onto it. The boundary grid points are also shown to indicate the solute solvent interface. The effect of adding the high dielectric solvent is clearly evident when comparing the left (vacuum) and middle (water only) panels, which shows reduction in intensity and contrast of the color mapping. The effect of the membrane region is evident from comparing the right (water + membrane) panels with the middle and left panels. The upper and lower portions of the molecule that extend beyond the membrane exhibit potentials that most closely resemble the water-solvated potentials while the region interior to the membrane exhibits potential more closely resembling that of the vacuum potentials.
Figure 5. Electrostatic Potential Distribution (Kcal/Mol-E) And Boundary Grid Points For The Aquaporin Coil System.
Top: Electrostatic potential maps only. Bottom: Electrostatic potential maps overlaid with boundary grid points in yellow. Left: Vacuum System. Middle: Solvated in water + 20 Å slab-like membrane. Right: Solvated in water only.
Next we tested our models directly on membrane protein systems, we ran computations on several proteins ranging from 19 to 200 amino acids. Electrostatic energies were computed using both the FV/PCG and IIM/FFT methods. Results are shown in Table 1. Columns 3 and 4 show the reaction field energy for each system. Columns 5 and 6 show the change in the reaction field energy due to the addition of the membrane region. We again notice that the membrane solvation yields energy values between the water only and vacuum cases, as would be expected from extension of the low dielectric solute region (for which the dielectric constant matches the vacuum dielectric). Furthermore, both numerical methods yield energies highly consistent with each other, with difference less than 1–2% for most cases, demonstrating the consistency between the very different handlings of the heterogeneous dielectrics by FV/PCG and IIM/FFT methods.
Aquaporin Channel in Membrane
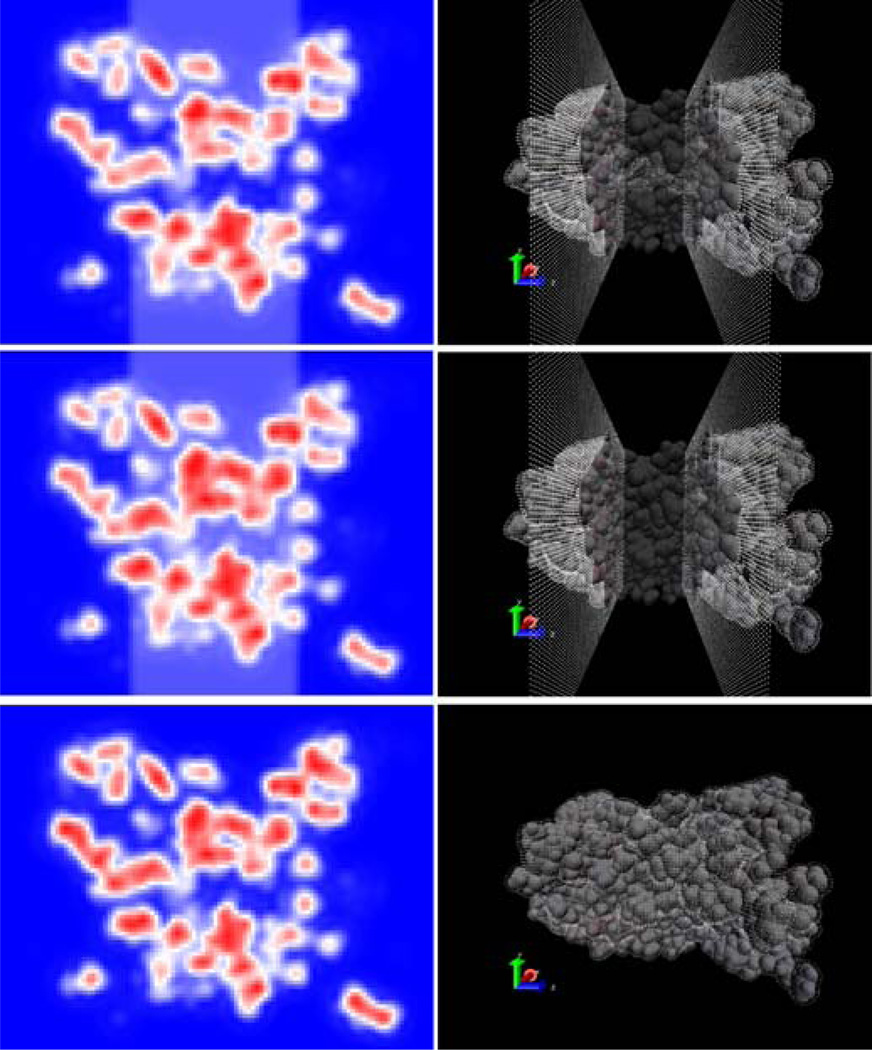
The new model is next tested on a typical membrane protein system, aquaporin, whose transmembrane channel also offers an opportunity to test the implementation of the cylindrical exclusion feature. The tested aquaporin was oriented such that its central solvent channel ran roughly parallel to the z axis. A grid spacing of 0.5 Ångstrom and a fill ratio of 1.125 were used due to its large size. Default AMBER settings were used in all other cases. Four continuum solvation setups were tested: in vacuum, in water, in water + membrane, and in water + membrane with pore. The width and placement of the pore exclusion region was chosen such that membrane dielectric would not be assigned to the solvent channel of the aquaporin while also ensuring that the exclusion region remained within the bounds of the membrane bound protein region.
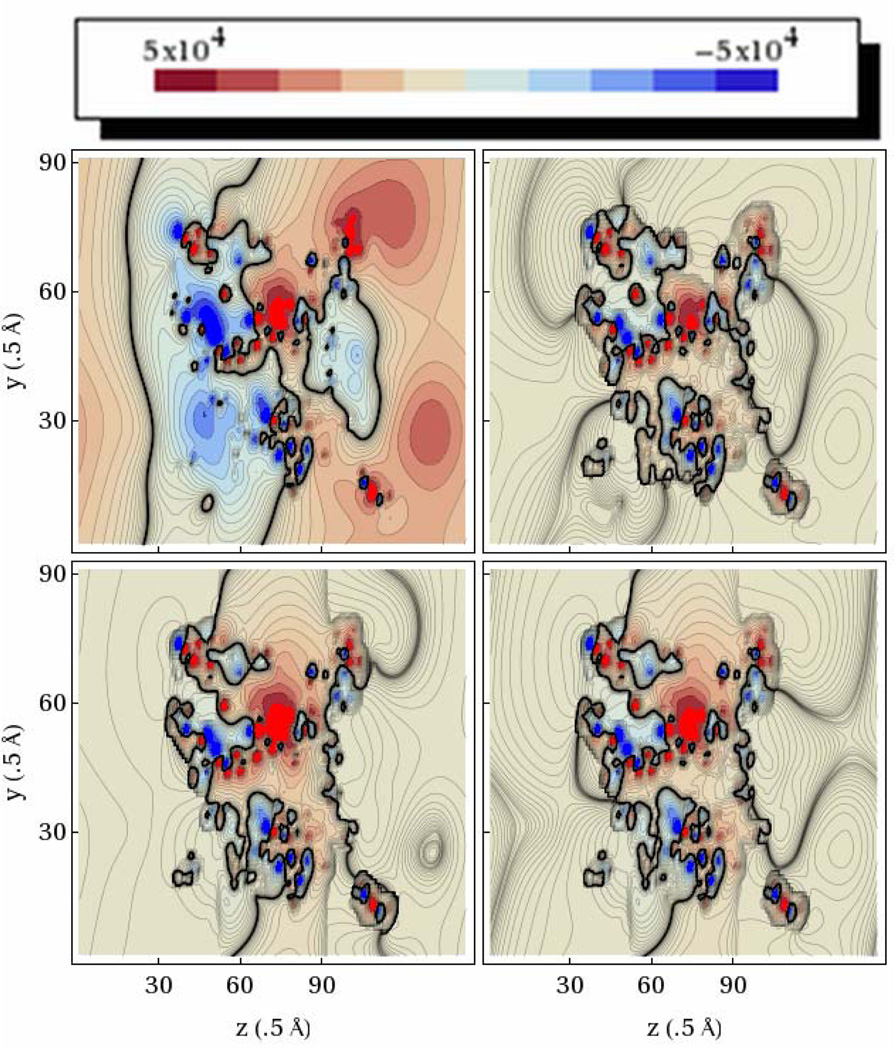
Figure 6 demonstrates the proper implementation of the solvated membrane system with the transmembrane channel. The top panels (membrane with the pore exclusion region) show that the pore region is set to the solvent dielectric when the membrane pore exclusion feature is turned on; whereas the pore region is set to the solute/membrane dielectric when the pore exclusion feature is turned off. This indicates that the membrane pore exclusion feature functions as expected. Figure 7 further visualizes the electrostatic potential distributions of the membrane protein with or without membrane and with and without pore. The addition of solvent (top right panel) clearly reduces the magnitude of the electrostatic potential in the solvent region when compared to the in vacuo run (top left panel). The addition of the slab-like membrane region to the solvated protein (bottom left) results in an increase in the magnitude of the potential within the membrane region as expected. When an excluded pore region is included (bottom right), the magnitude of the potential in the pore region becomes more closely matching that in the protein solvated in water.
Figure 6. Cross-Sectional Distribution Of Level Set Density Function And Boundary Grid Points For The Aquaporin System.
Left: Cross-sectional distribution of the level set density function taken along the y-z plane through the center of the channel. Red indicates the solute region, white indicates the membrane region, and blue indicates the solvent region. Right: van der Waals surface of the aquaporin system overlaid with boundary grid points in white. The van der Waals surface is made transparent to allow viewing of buried boundary grid points. Top panels: Solvated in water + 20 Å membrane with a 6 Å cylindrical exclusion region. Middle panels: Solvated in water + 20 Å membrane. Bottom panels: Solvated in water.
Figure 7. Cross-Sectional Distributions Of Electrostatic Potential (Kcal/Mol-E) For The Aquaporin System.
Top Left: Vacuum. Top right: Solvated in water. Bottom Left: Solvated in water + 20 Å membrane. Bottom Right: Solvated in water + 20 Å membrane and a 6 Å cylindrical exclusion region. Contour plots are taken along the yz plane through the center of the channel.
Conclusions and Future Directions
In this study we explored a continuum slab-like membrane model based on the density function strategy. The optional cylindrical exclusion region, to accommodate the existence of transmembrane channel, was also implemented with the assistance of the level set function for easily mapping of heterogeneous dielectric distributions in the continuum representation of the membrane systems. To mitigate the artifacts of edge effects of the finite system sizes, the periodic boundary condition was also utilized. The continuous and smooth density level set function also allows higher-order PBE solvers to be utilized in the current setup.
Visualization of the tested systems for the water only and water + membrane setups indicate that the membrane level set scheme functions properly. Comparison of reaction field energies between the water only and the water + membrane setups for various small to mid-sized peptides and proteins indicate that addition of a membrane region lowers the magnitude of the reaction field energies. This is expected since the membrane is an extension of the low dielectric region and thus should produce results that fall somewhere between the water only and the vacuum environments. Finally, the cylindrical exclusion feature, as illustrated in the visualizations for the aquaporin system, was shown to have the desired effect of preventing the solute dielectric from being mapped to the channel region of the protein, which should retain the high solvent dielectric. The implementation was also confirmed by comparison of the electrostatic potential in the channel region between the simple slab-like membrane setups with and without the cylindrical exclusion. The magnitude of the electrostatic potential in the channel region more closely matches that from the water only setup.
The results of our continuum membrane model are encouraging. However, there are still many details that must be addressed before it can be routinely applied in biomembrane system modeling and analysis. We are actively working on implementation of unique dielectric constants profiles for the membrane and reformulation of the preconditioned linear PBE solvers (48,49) to suit the periodic boundary condition for more efficient numerical calculations of large biomembrane systems. In addition, extension of the continuum membrane model to include charged head group distributions and incorporation of the hydrophobic effect are clearly interesting (50). Finally, optimization of model parameters for simulation of common membranes should lead to robust modeling of the membrane systems.
Supplementary Material
Proposed a continuum membrane model in the Amber molecular mechanics model
Implemented the model with differential geometry concepts for efficiency
Adapted high-accuracy numerical solvers to more robust solvation modeling
Laid foundation for extension to more realistic modeling of membrane environment
Footnotes
Publisher's Disclaimer: This is a PDF file of an unedited manuscript that has been accepted for publication. As a service to our customers we are providing this early version of the manuscript. The manuscript will undergo copyediting, typesetting, and review of the resulting proof before it is published in its final citable form. Please note that during the production process errors may be discovered which could affect the content, and all legal disclaimers that apply to the journal pertain.
References
- 1.Gohlke H, Case DA. Journal of Computational Chemistry. 2004;25:238–250. doi: 10.1002/jcc.10379. [DOI] [PubMed] [Google Scholar]
- 2.Srinivasan J, Cheatham TE, Cieplak P, Kollman PA, Case DA. Journal of the American Chemical Society. 1998;120:9401–9409. [Google Scholar]
- 3.Forsten KE, Kozack RE, Lauffenburger DA, Subramaniam S. Journal of Physical Chemistry. 1994;98:5580–5586. [Google Scholar]
- 4.Spassov VZ, Yan L, Szalma S. J Phys. Chem. B. 2002;106 [Google Scholar]
- 5.Im W, Feigh M, Brooks CL., III Biophysical Journal. 2003;85:2900–2918. doi: 10.1016/S0006-3495(03)74712-2. [DOI] [PMC free article] [PubMed] [Google Scholar]
- 6.Tanizaki S, Feig M. Journal of Chemical Physics. 2005;122 doi: 10.1063/1.1865992. [DOI] [PubMed] [Google Scholar]
- 7.Tanizaki S, Feig M. Journal of Physical Chemistry B. 2006;110:548–556. doi: 10.1021/jp054694f. [DOI] [PubMed] [Google Scholar]
- 8.Callenberg KM, Choudhary OP, de Forest GL, Gohara DW, Baker NA, Grabe M. PLoS One. 2010;5:1–11. doi: 10.1371/journal.pone.0012722. [DOI] [PMC free article] [PubMed] [Google Scholar]
- 9.Miertus S, Scrocco E, Tomasi J. Chemical Physics. 1981;55:117–129. [Google Scholar]
- 10.Hoshi H, Sakurai M, Inoue Y, Chujo R. Journal of Chemical Physics. 1987;87:1107–1115. [Google Scholar]
- 11.Zauhar RJ, Morgan RS. Journal of Computational Chemistry. 1988;9:171–187. [Google Scholar]
- 12.Davis ME, McCammon JA. Chemical Reviews. 1990;90:509–521. [Google Scholar]
- 13.Rashin AA. Journal of Physical Chemistry. 1990;94:1725–1733. [Google Scholar]
- 14.Juffer AH, Botta EFF, Vankeulen BAM, Vanderploeg A, Berendsen HJCC. Journal of Computational Physics. 1991;97:144–171. [Google Scholar]
- 15.Honig B, Nicholls A. Science. 1995;268:1144–1149. doi: 10.1126/science.7761829. [DOI] [PubMed] [Google Scholar]
- 16.Liang J, Subramaniam S. Biophysical Journal. 1997;73:1830–1841. doi: 10.1016/S0006-3495(97)78213-4. [DOI] [PMC free article] [PubMed] [Google Scholar]
- 17.Roux B, Simonson T. Biophysical Chemistry. 1999;78:1–20. doi: 10.1016/s0301-4622(98)00226-9. [DOI] [PubMed] [Google Scholar]
- 18.Cramer CJ, Truhlar DG. Chemical Reviews. 1999;99:2161–2200. doi: 10.1021/cr960149m. [DOI] [PubMed] [Google Scholar]
- 19.Bashford D, Case DA. Annual Review Of Physical Chemistry. 2000;51:129–152. doi: 10.1146/annurev.physchem.51.1.129. [DOI] [PubMed] [Google Scholar]
- 20.Chen JH, Im WP, Brooks CL. Journal of the American Chemical Society. 2006;128:3728–3736. doi: 10.1021/ja057216r. [DOI] [PMC free article] [PubMed] [Google Scholar]
- 21.Feig M, Chocholousova J, Tanizaki S. Theoretical Chemistry Accounts. 2006;116:194–205. [Google Scholar]
- 22.Im W, Chen JH, Brooks CL. Peptide Solvation and H-Bonds. 2006;72:173. [Google Scholar]
- 23.Lu BZ, Zhou YC, Holst MJ, McCammon JA. Communications in Computational Physics. 2008;3:973–1009. doi: 10.4208/cicp.081009.130611a. [DOI] [PMC free article] [PubMed] [Google Scholar]
- 24.Wang J, Tan CH, Tan YH, Lu Q, Luo R. Communications in Computational Physics. 2008;3:1010–1031. [Google Scholar]
- 25.Yap E-H, Head-Gordon T. Journal of Chemical Theory and Computation. 2010;6:2214–2224. doi: 10.1021/ct100145f. [DOI] [PMC free article] [PubMed] [Google Scholar]
- 26.Geng W, Wei GW. Journal of Computational Physics. 2011;230:435–457. doi: 10.1016/j.jcp.2010.09.031. [DOI] [PMC free article] [PubMed] [Google Scholar]
- 27.Still WC, Tempczyk A, Hawley RC, Hendrickson T. Journal of the American Chemical Society. 1990;112:6127–6129. [Google Scholar]
- 28.Srinivasan J, Trevathan MW, Beroza P, Case DA. Theoretical Chemistry Accounts. 1999;101:426–434. [Google Scholar]
- 29.Zhou R. PROTEINS: Structure, Function, and Genetics. 2003;53:148–161. doi: 10.1002/prot.10483. [DOI] [PubMed] [Google Scholar]
- 30.Ulmschneider MB, Ulschneider JP, Sansom MS, Di Nola A. Biophysical Journal. 2007;92:2338–2349. doi: 10.1529/biophysj.106.081810. [DOI] [PMC free article] [PubMed] [Google Scholar]
- 31.Davis ME, McCammon JA. Journal of Computational Chemistry. 1989;10:386–391. [Google Scholar]
- 32.Nicholls A, Honig B. Journal of Computational Chemistry. 1991;12:435–445. [Google Scholar]
- 33.Bashford D. Lecture Notes in Computer Science. 1997;1343:233–240. [Google Scholar]
- 34.Baker N, Holst M, Wang F. Journal of Computational Chemistry. 2000;21:1343–1352. [Google Scholar]
- 35.Bajaj C, Chen S-C, Rand A. Siam Journal on Scientific Computing. 2011;33:826–848. doi: 10.1137/090764645. [DOI] [PMC free article] [PubMed] [Google Scholar]
- 36.Boschitsch AH, Fenley MO, Zhou HX. Journal of Physical Chemistry B. 2002;106:2741–2754. [Google Scholar]
- 37.Lu B, Cheng X, Huang J, McCammon JA. Journal of Chemical Theory and Computation. 2009;5:1692–1699. doi: 10.1021/ct900083k. [DOI] [PMC free article] [PubMed] [Google Scholar]
- 38.Totrov M, Abagyan R. Biopolymers. 2001;60:124–133. doi: 10.1002/1097-0282(2001)60:2<124::AID-BIP1008>3.0.CO;2-S. [DOI] [PubMed] [Google Scholar]
- 39.Koehl P. Current Opinion in Structural Biology. 2006;16:142–151. doi: 10.1016/j.sbi.2006.03.001. [DOI] [PubMed] [Google Scholar]
- 40.Eastwood JW, Hockney RW. Computer Simulation Using Particles. Philadelphia, PA, USA: IOP Publishing Ltd.; 1988. [Google Scholar]
- 41.Li Z, Ito K. The immersed interface method : numerical solutions of PDEs involving interfaces and irregular domains. Philadelphia: Society for Industrial and Applied Mathematics; 2006. [Google Scholar]
- 42.Ye X, Wang J, Luo R. Journal of Chemical Theory and Computation. 2010;6:1157–1169. doi: 10.1021/ct900318u. [DOI] [PMC free article] [PubMed] [Google Scholar]
- 43.Li Z. Taiwanese Journal of Mathematics. 2003;7:1–49. [Google Scholar]
- 44.Li Z. Numerical Algorithms. 1997;14 [Google Scholar]
- 45.Wang J, Cai Q, Xiang Y, Luo R. Journal of Chemical Theory and Computation. 2012;8:2741–2751. doi: 10.1021/ct300341d. [DOI] [PMC free article] [PubMed] [Google Scholar]
- 46.Bruccorleri RE, Novotny J, Davis ME. Journal of Computational Chemistry. 1997;18:268–276. [Google Scholar]
- 47.Case DA, Darden TA, Cheatham TEI, Simmerling CL, Wang J, Duke RE, Luo R, Walker RC, Zhang W, Merz KM, Roberts B, Hayik S, Roitberg A, Seabra G, Swails J, Gotz AW, Kolossvary I, Wong KF, Paesani F, Vanicek J, Wolf RM, Liu J, Wu X, Brozell SR, Steinbrecher T, Gohlke H, Cai Q, Ye X, Wang J, Hsieh M-J, Cui G, Roe DR, Mathews DH, Seetin MG, Salomon-Ferrer R, Sagui C, Babin V, Luchko T, Gusarov S, Kovalenko A, Kollman PA. AMBER 12. San Francisco: University of California; 2012. [Google Scholar]
- 48.Cai Q, Hsieh M-J, Wang J, Luo R. Journal of Chemical Theory and Computation. 2010;6:203–211. doi: 10.1021/ct900381r. [DOI] [PMC free article] [PubMed] [Google Scholar]
- 49.Wang J, Luo R. Journal of Computational Chemistry. 2010;31:1689–1698. doi: 10.1002/jcc.21456. [DOI] [PMC free article] [PubMed] [Google Scholar]
- 50.Ting CL, Wang ZG. Biophysical Journal. 2011;100:1288–1297. doi: 10.1016/j.bpj.2010.11.042. [DOI] [PMC free article] [PubMed] [Google Scholar]
Associated Data
This section collects any data citations, data availability statements, or supplementary materials included in this article.


