

Triple-negative breast cancer is a broad and diverse category for which additional subclassifications are needed. Therefore, future clinical trials should stratify patients based on a tumor′s basal-like versus non-basal-like gene expression profile, which appears to be the main biological difference seen within triple-negative breast cancer.
Keywords: Breast cancer, Subtype, Gene expression, Triple-negative, basal-like
Learning Objectives
Contrast the definitions of TN and basal-like.
Describe the undistinguishable global gene expression patterns of non-basal-like TN tumors versus non-TN tumors that are non-basal-like.
Describe the relationship between TN heterogeneity and tumor heterogeneity plus microenvironmental heterogeneity.
Abstract
Triple-negative (TN) and basal-like (BL) breast cancer definitions have been used interchangeably to identify breast cancers that lack expression of the hormone receptors and overexpression and/or amplification of HER2. However, both classifications show substantial discordance rates when compared to each other. Here, we molecularly characterize TN tumors and BL tumors, comparing and contrasting the results in terms of common patterns and distinct patterns for each. In total, when testing 412 TN and 473 BL tumors, 21.4% and 31.5% were identified as non-BL and non-TN, respectively. TN tumors identified as luminal or HER2-enriched (HER2E) showed undistinguishable overall gene expression profiles when compared versus luminal or HER2E tumors that were not TN. Similar findings were observed within BL tumors regardless of their TN status, which suggests that molecular subtype is preserved regardless of individual marker results. Interestingly, most TN tumors identified as HER2E showed low HER2 expression and lacked HER2 amplification, despite the similar overall gene expression profiles to HER2E tumors that were clinically HER2-positive. Lastly, additional genomic classifications were examined within TN and BL cancers, most of which were highly concordant with tumor intrinsic subtype. These results suggest that future clinical trials focused on TN disease should consider stratifying patients based upon BL versus non-BL gene expression profiles, which appears to be the main biological difference seen in patients with TN breast cancer.
Implications for Practice:
Basal-like breast cancer is commonly known as triple-negative (TN) breast cancer because the majority of cases lack expression of estrogen and progesterone receptors and overexpression and/or amplification of HER2. However, not all TN tumors are identified as basal-like by gene expression, and not all basal-like tumors are TN. Here, we show that TN disease is a broad and diverse category for which additional subclassifications are needed. We propose that clinical trials focused on TN disease stratify patients based upon a tumor′s basal-like versus non-basal-like gene expression profiles, which appears to be the main biological difference seen in patients with TN breast cancer.
Introduction
Studies based upon global gene expression analyses have identified four main intrinsic molecular subtypes of breast cancer known as luminal A, luminal B, HER2-enriched [HER2E] and basal-like [1–4]. These molecular entities have shown significant differences in terms of incidence, risk factors, baseline prognosis, age at diagnosis, and response to treatment [2–3, 5]. Among them, the basal-like subtype is of particular clinical interest due to its high frequency, lack of effective targeted therapies, poor baseline prognosis, and its tendency to affect younger women.
Over the years, basal-like breast cancer has become more commonly known as triple-negative (TN) breast cancer because the majority of tumors of this molecular subtype lack expression of hormone receptors (HR) and overexpression and/or amplification of HER2; however, not all TN tumors are identified as basal-like by gene expression, and not all basal-like tumors are TN [2]. In fact, as we have previously reported using publicly available microarray data, the discordance rate between the two definitions is 20%–30% [2]. More recently, subtyping of three large clinical trials (GEICAM/9906 [6], MA.12 [7], and MA.5 [8]) using the PAM50 qRT-PCR-based assay revealed that approximately 30% of tumors identified as TN by central pathology review do not fall into the basal-like subtype category [9]. Therefore, significant biological heterogeneity exists within the group of patients diagnosed with TN disease.
In this study, we undertook a molecular characterization of the main molecular entities found within TN disease, as well as a focused molecular characterization of basal-like tumors that are not TN. In addition, we compared the features of the main intrinsic subtypes, together with the recently identified claudin-low subtype [10] and with the six subtypes of TN disease recently identified by Lehmann et al. [11]. These analyses revealed many common findings that should provide biological value for the interpretation of data coming from TN breast cancer trials.
Materials and Methods
Microarray Data Sets
We evaluated 12 publicly available microarray data sets (GSE12276 [12, 13], GSE2034 [13, 14], GSE25066 [15], GSE16716 [16], GSE20194 [17], GSE23988 [18], MDACC133 [19], GSE18229 [10], GSE20711 [20], GSE2109 [21], GSE2603 [22], and GSE19615 [23]), each of which provided annotated clinical-pathological data. Raw data files from each Affymetrix (Santa Clara, CA) microarray-based cohort were normalized using MAS5 and replicates samples removed. The probes of the GSE18229 Agilent-based cohort were filtered by requiring the Lowess normalized intensity values in both sample and control to be >10. The normalized log2 ratios (Cy5 sample/Cy3 control) or log2 intensity of probes mapping to the same gene (entrez ID as defined by the manufacturer) were averaged to generate independent expression estimates. In each cohort, genes were median centered and standardized to zero mean and unit variance. Finally, samples without clinical-pathological annotation regarding estrogen receptor (ER) status, progesterone receptor (PR) status, and HER2 status were excluded, leaving a total of 1,703 samples with microarray data and known ER/PR and HER2 status.
Combined Microarray Data Set
Of the 12 normalized gene/row median-centered and standardized data sets evaluated, seven (GSE20194 [17], MDACC133 [19], GSE18229 [10], GSE20711 [20], GSE2109 [21], GSE2603 [22], and GSE19615 [20]) were successfully combined into a single gene expression microarray matrix of 1,005 samples (including 17 normal breast samples) and 7,722 entrez ID genes in common. Loading plots of the two principal components were evaluated to exclude important batch effects (supplemental online Fig. 1).
Gene Expression Molecular Subtyping
To be consistent with our previous studies, the PAM50 intrinsic subtype classifier was used as described in Parker et al. [24] to determine the subtype calls (luminal A, luminal B, HER2E, basal-like, and normal-like) of each individual sample within each cohort. For samples in data sets GSE18229, GSE12276 and GSE2034, we used the previously reported subtype calls [10, 13]. Additionally, in the combined microarray data set, we also explored the identification of the claudin-low subtype [10]. To do so, we applied a 9-cell line claudin-low predictor [10], rank ordered the samples based on the Euclidian distance ratio to the “others” centroid versus the “claudin-low” centroid, and then identified the top 10% of tumors as claudin-low.
To identify the molecular subtypes of TN breast cancer, we used the list published by Lehmann et al. [11] of 2,188 genes that classifies TN tumors into six classes (immunomodulatory [IM], basal-like 1 [BL1], basal-like 2 [BL2], mesenchymal [M], mesenchymal stem-like [MSL], and luminal androgen receptor [LAR]). This gene list was used in a hierarchical cluster analysis, with the six groups identified based upon the cluster-associated dendrogram and the genes that defined each of the groups.
The Cancer Genome Atlas Data Set
Gene expression, DNA copy number, reverse-phase protein array (RPPA), and mutational data were obtained from The Cancer Genome Atlas (TCGA) website (http://cancergenome.nih.gov/) [25]. PAM50 subtype calls, ER/PR status, and HER2 status were used as provided from TCGA.
Microarray of Human Breast Samples and Cell Line Models
All human tumor and normal tissue samples were collected using protocols approved by the institutional review board. Samples were obtained from fresh frozen breast specimens. In vivo and in vitro human breast cancer and immortalized human mammary epithelial cell lines (HME-CC, BT474, BT483, BT549, CAMA-1, HCC1143, HCC1187, HCC1395, HCC1428, HCC1500, HCC1937, HCC1954, HCC38, Hs578T, MCF7, MDAMB231, MDAMB361, MDAMB415, MDAMB435, MDAMB436, MDAMB453, MDAMB468, ME16C, SKBR3, SUM102, SUM1315, SUM149PT, SUM159PT, SUM90PT, T47D, UACC812, ZR75–1, MDA-IBC3, DU4775) were cultured as suggested by providers. Three primary tumor breast cancer xenografts (HIM2 [26], HIM5 [26], and HIM12), grown in immunocompromised mice, were also assayed by microarray. RNA was purified using the RNeasy Mini kit. All samples were profiled as previously described using oligo microarrays (Agilent Technologies, Santa Clara, CA) [25], and microarray and patient clinical data are available in the University of North Carolina Microarray Database and have been deposited in the Gene Expression Omnibus under the accession number GEO:GSE41119. The probes of the GSE41119 Agilent-based cohort were filtered by requiring the Lowess normalized intensity values in both sample and control to be >10. The normalized log2 ratios (Cy5 sample/Cy3 control) or log2 intensity of probes mapping to the same gene (entrez ID as defined by the manufacturer) were averaged to generate independent expression estimates, and genes were median centered and standardized to zero mean and unit variance. PAM50 and claudin-low subtyping was performed as described above.
Statistical Analysis
All microarray cluster analyses were displayed using Java Treeview version 1.1.4r2 [27]. Average-linkage hierarchical clustering was performed using Cluster v3.0 [27]. Biologic analysis of microarray data was performed with the Database for Annotation, Visualization, and Integrated Discovery annotation tool [28]. Unpaired two-class significance analysis of microarrays (SAM) was used to identify differentially expressed genes between subtypes [29]. Analysis of variance and Student's t tests for gene expression data were done using R 2.10.1 (http://www.r-project.org/).
Results
In this section, we refer to the various combinations of the two main clinical phenotypes (TN versus non-TN) and the various molecular intrinsic subtypes using the format shown in Figure 1. For example, the two main clinical phenotypes of basal-like tumors will be defined as basal-like/TN and basal-like/non-TN, whereas the two main molecular intrinsic subtypes of TN tumors will be defined as TN/basal-like and TN/non-basal-like.
Figure 1.

Representative algorithm of the two main clinical phenotypes (triple-negative versus non-triple-negative) and the various molecular intrinsic subtypes analyzed in this study. The gene expression heatmap represents the 50 genes of the PAM50 subtype predictor and the PAM50 microarray training data set.
Abbreviation: TN, triple-negative.
Distribution of the Main Intrinsic Subtypes Within TN Breast Cancer
We evaluated data from 12 publicly available microarray data sets with known ER, PR, and HER2 clinical status (n = 1,703). In each individual data set, we applied the PAM50 subtype predictor and classified tumors as luminal A, luminal B, HER2E, basal-like, and normal-like. The overall concordance rate was found to be 79% (κ = 0.62) between the immunohistochemistry (IHC)-based and PAM50 subtype definitions (luminal A and B tumors combined and normal-like cases excluded because this group is likely contaminated with true normal breast tissue). Among 412 TN tumors, 78.6% were identified as basal-like, 7.8% as HER2E, 6.6% as luminal, and 7.0% as normal-like (Fig. 2). This PAM50 subtype distribution within TN tumors is similar to the distribution reported across three large clinical trials with centrally reviewed IHC-based and PAM50-based data [9]. Conversely, within 473 basal-like tumors, 68.5% were identified as HR−/HER2−, 18.2% as HR+/HER2−, 10.6% as HR−/HER2+, and 2.7% as HR+/HER2+.
Figure 2.
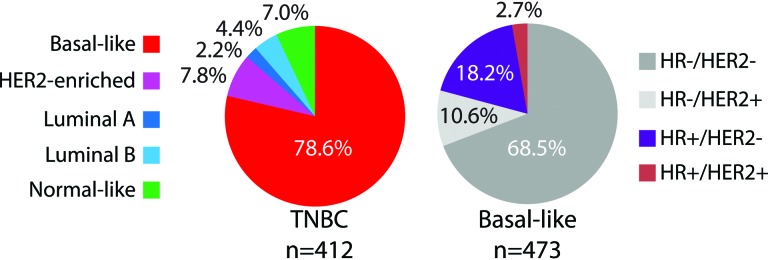
Distribution of the intrinsic molecular and pathology-based subtypes within triple-negative and basal-like tumors.
Abbreviations: HR, hormone receptor; TNBC, triple-negative breast cancer.
Triple-Negative Subtype-Specific Gene Expression Features
To identify genes whose expression characterizes the luminal, HER2E, and basal-like subtypes within TN breast cancer only, we performed a three-class SAM with a false-discovery rate of 0% and obtained a list of 1,510 genes (supplemental online Table 1). Clustering of these genes across these three intrinsic subtypes using only TN disease samples revealed six main gene clusters (Fig. 3, supplemental online Fig. 2). As expected, TN/luminal tumors showed high expression of estrogen-related and previously identified luminal genes (p < .0001) such as ESR1, PGR, MUC1, and GATA3, and low expression of cell cycle-related genes (p < .0001) such as KI67 and aurora kinase B. Conversely, TN/HER2E tumors showed an overall intermediate gene expression compared to the other two subtypes, except for a gene cluster that included high expression of genes involved in oxidation reduction-related biological processes (p < .0001), such as isocitrate dehydrogenase 1, fatty acid synthase, and superoxide dismutase 1 (SOD1).
Figure 3.

Subtype-specific gene expression profiles within triple-negative disease. Each colored square represents the relative mean gene score for each subtype, with highest expression shown in red, average expression in black, and lowest expression in green. This gene list was obtained by performing a three-class (luminal, HER2E and basal-like) significance analysis of microarrays within triple-negative disease (False Discovery Rate = 0%). On the right, selected genes symbols of several gene clusters are shown, as well as selected gene ontology biological processes found significantly enriched in each gene cluster.
Abbreviations: AGR2, anterior gradient 2 homolog; APOD, apolipoprotein D; AR, androgen receptor; AURKB, aurora kinase B; BAG1, BCL2-associated athanogene; CCNB2, cyclin B2; CDH1, E-cadherin 1; ESR1, estrogen receptor; FGFR4, fibroblast growth factor receptor 4; ITGA6, integrin alpha 6; KRT, keratin; MUC1, mucin 1; NEBL, nebulette; PGR, progesterone receptor; PTK6, protein tyrosine kinase 6; S100, S100 calcium binding protein; SOD1, superoxide dismutase 1; XIST, inactive X specific transcripts.
A large set of genes defined the TN/basal-like tumors, including previously known basal epithelial cell genes such as keratin 14 and ID4, and a large set of proliferation associated genes including FOXM1. Finally, we identified a subcluster of luminal-like genes, including the androgen receptor (AR), FOXA1, E-Cadherin, and keratin 18, which was similarly and highly expressed in TN/luminal and TN/HER2E tumors compared to TN/basal-like tumors. Overall, this data suggested that TN disease is biologically heterogeneous, and that all the main gene expression features of the intrinsic molecular subtypes are maintained even when starting with this clinically restricted subset.
Triple-Negative Versus Non-Triple-Negative Subtype-Specific Gene Expression Features
To address how different non-TN versus TN tumors of a common subtype are (i.e., luminal/TN versus luminal/non-TN), we identified differentially expressed genes between TN and non-TN tumors within a given subtype using the 7,722 available genes of the combined microarray data set of 1,005 tumors with known ER, PR, and HER2 status. Within the luminal A and luminal B subtypes, no differentially expressed gene was identified between TN (n = 26) and non-TN (n = 553) tumors, whereas only 13 (0.2%) and 18 (0.23%) genes were found differentially expressed between TN and non-TN tumors within basal-like (n = 164 vs. n = 82) and HER2E (n = 17 and n = 106) subtypes, respectively (supplemental online Tables 2, 3).
The five genes found significantly downregulated in HER2E/TN compared to HER2E/non-TN were all found in the 17q11–13 amplicon (HER2/ERBB2, GRB7, MED1, SCGB2A2 and STARD3). Thus, aside from the genes on the HER2 amplicon, almost no differences existed between subtype matched TN vs. non-TN tumors when tested on the mRNA level.
Expression of Selected Genes Across the Subtypes Based on Their TN Status
These results suggest that the overall gene expression profiles of the PAM50 subtypes are undistinguishable regardless of their clinical ER, PR, and HER2 status, particularly TN status. Indeed, clustering of the 1,005 tumors using the PAM50 genes revealed that luminal/TN and HER2E/TN tumors show very similar overall PAM50 gene expression patterns as do luminal/non-TN and HER2E/non-TN tumors, with extensive intermingling (Fig. 4, supplemental online Table 4). Similarly, basal-like/TN tumors showed undistinguishable PAM50 gene expression patterns relative to basal-like/non-TN.
Figure 4.
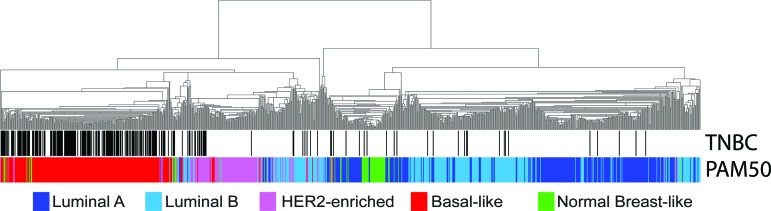
Hierarchical clustering of 1,005 tumors from a combined data set using the available PAM50 genes (n = 40 of 50). All samples have known estrogen receptor, progesterone receptor, and HER2 status. Triple-negative samples and the PAM50 calls are shown below the array tree.
Abbreviation: TNBC, triple-negative breast cancer.
To more precisely test these findings, we evaluated the expression of important selected genes across the subtypes and based on the TN status of the tumors. For example, ESR1 and PGR expression in luminal/TN tumors were found high and not statistically different when compared to luminal/non-TN tumors (Fig. 5A, 5B), whereas the differences in ESR1 and PGR expression were minor within the other subtypes.
Figure 5.

Box-and-whisker plots for expression of selected breast cancer-related genes based on the intrinsic subtype and triple-negative status. p values were calculated by comparing mean values across all groups.
Abbreviation: TNBC, triple-negative breast cancer.
HER2E/TN tumors showed a statistically significant lower expression of HER2/ERBB2 compared to HER2E/non-TN tumors, with the levels of HER2/ERBB2 expression in HER2E/TN tumors being similar to the levels observed in the other subtypes (Fig. 5C). Conversely, expression of EGFR was found significantly increased in HER2E/TN tumors compared to HER2E/non-TN tumors (Fig. 5D), thus suggesting that some of the HER2E tumors that are clinically HER2-not amplified may be driven by EGFR; a similar finding for EGFR was observed within the TCGA data set of HER2E tumors [25]. Finally, concordant with the similar overall gene expression profiles of HER2E/TN and HER2E/non-TN tumors, genes such as AR and the luminal transcription factor FOXA1 were found to be similarly expressed between TN and non-TN tumors (Fig. 5E, 5F), and with both luminal and HER2E subtypes at a level significantly higher than that seen in the basal-like subtype tumors.
Age at Diagnosis of Subtypes Based on Their TN Status
Previous studies have shown that younger women's breast tumors are enriched for more aggressive intrinsic subtypes, namely basal-like [30]. In our combined data set, basal-like tumors showed a statistically significant lower mean age at diagnosis than the rest of subtypes (50.8 years vs. 55.0 years; p < .0001, normal-like tumors excluded); this was observed to be true regardless of TN status (50.7 years in basal-like/non-TN vs. 50.9 years in basal-like/TN tumors; p > .05).
Within TN disease (supplemental online Fig. 3), the mean age at diagnosis of TN/basal-like versus TN/non-basal-like tumors was found to be significantly different (50.7 vs. 57.1 years; p < .0001, normal-like tumors excluded). Interestingly, 26 of 98 (26.5%) of TN tumors appearing in women ≥60 years old were identified as non-basal-like compared to only 3 of 70 (4.3%) of TN tumors in women ≤40 years old (odds ratio for identification of non-basal-like tumors = 8.1, p < .0001).
Independent Evaluation of TN Tumors From TCGA
The recently reported TCGA Breast Cancer data set offers the opportunity to interrogate other data types beyond gene expression, including protein expression using RPPA, DNA copy number changes, and somatic and germline DNA mutations [25]. Among 90 TN tumors in the TCGA data set, the PAM50 subtype distribution was as follows: basal-like (n = 78, 87%), HER2E (n = 5, 5.6%), luminal A/B (n = 5, 5.6%), and normal-like (n = 2, 2.2%). A summary of the TCGA TN tumor data is provided in Figure 6, with the top portion devoted to a detailed molecular analysis of the TN/non-basal-like tumors (Fig. 6A), and the bottom focused on the overall features of each subtype within TCGA TN cancers only (Fig. 6B).
Figure 6.

Summarized molecular data of triple-negative tumors from The Cancer Genome Atlas (TCGA) data set [25]. (A): Molecular data of the 12 triple-negative (TN)/non-basal-like tumors is shown. (B): Overall data of the HER2E (n = 5), luminal/normal (n = 7), and basal-like (n = 78) groups within TN disease is shown. The PAM50 proliferation score was calculated by estimating the mean expression of 11 proliferation-related genes. Percentiles of the PAM50 proliferation score across the entire TCGA data set are shown for each sample. For reverse-phase protein array data, low, average and high values are relative to the log base 2 median expression of that particular protein across the entire TCGA data set (<−1 expression = low; −1 to +1 = average; >+1 = high).
Abbreviations: AR, androgen receptor; ER, estrogen receptor; Mut, mutations; NA, not available; PR, progesterone receptor; PROLIF, PAM50 proliferation score; ROR, risk of relapse; RPPA, reverse-phase protein array; TN, triple-negative.
First, we explored the RPPA data (i.e., 172 proteins) to identify differentially expressed proteins between TN/non-basal-like versus TN/basal-like tumors (supplemental online Table 5). A total of 10 proteins were identified (unpaired two-class SAM, FDR = 0%); the six upregulated proteins in TN/non-basal-like tumors were AR, PR, ER, cyclin D1, GATA3, and INPP4B, which has recently been shown to be a tumor suppressor found deleted and with low expression in basal-like tumors [31, 32]. Similar to the gene expression data, the expression of AR in TN/HER2E tumors was found to be similar to expression levels in non-TN/HER2E tumors, and higher than TN/basal-like or non-TN/basal-like tumors (data not shown). Finally, the four downregulated proteins in TN/non-basal-like tumors compared to TN/basal-like tumors were cyclin B1, anilin, MSH6, and disheveled 3.
Secondly, we explored the DNA mutation data. As expected, TN/basal-like and TN/HER2E tumors showed the largest number of total somatic mutations (mean number of mutations = 90.39 and 97.2, respectively) compared to TN/luminal tumors (mean number of mutations = 43). In terms of TP53 somatic mutations, 2 of 5 (40%) TN/luminal tumors had TP53 mutations versus 63 of 74 (85%) TP53 mutations within TN/basal-like tumors and 6 of 6 (100%) TP53 mutations in TN/HER2E (p = .019, χ2 test). In fact, a TP53 wild-type TN/luminal A tumor had a MAP2K4 mutation that is typically identified in ER+ luminal tumors. Moreover, BRCA1/2 deleterious mutations (somatic and germline mutations combined) were found in 16 of 73 (22%) TN/basal-like tumors versus 1 of 5 (20%) in TN/luminal tumors (which was a BRCA2 germline mutation) and 0 of 5 (0%) in TN/HER2E tumors. Conversely, somatic mutations in PI3KCA, which is a frequent ER+/luminal tumor mutation, were found in 2 of 5 (40%) TN/luminal tumors versus 5 of 74 (6.8%) in TN/basal-like tumors (all 5 samples were TP53 mutated) and 0 of 6 (0%) in TN/HER2E tumors (p = .035, χ2 test). Thus, even within TN cancers, the mutation spectrum observed continued to follow molecular subtype as opposed to following a common biology possibly laid out by being TN.
Finally, concordant with our results, we observed that all TN/HER2E tumors did not show overexpression of the HER2 gene or protein, and all TN/HER2E tumors lacked high amplification of the HER2/GRB7 17q12 amplicon based on the AFFY SNP array data. Interestingly, a TN/HER2E tumor was found to be a lobular invasive carcinoma with a frame-shift mutation in E-cadherin.
Beyond the Main Subtypes of Triple-Negative Disease
Lehmann et al. [11] reported the identification of six molecular subtypes within TN disease (IM, BL1, BL2, M, MSL, and LAR). To explore the similarities and differences between these molecular entities and the PAM50 subtypes, together with our recently identified claudin-low subtype, we performed a supervised hierarchical clustering using the list of 2,188 genes by Lehmann et al. on the 224 TN tumors of our combined data set (many of which were also contained within the Lehmann et al. data set).
As shown in Figure 7A, six to seven tumor clusters were observed and four main gene expression clusters were identified representing a stromal gene signature (i.e., fibroblast activation protein), a luminal signature (i.e., ESR1, FOXA1), an immune signature (i.e., CD8A), and a basal epithelial signature (i.e., keratin 5 and 14). The stromal and immune gene clusters, which are likely identifying gene expression patterns coming from the microenvironment (i.e., invading fibroblasts and immune cells), are critical for the identification of Lehmann's M, MSL, and IM subtypes, respectively (Fig. 7B). Nonetheless, the PAM50 subtypes were clearly identified, with the vast majority of HER2E and luminal tumors highly expressing the LAR cluster and the true normals and normal-like tumor samples highly expressing the stromal/fibroblast cluster. Interestingly, the PAM50-defined basal-like tumors were split into three main groups based on the expression of the immune-related genes, the stromal-related genes, and the basal genes. Finally, the claudin-low tumors were found scattered within the large basal-like group of tumors based on their expression of the immune and/or stromal gene clusters.
Figure 7.

Triple-negative (TN) tumors classified by gene signatures from Lehmann et al. [11]. (A): Supervised hierarchical clustering of 224 TN tumors from the combined data set using the centroid gene list from from Lehmann et al. Each colored square represents the relative mean transcript abundance (in log2 space) for each subtype, with highest expression shown in red, median expression in black, and lowest expression in green. PAM50 and claudin-low subtype calls are identified below the array tree. (B): Genes from the clustering in (A) that distinguish each subtype identified in Lehmann et al. Red and green indicate the expression direction (upregulated or downregulated, respectively) in each subtype. (C): Supervised hierarchical clustering of 250 breast samples and 37 cell lines representing all subtypes using the centroid gene list from Lehmann et al. (D): Genes from the clustering in (C) that distinguish each subtype identified in Lehmann et al.
Abbreviations: AR, androgen receptor; BL1, basal-like 1; BL2, basal-like 2; CAV1, caveolin 1; ESR1, estrogen receptor; FAP, fibroblast activation protein; IM, immunomodulatory; KRT, keratin; LAR, luminal androgen receptor; LY96, lymphocyte antigen 96; M, mesenchymal; MSL, mesenchymal stem-like; NA, not available.
Overall, this data suggested that the IM and MSL subtypes are mostly defined by the high expression of genes likely coming from the microenvironment, not from the actual tumor cells. To explore this hypothesis, we performed hierarchical clustering analysis using the list of 2,188 genes by Lehmann et al. [11] and a sample set composed of 230 human breast tumor samples, 20 normal breast samples, 34 in vitro human breast cancer cell lines, and 3 human breast cancer xenografts grown in immunocompromised mice, all assayed on Agilent DNA microarrays (Fig. 7C). As expected, the genes whose high expression defined the IM and MSL subtypes (Fig. 7D), namely the stromal/fibroblast and immune signature genes, were not found expressed in any of the cell line or xenograft models (Fig. 7C), which is concordant with their expression coming from the microenvironment (i.e., the microenvironment is lacking in vitro and is coming from mouse cells for the xenografts, and which does not hybridize to human DNA microarrays).
Discussion
In this study, we evaluated a large number of breast cancer data sets and made the following major observations concerning TN breast cancers:
TN and basal-like definitions should not be considered synonymous because considerable discordance exists (∼25%).
TN disease is a heterogeneous clinical entity composed of all the intrinsic molecular subtypes, with the basal-like tumors predominating (∼70%).
TN tumors that are identified as non-basal-like (i.e., HER2E or luminal A/B) show nearly undistinguishable global gene expression patterns versus non-TN tumors that are non-basal-like (i.e., HER2E or luminal A/B).
Basal-like tumors that are non-TN show similar genomic features and an association with age at diagnosis as do basal-like tumors that are TN.
Previously described TN heterogeneity in part reflects tumor heterogeneity plus microenvironmental heterogeneity. Thus, TN disease is a broad and diverse category for which additional subclassifications are needed.
A group of TN tumors that has attracted a lot of attention in recent years is the subset that expresses the AR. For example, Niemeier et al. [33] evaluated a series of 189 consecutive invasive breast cancers; 151 (80%) were positive for AR. As expected, the majority (95%) of ER+ tumors were AR+, and AR positivity was observed in 5 of 8 (63%) ER−/PR−/HER2+ cases and only in 3 of 30 TN cases (10%). AR expression in ER− tumors was associated with lower histological grade and apocrine histological differentiation—a finding that has also been observed by other groups [34, 35]. Concordant with this data, we observed that TN tumors with high AR protein and/or gene expression were usually identified as HER2E or luminal (or luminal AR, according to Lehmann et al.[11]), and their levels of AR expression resembled the levels observed in HER2E and luminal tumors that were not TN. In addition, we have previously shown that among six apocrine tumors with published gene expression data, three (50%) were identified as HER2E and 3 (50%) as luminal [10]. Interestingly, one clinical trial evaluating antiandrogens for patients with TN tumors with expression of AR is underway (NCT00972023). In another study (NCT00468715), 12% (51/424) of TN tumors expressed AR by IHC, which showed a 21% clinical benefit with bicalutamide [36]; thus, the overwhelming majority of TN tumors were AR−.
At first glance, the identification of TN/luminal tumors, clinically HER2−/HER2E tumors, or non-TN/basal-like tumors might seem counterintuitive; however, several plausible explanations exist. One possibility is the false positivity or false negativity of the IHC-based assays for determining the HR or HER2 status, especially because these pathology-based tests are challenged by interlaboratory and intermethod discordance rates of ∼20% [3, 37]. Another possibility is that the pathology and gene expression data could have been obtained from two different areas of the same tumor, one being enriched for HR and/or HER2 expression from tumors cells and another area enriched for HR− tumors cells (i.e., intratumor heterogeneity). Although some of the cases evaluated here from publicly available data might be explained by this possibility, we believe it is unlikely that two different subtypes co-exist in the same tumor enough to explain this discordance rate. In fact, we have previously reported that the intraclass correlation of two arrays performed on two different pieces of the same primary tumor is ∼0.90 [13]. In addition, data from three large clinical trials where both pathology-based assays and the PAM50 qRT-PCR-based subtype predictor were performed from the same FFPE tumor block in a centralized laboratory suggest that basal-like tumors can be HR+ and that TN tumors can be luminal A, luminal B, or HER2E [9].
Another possibility regarding the discrepancy between gene expression and IHC-based assays is that gene expression measures a large number of related genes, compared with the three individual pathology-based biomarkers that define TN disease. Thus, multigene expression data using tens to hundreds of genes might better capture the true biological profile of a given tumor versus three or four individual biomarkers [38]. For example, a TN tumor that has low levels of ESR1 and PGR, and consequently is ER− and PR− by IHC, might be identified as luminal due to the high expression of other luminal-related genes (i.e., AR, GATA3, and/or FOXA1) and the low expression of basal- and proliferation-related genes. Another example comes from the identification of HER2E/TN tumors that do not amplify/overexpress HER2/ERBB2, some of which might be driven by high EGFR.
Beyond the four main tumor intrinsic subtypes of breast cancer, we have recently identified another subtype called claudin-low [10, 39], which is characterized by the low expression of tight-junctions related genes (claudin 3, 4, 7) and high expression of mesenchymal and stem cell-like biological processes. The majority of claudin-low tumors were found to be either basal-like or normal-like by PAM50, and most showed a TN phenotype. In addition, claudin-low tumors were associated with metaplastic and medullary histological differentiation, and lymphocytic infiltration was found in 37% of cases. Since its identification, many groups have further characterized the claudin-low subtype in human tumors and preclinical models [40–47]. However, its real frequency and clinical relevance are still under investigation.
Lehmann et al. [11] reported the identification of up to six subtypes within TN disease. Here, we have shown that these entities largely overlap with the PAM50 and claudin-low subtypes. However, it is important to note that two of the four main gene clusters used to identify the Lehmann et al. entities are tracking biological processes most likely coming from the microenvironment (i.e., coming from fibroblasts and immune cells) and not from the actual tumor cells. Concordant with this, the two in vitro tumor cell lines identified by Lehmann et al. as immunomodulatory-like (HCC1187 and DU4475) did not show expression of the genes whose high expression defines the immunomodulatory tumor subtype (Fig. 7C). In addition, despite the identification of six subtypes of TN disease in human tumors, the classification ultimately used by Lehmann et al. for classifying the preclinical models of TN breast cancer was based on three main groups (mesenchymal, basal-like, and LAR) that showed different responses to cytotoxic and targeted therapies. This three subtype classification is very concordant with the three main groups previously identified by our group (claudin-low, basal-like and luminal/HER2E), and others based upon cell lines alone (basal B, basal A, and luminal/HER2+) [48–50]; thus multiple groups and multiple methods have all arrived at these same three basic subtypes present within TN disease. The microenvironment clearly plays a critical role in prognosis [51, 52] and treatment response [53]. However, classification of tumors based on nontumor features (e.g., the presence or absence of lymphocytes) should be considered separately from classifications based upon tumor cell features, as microenvironmental features can and do span tumor-based subtypes.
Based upon all of these data, and when discussing TN disease, we propose that TN breast cancers identified as luminal or HER2E should be considered as separate entities because they show a different biology (and mutation spectrum) versus basal-like and claudin-low tumors. In fact, TN luminal and HER2E are almost undistinguishable, in general terms, from non-TN luminal and HER2E that are typically ER+ or HER2+. However, whether these TN tumors that are non-basal-like might benefit from endocrine, anti-HER2 and/or anti-EGFR therapies, and/or PI3K inhibitors, will need further evaluation in the clinical research setting (Fig. 8). For example, the NSABP-B47 trial (NCT01275677) is evaluating the value of adding adjuvant trastuzumab to chemotherapy in patients with HER2-normal tumors (i.e., those with HER2 IHC 1+ or 2+ tumors without evidence of HER2 gene amplification), which will include patients with TN breast cancer. The rationale of this study is based on retrospective data from the NSABP-B-31 trial, in which approximately 10% of the patients tested negative for HER2 positivity when centrally reviewed but experienced the same benefit from adjuvant trastuzumab as women whose tumors were HER2+ [54]. Another example is the recently reported BEATRICE trial [55] that evaluated the addition of adjuvant bevacizumab during and after chemotherapy in 2,591 triple-negative breast cancers, but which failed to show an improved disease-free survival (DFS) rate. However, a tendency for improved DFS in the bevacizumab arm was noted (hazard ratio = 0.87, 95% CI: 0.72–1.07), suggesting that a subset of patients, likely within the basal-like subtype, might benefit from this drug.
Figure 8.

Proposed algorithm of stratification of triple-negative tumors.
Abbreviations: EGFR, epidermal growth factor receptor; PARP, poly (ADP-ribose) polymerase.
Our findings have very important implications for clinical trials focused on TN breast cancers. For example, clinical trials focused on TN tumors could be powered to detect differences in terms of response or survival between basal-like and non-basal-like disease. However, given the low frequency of TN/non-basal-like tumors (∼25% of TN disease that contains at least two expression subtypes), it is highly unlikely that any trial will be powered to see effects within these minor frequency TN subtypes. Therefore, trials may wish to be powered to see treatment effects within all TN tumors and within the TN/basal-like subset.
Moreover, future studies focusing on TN/basal-like disease should try to identify new biomarkers within this group using different data types, such as gene expression, DNA mutations, DNA copy number, methylation profiles, and protein expression, either alone or in combination. For example, Silver et al. [56] identified a gene signature of the E2F3-related transcription factor that was associated with response to neoadjuvant cisplatin in TN tumors, all of which had a basal-like gene expression profile. Lastly, it is likely that the immune-cell difference seen in the Lehman et al. study [11] is important both clinically and biologically, as others have also shown that the presence of CD8+ T-cells portents a better outcome within patients with TN disease [57, 58]. With the advancement of immune-targeted therapies, such as inhibitors of PD-1/PDL-1 [59], and the presence of immune infiltrates in many basal-like and claudin-low tumors, it seems like TN disease, and especially TN/basal-like disease, may be a logical place to first test these new therapies for patients with breast cancer.
To conclude, TN tumors are a heterogeneous disease entity and further subclassification is needed. Fortunately, most classification methods have identified three or four disease subtypes within TN disease, with the basal-like subtype being undoubtedly the most frequently observed (∼75%). Molecular tools, such as gene expression and DNA sequencing, can help stratify TN tumors, as well as HR+ tumors, into more biologically homogenous groups. Future studies are warranted to determine the potential clinical utility of the identification of these biological subtypes found within TN breast cancers.
See www.TheOncologist.com for supplemental material available online.
This article is available for continuing medical education credit at CME.TheOncologist.com.
Supplementary Material
Acknowledgments
This work was supported by the National Cancer Institute (P50-CA58223–09A1), the National Institutes of Health (RO1-CA138255), the Breast Cancer Research Foundation, and the Sociedad Española de Oncología Médica.
Author Contributions
Conception/Design: Aleix Prat, Barbara Adamo, Maggie C.U. Cheang, Carey K. Anders, Lisa A. Carey, Charles M. Perou
Provision of study material or patients: Aleix Prat, Barbara Adamo, Maggie C.U. Cheang, Carey K. Anders, Lisa A. Carey, Charles M. Perou
Collection and/or assembly of data: Aleix Prat, Barbara Adamo, Maggie C.U. Cheang, Carey K. Anders, Lisa A. Carey, Charles M. Perou
Data analysis and interpretation: Aleix Prat, Barbara Adamo, Maggie C.U. Cheang, Carey K. Anders, Lisa A. Carey, Charles M. Perou
Manuscript writing: Aleix Prat, Barbara Adamo, Maggie C.U. Cheang, Carey K. Anders, Lisa A. Carey, Charles M. Perou
Final approval of manuscript: Aleix Prat, Barbara Adamo, Maggie C.U. Cheang, Carey K. Anders, Lisa A. Carey, Charles M. Perou
Disclosures
Aleix Prat: Nanostring Technologies (C/A); Maggie C.U. Cheang: PAM50 classifier (IP); Charles M. Perou: University Genomics, Bioclassifier (E); PAM50 assay (IP); University Genomics, Bioclassifier (OI). The other authors indicated no financial relationships.
Section Editors: Gabriel Hortobágyi: Antigen Express, Galena Biopharma, Novartis, Rockpointe (C/A); Novartis (RF); Taivex, (O); founder and member of the board of directors for Citizen's Oncology Foundation; Kathleen Pritchard: Novartis, Roche, AstraZeneca, Pfizer, Abraxis, Boehringer-Ingelheim, GlaxoSmithKline, Sanofi, Ortho-Biotech, YM Biosciences, Amgen, Bristol-Myers Squibb, Bayer Schering Pharma (C/A), (H)
Reviewer “A”: None
Reviewer “B”: None
Reviewer “C”: Novartis, EMD, Merck, Celgene, Bristol-Myers Squibb, GlaxoSmithKline, Bayer (RF)
Reviewer “D”: None
C/A: Consulting/advisory relationship; RF: Research funding; E: Employment; H: Honoraria received; OI: Ownership interests; IP: Intellectual property rights/inventor/patent holder; SAB: scientific advisory board
References
- 1.Perou CM, Sorlie T, Eisen MB, et al. Molecular portraits of human breast tumours. Nature. 2000;406:747–752. doi: 10.1038/35021093. [DOI] [PubMed] [Google Scholar]
- 2.Prat A, Perou CM. Deconstructing the molecular portraits of breast cancer. Mol Oncol. 2011;5:5–23. doi: 10.1016/j.molonc.2010.11.003. [DOI] [PMC free article] [PubMed] [Google Scholar]
- 3.Prat A, Ellis MJ, Perou CM. Practical implications of gene-expression-based assays for breast oncologists. Nat Rev Clin Oncol. 2012;9:48–57. doi: 10.1038/nrclinonc.2011.178. [DOI] [PMC free article] [PubMed] [Google Scholar]
- 4.Sorlie T, Perou C, Tibshirani R, et al. Gene expression patterns of breast carcinomas distinguish tumor subclasses with clinical implications. Proc Natl Acad Sci U S A. 2001;98:10869–10874. doi: 10.1073/pnas.191367098. [DOI] [PMC free article] [PubMed] [Google Scholar]
- 5.Nielsen TO, Parker JS, Leung S, et al. A comparison of PAM50 intrinsic subtyping with immunohistochemistry and clinical prognostic factors in tamoxifen-treated estrogen receptor-positive breast cancer. Clin Cancer Res. 2010;16:5222–5232. doi: 10.1158/1078-0432.CCR-10-1282. [DOI] [PMC free article] [PubMed] [Google Scholar]
- 6.Martín M, Rodríguez-Lescure Á, Ruiz A, et al. Randomized phase 3 trial of fluorouracil, epirubicin, and cyclophosphamide alone or followed by Paclitaxel for early breast cancer. J Natl Cancer Inst. 2008;100:805–814. doi: 10.1093/jnci/djn151. [DOI] [PubMed] [Google Scholar]
- 7.Bramwell VHC, Pritchard KI, Tu D, et al. A randomized placebo-controlled study of tamoxifen after adjuvant chemotherapy in premenopausal women with early breast cancer (National Cancer Institute of Canada-Clinical Trials Group Trial, MA.12) Ann of Oncol. 2010;21:283–290. doi: 10.1093/annonc/mdp326. [DOI] [PMC free article] [PubMed] [Google Scholar]
- 8.Levine MN, Pritchard KI, Bramwell VHC, et al. Randomized trial comparing cyclophosphamide, epirubicin, and fluorouracil with cyclophosphamide, methotrexate, and fluorouracil in premenopausal women with node-positive breast cancer: update of National Cancer Institute of Canada Clinical Trials Group Trial MA5. J Clin Oncol. 2005;23:5166–5170. doi: 10.1200/JCO.2005.09.423. [DOI] [PubMed] [Google Scholar]
- 9.Cheang M, Martin M, Nielsen T, et al. Quantitative hormone receptors, triple-negative breast cancer (TNBC), and molecular subtypes: A collaborative effort of the BIG-NCI NABCG. Proc Am Soc Clin Oncol. 2012:a1008. [Google Scholar]
- 10.Prat A, Parker J, Karginova O, et al. Phenotypic and molecular characterization of the claudin-low intrinsic subtype of breast cancer. Breast Cancer Res. 2010;12:R68. doi: 10.1186/bcr2635. [DOI] [PMC free article] [PubMed] [Google Scholar]
- 11.Lehmann BD, Bauer JA, Chen X, et al. Identification of human triple-negative breast cancer subtypes and preclinical models for selection of targeted therapies. J Clin Invest. 2012;121:2750–2767. doi: 10.1172/JCI45014. [DOI] [PMC free article] [PubMed] [Google Scholar]
- 12.Bos PD, Zhang XHF, Nadal C, et al. Genes that mediate breast cancer metastasis to the brain. Nature. 2009;459:1005–1009. doi: 10.1038/nature08021. [DOI] [PMC free article] [PubMed] [Google Scholar]
- 13.Harrell J, Prat A, Parker J, et al. Genomic analysis identifies unique signatures predictive of brain, lung, and liver relapse. Breast Cancer Res Treat. 2012;132:523–535. doi: 10.1007/s10549-011-1619-7. [DOI] [PMC free article] [PubMed] [Google Scholar]
- 14.Wang Y, Klijn JG, Zhang Y, et al. Gene-expression profiles to predict distant metastasis of lymph-node-negative primary breast cancer. Lancet. 2005;365:671–679. doi: 10.1016/S0140-6736(05)17947-1. [DOI] [PubMed] [Google Scholar]
- 15.Hatzis C, Pusztai L, Valero V, et al. A genomic predictor of response and survival following taxane-anthracycline chemotherapy for invasive breast cancer. JAMA. 2011;305:1873–1881. doi: 10.1001/jama.2011.593. [DOI] [PMC free article] [PubMed] [Google Scholar]
- 16.Popovici V, Chen W, Gallas B, et al. Effect of training-sample size and classification difficulty on the accuracy of genomic predictors. Breast Cancer Res. 12:R5. doi: 10.1186/bcr2468. [DOI] [PMC free article] [PubMed] [Google Scholar]
- 17.Tabchy A, Valero V, Vidaurre T, et al. Evaluation of a 30-Gene paclitaxel, fluorouracil, doxorubicin, and cyclophosphamide chemotherapy response predictor in a multicenter randomized trial in breast cancer. Clin Cancer Res. 2010;16:5351–5361. doi: 10.1158/1078-0432.CCR-10-1265. [DOI] [PMC free article] [PubMed] [Google Scholar]
- 18.Iwamoto T, Bianchini G, Booser D, et al. Gene pathways associated with prognosis and chemotherapy sensitivity in molecular subtypes of breast cancer. J Natl Cancer Inst. 2011;103:264–272. doi: 10.1093/jnci/djq524. [DOI] [PubMed] [Google Scholar]
- 19.Hess KR, Anderson K, Symmans WF, et al. Pharmacogenomic predictor of sensitivity to preoperative chemotherapy with paclitaxel and fluorouracil, doxorubicin, and cyclophosphamide in breast cancer. J Clin Oncol. 2006;24:4236–4244. doi: 10.1200/JCO.2006.05.6861. [DOI] [PubMed] [Google Scholar]
- 20.Dedeurwaerder S, Desmedt C, Calonne E, et al. DNA methylation profiling reveals a predominant immune component in breast cancers. EMBO Molecular Medicine. 2011;3:726–741. doi: 10.1002/emmm.201100801. [DOI] [PMC free article] [PubMed] [Google Scholar]
- 21.International Genomics Consortium. expO offers free access to clinically annotated tumor data. [Accessed January 18, 2013]. Available at https://expo.intgen.org/geo/
- 22.Minn AJ, Gupta GP, Siegel PM, et al. Genes that mediate breast cancer metastasis to lung. Nature. 2005;436:518–524. doi: 10.1038/nature03799. [DOI] [PMC free article] [PubMed] [Google Scholar]
- 23.Li Y, Zou L, Li Q, et al. Amplification of LAPTM4B and YWHAZ contributes to chemotherapy resistance and recurrence of breast cancer. Nat Med. 2010;16:214–218. doi: 10.1038/nm.2090. [DOI] [PMC free article] [PubMed] [Google Scholar]
- 24.Parker JS, Mullins M, Cheang MCU, et al. Supervised risk predictor of breast cancer based on intrinsic subtypes. J Clin Oncol. 2009;27:1160–1167. doi: 10.1200/JCO.2008.18.1370. [DOI] [PMC free article] [PubMed] [Google Scholar]
- 25.Network TCGA. Comprehensive molecular portraits of human breast tumors. Nature. 2012;490:61–70. doi: 10.1038/nature11412. [DOI] [PMC free article] [PubMed] [Google Scholar]
- 26.Ding L, Ellis MJ, Li S, et al. Genome remodelling in a basal-like breast cancer metastasis and xenograft. Nature. 2010;464:999–1005. doi: 10.1038/nature08989. [DOI] [PMC free article] [PubMed] [Google Scholar]
- 27.Eisen MB, Spellman PT, Brown PO, et al. Cluster analysis and display of genome-wide expression patterns. Proc Natl Acad Sci U S A. 1998;95:14863–14868. doi: 10.1073/pnas.95.25.14863. [DOI] [PMC free article] [PubMed] [Google Scholar]
- 28.Dennis G, Sherman BT, Hosack DA, et al. DAVID: Database for annotation, visualization, and Integrated discovery. Genome Biol. 2003;4:R60. [PubMed] [Google Scholar]
- 29.Tusher VG, Tibshirani R, Chu G. Significance analysis of microarrays applied to the ionizing radiation response. Proc Natl Acad Sci U S A. 2001;98:5116–5121. doi: 10.1073/pnas.091062498. [DOI] [PMC free article] [PubMed] [Google Scholar]
- 30.Anders CK, Fan C, Parker JS, et al. Breast carcinomas arising at a young age: Unique biology or a surrogate for aggressive intrinsic subtypes? J Clin Oncol. 2011;29:e18–e20. doi: 10.1200/JCO.2010.28.9199. [DOI] [PMC free article] [PubMed] [Google Scholar]
- 31.Fedele CG, Ooms LM, Ho M, et al. Inositol polyphosphate 4-phosphatase II regulates PI3K/Akt signaling and is lost in human basal-like breast cancers. Proc Natl Acad Sci U S A. 2010;107:22231–22236. doi: 10.1073/pnas.1015245107. [DOI] [PMC free article] [PubMed] [Google Scholar]
- 32.Gewinner C, Wang ZC, Richardson A, et al. Evidence that inositol polyphosphate 4-phosphatase type II is a tumor suppressor that inhibits PI3K signaling. Cancer Cell. 2009;16:115–125. doi: 10.1016/j.ccr.2009.06.006. [DOI] [PMC free article] [PubMed] [Google Scholar]
- 33.Niemeier LA, Dabbs DJ, Beriwal S, et al. Androgen receptor in breast cancer: Expression in estrogen receptor-positive tumors and in estrogen receptor-negative tumors with apocrine differentiation. Mod Pathol. 2009;23:205–212. doi: 10.1038/modpathol.2009.159. [DOI] [PubMed] [Google Scholar]
- 34.Doane AS, Danso M, Lal P, et al. An estrogen receptor-negative breast cancer subset characterized by a hormonally regulated transcriptional program and response to androgen. Oncogene. 2006;25:3994–4008. doi: 10.1038/sj.onc.1209415. [DOI] [PubMed] [Google Scholar]
- 35.Farmer P, Bonnefoi H, Becette V, et al. Identification of molecular apocrine breast tumours by microarray analysis. Oncogene. 2005;24:4660–4671. doi: 10.1038/sj.onc.1208561. [DOI] [PubMed] [Google Scholar]
- 36.Gucalp A, Tolaney SM, Isakoff SJ, et al. TBCRC 011: Targeting the androgen receptor (AR) for the treatment of AR+/ER−/PR− metastatic breast cancer (MBC) ASCO Meeting Abstracts. 2011;29:TPS122. [Google Scholar]
- 37.Hammond MEH, Hayes DF, Dowsett M, et al. American Society of Clinical Oncology/College of American Pathologists guideline recommendations for immunohistochemical testing of estrogen and progesterone receptors in breast cancer. J Clin Oncol. 2010;28:2784–2795. doi: 10.1200/JCO.2009.25.6529. [DOI] [PMC free article] [PubMed] [Google Scholar]
- 38.Prat A, Parker J, Fan C, et al. PAM50 assay and the three-gene model for identifying the major and clinically relevant molecular subtypes of breast cancer. Breast Cancer Res Treat. 2012;135:301–306. doi: 10.1007/s10549-012-2143-0. [DOI] [PMC free article] [PubMed] [Google Scholar]
- 39.Herschkowitz JI, Simin K, Weigman VJ, et al. Identification of conserved gene expression features between murine mammary carcinoma models and human breast tumors. Genome Biol. 2007;8:R76. doi: 10.1186/gb-2007-8-5-r76. [DOI] [PMC free article] [PubMed] [Google Scholar]
- 40.Katz E, Dubois-Marshall S, Sims AH, et al. An in vitro model that recapitulates the epithelial to mesenchymal transition (EMT) in human breast cancer. PLoS ONE. 2011;6:e17083. doi: 10.1371/journal.pone.0017083. [DOI] [PMC free article] [PubMed] [Google Scholar]
- 41.Walia V, Yu Y, Cao D, et al. Loss of breast epithelial marker hCLCA2 promotes epithelial-to-mesenchymal transition and indicates higher risk of metastasis. Oncogene. 2012;31:2237–2246. doi: 10.1038/onc.2011.392. [DOI] [PMC free article] [PubMed] [Google Scholar]
- 42.Raviraj V, Zhang H, Chien H-Y, et al. Dormant but migratory tumour cells in desmoplastic stroma of invasive ductal carcinomas. Clin Exp Metastasis. 2012;29:273–292. doi: 10.1007/s10585-011-9450-4. [DOI] [PubMed] [Google Scholar]
- 43.Hollern DP, Yuwanita I, Andrechek ER. A mouse model with T58A mutations in Myc reduces the dependence on KRas mutations and has similarities to claudin-low human breast cancer. Oncogene. 2012 doi: 10.1038/onc.2012.142. [Epub ahead of print] [DOI] [PubMed] [Google Scholar]
- 44.Xu K, Usary J, Kousis Philaretos C, et al. Lunatic fringe deficiency cooperates with the Met/Caveolin gene amplicon to induce basal-like breast cancer. Cancer Cell. 21:626–641. doi: 10.1016/j.ccr.2012.03.041. [DOI] [PMC free article] [PubMed] [Google Scholar]
- 45.Gerhard R, Ricardo S, Albergaria A, et al. Immunohistochemical features of claudin-low intrinsic subtype in metaplastic breast carcinomas. Breast. 2012;21:354–360. doi: 10.1016/j.breast.2012.03.001. [DOI] [PubMed] [Google Scholar]
- 46.Beltran A, Rivenbark A, Richardson B, et al. Generation of tumor-initiating cells by exogenous delivery of OCT4 transcription factor. Breast Cancer Res. 2012;13:R94. doi: 10.1186/bcr3019. [DOI] [PMC free article] [PubMed] [Google Scholar]
- 47.Keller PJ, Arendt LM, Skibinski A, et al. Defining the cellular precursors to human breast cancer. Proc Natl Acad Sci. 2012;109:2772–2777. doi: 10.1073/pnas.1017626108. [DOI] [PMC free article] [PubMed] [Google Scholar]
- 48.Neve R, Chin K, Fridlyand J, et al. A collection of breast cancer cell lines for the study of functionally distinct cancer subtypes. Cancer Cell. 2006;10:515–527. doi: 10.1016/j.ccr.2006.10.008. [DOI] [PMC free article] [PubMed] [Google Scholar]
- 49.Kao J, Salari K, Bocanegra M, et al. Molecular profiling of breast cancer cell lines defines relevant tumor models and provides a resource for cancer gene discovery. PLoS ONE. 2009;4:e6146. doi: 10.1371/journal.pone.0006146. [DOI] [PMC free article] [PubMed] [Google Scholar]
- 50.Hollestelle A, Nagel J, Smid M, et al. Distinct gene mutation profiles among luminal-type and basal-type breast cancer cell lines. Breast Cancer Res Treat. 2010;121:53–64. doi: 10.1007/s10549-009-0460-8. [DOI] [PubMed] [Google Scholar]
- 51.Rody A, Holtrich U, Pusztai L, et al. T-cell metagene predicts a favourable prognosis in estrogen receptor negative and HER2 positive breast cancers. Breast Cancer Res. 2009;11:R15. doi: 10.1186/bcr2234. [DOI] [PMC free article] [PubMed] [Google Scholar]
- 52.Fan C, Prat A, Parker J, et al. Building prognostic models for breast cancer patients using clinical variables and hundreds of gene expression signatures. BMC Med Genomics. 2011;4:3. doi: 10.1186/1755-8794-4-3. [DOI] [PMC free article] [PubMed] [Google Scholar]
- 53.Place A, Jin Huh S, Polyak K. The microenvironment in breast cancer progression: Biology and implications for treatment. Breast Cancer Res. 2011;13:227. doi: 10.1186/bcr2912. [DOI] [PMC free article] [PubMed] [Google Scholar]
- 54.Paik S, Kim C, Wolmark N. HER2 status and benefit from adjuvant trastuzumab in breast cancer. N Engl J Med. 2008;358:1409–1411. doi: 10.1056/NEJMc0801440. [DOI] [PubMed] [Google Scholar]
- 55.Cameron D, Brown J, Dent R, et al. Primary results of BEATRICE, a randomized phase III trial evaluating adjuvant bevacizumab-containing therapy in triple-negative breast cancer. Paper presented at: Cancer Therapy and Research Center–American Association for Cancer Research San Antonio Breast Cancer Symposium; December 4–8, 2012; San Antonio, TX. [Google Scholar]
- 56.Silver DP, Richardson AL, Eklund AC, et al. Efficacy of neoadjuvant cisplatin in triple-negative breast cancer. J Clin Oncol. 2010;28:1145–1153. doi: 10.1200/JCO.2009.22.4725. [DOI] [PMC free article] [PubMed] [Google Scholar]
- 57.Mahmoud SMA, Paish EC, Powe DG, et al. Tumor-infiltrating CD8+ lymphocytes predict clinical outcome in breast cancer. J Clin Oncol. 2011;29:1949–1955. doi: 10.1200/JCO.2010.30.5037. [DOI] [PubMed] [Google Scholar]
- 58.Liu S, Lachapelle J, Leung S, et al. CD8+ lymphocyte infiltration is an independent favorable prognostic indicator in basal-like breast cancer. Breast Cancer Res. 2012;14:R48. doi: 10.1186/bcr3148. [DOI] [PMC free article] [PubMed] [Google Scholar]
- 59.Brahmer JR, Tykodi SS, Chow LQM, et al. Safety and activity of anti-PD-L1 antibody in patients with advanced cancer. N Engl J Med. 2012;366:2455–2465. doi: 10.1056/NEJMoa1200694. [DOI] [PMC free article] [PubMed] [Google Scholar]
Associated Data
This section collects any data citations, data availability statements, or supplementary materials included in this article.