

Background: A similar phototransduction cascade confers different light sensitivity in rods and cones.
Results: Rod and cone Gαt are similar with respect to coupling to visual pigments and light-induced translocation.
Conclusion: Rod and cone Gαt are equivalent functionally.
Significance: Reduced sensitivity in cones does not result from reduced coupling efficiency between the GPCR and G protein or a lower concentration of G protein in cones.
Keywords: G Protein-coupled Receptors (GPCR), G Proteins, Photoreceptors, Phototransduction, Retina, Transducin, Visual Pigments
Abstract
The signaling cascades mediated by G protein-coupled receptors (GPCRs) exhibit a wide spectrum of spatial and temporal response properties to fulfill diverse physiological demands. However, the mechanisms that shape the signaling response of the GPCR are not well understood. In this study, we replaced cone transducin α (cTα) for rod transducin α (rTα) in rod photoreceptors of transgenic mice, which also express S opsin, to evaluate the role of Gα subtype on signal amplification from different GPCRs in the same cell; such analysis may explain functional differences between retinal rod and cone photoreceptors. We showed that ectopically expressed cTα 1) forms a heterotrimeric complex with rod Gβ1γ1, 2) substitutes equally for rTα in generating photoresponses initiated by either rhodopsin or S-cone opsin, and 3) exhibited similar light-activated translocation as endogenous rTα in rods and endogenous cTα in cones. Thus, rTα and cTα appear functionally interchangeable. Interestingly, light sensitivity appeared to correlate with the concentration of cTα when expression is reduced below 35% of normal. However, quantification of endogenous cTα concentration in cones showed a higher level to rTα in rods. Thus, reduced sensitivity in cones cannot be explained by reduced coupling efficiency between the GPCR and G protein or a lower concentration of G protein in cones versus rods.
Introduction
Two photoreceptor cell types, rods and cones, and the retinal circuitry that carries their signals to higher visual centers collectively allow our vision to report luminance information over the course of night and day. Rods are exquisitely sensitive and can detect single photons (1, 2), whereas cones are ∼100-fold less sensitive and do not saturate under bright light (3, 4). Furthermore, the kinetics of the photoresponse in cones is 5-fold faster than rods, allowing increased temporal resolution (5). These two types of photoreceptors utilize a similar G protein signaling cascade for phototransduction, but the differences in the cascades that produce these functional distinctions are just beginning to be understood. Some components of the cascades are identical in both cell types, whereas others, including the visual pigments and G proteins, have distinct rod and cone isoforms. Thus, functional differences between rods and cones may arise from 1) different levels of expression of transduction components or 2) different functional properties of their respective transduction proteins. For example, a higher expression level of rhodopsin kinase (6, 7), or RGS9-1 (8), has been proposed to allow for faster recovery of the photoresponse in cones. Higher guanylyl cyclase activity and a faster cGMP turnover in cones may also contribute to speeded responses in cones compared with rods (9). Differences in rod/cone sensitivity likely arise from multiple mechanisms, and a full understanding of what sets the differences requires approaches to quantify the contribution of individual phototransduction components.
Previous biochemical (7, 10) and physiological (11–13) evidence suggest that a lower amplification gain in cones may be a primary contributor to lower sensitivity. To test whether this alteration arises from cell-type specific transducin α (Tα),2 we expressed mouse cTα (GNAT2) in rTα (GNAT1) knock-out mice. By crossing these mice with those whose rods also express the S-cone pigment (14), we also compared the coupling efficiencies between rod and cone visual pigments with cTα and evaluated the influence of Tα concentration on visual sensitivity. We obtained two lines of mice that expressed cTα at 15 and 35% of endogenous rTα in rods. Suction electrode recordings showed that these rods were less sensitive to light. However, the decreased sensitivity correlated with the reduced Tα concentration. Normalized photoresponses from cTα rods displayed similar rising and recovery phases. Because lowered Tα concentration leads to lowered sensitivity, we investigated whether endogenous cones express a lower concentration of cTα. To the contrary, we found that the cTα concentration in cones is higher than rTα concentration in rods. We also provide evidence that rTα and cTα are indistinguishable biochemically, as evidenced by their similar activation by both rod and S-cone pigments. Lastly, we observed that endogenous cTα in cones translocated away from the outer segment in response to light, a property that was recapitulated by ectopically expressed cTα in rods.
EXPERIMENTAL PROCEDURES
All experimental procedures involving the use of mice were performed in compliance with regulations set forth by the ARVO Statement for the Use of Animals in Ophthalmic and Visual Research, with protocols approved by the University of Southern California's Institutional Animal Care and Use Committee.
Generation of cTα Transgenic Mice
The pBKS-cTα transgenic construct contained the ∼1.3-kb mouse cone transducin α subunit cDNA flanked by the 4.4-kb fragment of mouse rod opsin promoter (15) at the 5′ end and a 0.6-kb polyadenylation signal from the mouse protamine gene at the 3′ end that also provided a splice site (see Fig. 1A). The 1.3-kb cTα cDNA coding sequence was synthesized by reverse transcription-PCR with primers cTα_F (CCGCTCGAGTCTCAAGGCAAGGTAGGC) and cTα_R (GAAGATCTCTATCACCAACAGGATGGG) using mRNA prepared from mouse retinas. The pBKS-cTα plasmid was purified by CsCl gradient and digested with XhoI and XbaI to yield the 6.3-kb insert fragment, which was then purified by QIAEXII gel extraction kit (Qiagen, Hilden, Germany) and Elutip-d column (Schleicher and Schuell Bioscience, Keene, NH). The DNA fragment was microinjected into fertilized eggs from C57BI/6J and DBA/2J F1 strains according to standard procedures. The cTα transgenic mice were identified by PCR of DNA obtained from tail biopsies. Transgenic mice that expressed cTα were generated by G. Shi and the Norris Transgenic Core Facility. To increase cTα dosage, the cTα transgene was bred to homozygosity (cTα++). Both cTα+ and cTα++ transgenic mice were subsequently crossed with rTα knock-out mice (GNAT1−/−) (16) to produce cTα+rTα−/− and cTα+/+rTα−/− mice, respectively. Rod transducin α knock-out mice were provided by J. Lem. Hereafter, these lines are referred to as cTα+ and cTα++ mice to simplify the nomenclature. In addition, the cTα+ transgenic mice were crossed with S-opsinrho−/− mice, which expresses cone short wave S-opsin in mouse rods in the rod opsin knock-out background (14) to obtain cTα+/S-opsin+rho+/- mice.
FIGURE 1.

Characterization of cTα transgene expression. A, transgene construct to express cTα in rods. B, Western blot analysis of serial dilutions of retinal homogenates. Cone Tα and rTα were recognized by SC390 and Tα1A antibodies, respectively. Actin was used as loading control. C, relative quantities of both cTα and rTα from Western blots (n = 7) utilizing TF15 antibody, which recognizes a conserved epitope on cTα and rTα. The relative expression levels from different genotypes were normalized to retinal extracts from C57 mice (WT). D, Western analyses of Gβ1, Gβ5, and RGS9–1 from WT, rTα−/−, and cTα retinas. The Gβ5 antibody recognized both the long and the short isoform of the protein. No changes in these transduction proteins were detected as a consequence of cTα expression. E, cone Tα associates with rod Gβ1γ1. Pertussis toxin catalyzed heterotrimeric G-protein dependent ADP-ribosylation of wild-type rTα and transgenic cTα. ADP-ribosylation was inhibited by light or in the presence of AlF4− ions for both WT and cTα samples.
Immunoblot Analysis and Quantification of Transgene Expression
Each isolated retina was homogenized in 200 μl of buffer (80 mm Tris, pH 8.0, 4 mm MgCl2 and protease inhibitor mixture (Roche Diagnostics, Indianapolis, IN). The samples were incubated with the addition of 30 units of DNase I (Roche Diagnostics) at room temperature for 30 min. After adding the SDS-loading buffer, the indicated amount of proteins were loaded onto a 12% Bis-Tris SDS-PAGE gel (Invitrogen), transferred onto nitrocellulose membranes (Schleicher and Schuell Bioscience), and probed with the following primary antibodies: anti-cTα (SC390) (Santa Cruz Biotechnology, Santa Cruz, CA), anti-rTα (Tα1A, obtained from M. Simon, Caltech), anti-Tα common region, KENLKDCGLF (Meridian Life Science, Inc.) anti-Gβ5 (17), anti-RGS9–1 (18), and anti-β actin (Millipore). The secondary antibodies of IRDye 680 goat anti-rabbit and IRDye 800 goat anti-mouse (LI-COR Biosciences, Lincoln, NE) were applied accordingly. The proteins were visualized and quantified using Odyssey Infrared Imaging System (LI-COR Biosciences).
For quantitation of endogenous rTα, each C57BL/7 retina was homogenized in 120 μl buffer (50 mm Tris, pH 8.0, 1 mm EDTA, 0.1% dodecyl maltoside and protease inhibitor mix), from this 2 μl was further diluted to 80 μl containing the indicated amount of chi8 and either 10 μl or 15 μl of the samples were loaded on SDS-PAGE, blotted and probed with an anti- GTα common region antibody (KENLKDCGLF, Meridian Life Science, Inc.) as described above. To quantify endogenous cTα, two retinas from GNAT1−/− mouse were combined and homogenized in 120 μl buffer. Indicated amount of chi8 was added to 5 μl of this homogenate and separated by SDS-PAGE. The gels were blotted and probed with an antibody that targets a highly divergent sequence in cTα (sc-390, Santa Cruz Biotechnology). Signals were visualized and quantified as described in the previous section. The values were plotted and fitted using Excel software.
Biochemical Analysis of ADP-ribosylation in Mouse ROS Membranes
Mice were dark-adapted overnight and rod outer segment (ROS) membranes were isolated under dim red light as described previously (19). Rhodopsin (Rho) concentrations were determined using the difference in absorbance at 500 nm before and after photobleaching. The procedures of pertussis toxin catalyzed ADP-ribosylation was similar to the method described by Kerov et al. (20). ROS membranes containing 1 μm Rho per sample were used. Pertussis toxin was preactivated by 15 min incubation at 30 °C with 100 mm dithiothreitol and 0.2% SDS. ROS samples were then incubated with 3 μg/ml of pertussis toxin and 5 μm [32P]nicotinamide adenine dinucleotide ([32P]NAD) for 1 h at 25 °C in the darkness or under light exposure. Meanwhile, 30 μm AlCl3 and 10 mm NaF were added to half of the samples of each condition. The reactions were stopped by SDS-loading buffer and analyzed by 12% SDS-PAGE gels followed by autoradiography of dried gels.
Light-dependent Translocation and Light Calibration
Mice were dark-adapted for at least 12 h before light exposure. For the dark condition, mice were euthanized, and the eyes were enucleated and fixed with 4% paraformaldehyde under infrared illumination. To see light-dependent translocation of Tα in wild-type, rTα−/−, and cTα++ mice, their eyes were treated with 0.5% tropicamide and 2.5% phenylephrine hydrochloride to dilate the pupils prior to exposure to diffuse white light (2000 lux) for 1 h. For calibrated light exposure, mice were anesthetized and immobilized, and one of the eyes was dilated and exposed to light for 30 min. The light source was a 100-watt quartz tungsten halogen lamp connected to a fiber optic guide (Oriel Instruments, Stratford, CT) and a narrow bandwidth interference filter (10 nm FWHM, Oriel Instruments) with peak center wavelength at 500 nm; light intensity was adjusted using neutral density filters and measured with a calibrated photodiode (United Detector Technology Sensors, Inc., Hawthorne, CA). The delivered photon flux was calculated using the following equation,
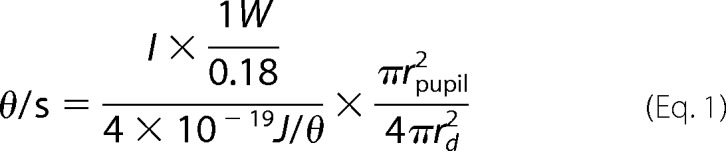 |
where θ is the number of photons, the current (I) was measured from the calibrated photodiode (Table 1), rpupil is the radius of the pupil of the mouse, which is ∼1 mm, and rd is the distance from the light source to the mouse pupil (5 mm). The bleached rhodopsin (R*) can be further estimated by the following equation,
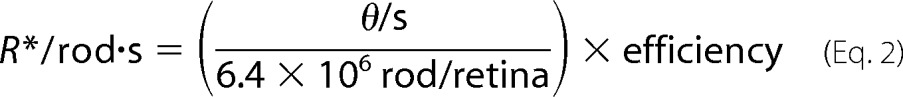 |
where one mouse retina is estimated to contain ∼6.4 × 10⁶ rod cells (21), and the quantum efficiency, or the probability that the adsorption of a photon initiates rhodopsin activation, is 0.67 (22). In this manner, the rate of R*/rod·s was determined for the different neutral density filters, as shown in Table 1.
TABLE 1.
Rate of R*/rod·s determined for neutral density filters
| Neutral density filter | Current | R*/rod·s |
|---|---|---|
| μA | ||
| OD 2.3 | 2.26 | 3.3 × 10⁴ |
| OD 2.6 | 1.18 | 1.7 × 10⁴ |
| OD 2.8 | 0.67 | 9.7 × 10³ |
| OD 3.0 | 0.417 | 6.1 × 10³ |
| OD 3.3 | 0.214 | 3.1 × 10³ |
Immunocytochemistry
The superior pole of the mouse eye was marked by cauterization before enucleation. Cornea and lens were removed, and the remaining eyecups were fixed in 4% paraformaldehyde, infiltrated with 30% sucrose overnight, and embedded in O.C.T. (Tissue-Tek, Sakura Finetech, Torrance, CA) as described previously (23). Ten-μm-thick frozen retinal sections were obtained using a cryostat (Leica, Nussloch, Germany) at −20 °C. Sections were air-dried and treated with 0.1 mg/ml proteinase K (Roche Applied Science). After blocking with PBS containing 1% BSA, 5% normal goat serum, and 0.3% Triton X-100, the sections were incubated with 1:200 dilution of TF15 recognizing a common peptide on both rTα and cTα (Cytosignal, San Diego, CA). Rhodopsin 1D4 antibody (gift from Robert Molday) was biotinylated following manufacturer's protocols (Pierce Biotechnology). Proteins were visualized with FITC or Texas Red-conjugated secondary antibodies at 1:400 dilutions, or Texas Red Avidin D (Vector Laboratories, Burlingame, CA). Images were acquired on an Axioplan2 microscope (Zeiss, Oberkochen, Germany). All images for each section were taken at the same detection gain unless indicated.
Expression and Purification of Recombinant Rod Trα
His6-tagged Gαt/Gαi1 chimeric construct previously characterized for functional activity and solubility in Escherichia coli expression system (24) (chi8, obtained from N. Artemyev) was transformed into E. coli BL21(DE3) and grown in 2× YT media containing 100 μg/ml ampicillin at room temperature up to A600 of 0.5, and induced with 30 μm isopropyl 1-thio-β-d-galactopyranoside for 18 h at 18 °C. The cell pellet was resuspended in 1:20 of the original cell culture volume with a buffer containing 50 mm Tris-HCl, pH 8.0, 50 mm NaCl, 5 mm MgCl2, 50 μm GDP, 0.1 mm phenylmethylsulfonylfluoride (PMSF), and 5 mm β-mercaptoethanol, and then disrupted by sonication. The cell homogenate was centrifuged at 45,000 × g for 1 h at 4 °C. Solid ammonium sulfate was slowly added to the supernatant to a final concentration of 30% with continued stirring at 4 °C for 30 min. After centrifugation at 10,000 × g for 20 min, the pellet was resuspended in 20 mm Tris-HCl, pH 8.0, 450 mm NaCl, 6 m urea, 0.1% Triton X-100, 1 mm β-mercaptoethanol, and 10 mm imidazole. This crude sample was loaded onto a nickel-nitrilotriacetic acid-agarose resin (Invitrogen) column, washed, and eluted with loading buffer containing 100 mm imidazole. The elution fraction was dialyzed against 20 mm Tris-HCl, pH 8.0, 50 mm NaCl, and 0.1 mm PMSF, concentrated using Aquacide II (Calbiochem), and dialyzed again against the same buffer. The sample was then subjected to preparative Tris-glycine SDS-PAGE, and the gels were subsequently stained with SYPRO® Ruby (Invitrogen) in 250 mm KCl, 1 mm DTT. The recombinant chi8 was excised from the gel. The gel slices were minced and homogenized using a Kontes pestle in passive elution buffer (50 mm Tris, pH 7.9, 150 mm NaCl, 0.1% SDS, 1 mm DTT, 0.5 mm EDTA). The sample was dialyzed extensively against 25 mm ammonium bicarbonate and lyophilized. To quantify the amount of chi8, an aliquot was subjected to amino acid analysis in triplicates by the Biopolymer Laboratory at the University of California, Los Angeles.
Electroretinography
The protocol used for electroretinography measurements was similar to those described previously (25). Briefly, 6-week-old mice were dark-adapted overnight. The procedures were carried out under dim red light the following day. Mice were anesthetized with an intraperitoneal injection of 100 mg of ketamine and 10 mg of xylazine per kg of body weight. Pupils were dilated with 0.5% tropicamide (Tropicacyl®, Akorn Co., Buffalo Grove, IL) and 2.5% phenylephrine hydrochloride (Akorn Co.). A drop of GonakTM (2.5% hypromellose ophthalmic solution, Akorn) placed on the cornea facilitated electrical contact with the corneal electrode and kept the eye moist during the recording session. A steel needle placed subcutaneously near the eye served as the reference electrode. The light source was a xenon arc lamp, and 10-ms flashes of light at 500 nm were presented to the eye. A series of neutral density filters were used to control light intensity. Electroretinography signals were amplified by an AC/DC differential amplifier (A-M Systems, Inc., Carlsborg, WA), band pass-filtered at 0.1–1000 Hz, sampled at 2000 Hz, and digitized with a Digidata 1322A using pClamp software (Axon Instruments, Union City, CA).
Single-cell Recordings and Analysis
Light-evoked currents from mouse rod photoreceptors were measured with suction electrodes from finely chopped pieces of retinal tissue under recording conditions that have been described previously (26). Briefly, clusters of cells with the outer segments protruding were targeted and an individual outer segment was drawn gently into a suction electrode containing Ames' media (Sigma-Aldrich) buffered with 10 mm HEPES to pH 7.4. The tissue was bathed with 35–37 °C bicarbonate-buffered Ames' media that was equilibrated with 5% CO2, 95%O2. Families of light-evoked currents were measured following 10 ms flashes from an LED (λmax ∼ 470 nm, FWHM ∼ 30 nm; λmax ∼ 571 nm, FWHM ∼ 10 nm; λmax ∼ 367 nm, FWHM ∼ 10 nm; Optodiode Corp., Newbury Park, CA) or 30-ms flashes from a tungsten-halogen source passed through an interference filter (λmax ∼ 500 nm, FWHM ∼ 15 nm). In experiments where UV light (i.e. λmax ∼ 367 nm) was used to stimulate the preparation, light was delivered to the recording chamber through a quartz fiber optic (Newport Corp., Irvine, CA). Families of responses to flashes of increasing intensity were collected from rods for each of the lines of mice described above. The elementary response of the rod, or the response to a single absorbed photon, was estimated from linear range responses by scaling the average response by a factor proportional to the ratio between the time-dependent variance and the mean (1). Currents were low-pass filtered at 20 Hz with an 8-pole Bessel filter and digitized at 1 kHz.
RESULTS
Expression of cTα in Rod Photoreceptors of Transgenic Mice
Cone transducin α (GNAT2; here referred to as cTα) cDNA was reverse-transcribed from retinal RNA extracted from C57/B6 mice and cloned downstream of the mouse rod opsin promoter (Fig. 1A). Two independent lines were obtained; both showed similar expression level and pattern, and both lines were used interchangeably in this study. The cTα mice were crossed with the rod transducin α (GNAT1; here referred to as rTα) knock-out mice (16) to replace cTα for rTα (Fig. 1B). Western blot of retinal extracts showed a noticeable over-expression of cTα in the cTα+ line when compared with the endogenous level of cTα expressed in cones (Fig. 1B, upper panel). For some experiments, the cTα+ transgene was also bred to homozygosity to increase expression level (cTα++). Relative expression levels of rTα and cTα was quantified using an antibody that recognized a common epitope on both isoforms (KENLKDCGLF, Meridian Life Science, Inc.), as shown in Fig. 1C. The relative level of ectopically expressed cTα+ to endogenous rTα in rods was 15 ± 1.2%. Doubling the gene dosage increased the level to 35 ± 2.0%. Swapping cTα for rTα appeared to have no discernible effect on the expression level of other transduction proteins that interact with Tα (Fig. 1D) nor on retinal morphology (data not shown).
The subunit composition for Tα in rods is rTαβ1γ1, whereas for cones the subunit composition is cTαβ3γ8 (27). The βγ subunit plays an important role in presenting the α subunit to the GPCR and enhances the coupling efficiency (28–30). To determine whether cTα forms a heterotrimeric unit with β1γ1 in these rods, we used the pertussis toxin assay in which the toxin catalyzes ADP-ribosylation of the α-subunit when it is complexed with βγ. Control experiments show rTα labeled strongly in the dark-adapted sample, and this labeling was reduced by light exposure (Fig. 1E). Application of AlF4−, which activates Tα-GDP by mimicking the γ-phosphate of GTP, dissociates the subunits, effectively reducing ADP-ribosylation in both dark and light-exposed samples (Fig. 1E). Reduced ADP-ribosylation was also observed in the cTα samples following light exposure and AlF4− application, albeit the signal was weaker due to the low expression level of cTα (Fig. 1E). These results indicate that cTα forms a heterotrimeric unit with rod β1γ1.
Rhodopsin and S-opsin Activate cTα with Similar Efficiency
Having discerned that cTα forms a heterotrimeric complex with Gβ1γ1, we sought to determine whether cTα can substitute for rTα to drive rod photoresponses. Furthermore, we sought to compare the efficiencies by which rhodopsin and a cone pigment (S-opsin) activate cTα. Previously, Shi et al. (14) showed that S-opsin and rhodopsin, when co-expressed in the same rod, generated single-photon responses through rTα with similar amplitudes and kinetics. In other words, S-opsin and rhodopsin activated endogenous rTα with similar efficiency. We generated Sop+,Rh+/−,cTα+ mice that coexpressed cone S-opsin (∼12%) and rhodopsin (∼88%) in the rod outer segment, as well as the substitution of cTα for rTα, to compare the activation of cTα by the two visual pigments in the same rod cell. The spectral sensitivities of S-opsin and rhodopsin peak near 360 and 500 nm, respectively (31). Using this spectral separation, we compared the light-evoked responses produced mostly by S-opsin activation at 367 nm and almost completely by rhodopsin activation at 571 nm. For 367 nm stimuli, the absorption of S-opsin was near its maximum and rhodopsin absorption was less than one-fifth of its peak value, whereas the response for 571 nm stimuli was generated almost completely by rhodopsin (14). The photoresponses and derived single photon response from rhodopsin coupled to cTα elicited by 571 nm (green trace) or 367 nm (blue trace) is shown in Fig. 2, A and B, respectively (Rh+/−,cTα+). These results were similar to that obtained from Sop+,Rh+/−,cTα+ rods (Fig. 2, C and D). Furthermore, the results showed that the amplitude of the elementary responses of for 367- and 571-nm stimuli was indistinguishable in these rods (Fig. 2D). Thus, we find that cTα is activated by S-opsin and rhodopsin similarly well, and the inactivation of cTα expressed in rods is similar to rTα inactivation in rods.
FIGURE 2.

Rod and cone Tα couple to rhodopsin and cone S-opsin with similar efficiency. A, averaged response families for Rh+/−, cTα+ rods for 10 ms flashes of green light (λmax = 571 nm) with flash strengths of 46, 90, 180, 360, 700, and 1400 photons μm−2, or UV light (λmax = 367 nm) with flash strengths of 85, 170, 330, 660, 1300, 2600, and 5300 photons μm−2. B, for Rh+/−,cTα+ mice, the single photon response was determined as the ratio of the time-dependent variance of all dim flash responses (< 25% Rmax) to the mean amplitude for flashes of light from a green LED (λmax = 571 nm; mean ± S.E., n = 5 rods) or a UV LED (λmax = 367 nm; mean ± S.E., n = 6). The mean single-photon response amplitude was 0.32 ± 0.10 pA for the 571-nm stimulus, compared with 0.36 ± 0.09 pA for the 367-nm stimulus. C, averaged response families for Sop+Rh+/− cTα+ rods for 10-ms flashes of green light (λmax = 571 nm; n = 17 rods) with flash strengths of 45, 89, 180, 350, 700, 1400, 2800, and 5600 photons μm−2, or UV light (λmax = 367 nm, n = 11 rods) with flash strengths of 170, 340, 680, 1300, 2700, 5400, and 11000 photons μm−2. D, estimated single-photon response for mice expressing Sop+Rh+/− cTα+ also displays a similar amplitude and kinetics independent of the wavelength of stimulation. The mean single-photon response amplitude was 0.27 ± 0.07 pA for the 571-nm stimulus, compared with 0.21 + 0.04 pA for the 367-nm stimulus. E, the normalized mean single photon response for Rh+/−,cTα+ (black trace; n = 11 rods) and Sop+,Rh+/−,cTα+ (red trace; n = 28 rods). The normalized single photon responses demonstrate similar kinetics for both Rh+/−,cTα+ and Sop+,Rh+/−, cTα+ in both the rising phase (activation of the cascade) and in the decay (inactivation).
Tα Concentration Affects Sensitivity
Suction electrode recordings form ROS showed that photoresponses from single allele cTα+ mice displayed similar single photon response amplitude and time course to WT rods (Fig. 3, A and B), indicating that cTα is capable of functionally replacing rTα in the rod phototransduction cascade. However, these rods were ∼10-fold less sensitive than WT rods (Fig. 3C). The half-maximal flash strength was ∼27 photons/μm2 in WT rods but was ∼330 photons/μm2 in cTα+ rods. This decrease in flash sensitivity was also observed in electroretinography recordings where the light sensitivity of cTα+ mice was in between that of wild-type and rTα−/− mice, whose responses arise exclusively from cones (Fig. 3D). A similar dependence was also observed in mice expressing half of the native rhodopsin (Rh+/−; Fig. 3E). Rh+/− rods displayed a half-maximal flash strength of ∼66 photons/μm2, whereas on the same Rh+/− background, the half-maximal was ∼490 photons/μm2 in cTα+ rods and ∼140 photons/μm2 in cTα++ rods. Thus, the light sensitivity appears to correlate with the expression level of Tα within this concentration range. Along with the similar activation and deactivation phase of responses in rods expressing either cTα or rTα (Fig. 4A), these results indicate that the difference in light sensitivity between rods and cones are not likely due to a cell-specific Tα.
FIGURE 3.

Sensitivity of rods expressing cTα is correlated with expression level. A, representative flash response families from WT and cTα+ rods. 10-ms flashes were delivered at the time indicated by the arrow. B, population mean single-photon responses from WT (black trace) and cTα+ mice (red trace). The responses have been normalized to compare the kinetics. C, normalized flash response amplitude is plotted against flash strength for WT and cTα+ rods. Smooth curves are fitted according to the exponential saturation equation: y = 1 − e−kt. Half-maximal flash strengths for these populations were 27 ± 1.8 photons/μm2 in WT rods (mean ± S.E.; n = 14) and 330 ± 36 photons/μm2 in cTα+ rods (mean ± S.E.; n = 12). The ∼10-fold shift in this value is similar to the 10-fold reduction in Tα in these rods. D, ERG recorded from 6-week-old WT, cTα+. Responses from rTα−/− were shown to illustrate the cone threshold. Sensitivity was presented as normalized b-wave versus light intensity (photons/μm2 at the cornea). E, normalized flash response amplitude is plotted against flash strength for rods expressing a single (+) or double dose (++) of cTα in mice expressing half of the normal rhodopsin (Rh+/−). The half-maximal flash strengths were 66 ± 8.0 photons/μm2 in Rh+/− rods (mean ± S.E.; n = 7), 490 photons/μm2 in Rh+/−,cTα+ rods (mean ± S.E.; n = 18), and 140 photons/μm2 in Rh+/−,cTα++ rods (mean ± S.E.; n = 14). Thus, in the Rh+/− background, a dependence of half-maximal flash strength on Tα concentration remains.
FIGURE 4.

Quantification of endogenous rTα and cTα proteins using recombinant protein chi8. A, purified chi8 was visualized by SYPRO-Ruby stained polyacrylamide gel. At 0.1 μg, chi8 appeared as a single band, whereas bands of higher and lower molecular weights were detected when 1 μg was loaded (arrow). B, Western blot of purified chi8 protein probed with a Gtα antibody, which recognizes a common epitope in rTα and cTα (Meridian Life Science). Aside from the band corresponding to the full-length protein (arrow), similar bands of higher and lower molecular weights as in A were also present, indicating higher aggregates of chi8 as well as its degradation products. The concentrations of endogenous rTα (C) and cTα (D) proteins were measured by Western blots of retinal homogenates from C57BL/6 mice containing known quantities of chi8. Serial dilutions were loaded onto each gel and proteins were detected using a Gtα antibody (Meridian Life Science) for rTα and sc390 (Santa Cruz Biotechnology) for cTα. The fluorescence signals from chi8 was quantified, plotted, and fitted with the best polynomial curve and served as the standard to calculate the quantity of Tα in each lane.
The Concentration of Endogenous rTα and cTα in Rods and Cones
The dependence of sensitivity on Tα concentration prompted us to compare the concentration of endogenous rTα in rods and cTα in cones. To quantify accurately the concentration of endogenous Tα, we obtained a Gαt/Gαi1 chimeric construct (chi8), which has been used for functional (24) and crystallographic studies (32), and substituted cTα sequences in the chimeric construct so the recombinantly expressed protein can serve as standards. Chi8 was expressed and purified to apparent homogeneity as visualized by SYPRO®-Ruby stained polyacrylamide gel (Fig. 4A). The trace amount of higher molecular weight bands appears to be higher order aggregates, whereas the lower molecular weight bands are likely degradation products because these bands also appeared in the Western blot (Fig. 4B). The concentration and purity of chi8 was determined by amino acid analysis. Tα in rods (rTα) was quantified using an antibody that recognizes the carboxyl-terminal sequence, KENLKDCGLF (Meridian Life Science, Inc.) which is conserved between rTα and cTα. However, this antibody showed cross-reactivity with Gi that co-migrated with cTα (but not rTα); therefore, a different antibody that recognized a highly divergent epitope on cTα (I-20, Santa Cruz Biotechnology) was used to quantify cTα. Because in the retina rTα is expressed only in rods and cTα is expressed only in cones, we can use the value obtained from whole retinal homogenates to quantify the amount of each Tα in these cells. It is known that detection efficiency in Western blots can be strongly influenced by protein complexity of the sample. To circumvent this issue, known quantities of chi8 were mixed with whole retinal homogenates prepared from C57/B6 mice or rTα−/− mice as an internal standard. The His-tagged recombinant protein migrated slower on SDS-PAGE, allowing it to be distinguished from the endogenous proteins (Fig. 4, C and D). The fluorescence signal from chi8 was plotted as a standard curve, and the best polynomial fit was applied, from which the quantity of endogenous rTα and cTα was calculated to be 59 ± 6 pmol (n = 11) and 2.6 ± 0.4 (n = 5; mean ± S.D.), respectively, per retina. As a point of comparison, we measured rhodopsin concentration by differential absorption at 500 nm in the dark and after bleaching and obtained 500 ± 30 pmol per retina (n = 9), a value that is ∼9-fold higher than the concentration of rTα determined here. This ratio of rhodopin: rTα as well as their absolute levels agree well with previous reports (19, 33–36). Because the proportion of rods:cones in the mouse retina is 33:1, and the cone outer segment is approximately half of the length and volume of rod outer segment (37), the normalized ratio of rTα:cTα concentration per cell is ∼1:3. These measurements show that cones appear to express a higher level of Tα. Therefore, the reduced sensitivity of the cone to light cannot be explained by a lower concentration of Tα.
Transgenic cTα Expressed in Rods Show Similar Translocation Pattern as Endogenous cTα in Cones
The heterotrimeric transducin is localized to the membranous ROS in the dark-adapted rods due to the synergistic effect of the lipid modifications on the α and γ subunit (38, 39). Consistent with this idea, Gβ1γ1 localization is no longer restricted to ROS and instead is evenly dispersed in the rTα−/− rods (40). Light activation of transducin dissociates the GTP-loaded α subunit from the βγ subunits, weakening their membrane association, and causes a massive translocation from the ROS to the inner segment (41, 42). This translocation decreases the gain of phototransduction and has been suggested to be an adaptation mechanism for long term light exposure (35). As another functional comparison, we studied light-dependent Tα translocation in WT, cTα++, and rTα−/− mice in response to 2,000 lux diffuse white light. As shown in Fig. 5, WT retina displayed the classically robust translocation of rTα to inner segments in response to light (Fig. 5, upper panels). In cTα++ retinas, cTα is concentrated to the ROS in darkness (Fig. 5, middle panels), consistent with results obtained from the pertussis toxin assay, indicating that cTα forms a heterotrimeric complex with Gβ1γ1. These data also provide independent support of the association between cTα and Gβ1γ1 based on what we know about the mechanism of transducin localization to ROS in the dark-adapted state (43, 44). Light exposure similarly triggered translocation of cTα in cTα++ transgenic rods. To determine whether endogenous cTα also translocates in cones, we studied rTα−/− mice where only cTα is expressed (Fig. 5, rTα−/− panels). Their identity as cones was verified using rhodamine-conjugated peanut agglutinin (Fig. 5, bottom panels), a known cone marker (45). Upon light exposure, we found that cTα moved to the cone inner segment compartments in a pattern that is qualitatively similar to endogenous rTα in WT and transgenic cTα in rods. These results show that ectopically expressed cTα is functionally similar to endogenous rod and cone Tα with respect to its ability to move between photoreceptor outer and inner segments following light exposure.
FIGURE 5.

Rod and cone Tα undergo similar light-induced translocation. A, Tα (green) is primarily localized to the outer segment (os) of WT and cTα++ rods in the dark-adapted state. Endogenous cTα, here visualized in a dark-adapted rTα (GNAT1) knock-out retina, is also localized to the outer segment. The bottom rTα−/− panels are also co-labeled with rhodamine-conjugated peanut agglutinin (red), a known cone marker. Adjacent panels show the differential interference contrast image of the same field to highlight the boundary of the outer nuclear layer. Exposure to 2,000 lux light causes endogenous Tα in both rods and cones to move toward the inner segment compartments (is, onl). This pattern was also demonstrated by ectopically expressed cTα in transgenic rods. The sections were counterstained with DAPI to visualize cell nuclei (blue). White scale bar, 25 μm; black scale bar, 10 μm.
The Light Threshold for cTα Translocation Did Not Correspond to Tα Concentration
The ability of Tα to translocate depends on its level of activation; when the concentration of Tα-GTP exceeds that of the GTPase complex, it moves to the compartments in the rod inner segment (46, 47). Because cTα+ and cTα++ rods display reduced Tα concentration compared with WT rods, a simplistic expectation is that there should be a corresponding increase in the threshold for translocation. Under these circumstances, more R* would be required to activate the same number of Tα to reach the threshold level to saturate the GTPase complex. We observed in the WT retina that Tα translocation was driven by a light yielding an initial rate of 9.7 × 10³ R*/rod·s (2.8 OD, Fig. 6B), whereas translocation in the retina of cTα++ and cTα+ mice was driven by a light yielding 1.7 × 10⁴ R*/rod·s (Fig. 6, F and H, 2.6 OD), a light intensity only 1.7-fold higher than WT mice. In cTα retinas, low level translocation can be observed at similar light threshold as WT retinas (Fig. 6E). Therefore, the threshold for translocation does not appear to depend on the relative concentration of Tα.
FIGURE 6.

Light threshold for cTα translocation does not correlate with Tα concentration. Both rTα and cTα were detected using the TF15 antibody (green). The left strip of each panel shows rhodopsin immunofluorescence (red) highlighting the outer and inner segment boundary, whereas the remaining panel is the merged image of rhodopsin (red) and Tα (green). The nuclei were stained with DAPI (blue). A–C, C57 retinas (WT); D–F, cTα++ retinas; G–I, cTα+ retinas. Translocation of rTα in WT retina was detected at 9.7 × 10³ R*/rod·s from using a 2.8 OD neutral density filter (B). At this light intensity, translocation for cTα++ can be detected (E) but was much more robust at 1.7 × 10⁴ R*/rod·s (F, 2.6 OD). For cTα+, translocation is evident at 1.7 × 10⁴ R*/rod·s (H, 2.6 OD). The green arrow marks the light intensities where translocation is evident. Scale bar, 25 μm.
DISCUSSION
In this study, we replaced cTα for rTα in transgenic mouse rods to evaluate how the Gα subtype influences signal amplification from different GPCRs and how this might explain functional differences between rods and cones. We showed that ectopically expressed cTα forms a heterotrimeric complex with Gβ1γ1, displays light-triggered translocation, and can substitute equally for rTα in generating photoresponses initiated by either rhodopsin or S-cone opsin. Thus, from a functional standpoint rTα and cTα appear interchangeable. Below, we discuss this functional interchangeability.
The Role of Tα in Setting the Properties of the Rod and Cone Photoresponse
A number of studies have investigated whether signal amplification at the first step of visual transduction, between the pigment and G protein, may provide a mechanism that explains the difference in light sensitivity between retinal rod and cones. In support of this notion, Xenopus short-wave cone opsin heterologously expressed in COS-1 cells exhibited lower Tα activation when compared with rhodopsin (10). In addition, biochemical assays performed on purified rods and cones from carp retina revealed a lower amplification of G protein activity, as well as faster visual pigment phosphorylation in cones (6, 7, 48). We also observed a decrease in sensitivity in mice that expressed cTα in rods. However, this decrease in sensitivity correlated with the level of cTα expression (Fig. 3). A comparison of the normalized single photon response arising from rTα and cTα showed them to be similar in rising phase as well as response recovery, indicating the similar amplification efficiency of rTα and cTα by rhodopsin and similar deactivation by the GAP complex. Deng et al. (49), who used AAV to introduce cTα into GNAT1−/− rods, also observed a similar sensitivity and response recovery when compared with rTα, a result qualitatively similar to our findings.
The co-expression of S-cone opsin in rods allowed us, for the first time, to determine whether cell-type specific Tα interacted preferentially with visual pigment subclasses. We demonstrated that cTα is activated by rhodopsin and S-cone opsin equally when both are expressed in the same cell. These results, together with our previous finding that S-opsin and rhodopsin produced equivalent light responses when coupled to endogenous rTα, suggest strongly that the difference in sensitivity between rods and cones does not lie within rTα and cTα.
Our findings are also similar to a previous study of rods and cones in the tiger salamander, whose green rods and blue cones contain the same S-cone opsin that is coupled to rTα and cTα, respectively. It was found that these cells display similar light sensitivities and response kinetics, indicating that S-cone opsin activates the native rTα and cTα with the same efficiency regardless of the structural features of the photoreceptor outer segment (50). The interchangeability between rTα and cTα may not be totally surprising. Structural studies of the interaction between rTα-GDP and Gβγ between activated rTα and γ PDE and between activated rTα and the RGS complex found that the interface between these interactions often show complete conservation of the amino acids between rTα and cTα (32, 51). One distinction is at the amino terminus, where cTα contains an insert of four amino acids, ELAR, in a domain determined to participate in Gβγ as well as receptor binding (32, 52, 53). Our data show that this insert does not appear to affect these interactions within the rod cell. Given this apparent interchangeability of Tα, it is remarkable that rods and cones express different forms of transducin. Although our results show that Tα in rods and cones is interchangeable, it remains possible that the cell type-specific Gβγ subunits are functionally specific in the phototransduction cascade or perhaps at the synapse (54).
A recent study by Chen et al. (55) used a similar strategy as ours to replace endogenous rTα with cTα (termed GNAT2C) in transgenic mice and reported a lower amplification of GNAT2C by rhodopsin that resulted in a decrease in light sensitivity and faster response recovery. The level of GNAT2C used in their study was similar to that of endogenous rTα, whereas cTα expression used in this study were two different lower doses: 15 and 35% of the endogenous rTα expression. In light of a recent study that showed monomeric rTα expressed in rTγ knock-out mice displayed reduced receptor coupling and accelerated response recovery (28), one possibility is that GNAT2C did not associate well with Gβ1γ1. The reason for the discrepancy in the ectopically expressed cTα in our study and that of Chen et al. (55) is not clear. One possible explanation is the strain difference of the mice used; transgenic lines with the same gene addition or deletion sometimes display different phenotypes (28, 56–58).
Concentration Dependence of Tα on Rod Sensitivity
Heck and Hofmann (59), who derived a Km value for the rate of Tα activation by R* in vitro, predicted that the physiological concentration of Tα at the ROS discs, being less than Km, would rate limit this reaction. Such a relationship was noted in the phosducin−/− (60) and Gγ1+/− rods, where Tα expressed at 60–70% of the endogenous level led to a 1.4-fold reduction in sensitivity (61). The remarkable linear correspondence is extended by our studies on Tα expressed at 15 and 35% leading to a ∼10- and ∼5-fold decrease in sensitivity, respectively. Altogether, these studies provide support for the hypothesis that the rate of Tα activation by R* is proportional to Tα concentration in intact rods in this concentration range. They also underscore the importance of quantitative measurements of protein concentrations for the evaluation of the functional difference between rods and cones.
The correlation between decreased light sensitivity and cTα expression in transgenic rods prompted us to quantify the level of endogenous rTα and cTα relative to the visual pigment. In particular, we asked whether the lower sensitivity of cones could be explained by lower concentrations of endogenous cTα. To measure cTα concentration, we expressed a chimeric Gαt/Gαi1, which was determined to be functionally indistinguishable from Gαt, and used it as an internal standard followed by quantitative Western blots. Using this approach, we calculated the absolute quantity of rTα to be 58 ± 6 pmol per retina, which is approximately one-tenth of rhodopsin, a value in good agreement with previous reports (19, 33–36). The value of cTα was ascertained to be 2.6 ± 0.4 pmol, which when normalized to the number of cones and their smaller outer segment volume, is higher than the concentration of rTα in rods. Therefore, the lower sensitivity of cones cannot be explained simply by a lower Tα concentration. Considering that Gβγ increases the coupling efficiency between R* and Tα (28), the level of endogenous Gβ3γ8 in cones and their association with cTα may be important determinants for setting sensitivity in cones. Additional factors that are likely to play a role include a faster rate of cone pigment phosphorylation (6, 7), regeneration (62), and their faster turnover rate of cGMP (9).
Ectopically Expressed cTα Translocates Normally
Light-induced Tα translocation from the outer segment to the inner compartments decreases the gain of phototransduction and has been proposed to be an adaptation mechanism (35). How translocation is regulated has been a topic of intense investigation, particularly because this process has been reported to be nonlinearly related to light exposure (43). Studies have shown that translocation threshold in rods can be shifted to dimmer or brighter light exposures in the GAP defective mice, or those overexpressing RGS9, respectively, giving rise to the model that Tα translocation ensues only when the concentration of Tα-GTP exceeds that of the GTPase-activating complex (46, 47). The same rule was proposed for mouse cones as well, where the failure to observe cTα translocation was attributed to the higher expression level of the GAP complex in cones (63). However, in this study, we observed that endogenous cTα in cones readily translocated with moderate light exposure (2,000 lux). A similar observation of cTα translocation was also reported by Chen et al. (64). The discrepancy in the observation of cTα translocation by different groups could be due to differences in the tissue preparations, epitope unmasking, and the sensitivity of the antibodies used. The translocation pattern of cTα is consistent with the functional interchangeability of rTα and cTα in rods and cones and suggests that translocation of endogenous cTα in cones may contribute to light adaptation under prolonged light exposure.
We took advantage of mice expressing different Tα levels to investigate the relationship between Tα concentration and the light threshold that triggers translocation. Because cTα+ and cTα++ rods contain 15 and 35% of Tα concentration compared with WT rods, a simple expectation is to see a corresponding increase in light threshold to reach the concentration of Tα-GTP necessary to saturate the GAP complex for translocation to ensue. Instead, we observed only a slight increase in light thresholds (Fig. 6). Although the almost 2-fold difference in the light threshold did correlate with their relative difference in sensitivity, the relation between translocation threshold and absolute sensitivity is non-linear. The non-linearity observed for light threshold for translocation likely reflects a non-linear relationship between the number of activated transducin generated per R* at bright light levels, which are beyond the functional range of rods. Additional candidates that may affect this non-linearity include lipid modifications on Tα (44, 47, 65, 66), lipid microdomains on ROS discs, and protein-protein interactions that restrict their lateral and longitudinal diffusion (67, 68).
Acknowledgments
We thank V. Arshavsky for critical reading of an early version of this manuscript.
This work was supported by National Institutes of Health Grants RO1 EY12155 (to J. C.) and RO1 EY17606 (to A. P. S.); a Vision Core grant to Doheny Eye Institute (EY03040); the Beckman Initiative for Macular Research (to J. C.); the Karl Kirchgessner Foundation (to A. P. S.); and the McKnight Endowment Fund for Neurosciences (to A. P. S.).
- Tα
- transducin α
- GPCR
- G protein-coupled receptor
- rTα
- rod transducin α
- cTα
- cone transducin α
- GAP
- GTPase accelerating protein
- RGS
- regulator of G protein signaling
- ROS
- rod outer segment
- FWHM
- full width half maximum.
REFERENCES
- 1. Baylor D. A., Lamb T. D., Yau K. W. (1979) Responses of retinal rods to single photons. J. Physiol. 288, 613–634 [PMC free article] [PubMed] [Google Scholar]
- 2. Hecht S., Shlaer S., Pirenne M. H. (1942) ENERGY, QUANTA, AND VISION. J. Gen. Physiol. 25, 819–840 [DOI] [PMC free article] [PubMed] [Google Scholar]
- 3. Burkhardt D. A. (1994) Light adaptation and photopigment bleaching in cone photoreceptors in situ in the retina of the turtle. J. Neurosci. 14, 1091–1105 [DOI] [PMC free article] [PubMed] [Google Scholar]
- 4. Normann R. A., Perlman I. (1979) The effects of background illumination on the photoresponses of red and green cones. J. Physiol. 286, 491–507 [DOI] [PMC free article] [PubMed] [Google Scholar]
- 5. Baylor D. A. (1987) Photoreceptor signals and vision. Proctor lecture. Invest. Ophthalmol. Vis. Sci. 28, 34–49 [PubMed] [Google Scholar]
- 6. Tachibanaki S., Arinobu D., Shimauchi-Matsukawa Y., Tsushima S., Kawamura S. (2005) Highly effective phosphorylation by G protein-coupled receptor kinase 7 of light-activated visual pigment in cones. Proc. Natl. Acad. Sci. U.S.A. 102, 9329–9334 [DOI] [PMC free article] [PubMed] [Google Scholar]
- 7. Tachibanaki S., Tsushima S., Kawamura S. (2001) Low amplification and fast visual pigment phosphorylation as mechanisms characterizing cone photoresponses. Proc. Natl. Acad. Sci. U.S.A. 98, 14044–14049 [DOI] [PMC free article] [PubMed] [Google Scholar]
- 8. Cowan C. W., Fariss R. N., Sokal I., Palczewski K., Wensel T. G. (1998) High expression levels in cones of RGS9, the predominant GTPase accelerating protein of rods. Proc. Natl. Acad. Sci. U.S.A. 95, 5351–5356 [DOI] [PMC free article] [PubMed] [Google Scholar]
- 9. Takemoto N., Tachibanaki S., Kawamura S. (2009) High cGMP synthetic activity in carp cones. Proc. Natl. Acad. Sci. U.S.A. 106, 11788–11793 [DOI] [PMC free article] [PubMed] [Google Scholar]
- 10. Starace D. M., Knox B. E. (1997) Activation of transducin by a Xenopus short wavelength visual pigment. J. Biol. Chem. 272, 1095–1100 [DOI] [PubMed] [Google Scholar]
- 11. Nikonov S. S., Kholodenko R., Lem J., Pugh E. N., Jr. (2006) Physiological features of the S- and M-cone photoreceptors of wild-type mice from single-cell recordings. J. Gen. Physiol. 127, 359–374 [DOI] [PMC free article] [PubMed] [Google Scholar]
- 12. Pugh E. N., Jr., Lamb T. D. (1993) Amplification and kinetics of the activation steps in phototransduction. Biochim. Biophys. Acta 1141, 111–149 [DOI] [PubMed] [Google Scholar]
- 13. Zhang X., Wensel T. G., Kraft T. W. (2003) GTPase regulators and photoresponses in cones of the eastern chipmunk. J. Neurosci. 23, 1287–1297 [DOI] [PMC free article] [PubMed] [Google Scholar]
- 14. Shi G., Yau K. W., Chen J., Kefalov V. J. (2007) Signaling properties of a short-wave cone visual pigment and its role in phototransduction. J. Neurosci. 27, 10084–10093 [DOI] [PMC free article] [PubMed] [Google Scholar]
- 15. Lem J., Applebury M. L., Falk J. D., Flannery J. G., Simon M. I. (1991) Tissue-specific and developmental regulation of rod opsin chimeric genes in transgenic mice. Neuron 6, 201–210 [DOI] [PubMed] [Google Scholar]
- 16. Calvert P. D., Krasnoperova N. V., Lyubarsky A. L., Isayama T., Nicoló M., Kosaras B., Wong G., Gannon K. S., Margolskee R. F., Sidman R. L., Pugh E. N., Jr., Makino C. L., Lem J. (2000) Phototransduction in transgenic mice after targeted deletion of the rod transducin α-subunit. Proc. Natl. Acad. Sci. U.S.A. 97, 13913–13918 [DOI] [PMC free article] [PubMed] [Google Scholar]
- 17. Watson A. J., Aragay A. M., Slepak V. Z., Simon M. I. (1996) A novel form of the G protein β subunit Gβ5 is specifically expressed in the vertebrate retina. J. Biol. Chem. 271, 28154–28160 [DOI] [PubMed] [Google Scholar]
- 18. Chen C. K., Wieland T., Simon M. I. (1996) RGS-r, a retinal specific RGS protein, binds an intermediate conformation of transducin and enhances recycling. Proc. Natl. Acad. Sci. U.S.A. 93, 12885–12889 [DOI] [PMC free article] [PubMed] [Google Scholar]
- 19. Tsang S. H., Burns M. E., Calvert P. D., Gouras P., Baylor D. A., Goff S. P., Arshavsky V. Y. (1998) Role for the target enzyme in deactivation of photoreceptor G protein in vivo. Science 282, 117–121 [DOI] [PubMed] [Google Scholar]
- 20. Kerov V., Rubin W. W., Natochin M., Melling N. A., Burns M. E., Artemyev N. O. (2007) N-terminal fatty acylation of transducin profoundly influences its localization and the kinetics of photoresponse in rods. J. Neurosci. 27, 10270–10277 [DOI] [PMC free article] [PubMed] [Google Scholar]
- 21. Jeon C. J., Strettoi E., Masland R. H. (1998) The major cell populations of the mouse retina. J. Neurosci. 18, 8936–8946 [DOI] [PMC free article] [PubMed] [Google Scholar]
- 22. Dartnall H. J. (1968) The photosensitivities of visual pigments in the presence of hydroxylamine. Vision Res. 8, 339–358 [DOI] [PubMed] [Google Scholar]
- 23. Concepcion F., Mendez A., Chen J. (2002) The carboxyl-terminal domain is essential for rhodopsin transport in rod photoreceptors. Vision Res. 42, 417–426 [DOI] [PubMed] [Google Scholar]
- 24. Skiba N. P., Bae H., Hamm H. E. (1996) Mapping of effector binding sites of transducin α-subunit using Gαt/Gαi1 chimeras. J. Biol. Chem. 271, 413–424 [DOI] [PubMed] [Google Scholar]
- 25. Chen J., Shi G., Concepcion F. A., Xie G., Oprian D. (2006) Stable rhodopsin/arrestin complex leads to retinal degeneration in a transgenic mouse model of autosomal dominant retinitis pigmentosa. J. Neurosci. 26, 11929–11937 [DOI] [PMC free article] [PubMed] [Google Scholar]
- 26. Okawa H., Miyagishima K. J., Arman A. C., Hurley J. B., Field G. D., Sampath A. P. (2010) Optimal processing of photoreceptor signals is required to maximize behavioural sensitivity. J. Physiol. 588, 1947–1960 [DOI] [PMC free article] [PubMed] [Google Scholar]
- 27. Peng Y. W., Robishaw J. D., Levine M. A., Yau K. W. (1992) Retinal rods and cones have distinct G protein β and γ subunits. Proc. Natl. Acad. Sci. U.S.A. 89, 10882–10886 [DOI] [PMC free article] [PubMed] [Google Scholar]
- 28. Kolesnikov A. V., Rikimaru L., Hennig A. K., Lukasiewicz P. D., Fliesler S. J., Govardovskii V. I., Kefalov V. J., Kisselev O. G. (2011) G-protein βγ-complex is crucial for efficient signal amplification in vision. J. Neurosci. 31, 8067–8077 [DOI] [PMC free article] [PubMed] [Google Scholar]
- 29. Lomonosova E., Kolesnikov A. V., Kefalov V. J., Kisselev O. G. (2012) Signaling states of rhodopsin in rod disk membranes lacking transducin βγ-complex. Invest Ophthalmol. Vis. Sci. 53, 1225–1233 [DOI] [PMC free article] [PubMed] [Google Scholar]
- 30. Oldham W. M., Hamm H. E. (2008) Heterotrimeric G protein activation by G-protein-coupled receptors. Nat. Rev. Mol. Cell Biol. 9, 60–71 [DOI] [PubMed] [Google Scholar]
- 31. Lyubarsky A. L., Falsini B., Pennesi M. E., Valentini P., Pugh E. N., Jr. (1999) UV- and midwave-sensitive cone-driven retinal responses of the mouse: a possible phenotype for coexpression of cone photopigments. J. Neurosci. 19, 442–455 [DOI] [PMC free article] [PubMed] [Google Scholar]
- 32. Lambright D. G., Sondek J., Bohm A., Skiba N. P., Hamm H. E., Sigler P. B. (1996) The 2.0 A crystal structure of a heterotrimeric G protein. Nature 379, 311–319 [DOI] [PubMed] [Google Scholar]
- 33. Driessen C. A., Winkens H. J., Hoffmann K., Kuhlmann L. D., Janssen B. P., Van Vugt A. H., Van Hooser J. P., Wieringa B. E., Deutman A. F., Palczewski K., Ruether K., Janssen J. J. (2000) Disruption of the 11-cis-retinol dehydrogenase gene leads to accumulation of cis-retinols and cis-retinyl esters. Mol. Cell Biol. 20, 4275–4287 [DOI] [PMC free article] [PubMed] [Google Scholar]
- 34. Lyubarsky A. L., Daniele L. L., Pugh E. N., Jr. (2004) From candelas to photoisomerizations in the mouse eye by rhodopsin bleaching in situ and the light-rearing dependence of the major components of the mouse ERG. Vision Res. 44, 3235–3251 [DOI] [PubMed] [Google Scholar]
- 35. Sokolov M., Lyubarsky A. L., Strissel K. J., Savchenko A. B., Govardovskii V. I., Pugh E. N., Jr., Arshavsky V. Y. (2002) Massive light-driven translocation of transducin between the two major compartments of rod cells: a novel mechanism of light adaptation. Neuron 34, 95–106 [DOI] [PubMed] [Google Scholar]
- 36. Strissel K. J., Sokolov M., Trieu L. H., Arshavsky V. Y. (2006) Arrestin translocation is induced at a critical threshold of visual signaling and is superstoichiometric to bleached rhodopsin. J. Neurosci. 26, 1146–1153 [DOI] [PMC free article] [PubMed] [Google Scholar]
- 37. Carter-Dawson L. D., LaVail M. M. (1979) Rods and cones in the mouse retina. I. Structural analysis using light and electron microscopy. J. Comp. Neurol. 188, 245–262 [DOI] [PubMed] [Google Scholar]
- 38. Bigay J., Faurobert E., Franco M., Chabre M. (1994) Roles of lipid modifications of transducin subunits in their GDP-dependent association and membrane binding. Biochemistry 33, 14081–14090 [DOI] [PubMed] [Google Scholar]
- 39. Kosloff M., Alexov E., Arshavsky V. Y., Honig B. (2008) Electrostatic and lipid anchor contributions to the interaction of transducin with membranes: mechanistic implications for activation and translocation. J. Biol. Chem. 283, 31197–31207 [DOI] [PMC free article] [PubMed] [Google Scholar]
- 40. Zhang H., Huang W., Zhang H., Zhu X., Craft C. M., Baehr W., Chen C. K. (2003) Light-dependent redistribution of visual arrestins and transducin subunits in mice with defective phototransduction. Mol. Vis. 9, 231–237 [PubMed] [Google Scholar]
- 41. Brann M. R., Cohen L. V. (1987) Diurnal expression of transducin mRNA and translocation of transducin in rods of rat retina. Science 235, 585–587 [DOI] [PubMed] [Google Scholar]
- 42. Whelan J. P., McGinnis J. F. (1988) Light-dependent subcellular movement of photoreceptor proteins. J. Neurosci. Res. 20, 263–270 [DOI] [PubMed] [Google Scholar]
- 43. Calvert P. D., Strissel K. J., Schiesser W. E., Pugh E. N., Jr., Arshavsky V. Y. (2006) Light-driven translocation of signaling proteins in vertebrate photoreceptors. Trends Cell Biol. 16, 560–568 [DOI] [PubMed] [Google Scholar]
- 44. Rosenzweig D. H., Nair K. S., Wei J., Wang Q., Garwin G., Saari J. C., Chen C. K., Smrcka A. V., Swaroop A., Lem J., Hurley J. B., Slepak V. Z. (2007) Subunit dissociation and diffusion determine the subcellular localization of rod and cone transducins. J. Neurosci. 27, 5484–5494 [DOI] [PMC free article] [PubMed] [Google Scholar]
- 45. Blanks J. C., Johnson L. V. (1984) Specific binding of peanut lectin to a class of retinal photoreceptor cells. A species comparison. Invest. Ophthalmol. Vis. Sci. 25, 546–557 [PubMed] [Google Scholar]
- 46. Kerov V., Chen D., Moussaif M., Chen Y. J., Chen C. K., Artemyev N. O. (2005) Transducin activation state controls its light-dependent translocation in rod photoreceptors. J. Biol. Chem. 280, 41069–41076 [DOI] [PubMed] [Google Scholar]
- 47. Lobanova E. S., Finkelstein S., Song H., Tsang S. H., Chen C. K., Sokolov M., Skiba N. P., Arshavsky V. Y. (2007) Transducin translocation in rods is triggered by saturation of the GTPase-activating complex. J. Neurosci. 27, 1151–1160 [DOI] [PMC free article] [PubMed] [Google Scholar]
- 48. Kawamura S., Tachibanaki S. (2008) Rod and cone photoreceptors: molecular basis of the difference in their physiology. Comp. Biochem. Physiol. A Mol. Integr. Physiol. 150, 369–377 [DOI] [PubMed] [Google Scholar]
- 49. Deng W. T., Sakurai K., Liu J., Dinculescu A., Li J., Pang J., Min S. H., Chiodo V. A., Boye S. L., Chang B., Kefalov V. J., Hauswirth W. W. (2009) Functional interchangeability of rod and cone transducin α-subunits. Proc. Natl. Acad. Sci. U.S.A. 106, 17681–17686 [DOI] [PMC free article] [PubMed] [Google Scholar]
- 50. Ma J., Znoiko S., Othersen K. L., Ryan J. C., Das J., Isayama T., Kono M., Oprian D. D., Corson D. W., Cornwall M. C., Cameron D. A., Harosi F. I., Makino C. L., Crouch R. K. (2001) A visual pigment expressed in both rod and cone photoreceptors. Neuron 32, 451–461 [DOI] [PubMed] [Google Scholar]
- 51. Slep K. C., Kercher M. A., He W., Cowan C. W., Wensel T. G., Sigler P. B. (2001) Structural determinants for regulation of phosphodiesterase by a G protein at 2.0 A. Nature 409, 1071–1077 [DOI] [PubMed] [Google Scholar]
- 52. Mazzoni M. R., Hamm H. E. (1996) Interaction of transducin with light-activated rhodopsin protects It from proteolytic digestion by trypsin. J. Biol. Chem. 271, 30034–30040 [DOI] [PubMed] [Google Scholar]
- 53. Navon S. E., Fung B. K. (1987) Characterization of transducin from bovine retinal rod outer segments. Participation of the amino-terminal region of T α in subunit interaction. J. Biol. Chem. 262, 15746–15751 [PubMed] [Google Scholar]
- 54. Betke K. M., Wells C. A., Hamm H. E. (2012) GPCR mediated regulation of synaptic transmission. Prog. Neurobiol. 96, 304–321 [DOI] [PMC free article] [PubMed] [Google Scholar]
- 55. Chen C. K., Woodruff M. L., Chen F. S., Shim H., Cilluffo M. C., Fain G. L. (2010) Replacing the rod with the cone transducin subunit decreases sensitivity and accelerates response decay. J. Physiol. 588, 3231–3241 [DOI] [PMC free article] [PubMed] [Google Scholar]
- 56. Chen J., Flannery J. G., LaVail M. M., Steinberg R. H., Xu J., Simon M. I. (1996) bcl-2 overexpression reduces apoptotic photoreceptor cell death in three different retinal degenerations. Proc. Natl. Acad. Sci. U.S.A. 93, 7042–7047 [DOI] [PMC free article] [PubMed] [Google Scholar]
- 57. Joseph R. M., Li T. (1996) Overexpression of Bcl-2 or Bcl-XL transgenes and photoreceptor degeneration. Invest. Ophthalmol. Vis. Sci. 37, 2434–2446 [PubMed] [Google Scholar]
- 58. Lobanova E. S., Finkelstein S., Herrmann R., Chen Y. M., Kessler C., Michaud N. A., Trieu L. H., Strissel K. J., Burns M. E., Arshavsky V. Y. (2008) Transducin γ-subunit sets expression levels of α- and β-subunits and is crucial for rod viability. J. Neurosci. 28, 3510–3520 [DOI] [PMC free article] [PubMed] [Google Scholar]
- 59. Heck M., Hofmann K. P. (2001) Maximal rate and nucleotide dependence of rhodopsin-catalyzed transducin activation: initial rate analysis based on a double displacement mechanism. J. Biol. Chem. 276, 10000–10009 [DOI] [PubMed] [Google Scholar]
- 60. Krispel C. M., Sokolov M., Chen Y. M., Song H., Herrmann R., Arshavsky V. Y., Burns M. E. (2007) Phosducin regulates the expression of transducin βγ subunits in rod photoreceptors and does not contribute to phototransduction adaptation. J. Gen. Physiol. 130, 303–312 [DOI] [PMC free article] [PubMed] [Google Scholar]
- 61. Herrmann R., Lobanova E. S., Hammond T., Kessler C., Burns M. E., Frishman L. J., Arshavsky V. Y. (2010) Phosducin regulates transmission at the photoreceptor-to-ON-bipolar cell synapse. J. Neurosci. 30, 3239–3253 [DOI] [PMC free article] [PubMed] [Google Scholar]
- 62. Wang J. S., Kefalov V. J. (2011) The cone-specific visual cycle. Prog. Retin. Eye Res. 30, 115–128 [DOI] [PMC free article] [PubMed] [Google Scholar]
- 63. Lobanova E. S., Herrmann R., Finkelstein S., Reidel B., Skiba N. P., Deng W. T., Jo R., Weiss E. R., Hauswirth W. W., Arshavsky V. Y. (2010) Mechanistic basis for the failure of cone transducin to translocate: why cones are never blinded by light. J. Neurosci. 30, 6815–6824 [DOI] [PMC free article] [PubMed] [Google Scholar]
- 64. Chen J., Wu M., Sezate S. A., McGinnis J. F. (2007) Light threshold-controlled cone α-transducin translocation. Invest. Ophthalmol. Vis. Sci. 48, 3350–3355 [DOI] [PubMed] [Google Scholar]
- 65. Kassai H., Aiba A., Nakao K., Nakamura K., Katsuki M., Xiong W. H., Yau K. W., Imai H., Shichida Y., Satomi Y., Takao T., Okano T., Fukada Y. (2005) Farnesylation of retinal transducin underlies its translocation during light adaptation. Neuron 47, 529–539 [DOI] [PMC free article] [PubMed] [Google Scholar]
- 66. Neubert T. A., Johnson R. S., Hurley J. B., Walsh K. A. (1992) The rod transducin α subunit amino terminus is heterogeneously fatty acylated. J. Biol. Chem. 267, 18274–18277 [PubMed] [Google Scholar]
- 67. Kerov V., Artemyev N. O. (2011) Diffusion and light-dependent compartmentalization of transducin. Mol. Cell. Neurosci. 46, 340–346 [DOI] [PMC free article] [PubMed] [Google Scholar]
- 68. Wang Q., Zhang X., Zhang L., He F., Zhang G., Jamrich M., Wensel T. G. (2008) Activation-dependent hindrance of photoreceptor G protein diffusion by lipid microdomains. J. Biol. Chem. 283, 30015–30024 [DOI] [PMC free article] [PubMed] [Google Scholar]