Abstract
Although stretching of most polymer chains leads to rather featureless force-extension diagrams, some, notably DNA, exhibit nontrivial behavior with a distinct plateau region. Here, we propose a unified theory that connects force-extension characteristics of the polymer chain with the convexity properties of the extension energy profile of its individual monomer subunits. Namely, if the effective monomer deformation energy as a function of its extension has a nonconvex (concave up) region, the stretched polymer chain separates into two phases: the weakly and strongly stretched monomers. Simplified planar and 3D polymer models are used to illustrate the basic principles of the proposed model. Specifically, we show rigorously that, when the secondary structure of a polymer is mostly caused by weak noncovalent interactions, the stretching is two phase, and the force-stretching diagram has the characteristic plateau. We then use realistic coarse-grained models to confirm the main findings and make direct connection to the microscopic structure of the monomers. We show in detail how the two-phase scenario is realized in the α-helix and DNA double helix. The predicted plateau parameters are consistent with single-molecules experiments. Detailed analysis of DNA stretching shows that breaking of Watson–Crick bonds is not necessary for the existence of the plateau, although some of the bonds do break as the double helix extends at room temperature. The main strengths of the proposed theory are its generality and direct microscopic connection.
Keywords: α-helix extension, coarse-grained DNA model, general mechanism, DNA overstretching, polymer force-extension
When pulled by the ends, a flexible linear polymer first undergoes entropic elongation, where the work done by the stretching force reduces the conformational entropy of the chain (1, 2). In this well-understood (2) weak extension regime, the polymer obeys Hooke’s law, and its elastic properties are universal, in that they are insensitive to details of the chemical structure and interactions within its monomers. As the polymer chain is extended further and its end-to-end distance becomes comparable with the chain contour length, the intrinsic elasticity caused by deformation and interaction of individual monomers begins to dominate the extension response (3). Because short-scale chemical structures of real polymers differ substantially, as do their observed responses to strong tension forces, one wonders if polymer stretching in this regime can still be described by a universal principle? The question is important. Biopolymers such as DNA are subjected to a range of mechanical manipulations within the cell, and they may change their conformations and undergo unexpected structural transitions (4–6). Knowledge of elastic properties of biopolymers is required to understand the structural dynamics of many important cellular processes (7–9). These properties can now be measured quite accurately by modern experimental techniques such as atomic force microscopy and optical tweezers.
For DNA (4, 5, 10–12) and polypeptides (13–15), these experiments have revealed several peculiar features. When extended, the (ds) DNA molecule exhibits the following behavior: until the end-to-end distance reaches 0.9 of the contour length, the stretching process is well-described by established phenomenological models (2, 4, 16). However, then, when the molecule is subjected to forces of 65 ÷ 120 pN (depending on experimental conditions), a sudden structural transition occurs, in which the chain stretches up to 70% beyond its canonical B-form contour length. The extension force remains almost constant in this regime, which is manifested by a characteristic plateau on the experimental force-extension curve. Similar single-molecule stretching experiments have also been performed on polypeptide molecules (13–15). It was found that simple helical polypeptide structures, such as synthetic α-helices (14) and myosin molecules (13), exhibit a force-extension plateau similar to the plateau seen in DNA stretching experiments. In contrast, these features are not observed in many nonbiological polymers such as polyethylene.
Various microscopic models were proposed to explain these observations, in particular the force-extension plateau, on a case-by-case basis. For example, the force-extension plateau observed in single-DNA molecule experiments (sometimes called the overstretching plateau) is often explained by gradual unzipping (force-induced melting) of the double helix, in which Watson–Crick (WC) hydrogen bonds between base pairs break (10–12, 17–19). An alternative explanation involves cooperative transition of the whole structure into a new form called S-form, where WC bonds remain intact (5, 20), but the helix unwinds to form a straight ladder. In the case of polypeptides, the force-extension plateau is attributed to α-helix unwinding (13, 21, 22). Phenomenological descriptions based on various assumptions about stable monomer states were also proposed (23). Still, no universal, microscopically based mechanism exists that can explain why some polymers do and some do not exhibit a plateau in force-extension experiments. Here, we propose such a mechanism and show how the stretching properties of the polymer depend on the balance between valent and nonvalent interactions on the scale of individual monomers.
Results and Discussion
General Mechanism of Polymer Stretching Under Tension.
Consider a linear polymer chain of N ≫ 1 identical interacting sites (monomeric units). The effective site deformation energy E(Δl) can be defined as follows. Consider a configuration of the chain in which each site is stretched by the same amount Δl. Then, E(Δl) is simply the total deformation energy of the chain divided by N. Here, we show that the shape of the effective site deformation energy E(Δl) determines force-induced stretching behavior of the chain in the general experimental scenario when the force is applied to the chain’s ends and no restrictions are imposed on deformations of individual sites.
In what follows, we will use the following convention. Extension of a single monomeric site or equivalently, extension of each site of a uniformly stretched chain is denoted by Δl. In general, including the case of nonuniform deformation, extension of site i is denoted by Δli. We use ΔL for the mean per site deformation  .
.
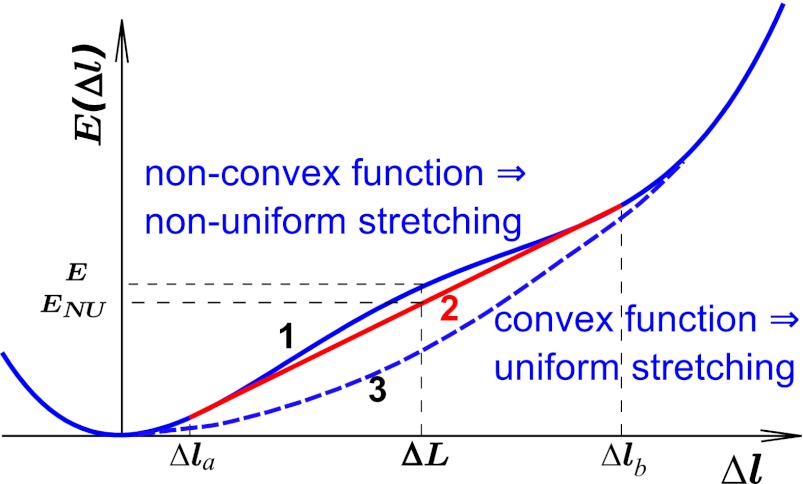
If the function E(Δl) is convex down (Fig. 1, line 3), the most favorable structure of the chain with fixed total deformation  corresponds to each site i stretched by the same amount Δli ≡ Δl (details in SI Text). The simplest example of such a polymer model is a chain of beads connected by harmonic springs. The total deformation energy of the chain in the case of convex E(Δl) is NE(Δl). Nonuniform stretching is energetically unfavorable in this scenario, because any putative decrease in the total energy from understretching of a group of sites would be offset by a larger increase in the energy of the remaining sites that would have to overstretch to keep the total deformation of the chain constant. In contrast, if the effective site extension energy is nonconvex over some interval (Fig. 1, curve 1), two-phase stretching becomes more favorable energetically: one part of chain consists of pN sites (0 < p < 1) stretched strongly by Δlb, and another part consists of the remaining (1 − p)N sites stretched weakly by Δla < Δlb. Qualitatively, this regime becomes energetically favorable because the decrease of the chain energy (relative to the uniform stretching scenario) resulting from understretching of a group of sites is larger than the gain from overstretching of the remaining sites. A detailed quantitative analysis is presented in SI Text. Briefly, the mean deformation per site in this case is
  , and the total energy of the chain in this nonuniform (NU) case equals
  [contribution from phase boundary can be neglected for long chains, N ≫ 1, typically used in experiment (19)]. Because the function E(Δl) is nonconvex,
  is less than
  —the total energy of the chain in the uniform extension case with the same total deformation (Fig. 1). In the nonuniform deformation regime, the chain extension is achieved by change in the relative fraction p of the strongly stretched sites, not by extension of individual sites. As p increases from zero to one, the mean deformation
  depends on p linearly and ranges from Δla to Δlb. The average per site chain energy
  also depends on p linearly and ranges from E(Δla) to E(Δlb)—that is, the stretching process is described by a straight line connecting points Δla and Δlb (Fig. 1, red line). The tension force
  , thus, remains constant, and the characteristic plateau in the force-extension diagram appears.
Fig. 1.
Two distinct forms of the effective site deformation energy E(Δl) of an individual monomeric unit (site) that lead to qualitatively different stretching scenarios of the linear polymer chain of N sites. The site extension is Δl. Curve 1 is a nonconvex energy function (between Δla and Δlb) that leads to nonuniform, two-phase stretching of the chain. Some sites extend weakly by Δla, and some extend strongly by Δlb. The chain extension follows the convex hull (red line 2) of E(Δl), with only the relative fraction of weakly extended sites changing as the chain extends. The average (per site) energy of nonuniform extension  is less than that of the corresponding uniform E(Δl) extension. Curve 3 is a convex function E(Δl) that leads to uniform extension of all of the sites.
Real polymer chains may appear more complex, but the chain structure is always stabilized by interactions of two types: strong valent and weak nonvalent. The former describes bond, angle, and torsion deformations. The latter corresponds to soft nonvalent interactions. These interactions include various combinations of electrostatic and van der Waals interactions, hydrogen bonds in polypeptide α-helix, and stacking interactions between neighboring base pairs in DNA. The main feature of realistic nonvalent interactions potentials W(r) is the existence of inflection points. If nonvalent interactions contribute significantly to the extension energy E(Δl), the function E(Δl) may also have an inflection point and hence, a nonconvex region as in Fig. 1, leading to a plateau in the force-extension diagram.
We, thus, propose a general mechanism for the observed two-phase stretching of liner polymers based on convexity properties of the effective potential energy of the monomeric units of the polymer. As we will show, the mechanism is able to explain the existence of force-extension plateaus for very different types of polymers.
Stretching of a 2D Zigzag Molecular Chain.
We begin by exemplifying the proposed mechanism of nonhomogeneous two-phase stretching on a 2D zigzag chain (Fig. 2). Although arguably among the simplest polymer geometries, it is often found in real polymers: for example, polyethylene (PE) molecule has a stable plane conformation of transzigzag. The 2D zigzag form is also common in hydrogen-bonded chains …X–H…X–H…X–H… of halides, where X = F, Cl, Br, I.
Fig. 2.

Schematic of a 2D zigzag polymer chain. ɛϕU(ϕ) and V(ρ) are the valent angle bending and bond stretching potentials, respectively; W(r) is the nonvalent interaction between next-nearest neighbors. The longitudinal step of site n is ln.
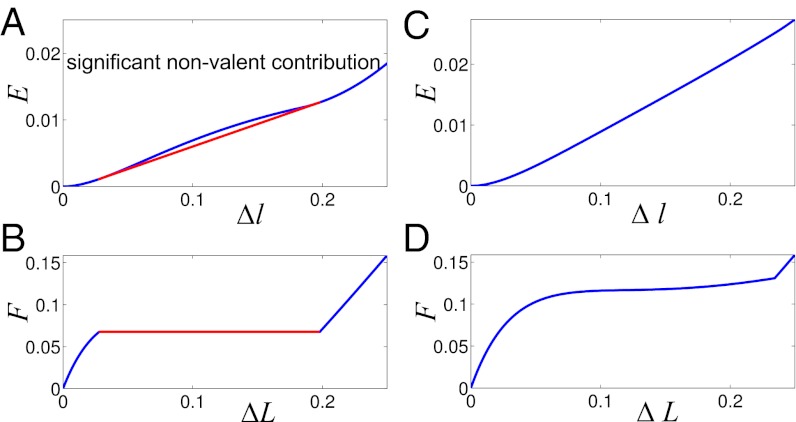
We consider a dimensionless model of 2D zigzag chain (details in Methods and SI Text). In the limiting case of zero angle bending potential ɛϕ = 0 (Fig. 2), only nonvalent interactions between next-nearest neighbors determine elastic response of the chain. Numerical simulations of the zigzag reveal the corresponding effective site deformation energy E(Δl) of a single monomer site (Fig. 3A). The function E(Δl) is not convex; its convex hull is given by a tangent line at points Δla = 0.04 and Δlb = 0.21. According to our general mechanism, a fraction of the zigzag sites is expected to be in the weakly extended state with the longitudinal step l0 + Δla, whereas the rest will be in the strongly extended state with the step l0 + Δlb. The tension force  remains constant between Δla and Δlb, and the force-extension dependence F(ΔL) has the typical plateau (Fig. 3B). The zigzag effective site extension energy E(Δl) remains nonconvex until the strength of the angle potential reaches a critical value (ɛϕ = 0.015). At this point, energetic benefit from nonuniform stretching relative to uniform stretching vanishes. As the angle bending potential becomes even stiffer, its relative contribution to chain stretching overwhelms the contribution of the weak nonvalent interactions that give rise to the nonconvex behavior seen in Fig. 3A. The effective site extension energy function becomes convex (Fig. 3C), and the stretching behavior of the polymer is essentially the same as that of a harmonic spring—single phase and uniform. These scenarios are further illustrated in SI Text for a zigzag chain of n = 400 atoms.
Fig. 3.
(A and C) 2D zigzag effective site deformation energy E(Δl) as a function of site extension Δl from equilibrium. Convex hull of E(Δl) (red line in A) represents two-phase stretching energy per one site,  . (B and D) Dependence of the tension force on mean site extension ΔL. Angle deformation stiffness ɛϕ (Fig. 2) is varied. (Left) ɛϕ = 0. (Right) ɛϕ = 0.02.
Thus, two-phase stretching and force-extension plateaus can be expected to occur in molecular chains in which secondary structure is supported by weak nonvalent interactions. However, if the secondary structure is caused mainly by angle deformation, then the stretching will be uniform. Such a scenario is typical for PE transzigzag (24).
Stretching of the α-Helix.
Consider a 3D molecular chain corresponding to an ideal (1) α-helix (Methods and Fig. 4A).
Fig. 4.
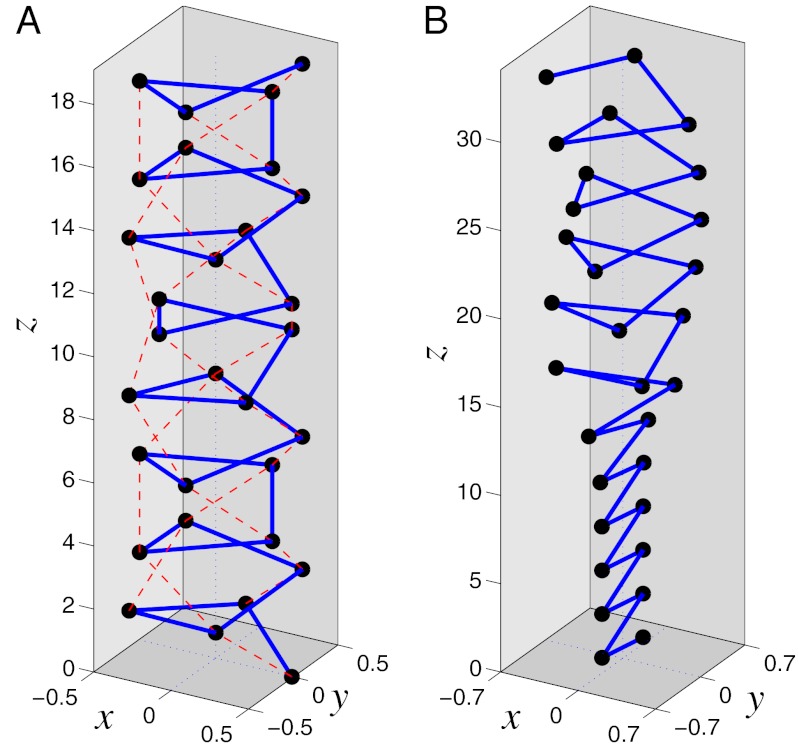
(A) Schematic of an α-helix. Dimensionless units. Helix monomeric sites are shown in their equilibrium positions; solid blue lines denote rigid valent bonds, whereas red dotted lines designate soft hydrogen bonds. (B) Transition between strongly (bottom half) and weakly (top half) stretched parts of the helix.
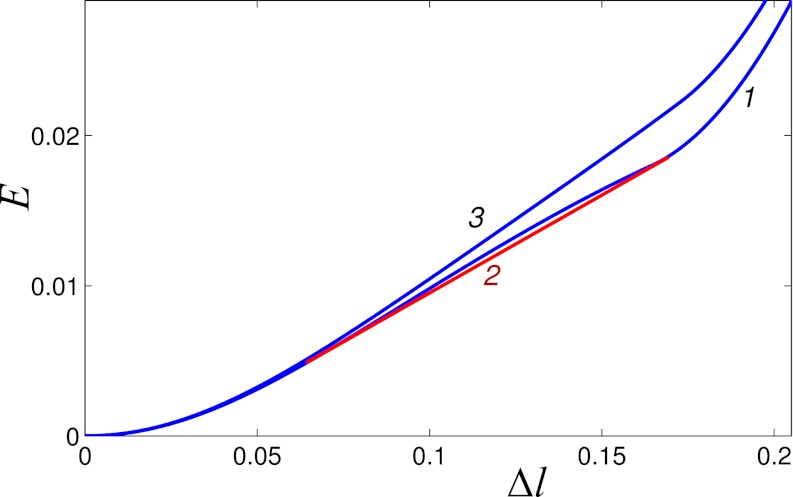
Here, the softest valent potential is the torsional potential; we vary its relative contribution ɛθ to the total energy while keeping the other parameters fixed (Methods). Without the torsional rigidity (ɛθ = 0), the helix is stabilized only by hydrogen bonds, connecting site i with sites (i + 3) and (i − 3) (1, 25, 26). The effective site energy E(Δl) is shown in Fig. 5. On stretching, the helix’s angular step (deformation) monotonously increases and reaches its maximum value 180° when Δl = 0.16 (plane zigzag). The function E(Δl) is not convex (Fig. 5, curve 1). Its convex hull is described by a tangent at points Δla = 0.06 and Δlb = 0.17. According to our general mechanism, a fraction of the helix is in the weakly extended state with the longitudinal step l0 + Δla, whereas the rest is in the strongly extended (plane zigzag) state with the longitudinal step l0 + Δlb. As long as Δla < ΔL < Δlb, the tension in the helix  remains constant, leading to the characteristic plateau in the force-extension diagram. If the torsional rigidity is increased, the nonconvex shape of E(Δl) is preserved until ɛθ = 0.0015 is reached. Beyond ɛθ > 0.0015, the function E(Δl) becomes convex (Fig. 5, curve 3). In this regime, only uniform stretching of the helix is possible.
Fig. 5.
Effective site extension energy E of the helix as a function of longitudinal site extension Δl from equilibrium. Torsion rigidities are ɛθ = 0 (curve 1) and ɛθ = 0.002 (curve 3). The red line 2 is the convex hull of curve 1.
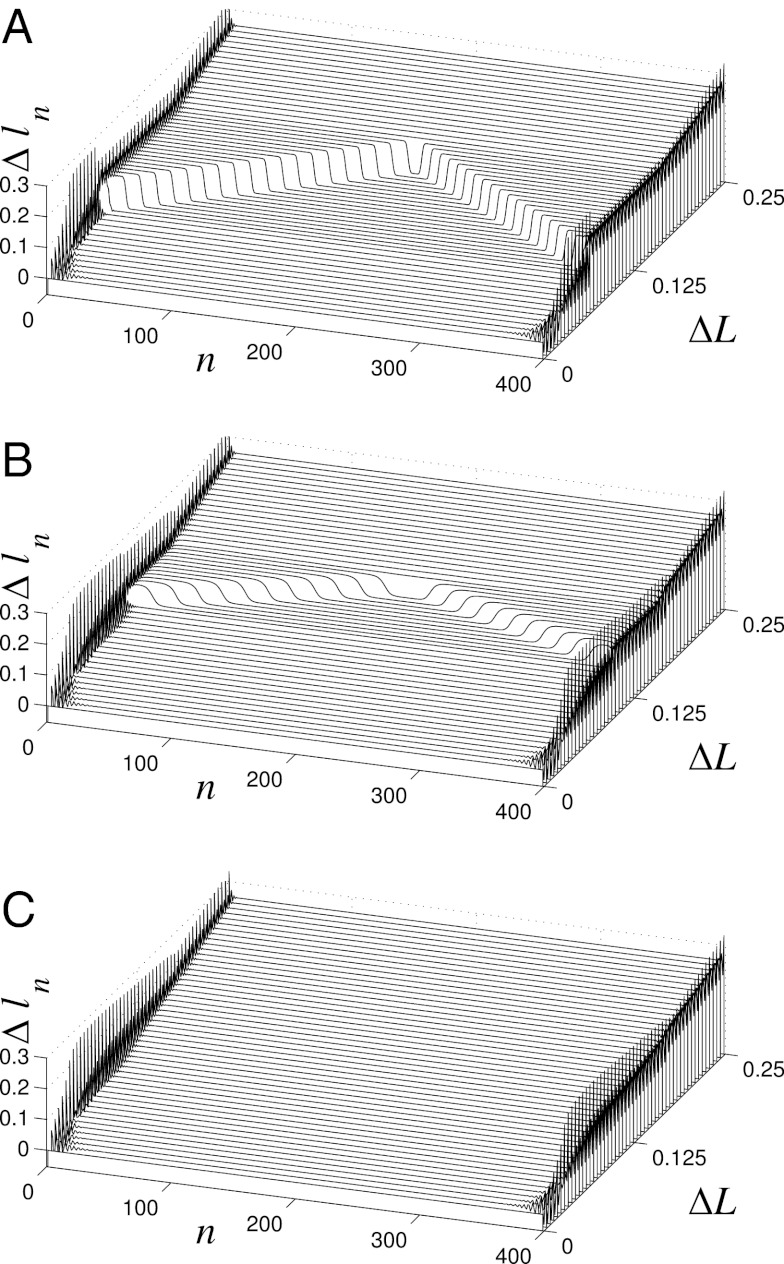
These scenarios are explicitly verified by numerical simulations for a helix consisting of N = 400 sites (Fig. 6). When the torsional rigidity is zero (ɛθ = 0) and nonvalent interactions dominate the elastic response, the stretching is two phase. The distribution of longitudinal extension Δln along the chain completely matches the expectation based on the shape of E(ΔL) function—that is, for ΔL ≤ 0.07, the chain is stretched uniformly, whereas for 0.07 ≤ ΔL ≤ 0.165, nonuniform stretching is observed. The terminal regions of the chain are in a strongly stretched state, whereas the central region is stretched weakly (Fig. 6A). The transition boundary between the states is clearly seen in Fig. 4B. As the helix is extended farther, the weakly stretched central region shrinks and vanishes when ΔL = 0.17. Beyond that point, the helix is stretched uniformly. The domain of the nonuniform stretching regime decreases for higher torsional rigidity ɛθ = 0.0015 (Fig. 6B), and at even higher values, e.g., ɛθ = 0.002, only uniform stretching is observed (Fig. 6C).
Fig. 6.
Distribution of longitudinal extensions Δln of individual sites in a stretched helix of N = 400 sites as a function of the mean (per site) helix extension  . Three values of the torsional rigidity are considered: (A) ɛθ = 0, (B) ɛθ = 0.0015, and (C) ɛθ = 0.002. Dimensionless units.
Thus, if the torsional rigidity is small enough, stretching of the α-helix proceeds through a two-phase scenario with a typical plateau region, where the tension remains constant. The scenario is confirmed by all-atom molecular dynamics simulations (22) and experiments (13, 14). The root cause of the nonuniform stretching in this case is the typical form of the hydrogen bond potential (4), which has an inflection point. In contrast, polymer helices that have no hydrogen bonds, such as polytetrafluoroethylene helix, are expected to stretch uniformly, without force-extension plateaus.
Stretching of the DNA Double Helix.
The coarse-grained model (27, 28) used here to simulate stretching of the DNA double helix (dsDNA) is semiatomistic: each nucleotide consists of six united atom particles—three for the sugar-phosphate backbone and three for the nucleobase (Methods and SI Text).
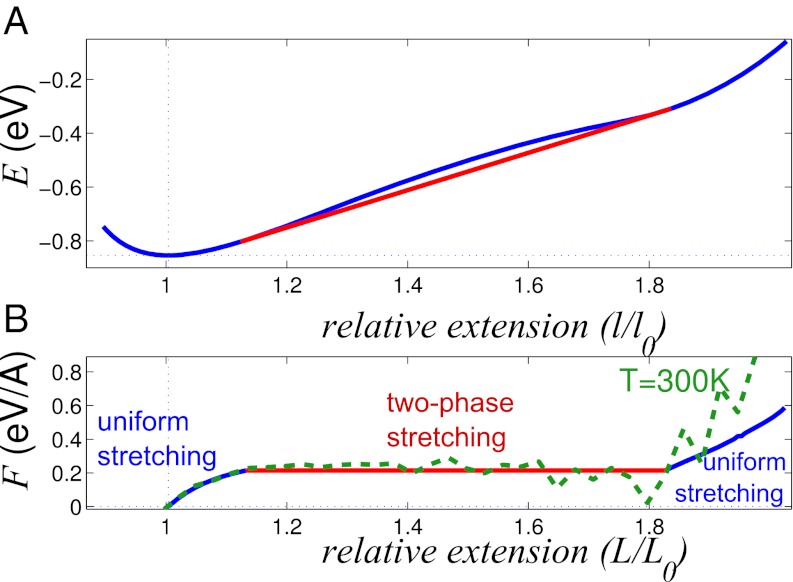
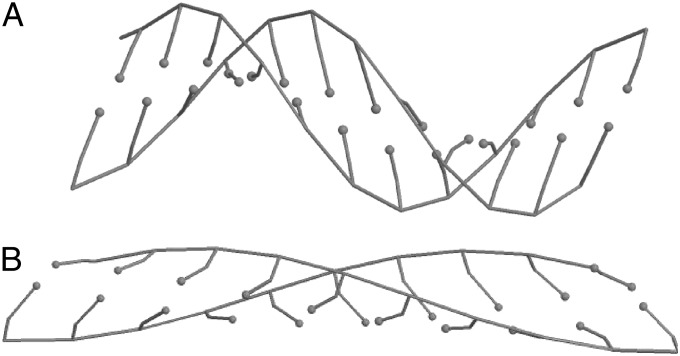
The corresponding effective site (base pair) energy E(l) as a function of relative site extension is shown in Fig. 7A. To facilitate direct comparison with experiment, the energy is taken to depend on the relative extension l/l0 instead of absolute deviation Δl from equilibrium base pair length l0; l0 = 3.352 Å calculated within our model agrees with the experimental value for B- form of DNA. The function E(l/l0) is nonconvex between points la/l0 = 1.12 and lb/l0 = 1.84, and its convex hull is shown by red line in Fig. 7A. Thus, when the mean relative site extension L/l0 of a stretched dsDNA fragment is between the above two values, a part of the double helix is in the weakly extended state with the longitudinal step la (Fig. 8A), whereas the rest of the base pairs are in the strongly extended state with longitudinal step lb (Fig. 8B). The corresponding force-extension diagram of the chain is shown in Fig. 7B.
Fig. 7.
(A) Blue, effective energy E(l/l0) per base pair of extended poly(A)-poly(T) DNA ground state. Red, the convex hull of E(l/l0). (B) The tension as a function of the relative chain extension. Blue and red, in the ground state; green dashed, at T = 300 K.
Fig. 8.
Structure of dsDNA fragment in (A) weakly stretched (longitudinal step is l = la = 3.75 Å) state and (B) strongly stretched (longitudinal step is l = lb = 6.15 Å) state. Minimum energy (ground) states are shown.
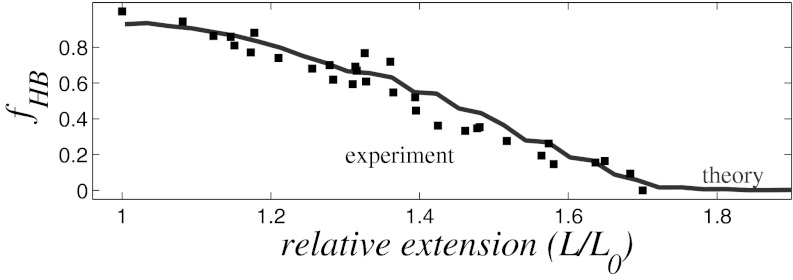
The proposed nonuniform stretching mechanism, so far explored without taking into account thermal fluctuations, holds at room temperature: only the range of the dsDNA overstretching plateau increases slightly (Fig. 7B, green dashed line). Critically, the room temperature value of the tension at the plateau coincides with the value obtained from the analysis of the minimum energy (ground) states described above. As the model chain stretches at room temperature, thermal fluctuations cause the WC hydrogen bonds to break, as expected from experiment (Fig. 9). In the plateau regime, the DNA double helix consists of two fractions: a slightly stretched helix with hydrogen bonds intact and a strongly stretched helix with some hydrogen bonds broken (see SI Text). This exact behavior is observed in all-atom simulations (29, 30).
Fig. 9.
Fraction of remaining hydrogen bonds, fHB, as a function of relative dsDNA extension. Solid line, simulation at 300 K; black squares, experiment (19).
An important question arises whether the breaking of the hydrogen bonds between complementary bases is necessary (10, 11, 17, 18) for the observed overstretching plateau, or if the unzipping of the helix is simply the consequence of the helix stretching. Our analysis clearly shows that WC bond breaking is not necessary for the appearance of the overstretching plateau. First, the two-phase stretching behavior of dsDNA and the force-extension plateau (Fig. 7B) with virtually the same characteristics exist in the absence of thermal fluctuations when hydrogen bonds are only weakened in the strongly stretched regime but not yet broken. Second, in a computational experiment in which the bond strength is artificially doubled to prevent breaking of WC bonds at room temperature, we find virtually the same plateau (see SI Text). These observations explain the somewhat puzzling result of a recent single-molecule experiment, in which torsionally relaxed DNA exhibited the same overstretching plateau when its unzipping was inhibited (31). In the case of the dsDNA, it is mainly the base stacking deformations that give the effective stretching energy its nonconvex shape that are ultimately responsible for the onset of the two-phase stretching with the characteristic plateau (see SI Text). Mathematically, base stacking is described by a combination of power law functions—Coulomb and Lennard–Jones potentials—that give it the nonconvex shape.
The plateau in dsDNA force-extension diagram was observed previously in single-molecule stretching experiments (4, 5); the plateau was found in the range of (relative) extensions 1.1 < L/l0 < 1.7. The position of the plateau agrees well with our result 1.12 < L/l0 < 1.84 (Fig. 7B). The value of the plateau transition force within our model is 0.2 eV/A = 320 pN, which is somewhat higher than experimental estimates. A typical value of the force is often reported to be about 65 ÷ 70 pN (4, 5, 19); however, one should keep in mind that the experimental value was obtained in the type of experiment where the DNA strands are pulled by the same type (3′ or 5′) end, whereas the other two ends remain free. In contrast, the simulations reported here correspond to uniform pulling by all four ends. Experimentally, larger values of the plateau tension were reported under the uniform pulling scenario: 105 ÷ 120 pN (19, 32). Although this value is still less than one-half of the 320 pN predicted by our model, we note that the above experiment used a specific, nonhomogeneous sequence. Many DNA properties are strongly sequence-dependent: for example, pure poly(dG-dC) and poly(dA-dT) DNA sequences yield tension values at the plateau that differ by a factor of two (32). Thus, only semiquantitative agreement of our homogeneous (poly-A) model with the above experiments may be expected. Reported differences between earlier estimates based on all-atom room temperature molecular dynamics simulations and experimental values are also of the same order (5, 20); therefore, the numerical agreement that we have obtained with experiment can be considered as reasonable.
Conclusion
Although all polymers behave very similarly to each other under weak tension, where their elastic properties are entropic in nature and virtually independent of the structure of the monomers, striking differences are observed in experiments when stronger forces are applied and short-scale details start to dominate. We show that these differences can be explained by a very general mechanism based on convexity of the (effective) deformation energy function of individual monomers. We show that, when this energy is a convex function of the extension, the chain stretching is single-phase uniform without a plateau in the force-extension diagram. The scenario is realized in polymers such as polyethylene, whose structure is supported by strong covalent interactions. In contrast, when the secondary structure of a polymer is mostly caused by weak noncovalent interactions, the deformation function may become nonconvex, leading to two-phase stretching: a part of the chain is stretched weakly, whereas the other part is stretched strongly. In this regime, extension of the whole chain proceeds by increasing of the fraction of the strongly stretched sites, and therefore, the tension remains constant. The force-stretching diagram has the characteristic plateau seen in experiment. Examples include α-helix polypeptide and DNA double helix, consistent with earlier observations based on all-atom molecular dynamics simulations and previous single-molecules experiments. We illustrate the general mechanism by numerical simulations based on realistic coarse-grained models and atomistic potentials of several polymers from planar zigzag to the more complex helix and B-DNA. Numerical modeling is in complete agreement with the general mechanism and acceptable agreement with experiment.
The main strengths of the proposed theory are its complete generality and direct connection to microscopic structure of the monomers. Our framework applies to any polymer in the strong deformation regime where short-scale details dominate—to the best of our knowledge, no such universal description was available before. Although division of the polymer into two stretching phases was discussed earlier in the context of phenomenological models (21, 23), the second equilibrium state was assumed to exist and be known a priori. Within our framework, no assumptions of multiple stable equilibrium states (13, 21) or additional kinetic arguments are necessary (21).
Methods
Computing the Force-Extension Diagram.
The effective site deformation energy function E(Δl) (Fig. 1) is found by minimizing the total potential energy H of the chain under the constraint that each site is stretched by the same amount Δl:  . This definition of E(Δl) includes contributions from both short-range interactions within each site and short- and long-range interactions between the sites.
Next, we consider the same chain of N ≫ 1 effective sites but without the Δli = Δl constraint (that is, with the possibility of nonuniform extension). The dependence of the mean chain energy  on its mean longitudinal extension
  is found by minimizing the total energy of the chain H under the condition of fixed total deformation
  :
:  . The resulting function
  is the convex hull of the effective site deformation energy E(Δl) (SI Text). Unless otherwise specified, the extension force (tension) is obtained as
  . No torsional constraints are imposed in any case. Unless otherwise stated, polymer chain is modeled as quasi-1D crystal (SI Text).
2D Plane Zigzag.
The 2D zigzag chain (Fig. 2) is specified by the distance between its neighboring sites ρ0 and the zigzag angle ϕ0 (equilibrium longitudinal step is  ). We consider dimensionless zigzag model, and details of its parameters values are given in refs. 33–35 and SI Text.
The chain potential energy is given by
 |
where V(ρn) is the valent bond energy between neighboring atoms n and (n + 1) separated by distance ρn.
 |
has the bond rigidity K = 2. The ɛϕU(ϕn) term is the deformation energy of the angle between atoms (n − 1), n, and (n + 1), where ɛϕ ≥ 0 is the angle deformation stiffness:
The last term W(rn) corresponds to weak nonvalent interaction between atoms n and (n + 2) (next-nearest neighbors) separated by rn; its form is typical for nonvalent interactions, and it may be used for description of hydrogen bonds and van der Waals interactions alike:
 |
where ɛhb ≥ 0 is the interaction energy, r0 = 2hx = 1.633 is the equilibrium length, and d = 0.5 is the diameter of the inner hard core. The balance between valent and nonvalent interactions is varied by changing the angle stiffness ɛϕ, while keeping other interactions fixed.
α-Helix.
The model that we describe here (Fig. 4A) is similar to the ones (25, 26) used previously for analysis of ultrasonic soliton motion. The equilibrium atomic helix coordinates
with n = 0, ±1, ±2, … being the atom number, R0 being the helical radius, φ0 and l0 being the angular and longitudinal helix periods.
The chain potential energy is
 |
The term V(ρn) gives the energy of interaction between neighbor sites n and (n + 1), where ρn is the distance between them. The angle deformation energy is described by ɛϕU(ϕn), where ϕn is the angle between sites (n − 1), n, and (n + 1) (the vertex is on site n). The third term ɛθ Z(θn) is the energy of the torsional deformation (rotation) around nth bond:
where ɛθ ≥ 0 is torsional rigidity; different values of ɛθ are considered while keeping other interactions fixed. The function W(rn) is the energy of the nth hydrogen bond connecting sites n and (n + 3). We consider a dimensionless model of the helix (specific parameters in SI Text). The bond deformation energy is described by the potential (2) with the rigidity K = 10. Hydrogen bond energy is given by Eq. 4, and angle deformation energy is described by ref. 3.
DNA Double Helix.
The potential energy of the double helix consists of four terms:
The first two terms describe deformation energy of complementary strands A and B, respectively, within the 12CG coarse-grained model (27). These terms include essentially the same energetic contributions as in the case of the α-helix: internal energy (bond stretching, angle bending, and torsion twisting) plus nonvalent interaction between the grains within the same strand. The last two terms are nonvalent interactions: Est is between two neighboring base pairs, and  is between two complementary bases (within the same base pair), including hydrogen bonds.
Within the framework of our coarse-grained model (27), the nitrogen bases are treated most accurately at all-atom level. WC hydrogen bonds and stacking interactions are modeled by Coulomb and van der Waals potentials taken from current all-atom AMBER (36) force field widely used to model nucleic acids. To make the computations feasible, solvent effects are treated by the so-called implicit solvation model (37) at the generalized Born level often used in all-atom simulations of DNA (38). Within the model, water is treated as a continuum with the (room temperature) dielectric and hydrophobic properties of water; screening effect of salt ions is also taken into account. Hydrogen bonding with the solvent is present, albeit in an average sense. The balance between solute–solute and solute–solvent h-bond strength is controlled by adjusting Ehb—the interactions between complementary bases taken from the all-atom AMBER-explicit solvent force field (36). Here, we use  , with c0 = 0.4, which leads to quantitative agreement with experiment (Fig. 9). Additional details of the calculation can be found in ref. 27 and SI Text. To avoid sequence dependence issues that do not affect the basic physics, we consider homogeneous poly(A)-poly(T) sequence.
The tension at T = 300 K (Fig. 7B) is obtained as  , where 〈〉 denotes ensemble averaging over a molecular dynamics trajectory. The simulation used a 500-bp poly(A)-poly(T) fragment in the 12CG coarse-grained representation (SI Text). The same trajectory was used to obtain results in Fig. 9.
Supplementary Material
Acknowledgments
The authors thank Erwin J. G. Peterman for helpful discussion and providing the experimental data points in Fig. 9. This research was supported by Russian Foundation of Basic Research Grant 08-04- 91118-a, Civilian Research and Development Foundation Grant RUB2-2920-MO-07, and in part, National Institutes of Health Grant GM076121 (to A.V.O.).
Footnotes
The authors declare no conflict of interest.
This article is a PNAS Direct Submission.
This article contains supporting information online at www.pnas.org/lookup/suppl/doi:10.1073/pnas.1218677110/-/DCSupplemental.
References
- 1.Grosberg AY, Khokhlov A. Statistical Physics of Macromolecules. New York: American Institute of Physics; 1994. [Google Scholar]
- 2.Marko JF, Siggia ED. Stretching DNA. Macromolecules. 1995;28(26):8759–8770. [Google Scholar]
- 3.Rief M, Oesterhelt F, Heymann B, Gaub HE. Single molecule force spectroscopy on polysaccharides by atomic force microscopy. Science. 1997;275(5304):1295–1297. doi: 10.1126/science.275.5304.1295. [DOI] [PubMed] [Google Scholar]
- 4.Smith SB, Cui Y, Bustamante C. Overstretching B-DNA: The elastic response of individual double-stranded and single-stranded DNA molecules. Science. 1996;271(5250):795–799. doi: 10.1126/science.271.5250.795. [DOI] [PubMed] [Google Scholar]
- 5.Cluzel P, et al. DNA: An extensible molecule. Science. 1996;271(5250):792–794. doi: 10.1126/science.271.5250.792. [DOI] [PubMed] [Google Scholar]
- 6.Allemand JF, Bensimon D, Lavery R, Croquette V. Stretched and overwound DNA forms a Pauling-like structure with exposed bases. Proc Natl Acad Sci USA. 1998;95(24):14152–14157. doi: 10.1073/pnas.95.24.14152. [DOI] [PMC free article] [PubMed] [Google Scholar]
- 7.Garcia HG, et al. Biological consequences of tightly bent DNA: The other life of a macromolecular celebrity. Biopolymers. 2007;85(2):115–130. doi: 10.1002/bip.20627. [DOI] [PMC free article] [PubMed] [Google Scholar]
- 8.Bustamante C, Chemla YR, Forde NR, Izhaky D. Mechanical processes in biochemistry. Annu Rev Biochem. 2004;73:705–748. doi: 10.1146/annurev.biochem.72.121801.161542. [DOI] [PubMed] [Google Scholar]
- 9.Nelson P. Transport of torsional stress in DNA. Proc Natl Acad Sci USA. 1999;96(25):14342–14347. doi: 10.1073/pnas.96.25.14342. [DOI] [PMC free article] [PubMed] [Google Scholar]
- 10.Williams MC, Pant K, Rouzina I, Karpel RL. Single molecule force spectroscopy studies of DNA denaturation by T4 gene 32 protein. Spectroscopy. 2004;18(2):203–211. [Google Scholar]
- 11.McCauley MJ, Williams MC. Optical tweezers experiments resolve distinct modes of DNA-protein binding. Biopolymers. 2009;91(4):265–282. doi: 10.1002/bip.21123. [DOI] [PMC free article] [PubMed] [Google Scholar]
- 12.Gross P, et al. Quantifying how DNA stretches, melts and changes twist under tension. Nat Phys. 2011;7(September 2011):731–736. [Google Scholar]
- 13.Schwaiger I, Sattler C, Hostetter DR, Rief M. The myosin coiled-coil is a truly elastic protein structure. Nat Mater. 2002;1(4):232–235. doi: 10.1038/nmat776. [DOI] [PubMed] [Google Scholar]
- 14.Afrin R, Takahashi I, Shiga K, Ikai A. Tensile mechanics of alanine-based helical polypeptide: Force spectroscopy versus computer simulations. Biophys J. 2009;96(3):1105–1114. doi: 10.1016/j.bpj.2008.10.046. [DOI] [PMC free article] [PubMed] [Google Scholar]
- 15.Ritort F. Single-molecule experiments in biological physics: Methods and applications. J Phys Condens Matter. 2006;18(32):R531–R583. doi: 10.1088/0953-8984/18/32/R01. [DOI] [PubMed] [Google Scholar]
- 16.Bustamante C, Smith SB, Liphardt J, Smith D. Single-molecule studies of DNA mechanics. Curr Opin Struct Biol. 2000;10(3):279–285. doi: 10.1016/s0959-440x(00)00085-3. [DOI] [PubMed] [Google Scholar]
- 17.Rouzina I, Bloomfield VA. Force-induced melting of the DNA double helix 1. Thermodynamic analysis. Biophys J. 2001;80(2):882–893. doi: 10.1016/S0006-3495(01)76067-5. [DOI] [PMC free article] [PubMed] [Google Scholar]
- 18.Rouzina I, Bloomfield VA. Force-induced melting of the DNA double helix. 2. Effect of solution conditions. Biophys J. 2001;80(2):894–900. doi: 10.1016/S0006-3495(01)76068-7. [DOI] [PMC free article] [PubMed] [Google Scholar]
- 19.van Mameren J, et al. Unraveling the structure of DNA during overstretching by using multicolor, single-molecule fluorescence imaging. Proc Natl Acad Sci USA. 2009;106(43):18231–18236. doi: 10.1073/pnas.0904322106. [DOI] [PMC free article] [PubMed] [Google Scholar]
- 20.Lebrun A, Lavery R. Modelling extreme stretching of DNA. Nucleic Acids Res. 1996;24(12):2260–2267. doi: 10.1093/nar/24.12.2260. [DOI] [PMC free article] [PubMed] [Google Scholar]
- 21.Rief M, Fernandez JM, Gaub HE. Elastically coupled two-level systems as a model for biopolymer extensibility. Phys Rev Lett. 1998;81(21):4764–4767. [Google Scholar]
- 22.Zegarra FC, Peralta GN, Coronado AM, Gao YQ. Free energies and forces in helix-coil transition of homopolypeptides under stretching. Phys Chem Chem Phys. 2009;11(20):4019–4024. doi: 10.1039/b820021a. [DOI] [PubMed] [Google Scholar]
- 23.Storm C, Nelson PC. Theory of high-force DNA stretching and overstretching. Phys Rev E Stat Nonlin Soft Matter Phys. 2003;67(5 Pt 1):051906–051906. doi: 10.1103/PhysRevE.67.051906. [DOI] [PubMed] [Google Scholar]
- 24.Zarkhin LS, Sheberstov SV, Panfilovich NV, Manevitch LI. Mechanodegradation of polymers. The method of molecular dynamics. Russ Chem Rev. 1989;58(4):381–393. [Google Scholar]
- 25.Christiansen PL, Zolotaryuk AV, Savin AV. Solitons in an isolated helix chain. Phys Rev E Stat Phys Plasmas Fluids Relat Interdiscip Topics. 1997;56(1):877–889. doi: 10.1103/physreve.54.3881. [DOI] [PubMed] [Google Scholar]
- 26.Savin AV, Manevitch LI. Solitons in spiral polymeric macromolecules. Phys Rev E Stat Phys Plasmas Fluids Relat Interdiscip Topics. 2000;61(6 Pt B):7065–7075. doi: 10.1103/physreve.61.7065. [DOI] [PubMed] [Google Scholar]
- 27.Savin AV, Mazo MA, Kikot IP, Manevitch LI, Onufriev AV. Heat conductivity of the DNA double helix. Phys Rev B. 2011;83(24):245406. doi: 10.1103/PhysRevB.83.245406. [DOI] [PMC free article] [PubMed] [Google Scholar]
- 28.Kikot I, et al. New coarse-grained DNA model. Biophysics (Oxf) 2011;56(3):387–392. [PubMed] [Google Scholar]
- 29.Harris SA, Sands ZA, Laughton CA. Molecular dynamics simulations of duplex stretching reveal the importance of entropy in determining the biomechanical properties of DNA. Biophys J. 2005;88(3):1684–1691. doi: 10.1529/biophysj.104.046912. [DOI] [PMC free article] [PubMed] [Google Scholar]
- 30.Li H, Gisler T. Overstretching of a 30 bp DNA duplex studied with steered molecular dynamics simulation: Effects of structural defects on structure and force-extension relation. Eur Phys J E Soft Matter. 2009;30(3):325–332. doi: 10.1140/epje/i2009-10524-5. [DOI] [PubMed] [Google Scholar]
- 31.Paik DH, Perkins TT. Overstretching DNA at 65 pN does not require peeling from free ends or nicks. J Am Chem Soc. 2011;133(10):3219–3221. doi: 10.1021/ja108952v. [DOI] [PubMed] [Google Scholar]
- 32.Clausen-Schaumann H, Rief M, Tolksdorf C, Gaub HE. Mechanical stability of single DNA molecules. Biophys J. 2000;78(4):1997–2007. doi: 10.1016/S0006-3495(00)76747-6. [DOI] [PMC free article] [PubMed] [Google Scholar]
- 33.Zolotaryuk AV, Christiansen PL, Savin AV. Two-dimensional dynamics of a free molecular chain with a secondary structure. Phys Rev E Stat Phys Plasmas Fluids Relat Interdiscip Topics. 1996;54(4):3881–3894. doi: 10.1103/physreve.54.3881. [DOI] [PubMed] [Google Scholar]
- 34.Manevitch LI, Savin AV. Solitons in crystalline polyethylene: Isolated chains in the transconformation. Phys Rev E Stat Phys Plasmas Fluids Relat Interdiscip Topics. 1997;55(4):4713–4719. [Google Scholar]
- 35.Savin AV, Manevich LI, Christiansen PL, Zolotaryuk AV. Nonlinear dynamics of zigzag molecular chains. Physics Uspekhi. 1999;42(3):245–260. [Google Scholar]
- 36.Case DA, et al. The Amber biomolecular simulation programs. J Comput Chem. 2005;26(16):1668–1688. doi: 10.1002/jcc.20290. [DOI] [PMC free article] [PubMed] [Google Scholar]
- 37.Honig B, Nicholls A. Classical electrostatics in biology and chemistry. Science. 1995;268(5214):1144–1149. doi: 10.1126/science.7761829. [DOI] [PubMed] [Google Scholar]
- 38.Tsui V, Case D. Molecular dynamics simulations of nucleic acids using a generalized Born solvation model. J Am Chem Soc. 2000;122(11):2489–2498. [Google Scholar]
Associated Data
This section collects any data citations, data availability statements, or supplementary materials included in this article.


