

Abstract
Biologically produced alkanes represent potential renewable alternatives to petroleum-derived chemicals. A cyanobacterial pathway consisting of acyl–Acyl Carrier Protein reductase and an aldehyde-deformylating oxygenase (ADO) converts acyl–Acyl Carrier Proteins into corresponding n-1 alkanes via aldehyde intermediates in an oxygen-dependent manner (Km for O2, 84 ± 9 µM). In vitro, ADO turned over only three times, but addition of more ADO to exhausted assays resulted in additional product formation. While evaluating the peroxide shunt to drive ADO catalysis, we discovered that ADO is inhibited by hydrogen peroxide (H2O2) with an apparent Ki of 16 ± 6 µM and that H2O2 inhibition is of mixed-type with respect to O2. Supplementing exhausted assays with catalase (CAT) restored ADO activity, demonstrating that inhibition was reversible and dependent on H2O2, which originated from poor coupling of reductant consumption with alkane formation. Kinetic analysis showed that long-chain (C14–C18) substrates follow Michaelis–Menten kinetics, whereas short and medium chains (C8–C12) exhibit substrate inhibition. A bifunctional protein comprising an N-terminal CAT coupled to a C-terminal ADO (CAT–ADO) prevents H2O2 inhibition by converting it to the cosubstrate O2. Indeed, alkane production by the fusion protein is observed upon addition of H2O2 to an anaerobic reaction mix. In assays, CAT–ADO turns over 225 times versus three times for the native ADO, and its expression in Escherichia coli increases catalytic turnovers per active site by fivefold relative to the expression of native ADO. We propose the term “protection via inhibitor metabolism” for fusion proteins designed to metabolize inhibitors into noninhibitory compounds.
Keywords: adlehyde decarbonylase, diiron enzyme, dinuclear iron, enzyme regulation
The production of renewable liquid biofuels is an industrial imperative, and many methods and fuel types are being explored. Alkanes are major constituents of our current fossil-derived fuels and also appear in nature as products of biosynthesis. Therefore, alkanes represent attractive targets for engineering large-scale biofuel production. Early studies of alkane biosynthesis described the conversion of fatty aldehydes (ALDs) to alkanes by integral membrane proteins (1–3), and the ECERIFERUM1 (CER1) gene of Arabidopsis has been found to encode this activity (4–6). Unfortunately, the details of alkane biosynthesis have remained unresolved due to the difficulties associated with biochemical analyses of membrane proteins.
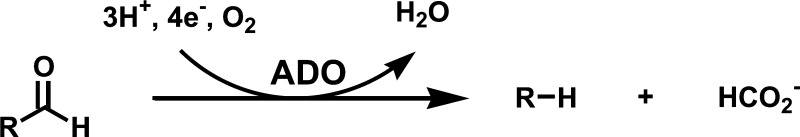
The recent discovery (7) of a soluble aldehyde-deformylating oxygenase (ADO, formerly known as aldehyde decarbonylase) in cyanobacteria that converts free aldehydes to the corresponding n-1 alkane has reinvigorated the study of alkane biosynthesis. The soluble ADO is homologous to a number of oxygen-dependent soluble diiron enzymes, including methane monooxygenase (MMO) and acyl–ACP desaturases, whereas the membrane-bound aldehyde decarbonylase CER1 is homologous to the oxygen-dependent membrane class of diiron desaturase enzymes (7). Cyanobacterial ADOs are readily purified from heterologous expression systems, are active in vitro, and a crystal structure of the enzyme was determined as part of a structural genomics effort (Protein Data Bank 2OC5, Joint Center for Structural Genomics). ADO converts aldehydes to n-1 alkanes with the aldehyde C1 released as formic acid (8, 9). Electrons required for the reaction can be provided by NADPH via ferredoxin-NADP reductase (FNR), and ferredoxin (Fd) (7), or via the chemical mediator phenazine methosulfate (PMS) (10). A proposed reaction scheme for ADO (adapted from ref. 9) is depicted below where R represents Acyl:
ADO has been reported to catalyze mechanistically distinct oxygen-dependent (8) and oxygen-independent (10) production of alkanes, although there is some uncertainty regarding the anaerobic mechanism (11) and a recent publication has provided evidence for only oxygen-dependent activity (12). In vitro, ADO exhibits poor catalytic activity and so far has yielded only 3–5 catalytic turnovers per active site, regardless of the assay system (9, 10) posing a serious barrier to its further study.
An in-depth biochemical characterization of ADO is crucial if we wish to understand and improve this enzyme, and we embarked on a study to optimize the in vitro ADO assay and determine its kinetic parameters. Unexpectedly we found that ADO is reversibly inhibited by hydrogen peroxide (H2O2). Catalase, when included in enzyme reactions, was able to either prevent or relieve H2O2 inhibition. A fusion protein encoding catalase and ADO domains separated by a flexible linker increases enzyme catalytic turnover by approximately two orders of magnitude relative to ADO alone by converting its inhibitor (H2O2) into a cosubstrate (O2).
Results
Previous reports have found that ADOs are capable of ∼3–5 catalytic turnovers (9, 10, 12). We observed a very similar result with Prochlorococcus marinus ADO, using Zea mays ferredoxin NADP(H) oxidoreductase (FNR), Anabaena sp. pyridinum chlorochromate (PCC) 7120 vegetative Fd, and NADPH to supply electrons (Fig. 1A), except that our reactions appeared to be exhausted by 15 min, whereas the previously reported incubations were for many hours (9, 10). However, supplementing an exhausted reaction with additional ADO caused more product to accumulate (Fig. 1A). In contrast, adding extra NADPH, Fd, or FNR, or a combination of the three, did not result in additional product accumulation (Fig. 1A). From this we conclude that ADO becomes inactivated upon incubation with the other assay components.
Fig. 1.

ADO is inactivated after three catalytic turnovers by H2O2 during in vitro enzyme reactions. (A) ADO catalytic turnovers after adding more NADPH (+NADPH), +FNR, +Fd, the entire ETC (+ETC; NADPH, FNR, and Fd), or more ADO (+ADO) to the reaction after 15 min. (B) ADO catalytic turnovers in the absence or presence of catalase. (C) ADO catalytic turnovers after adding more ADO protein or catalase to the reaction after 15 min. (D) ADO catalytic turnovers in the presence of catalase or H2O2 with NADPH, FNR, and Fd or with PMS and NADH reducing systems. All reactions contained 200 µM 18 carbon aldehyde (18-ALD). All data are the mean ± SD (n = 3).
In an attempt to simplify the assay system, we tried to replace the electron transport components NADPH, Fd, and FNR with hydrogen peroxide (H2O2). The rationale was that MMO, a structurally related diiron protein, can bind and perform a 2e− reduction of molecular oxygen to form an enzyme-bound peroxo intermediate, or in the absence of molecular oxygen and electron transport system can become activated by a peroxide shunt in which H2O2, the 2e− reduced form of molecular oxygen, binds directly to the active site (13). Addition of H2O2 to enzyme reactions in place of FNR, Fd, and NADPH did not support ADO activity; indeed the addition of H2O2 actually inhibited reactions that contained FNR, Fd, and NADPH (Table 1).
Table 1.
Reversible Inhibition of ADO by H2O2
| Relative activity* after H2O2 incubation† |
|||
| H2O2 (mM) | Catalase | Immediate | 10 min |
| 0 | No | 100 ± 5.1 | 83 ± 1.9 |
| 1 | No | 19 ± 1.9 | 5.8 ± 0.3 |
| 10 | No | 4.7 ± 1.3 | 6.8 ± 1.3 |
| 0 | Yes | 100 ± 7.7 | 103 ± 4.9 |
| 1 | Yes | 96 ± 3.2 | 105 ± 13 |
| 10 | Yes | 89 ± 4.1 | 74 ± 9.5 |
*Activity relative to 0 mM H2O2 controls.
†Time of H2O2 incubation after which buffer or catalase was added. Reactions were initiated with substrate 1 min after the addition of catalase and proceeded for 15 min. Values are the mean ± SD, n = 3.
Because H2O2 appeared to inhibit ADO, catalase (which converts 2H2O2 to 2H2O + O2) was added to in vitro reactions. The addition of catalase immediately after the addition of H2O2 prevented inhibition of the enzyme (Table 1). The addition of catalase after a 10 min preincubation with H2O2 restored ADO activity, demonstrating that inhibition by H2O2 is reversible (Table 1). The presence of catalase allowed ADO to remain active, producing a linear rate of product formation for at least 30 min and a catalytic turnover of ∼10 compared with saturation at ∼3 in the absence of catalase (Fig. 1B). When added to an exhausted ADO assay, catalase fully restored ADO enzyme activity, proving the observed cessation of ADO activity resulted from the accumulation of H2O2 (Fig. 1C). Assays in which the chemical mediator PMS was used in place of Fd and FNR exhibited H2O2 inhibition similar to that observed in Fd/FNR–mediated reactions (Fig. 1D). During in vitro reactions, H2O2 is produced by reduction of O2 from uncoupled NADPH consumption by the electron transport components (principally Fd) contained in the ADO reaction (Table 2). We note that the use of PMS resulted in a similar accumulation of H2O2 and inhibition of ADO to that observed for FNR, Fd, and NADPH.
Table 2.
H2O2 production during in vitro ADO assays
| Reaction components | NADPH consumed* (μM) | H2O2 produced† (μM) | 15-ALK produced‡ (μM) |
| NADPH | 29 ± 13 | 8 ± 0.5 | n.d. |
| NADPH/FNR | 36 ± 4.6 | 26 ± 4.6 | n.d. |
| NADPH/FNR/Fd | 158 ± 15 | 147 ± 5.2 | n.d. |
| NADPH/FNR/Fd/ADO | 143 ± 28 | 142 ± 5.1 | n.d. |
| NADPH/FNR/Fd/ADO/16-ALD | 167 ± 19 | 124 ± 3.2 | 14 ± 1.2 |
Enzyme reactions were set up essentially as described in Materials and Methods, except that only the reaction components listed were included. ADO concentration was 5 μM. Reactions were 15 min each. n.d., not determined.
*NADPH consumption was monitored by measuring the absorbance at 340 nm.
†H2O2 production was determined with Amplex Red dye (Invitrogen) using the manufacturer’s protocol.
‡15-ALK (product) formation was measured by GC/MS as described in Materials and Methods.
Inhibition of ADO by H2O2 was investigated in more detail, and found to be dose dependent and saturable (Fig. 2A). A proposed mechanism for ADO under aerobic conditions includes the formation of a peroxo intermediate after O2 binding to the diiron active site (8). We therefore hypothesized that H2O2 should compete with oxygen for binding to the diiron site. To test this, H2O2 inhibition was measured under various O2 concentrations. Fig. 2A shows that the degree of inhibition is inversely proportional to the O2 concentration. Further analysis of these data by double reciprocal plot indicates mixed-type inhibition in which H2O2 binding can occur before or after O2 (Fig. 2B). The Ki for H2O2 can be calculated using the data presented in Fig. 2A if the Km for O2 is known. The Km for oxygen has not been reported, and there is a lack of clarity in the literature as to whether ADO requires molecular oxygen for catalysis (10–12). We therefore first performed a rigorous experiment to test whether molecular oxygen is required for catalysis (Fig. 2C). A Schlenk line and BASF O2-scrubbing catalyst was used to exchange O2-free argon for air by repeated cycles of vacuum/incubation with O2-free argon to create a strictly anaerobic ADO reaction sample. As a positive control, one-third of the sample was transferred to a container open to the atmosphere, NADPH was added, and the sample incubated for 15 min before termination of the reaction. The balance of the anaerobic ADO reaction mixture was supplemented with an anaerobic NADPH solution. After 15 min, half of the reaction incubated under anaerobic conditions was terminated, and the balance of the anaerobic reaction was then exposed to the atmosphere for an additional 15 min before termination. Fig. 2C shows that ADO is inactive under anaerobic conditions, but regains activity upon the reintroduction of air, demonstrating that molecular oxygen is required for ADO activity under the conditions used here. To substantiate this, enzyme activity (in the presence of catalase) was then determined using a range of O2 concentrations. The reaction followed Michaelis–Menten kinetics with a Km of 83.6 ± 8.5 µM (Fig. 2D), supporting our contention that O2 is a cosubstrate for the ADO reaction. Using this Km for O2, the apparent Ki of H2O2 was individually determined for each curve in Fig. 2A, and the results combined to determine an apparent Ki (H2O2) of 16.0 ± 5.9 µM.
Fig. 2.

Mixed-type inhibition of ADO by H2O2 with respect to O2. (A) ADO activity in the presence of various concentrations of H2O2 in 50, 250, and 1,250 µM O2 atmospheres. (B) Double reciprocal plot of ADO activity versus oxygen concentration in the presence of various amounts of H2O2. (C) ADO activity under ambient atmosphere (control), in 100% argon (–O2) after degassing, or in air after degassing (open). After 15 min under argon, air was reintroduced and activity was restored (–O2, then open). (D) ADO activity in various concentrations of O2. All reactions used NADPH, FNR, and Fd with 200 µM 18-ALD. All data are the mean ± SD (n = 3).
We hypothesized that coupling Escherichia coli Kat E catalase to ADO would provide a means for detoxifying H2O2 adjacent to its site of inhibition. We therefore constructed a bifunctional protein, CAT–ADO, in which catalase is tethered to ADO by a flexible peptide linker, and the C terminus is fused to a hexa-histidine tag to enable purification via Ni–NTA (nitrilotriacetic acid) binding (Fig. 3A and Fig. S1). The resulting fusion protein is expected to comprise a tetrameric Kat E core linked to four pendant monomeric ADO domains. Purified CAT–ADO has a specific activity comparable to that of commercially obtained catalase (Fig. 3B). The CAT–ADO fusion protein showed a significantly higher reaction rate than the native ADO, which continued linearly for at least 30 min, whereas there was no significant difference between the rate of product formation for the CAT–ADO fusion protein in the presence or absence of added H2O2, demonstrating that fusion of ADO with CAT renders it insensitive to H2O2 inhibition (Fig. 3C). After 16 h of incubation, the number of in vitro turnovers per active site remained at ∼3 for native ADO but reached 226 ± 10 for the CAT–ADO fusion protein. By virtue of its dual activities, CAT–ADO was also capable of converting H2O2, its inhibitor, into O2, a cosubstrate, as demonstrated by alkane formation after adding an anaerobic solution of H2O2 to an oxygen-depleted reaction mixture (Fig. 3D).
Fig. 3.

Improved ADO performance by physical tethering to catalase. (A) Schematic representation of the CAT–ADO fusion protein made by fusing E. coli (Ec) catalase and P. marinus (Pm) ADO with a 20 amino acid linker. (B) Catalase activity of ADO, a commercial catalase preparation (catalase), and the CAT–ADO fusion protein. (C) ADO catalytic turnovers of ADO (ADO) and CAT–ADO in the absence (CAT–ADO) or presence (CAT–ADO + 1 mM H2O2) of H2O2. (D) ADO catalytic turnovers in anaerobic reactions of ADO (ADO) and CAT–ADO in the presence or absence of water or H2O2. Assays for C and D used NADPH, FNR, and Fd with 200 µM 18-ALD. (E) In vivo alkane production per ADO active site of ADO and CAT–ADO when expressed in E. coli with an AAR. All data are the mean ± SD (n = 3). **P < 0.01 by t test.
We next used the CAT–ADO fusion to determine if catalytic turnovers are increased in vivo as they are in vitro. To achieve this, two synthetic operons were constructed comprising either ADO or CAT–ADO along with acyl–ACP reductase (AAR) (to provide substrate in vivo). The operons were expressed in E. coli, and the production of alkanes was quantified relative to the number of ADO active sites during the linear phase of product accumulation. Although total alkane production was unchanged, CAT–ADO catalyzed approximately fivefold more catalytic turnovers per ADO active site relative to the native ADO (Fig. 3E and Fig. S2), demonstrating that CAT–ADO is more efficient in vivo as well as in vitro.
The discovery that the inhibition of H2O2 can be overcome by the inclusion of catalase in enzyme assays allowed us to perform detailed kinetic analysis with aldehyde (ALD) substrates of carbon chain lengths between 8 and 18 carbons in length (summarized in Fig. 4 and Table 3, and shown in detail in Fig. S3). The Kms and kcats for the tested substrates are relatively similar, with a slight trend of increasing Km with increasing chain length from C8 to C18, whereas the kcat decreases with increasing chain length over the same range. Together these trends contribute to an approximately twofold range in specificity factors from 31.4 μM−1⋅min−1 × 10³ for 8-ALD to 15.7 μM−1⋅min−1 × 10³ for 18-ALD (with the exception of 14-ALD, the highest specificity factor at 33.9 μM−1⋅min−1 × 10³) due to a lower Km. The presence of a double bond in 18:1-ALD does not significantly alter the kinetic parameters with respect to the saturated 18-ALD. No activity was detected when 24-ALD was used as substrate.
Fig. 4.

ADO reaction kinetics with various aldehyde substrates. (A) ADO specific activity with octadecenal (18:1-ALD), octadecanal (18-ALD), hexadecanal (16-ALD), and tetradecanal (14-ALD) as substrates. (B) ADO specific activity with dodecanal (12-ALD), decanal (10-ALD), and octanal (8-ALD) as substrates. (C) Alkane products formed in substrate competition assays. Substrates are labeled as two numbers, x/y, where x is always 200 µM 18-ALD and y is the chain length of the other aldehyde substrate, also at 200 µM. The control reaction contains 400 µM 18-ALD. All reactions used NADPH, FNR, and Fd. All data are mean ± SD (n = 3).
Table 3.
ADO kinetic parameters with different substrates
| Substrate* | Km (μM) | kcat (min−1) | kcat/Km (µM−1⋅min−1 × 10³) | Ki (μM) |
| 18:1-ALD | 44 ± 7.2 | 0.68 ± 0.05 | 15 | n.d. † |
| 18-ALD | 41 ± 4.8 | 0.65 ± 0.03 | 15 | n.d. |
| 16-ALD | 30 ± 4.2 | 0.65 ± 0.03 | 22 | n.d. |
| 14-ALD | 19 ± 1.7 | 0.64 ± 0.02 | 34 | n.d. |
| 12-ALD | 45 ± 19 | 1.09 ± 0.17 | 24 | 107 ± 17 |
| 10-ALD | 30 ± 6.2 | 0.96 ± 0.31 | 33 | 65 ± 26 |
| 8-ALD | 28 ± 9.9 | 0.81 ± 0.23 | 31 | 98 ± 20 |
All kinetic constants were determined in standard assays containing 0.1% Triton X-100; data are mean ± SE, n ≥ 10. n.d., not determined.
*Numbers refer to aldehyde chain length. 18:1 contains a cis double bond at the ninth carbon relative to the aldehyde group.
†No inhibition detected.
Two distinct kinetic patterns were observed. For long-chain substrates (C14–C18), Michaelis–Menten kinetics were followed (Fig. 4A and Fig. S3 A–D), but for short and medium-chain substrates (C8–C12), the data best fit curves described by substrate inhibition kinetics (Fig. 4B and Fig. S3 E–G). Under Michaelis–Menten kinetics, increases of velocity are asymptotic toward the Vmax, whereas under inhibition kinetics, the first phase of the curve is dominated by Michaelis–Menten kinetics but eventually the Ki predominates and the reaction rate slows down.
Substrate competition experiments were performed to better understand substrate inhibition of ADO. In these assays, saturating (200 µM) 18-ALD was added together with an equimolar amount of one other aldehyde substrate as indicated in Fig. 4C. Substrate preference for long-chain, C14–C18, substrates was in close agreement with specificity factors. Inclusion of inhibitory short and medium C8–C12 substrates inhibited their own product formation but had less effect on activity with 18-ALD. The crystal structure of ADO contains density consistent with the presence of a fatty acid in the channel adjacent to the diiron active site (PDB 2OC5), suggesting that fatty acids directly ligate to the diiron center. We therefore tested the possibility that fatty acids and related compounds could inhibit the conversion of fatty aldehydes to n-1 alkanes. Perhaps surprisingly, free fatty acids or fatty alcohols at up to 100 µM showed no inhibition of ADO activity (Fig. S4).
Discussion
This work identifies H2O2, the 2e− reduced form of O2, to be a potent inhibitor of ADO. It was previously reported and shown here that the ADO reaction is poorly coupled to NADPH consumption, with 6–10 equivalents of NADPH consumed by the electron transport chain (ETC) for each equivalent of product formed (Table 2 and ref. 8). Thus, based on the proposed reaction scheme shown in the introduction, in a typical enzyme reaction containing 5 µM ADO, three catalytic turnovers produces 15 µM of alkane and consumes 30 µM NADPH in addition to 60–120 µM NADPH for the uncoupled reaction. Each NADPH carries the 2e− that can reduce O2 to H2O2. Therefore, 60–120 µM H2O2 could be produced, which is 4–8-fold higher than the apparent Ki for H2O2 (16.0 ± 5.9 µM), providing a likely mechanism to explain the observed inhibition of ADO during enzyme assays. These estimated values match (within experimental error) the values of NADPH consumption, H2O2, and product formation measured in this study (Table 2). That ADO is inhibited by H2O2 arising from uncoupled electron transport is supported by the complete relief of inhibition when catalase is included in the assay and the protection afforded by the fusion of CAT to the ADO.
Soluble stearoyl-ACP desaturases (SACPDs) from plants are also inhibited by H2O2 (14). SACPD is a diiron enzyme with an active site architecture (15) similar to that of ADO, and this structural similarity may have significance for the shared inhibition by H2O2. In this context it is interesting to note that at least one mammalian fatty acid desaturase has been shown to interact physically with catalase (16). The H2O2 inhibition of ADO and desaturase enzymes is in contrast to the structurally similar MMO, which also binds and activates molecular oxygen to effect catalysis, but can use H2O2, the 2e− reduced form of O2, in place of molecular oxygen and an ETC to initiate catalysis (13). The ability of H2O2 to either inhibit or support catalysis may be related to the evolutionary origins of the four-helix-bundle–containing diiron enzymes, which are proposed to have originated from progenitor enzymes that detoxified activated oxygen species by reducing them to H2O, and to have evolved instead to use diiron-bound activated oxygen species to effect catalysis (17). Evidence in support of this view came from the reversion of the evolved functionality of an SACPD back to that of an oxidase by a single residue substitution (18). In any event, differences between the diiron ligation sphere, or dynamics thereof, apparently permit MMO to bind peroxide in a catalytically productive mode, whereas ADO and SACPD nonproductively bind H2O2. It may be important that MMO is a multicomponent enzyme and that binding of an effector, B-protein, to the catalytic subunit alters active site geometry that improves both coupling and reaction rate (19). We have searched for but have been unable to identify sequences homologous to the B-component (MMOB) effector in cyanobacterial genomes that code for ADO (but not MMO).
The kinetics presented here show that ADO does not exhibit strong chain-length specificity with respect to its substrates. This is consistent with the physiological observation that cyanobacteria make a range of alkane products (7). The chain-length distribution of alkane products arising from the ADO pathway is therefore determined by the distribution of aldehydes available as substrates. Aldehydes are produced by the reduction of acyl-carrier-protein–linked fatty acid thioesters by AAR with reductant supplied by NADPH. The distribution of aldehydes is therefore determined by chain-length selectivity of AAR and by availability of acyl–ACPs of various chain lengths. In plants, very long-chain alkanes are synthesized from very long-chain aldehydes (mainly C26–C32) by the membrane-bound decarbonylase, CER1 (5). However, the soluble deformylase described in this work shows no activity toward very long-chain (C24) aldehydes. This observation mirrors that observed for desaturase enzymes in which very long-chain fatty acids are desaturated by membrane-bound desaturases and long-chain fatty acids are desaturated by soluble desaturases (20). This difference in substrate specificities of membrane-bound versus soluble decarbonylases/deformylases may result from their structural organization and localization. The soluble ADO and desaturase have a substrate-binding cavity with sufficient length to accommodate long-chain (but not very long-chain) substrates (21). Increased substrate length would require a portion of the aldehyde to protrude from the cavity into the cytoplasm creating an energetically unfavorable interaction between the hydrophobic substrate and the hydrophilic cytoplasm. In contrast, for CER1 and the integral membrane desaturases, very long-chain substrates might be accommodated either by the presence of larger substrate-binding cavities or by the formation of energetically favorable interactions between protruding substrates and the hydrophobic lipid bilayer.
An interesting phenomenon is that inhibitory concentrations of short-chain substrates (C8–C12) do not reduce the turnover of longer chain substrates (C14–C18) to the same extent. This may be related to the capacity of the active site cavity, which is long enough to accommodate only a single long-chain aldehyde. In contrast, shorter chain-length substrates that exhibit self-inhibition only partially occupy the substrate-binding cavity, leaving sufficient room for a second substrate to enter. We speculate that entry of a second short-chain aldehyde may impede product release, the proposed rate-limiting step of related fatty acid desaturase enzymes (22), resulting in the observed substrate inhibition. In the case of long-chain aldehydes, there would be no room for a second, short-chain, substrate to bind, and product release would not be inhibited. Alternatively, the inhibition might be related to substrate asymmetry in that the substrate may bind in two possible orientations, one in which the aldehyde group faces the diiron center and the other in which the methyl group does. The presence of a second substrate in the binding cavity might impair egress and reorientation of the unproductively bound substrate.
The rate constant of catalase is very high, approaching the limit imposed by diffusion, and therefore, it is not surprising that little difference in alkane production is observed between the CAT–ADO fusion protein and a combination of separate native ADO and catalase enzymes. However, the expression of the CAT–ADO fusion in oxygenic phototrophs designed for the commercial production of alkanes will likely improve activity because the levels of H2O2 reported in the literature commonly exceed the apparent Ki of ADO reported herein (23), and even if a host organism expresses catalase, the timing of its expression and its subcellular localization may not provide sufficient protection from H2O2 inhibition. Perhaps this is one reason that catalase has evolved to physically interact with at least one mammalian fatty acid desaturase that is also inhibited by H2O2 (16). In addition, the physical tethering of a catalase to ADO provides an activity that converts the inhibitor H2O2 into a cosubstrate O2 producing a locally elevated concentration of cosubstrate. This channeling of inhibitor to substrate provides an efficiency similar to that observed for enzymes of a pathway upon the physical linkage of consecutive enzymatic steps using synthetic protein scaffolds (24). We propose the term protection via inhibitor metabolism (PIM) for fusion proteins designed to minimize inhibition by metabolizing inhibitors into noninhibitory compounds. The CAT–ADO fusion represents a specific subset of PIM fusion protein in which the inhibitor is metabolized into a substrate that potentiates the reaction, effecting a reversal of the regulatory role of the inhibitor. An analogous approach, activation via activator synthesis (AAS), could be used for enzymes that require activation in that a second enzyme could be fused to the target enzyme to create a locally elevated concentration of an activating metabolite. For either PIM, or AAS, synthetic scaffolds could be used in place of direct fusion proteins.
Materials and Methods
Vector Construction.
The pSpeedET T7 inducible bacterial expression plasmid containing the coding sequence for P. marinus ADO (GenBank CAE21406.1) fused with an N-terminal MGSDKIHHHHHHENLYFQG tag as constructed by the Joint Center for Structural Genomics was obtained from the DNASU plasmid repository. An additional ADO clone containing a C-terminal hexahistidine tag was PCR-amplified using the primers forward-AATTGGCATATGATGCCTACGCTTGAGATGCCT and reverse-AATTGGCTCGAGTCAGTGGTGGTGGTGGTGGTGGCTCACAAGAGCTGCC and was cloned into the NdeI and XhoI sites of pET24b. The E. coli catalase (katE; GenBank U00096.2) ADO fusion protein (CAT–ADO) was constructed by overlap extension PCR. Primers for catalase were forward-AATTGGCATATGTCGCAACATAACGAAAAGAACC and reverse-ACCACCTTCAGAGCCACCGCCTTCAGAGCCGCCCGCACCAGACGCGGCAGGAATTTTGTCAATCTTAGG. Primers for ADO were forward-GGCTCTGAAGGCGGTGGCTCTGAAGGTGGTACCTCTGGTGCGACCATGCCTACGCTTGAGATGCCT and reverse-AATTGGCTCGAGTCAGTGGTGGTGGTGGTGGTGGCTCACAAGAGCTGCC. The final construct contained catalase followed by a 20 amino acid flexible linker domain (25) followed by ADO and finally a C-terminal hexahistidine tag and was cloned into the NdeI and XhoI sites of pET24b. For in vivo alkane production, Synechococcus elongatus PCC 7942 AAR (GenBank YP_400611) cDNA was generated with the following primers: forward-AATTGGCATATGTTCGGTCTTATCGGTCATCTC and reverse-AATTGGCATATGTATATCTCCTTTCAAATTGCCAATGCCAAGGG. The cDNA contained a ribosome binding site (rbs) at the C terminus and was cloned into the NdeI site of pET24b in front of ADO or CAT–ADO to generate synthetic operons. The operons thus contained a T7 promoter and rbs from the pET24b vector followed by AAR, then another rbs, then either ADO or CAT–ADO, each with a C-terminal hexahistidine tag.
Protein Expression and Purification.
E. coli BL21 (DE3) Gold cells containing various plasmids were grown at 37 °C to an OD600 of 0.4, were induced with 0.4 mM isopropyl β-D-1-thiogalactopyranoside (IPTG), and were grown for an additional 4 h at 37 °C for ADO or 30 °C for CAT–ADO. Cell pellets were suspended in 20 mM Tris⋅Cl, pH 7.5, 150 mM NaCl, 20 mM imidazole, 5 mM MgCl2, and 0.1 mg/mL DNase and were lysed using a French pressure cell. Cellular debris was removed by centrifugation at 40,000 × g for 20 min. Recombinant proteins were purified from the soluble fraction with Ni-NTA resin (Qiagen). Wash and elution buffers were 20 mM Tris⋅Cl, pH 7.5, 300 mM NaCl, and 25 or 250 mM imidazole, respectively. Eluted proteins were immediately exchanged into 20 mM Hepes, pH 7.8, 200 mM NaCl using PD-10 desalting columns. Protein concentration was determined with Bradford Assay (Sigma) using BSA as standard.
Enzyme Assays.
Typical deformylase assays were 0.25 mL and contained 100 mM Tris⋅Cl, pH 7.5, 0.1% Triton X-100, 1 mM DTT, 50 µg/mL maize root Fd and 1 U/mL anabaena vegetative Fd reductase (26), 2 mM NADPH, 200 µM octadecanal (18-ALD), and 5 µM ADO or CAT–ADO. A 20 mM octadecanal stock was freshly prepared by sonicating powder in 10% (vol/vol) Triton X-100. Octadecanal was obtained from ISCA Technologies. When indicated, catalase (Sigma C-9322) was added to a final concentration of 1 mg/mL from a 5 mg/mL stock dissolved in 100 mM Pipes, pH 6.0. For assays performed in 0% oxygen, a reaction master mix without NADPH and a separate NADPH solution were prepared by repeated purging of the sample cell with argon and vacuum with the use of a Schlenk line. For reactions containing nonambient O2 concentrations, a 100% O2 solution (prepared by bubbling O2 gas through buffered water) was added to 0% O2 reaction mixes to achieve the desired O2 concentration. Reactions were initiated by addition of enzyme, substrate, or NADPH and were incubated at 37 °C and terminated by the addition of an equal volume of ethyl acetate. The organic phase was separated by GC/MS on an HP-5 ms column with oven temperature increasing from 75 °C to 320 °C at 40 °C/min with a flow rate of 1.3 mL⋅min−1. Substrate and product were identified by comparison with authentic standards. Kinetic constants were calculated as described in SI Materials and Methods.
Catalase assays were 1 mL and contained 20 mM Tris⋅Cl, pH 7.5, 14.7 mM H2O2. Assays were initiated by the addition of 0.1 µg of protein and were incubated at 37 °C. H2O2 concentration was monitored by measuring absorbance at 240 nm and using a molar extinction coefficient of 43.6 M−1⋅cm−1.
In Vivo Alkane Production.
Alkane production was tested in E. coli carrying synthetic operons as described above. Overnight cultures were grown at 37 °C in LB medium containing 1% glucose. The next morning, cells were washed in water and in M9 medium. The cells were suspended in M9 medium containing 1 µg/mL thiamine and 0.1% Triton X-100 at an OD600 of 1.0 in Erlenmeyer flasks. The cells were then transferred to 30 °C and were induced with 0.1 mM IPTG. After 16 h, alkane production was measured by extracting 1 mL of culture volume with 1 mL of ethyl acetate containing 5 µg/mL of 1-octadecene as internal standard. Extracts were run on GC/MS as described above. ADO and CAT–ADO proteins, both with C-terminal hexahistidine tags, were quantified in crude E. coli extracts by direct ELISA using alkaline phosphatase-conjugated anti-His tag antibody (Sigma). Purified ADO and CAT–ADO proteins were used as reference standards. Crude cell extracts were prepared using BugBuster 10× protein extraction reagent (EMD Millipore), and proteins were adsorbed directly to the wells of 96-well plates, followed by washing and immunodetection.
Supplementary Material
Acknowledgments
We thank Dr. William Studier, Dr. Allen Orville, Dr. Peter Tonge, and Dr. Diane Cabelli for helpful discussion. This work was supported by the Office of Basic Energy Sciences of the US Department of Energy.
Footnotes
The authors declare no conflict of interest.
This article is a PNAS Direct Submission.
This article contains supporting information online at www.pnas.org/lookup/suppl/doi:10.1073/pnas.1218769110/-/DCSupplemental.
References
- 1.Cheesbrough TM, Kolattukudy PE. Alkane biosynthesis by decarbonylation of aldehydes catalyzed by a particulate preparation from Pisum sativum. Proc Natl Acad Sci USA. 1984;81(21):6613–6617. doi: 10.1073/pnas.81.21.6613. [DOI] [PMC free article] [PubMed] [Google Scholar]
- 2.Dennis M, Kolattukudy PE. A cobalt-porphyrin enzyme converts a fatty aldehyde to a hydrocarbon and CO. Proc Natl Acad Sci USA. 1992;89(12):5306–5310. doi: 10.1073/pnas.89.12.5306. [DOI] [PMC free article] [PubMed] [Google Scholar]
- 3.Reed JR, Quilici DR, Blomquist GJ, Reitz RC. Proposed mechanism for the cytochrome P450-catalyzed conversion of aldehydes to hydrocarbons in the house fly, Musca domestica. Biochemistry. 1995;34(49):16221–16227. doi: 10.1021/bi00049a038. [DOI] [PubMed] [Google Scholar]
- 4.Aarts MG, Keijzer CJ, Stiekema WJ, Pereira A. Molecular characterization of the CER1 gene of arabidopsis involved in epicuticular wax biosynthesis and pollen fertility. Plant Cell. 1995;7(12):2115–2127. doi: 10.1105/tpc.7.12.2115. [DOI] [PMC free article] [PubMed] [Google Scholar]
- 5.Bernard A, et al. Reconstitution of plant alkane biosynthesis in yeast demonstrates that Arabidopsis ECERIFERUM1 and ECERIFERUM3 are core components of a very-long-chain alkane synthesis complex. Plant Cell. 2012;24(7):3106–3118. doi: 10.1105/tpc.112.099796. [DOI] [PMC free article] [PubMed] [Google Scholar]
- 6.Bourdenx B, et al. Overexpression of Arabidopsis ECERIFERUM1 promotes wax very-long-chain alkane biosynthesis and influences plant response to biotic and abiotic stresses. Plant Physiol. 2011;156(1):29–45. doi: 10.1104/pp.111.172320. [DOI] [PMC free article] [PubMed] [Google Scholar]
- 7.Schirmer A, Rude MA, Li X, Popova E, del Cardayre SB. Microbial biosynthesis of alkanes. Science. 2010;329(5991):559–562. doi: 10.1126/science.1187936. [DOI] [PubMed] [Google Scholar]
- 8.Li N, et al. Conversion of fatty aldehydes to alka(e)nes and formate by a cyanobacterial aldehyde decarbonylase: Cryptic redox by an unusual dimetal oxygenase. J Am Chem Soc. 2011;133(16):6158–6161. doi: 10.1021/ja2013517. [DOI] [PMC free article] [PubMed] [Google Scholar]
- 9.Warui DM, et al. Detection of formate, rather than carbon monoxide, as the stoichiometric coproduct in conversion of fatty aldehydes to alkanes by a cyanobacterial aldehyde decarbonylase. J Am Chem Soc. 2011;133(10):3316–3319. doi: 10.1021/ja111607x. [DOI] [PMC free article] [PubMed] [Google Scholar]
- 10.Das D, Eser BE, Han J, Sciore A, Marsh ENG. Oxygen-independent decarbonylation of aldehydes by cyanobacterial aldehyde decarbonylase: A new reaction of diiron enzymes. Angew Chem Int Ed Engl. 2011;50(31):7148–7152. doi: 10.1002/anie.201101552. [DOI] [PMC free article] [PubMed] [Google Scholar]
- 11.Das D, Eser BE, Han J, Sciore A, Marsh ENG. Corrigendum: Oxygen-independent decarbonylation of aldehydes by cyanobacterial aldehyde decarbonylase: A new reaction of diiron enzymes. Angew Chem Int Ed. 2012;51(32):7881. doi: 10.1002/anie.201101552. [DOI] [PMC free article] [PubMed] [Google Scholar]
- 12.Li N, et al. Evidence for only oxygenative cleavage of aldehydes to alk(a/e)nes and formate by cyanobacterial aldehyde decarbonylases. Biochemistry. 2012;51(40):7908–7916. doi: 10.1021/bi300912n. [DOI] [PubMed] [Google Scholar]
- 13.Andersson KK, Froland WA, Sang-Kyu LEE, Lipscomb JD. Dioxygen independent oxygenation of hydrocarbons by methane monooxygenae hydroxylase component. New J Chem. 1991;15(6):411–416. [Google Scholar]
- 14.McKeon TA, Stumpf PK. Purification and characterization of the stearoyl-acyl carrier protein desaturase and the acyl-acyl carrier protein thioesterase from maturing seeds of safflower. J Biol Chem. 1982;257(20):12141–12147. [PubMed] [Google Scholar]
- 15.Shanklin J, Guy JE, Mishra G, Lindqvist Y. Desaturases: Emerging models for understanding functional diversification of diiron-containing enzymes. J Biol Chem. 2009;284(28):18559–18563. doi: 10.1074/jbc.R900009200. [DOI] [PMC free article] [PubMed] [Google Scholar]
- 16.Baker RC, Wykle RL, Lockmiller JS, Snyder F. Identification of a soluble protein stimulator of plasmalogen biosynthesis and stearoyl-coenzyme A desaturase. Arch Biochem Biophys. 1976;177(1):299–306. doi: 10.1016/0003-9861(76)90440-9. [DOI] [PubMed] [Google Scholar]
- 17.Gomes CM, Le Gall J, Xavier AV, Teixeira M. Could a diiron-containing four-helix-bundle protein have been a primitive oxygen reductase? ChemBioChem. 2001;2(7-8):583–587. doi: 10.1002/1439-7633(20010803)2:7/8<583::AID-CBIC583>3.0.CO;2-5. [DOI] [PubMed] [Google Scholar]
- 18.Guy JE, et al. A single mutation in the castor Delta9-18:0-desaturase changes reaction partitioning from desaturation to oxidase chemistry. Proc Natl Acad Sci USA. 2006;103(46):17220–17224. doi: 10.1073/pnas.0607165103. [DOI] [PMC free article] [PubMed] [Google Scholar]
- 19.Merkx M, et al. Dioxygen activation and methane hydroxylation by soluble methane monooxygenase: A tale of two irons and three proteins A list of abbreviations can be found in Section 7. Angew Chem Int Ed Engl. 2001;40(15):2782–2807. [PubMed] [Google Scholar]
- 20.Meesapyodsuk D, Qiu X. The front-end desaturase: Structure, function, evolution and biotechnological use. Lipids. 2012;47(3):227–237. doi: 10.1007/s11745-011-3617-2. [DOI] [PubMed] [Google Scholar]
- 21.Lindqvist Y, Huang W, Schneider G, Shanklin J. Crystal structure of delta9 stearoyl-acyl carrier protein desaturase from castor seed and its relationship to other di-iron proteins. EMBO J. 1996;15(16):4081–4092. [PMC free article] [PubMed] [Google Scholar]
- 22.Fox BG, Lyle KS, Rogge CE. Reactions of the diiron enzyme stearoyl-acyl carrier protein desaturase. Acc Chem Res. 2004;37(7):421–429. doi: 10.1021/ar030186h. [DOI] [PubMed] [Google Scholar]
- 23.Queval G, Hager J, Gakière B, Noctor G. Why are literature data for H2O2 contents so variable? A discussion of potential difficulties in the quantitative assay of leaf extracts. J Exp Bot. 2008;59(2):135–146. doi: 10.1093/jxb/erm193. [DOI] [PubMed] [Google Scholar]
- 24.Dueber JE, et al. Synthetic protein scaffolds provide modular control over metabolic flux. Nat Biotechnol. 2009;27(8):753–759. doi: 10.1038/nbt.1557. [DOI] [PubMed] [Google Scholar]
- 25.Martin A, Baker TA, Sauer RT. Rebuilt AAA + motors reveal operating principles for ATP-fuelled machines. Nature. 2005;437(7062):1115–1120. doi: 10.1038/nature04031. [DOI] [PubMed] [Google Scholar]
- 26.Cahoon EB, Lindqvist Y, Schneider G, Shanklin J. Redesign of soluble fatty acid desaturases from plants for altered substrate specificity and double bond position. Proc Natl Acad Sci USA. 1997;94(10):4872–4877. doi: 10.1073/pnas.94.10.4872. [DOI] [PMC free article] [PubMed] [Google Scholar]
Associated Data
This section collects any data citations, data availability statements, or supplementary materials included in this article.