Abstract
The gaseous XO molecules (X = C, N or O) bind to the heme prosthetic group of heme proteins, and thereby activate or inhibit key biological processes. These events depend on interactions of the surrounding protein with the FeXO adduct, interactions that can be monitored via the frequencies of the Fe-X and X-O bond stretching modes, νFeX and νXO. The frequencies can be determined by vibrational spectroscopy, especially resonance Raman spectroscopy. Backbonding, the donation of Fe dπ electrons to the XO π* orbitals, is a major bonding feature in all the FeXO adducts. Variations in backbonding produce negative νFeX/νXO correlations, which can be used to gauge electrostatic and H-bonding effects in the protein binding pocket. Backbonding correlations have been established for all the FeXO adducts, using porphyrins with electron donating and withdrawing substituents. However the adducts differ in their response to variations in the nature of the axial ligand, and to specific distal interactions. These variations provide differing vantages for evaluating the nature of protein-heme interactions. We review experimental studies that explore these variations, and DFT computational studies that illuminate the underlying physical mechanisms.
Keywords: Carbon monoxide, Dioxygen, Nitric oxide, Heme, Protein, Raman, Infrared, DFT, Backbonding
1. Introduction
Heme proteins are nature's receptors for the gaseous XO molecules (X = C, N, O), which play vital roles in many biological processes. By binding to the heme, the XO molecules can serve as signals, triggering a protein conformation change that initiates DNA binding or an enzymatic reaction. Also the bound XO can be activated for redox reactions through electron transfer to or from the heme. Interactions with the surrounding protein are critical for binding discrimination among the XO molecules, and for guiding the subsequent protein conformation change or the XO reactivity. These interactions involve the protein sidechains that line the heme pocket. Steric contacts can directly impede ligand binding, and can also distort the porphyrin ring, influencing the Fe-XO electronic properties. In addition, electric fields and H-bonds associated with sidechains distal to the bound XO can polarize the Fe-XO bond. Also critical is the nature of the proximal sidechain, generally histidine or cysteine, that serves as a trans axial ligand to the heme. The donor strength of the axial ligand also influences the Fe-XO bond.
Characterizing these interactions is fundamental to understanding how heme proteins operate, and vibrational spectroscopy offers a powerful tool for characterization. The Fe-X and X-O stretching force constants are proportional to the bond strengths, and are connected (albeit somewhat indirectly, as discussed in Section 2.1) to the frequencies of the associated vibrational modes. These modes can be detected by IR or Raman spectroscopy. The latter is particularly useful because tuning the Raman laser into resonance with the heme electronic transitions enhances heme vibrational modes [1], providing sensitivity and selectivity with respect to the background spectra of the protein and of the water solvent. Most FeXO vibrational data have been obtained from resonance Raman spectra [2-6]. However, IR spectroscopy can also be useful, particularly for CO adducts, since the CO stretching vibration occurs in an uncrowded spectral region, and binding to the heme induces a large transition dipole for the CO stretch [7-13].
The structures of the heme-XO adducts, as well as the vibrational frequencies can be modeled via DFT computations [14-29]. The structures agree well with available structural data, while the frequencies are somewhat overestimated, as is usual with ab initio methods. However, computed trends in the frequencies agree with observations, giving confidence in the analysis of protein interactions with heme-XO adducts via DFT modeling. In the ensuing sections we describe the patterns that have been revealed in the correlations of Fe-X and X-O stretching frequencies, νFeX and νXO, from experiment and computer modeling.
2. The Backbonding Pattern
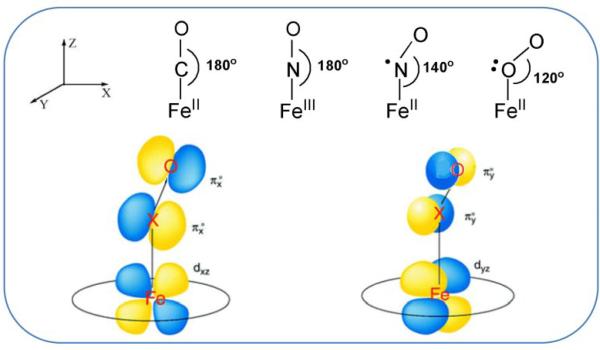
The heme group is electronically tuned to bind CO, NO and O2, because the XO molecules have vacant π* orbitals that are well matched to the filled dπ orbitals of the Fe(II) ion in the middle of the porphyrin ring (Fig. 1). This arrangement is optimal for Fe-XO π backbonding. Electrons shift from Fe to XO in the dπ-π* system, and are donated back to Fe in the σ system (synergic bonding). Backbonding strengthens the Fe-X bond while weakening the X-O bond. Consequently, the dominant motif in FeXO is a negative correlation of νFeX and νXO. As backbonding increases, νFeX increases while νXO decreases [16, 18].
Figure 1.
Backbonding schematic for FeXO adducts (X = C, N or O), showing the orbitals available for π backdonation from Fe to XO.
In CO, both π* orbitals are empty, and FeCO is a linear adduct, with dπ-π* overlaps in both perpendicular directions (x and y, with z as the FeCO axis, Fig. 1). However, NO and O2 have one and two π* electrons, and their adducts are forced to bend (~140° for FeNO, ~120° for FeO2) in order to accomodate a π antibonding interaction. The bonding can be thought of in terms of sp2 hybridization at the X atom, with one or two electrons in the lobe pointing away from the direction of bending (Fig. 1). Meanwhile, the πy* orbital remains available for backbonding with the Fe dyz orbital.
For bent FeXO adducts there is an issue in determining the Fe-X stretching frequency, because the Fe-X stretching and Fe-X-O bending motions have comparable frequencies and the coordinates are allowed to mix. (This mixing is symmetry-forbidden in the linear FeCO). The mixing produces vibrational modes with variable contributions from stretching and bending. However, only one of the modes is significantly enhanced in RR spectra, and it has the larger frequency shift upon isotopic substitution at X [30]. For convenience, this mode has been labeled ‘νFeX’, and, as we shall see, it correlates with νXO in the same way that νFeC correlates with νCO for FeCO adducts.
2.1 Five-coordinate MXO adducts
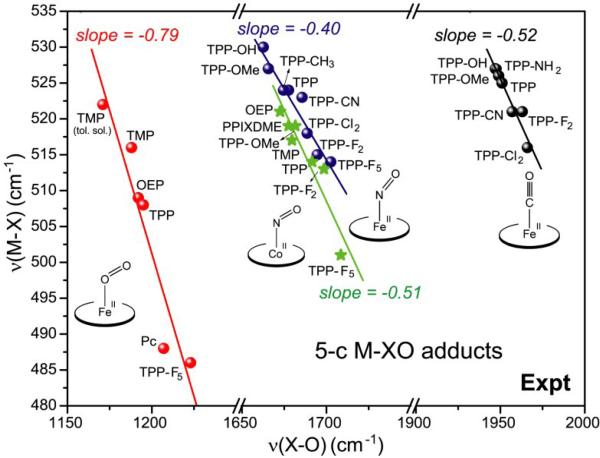
The backbonding correlation is clearly seen in νFeX/νXO plots for 5-coordinate M(II)XO porphyrin adducts (Fig. 2); Co(II)NO adducts, isoelectronic with Fe(II)O2 adducts, are included for comparison. Backbonding in these adducts was modulated by electron-donating or withdrawing substituents on a tetraphenylporphine ring (TPP-Y, Fig. 3), which vary the electron density on the Fe, and therefore the extent of backbonding, via their inductive effect. This standard porphyrin set has been used [15] in all cases, except for FeO2 adducts, which are unstable with respect to oxidation, and require the use of sterically protected porphyrins [31, 32], or matrix isolation techniques at low-temperature [33-35]. The available data from such studies [15, 16, 33-35] have been used in Fig. 2.
Figure 2.
Experimental backbonding correlation of νMX and νXO for 5-coordinate Fe(II)CO, Fe(II)NO, Co(II)NO and Fe(II)O2 porphyrin adducts. For FeO2, literature values were gathered[33-35] for matrix-isolated species (TMP, OEP, TPP, Pc, TPP-F5) and for TMP in toluene solution. For FeCO [16], FeNO [15], CoNO [36], data were recorded in organic solvents (CH2Cl2, DMF, Bz) solution for a set of TPP-Y species (Fig. 3), where - Y are variably electron donating or withdrawing substituents. The indicated slopes are from least-squares fits to the data.
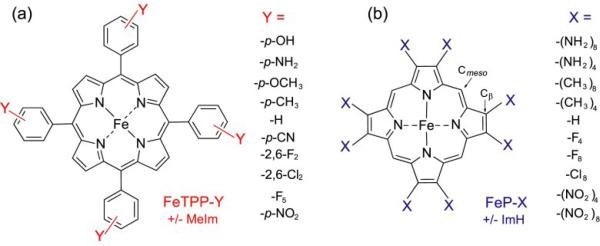
Figure 3.
Structural diagrams for (a) FeTPP-Y, and (b) FeP-X porphyrins used, respectively, in experimental determination and computational modeling of backbonding trends. Y and X are the indicated substituents, listed in order of electron-donating to -withdrawing propensity (–X4 indicates that –X and –H substituents alternated around the ring). For 6-coordinate adducts, the experiments included 4-methyl imidazole (a histidine mimic), and the computations included imidazole as axial ligands.
Negative correlations are seen in all cases, which can be described in the standard form [16]
where ν0XO is the frequency of the unbound (gas phase) XO, and the intercept, ν0MX, is the hypothetical FeX frequency in the absence of backbonding (single bond). The least squares slopes (s) and intercepts are listed in Table 1.
Table 1.
Backbonding correlationsa of Fe-XO (X=C, N, O) adducts derived from ν(Fe-X) and ν(XO) frequencies.
| Experiment | DFT | ||||
|---|---|---|---|---|---|
| Compound | ν°(Fe-X)(cm-1) | Slope(s) | Compound | ν°(Fe-X)(cm-1) | Slope(s) |
|
Fe-CO adducts Five –coordinate Fe(II)TPP-Y Six-coordinate Mb and Fe(II)TPP-Y(trans-ImH) NOS [trans-Cys...H-bond] P450cam [trans-Cys] |
425 346 366 339 |
-0.52 -0.81 -0.62 -0.68 |
Fe(II)P-X Fe(II)P-X(trans-py)b Fe(II)P-X(trans-SCH3–)b |
536 263 200 |
-0.57 -1.54 -1.49 |
|
Fe-NO adducts Six-coordinate MbIIINO[trans-His] + distal His MbIIINO[trans-His] - distal His |
644 627 |
-1.1 -1.2 | Fe(III)P-X[trans-ImH] Fe(III)P-X[trans-ImH]+distal His |
872 931 |
-1.1 -1.3 |
|
Fe-NO adducts Five –coordinate Fe(II)TPP-Y Six-coordinate Fe(II)TPP-Y[trans-ImH] |
445 329 |
-0.40 -1.0 |
Fe(II)P-X Fe(II)P-X[trans-ImH]+ONO...H bond |
581 552 |
-0.26 -0.24 |
|
Fe-OO adducts Five –coordinate Fe(II)TPP-Y/P-X Six-coordinate |
425 | -0.79 | Fe(II)P-X Fe(II)P-X[trans-ImH] |
240 320 |
-0.86 -0.74 |
ν0XO = ν0MX – s[νXO – ν0XO]; ν°XO values in the gaseous states of CO = 2145 cm-1, NO = 1876 cm-1 and OO = 1556 cm-1.
Values from ref.[16].
Structures and frequencies have been computed via DFT for 5-coordinate MXO adducts of porphine, using substituents on the pyrrole Cβ atoms to tune the extent of backbonding [16] (Fe(P-X), Fig.3). (Substitution on the meso Cm atoms was avoided, to exclude alterations of the porphyrin a2u orbital energy, because of specific effects associated with the a2u-dz2 interaction in the non-centrosymmetric MXO adducts [29]; the a2u porphyrin orbital has a large coefficient at Cm. The TPP-Y experimental set do, of course, have a meso substitution pattern, but the -Y substituents are far enough from Cm that their influence is limited to their inductive effect.)
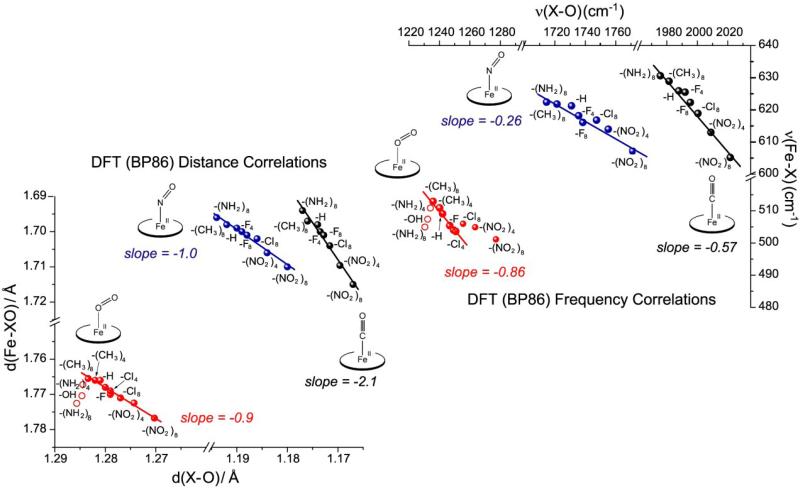
The computed frequency plots (Fig. 4, top) have similar slopes to the experimental ones (Table 1). In these computations, the local functional BP86 was used, because of its superior performance in the case of Fe(II)O2, Co(II)NO and Fe(II)NO adducts, which have low-lying open-shell states [30, 36-41]. Such states are known to be overemphasized by the popular non-local functional, B3LYP [30, 42, 43] While Co(II)NO and Fe(II)O2 are isoelectronic, the former has a closed-shell ground state, while the latter has an open-shell singlet ground state, although both states are close in energy for both adducts [37, 38]. Evidence that BP86 gives the correct ground state can be seen in comparison of computed and experimental structures[44-48] for Co(II)NO; (5-coordinate Fe(II)O2 experimental structures are unavailable) and frequencies (see below).[49] For Fe(II)O2, when the closed-shell singlet state is used in the frequency calculation, the νFeO/νOO correlation is in poor agreement with experiment.
Figure 4.
DFT-computed correlations of frequencies and distances for 5-coordinate MXO adducts of porphine bearing a series of electron-donating and – withdrawing substituents at the pyrrole Cβ atoms (P-X). Top: νMX/νXO frequency pairs. νMX is the frequency of the mode whose eigenvector contains the largest M-X displacement. The indicated slopes are from least-squares fits to the data. For FeO2 adducts, the fit was limited to points in the middle of the correlation (red). At low νOO values, the points (red circles) show a direct correlation, indicating dominance of σ over π bonding (see text). At high νOO values, the points deviate from the backbonding line, because of mode composition changes. Bottom: M-X and X-O bond distances, with least-squares slopes indicated. The positive correlation of bond strengths for FeO2 adducts with weak O-O bonds (red circles) is confirmed.
The open-shell singlet ground state of Fe(II)O2 adducts is in agreement with several recent computational studies [36, 38, 50-52]. This state corresponds to a Fe(III)(O2-) electronic structure, in which the unpaired spins on Fe(III) and O2- are antiferromagnetically coupled. Even in this unique electronic state, backbonding is still available, through the dyz-πy* overlap, but this overlap is weaker than in other adducts, as discussed below.
Negative linear correlations are also obtained in plots of computed M-X vs X-O bond distances (Fig. 4, bottom). These distance correlations provide a direct connection to the effect of backbonding on the M(II)XO bonds. Again, the correlations can be cast in a standard form
where d0XO is the bond distance in the free XO molecule, and d0MX is the hypothetical M-X distance in the absence of backbonding. Computed slopes (t) and intercepts are listed in Table 2.
Table 2.
Backbonding correlationsa of Fe-XO (X=C, N, O) adducts obtained from DFT derived d(Fe-X) and d(XO) bond lengths.
| Compound | d°(Fe-X),(Å) | Slope(t) |
|---|---|---|
|
Fe-CO adducts Five –coordinate Fe(II)P-X Six-coordinateb Fe(II)P-X(trans-py) Fe(II)P-X(trans-SCH3–) |
1.80 1.89 1.94 |
-2.1 -2.8 -3.5 |
|
Fe-NO adducts Five –coordinate Fe(II)P-X Six-coordinate Fe(II)P-X[trans-ImH]+ONO...H bond |
1.74 1.80 |
-1.0 -1.0 |
|
Fe-OO adducts Five –coordinate Fe(II)P-X Six-coordinate Fe(II)P-X[trans-ImH] |
1.83 1.85 |
-0.9 -0.61 |
d0XO = d0MX – t[dXO – d 0XO]; d °X-O values in the gaseous states of CO = 1.128 Å; OO = 1.210 Å; NO = 1.150 Å.
Values from ref.[16].
While frequency data are more readily available than bond distances, their connection to bond strengths is less direct. Frequency is proportional to the square root of the force constant for a single oscillator, and force constant changes are approximately proportional to bond distance changes [53]. However, the modes have multiple coordinate contributions, particularly for the ‘νMX’ mode of bent MXO adducts, as discussed in Section 1. This complexity may be responsible for the lack of congruence in the backbonding slopes (Fig. 4). Computed slopes are higher for the distance than the frequency plots, and the order changes for the different adducts. Another discrepancy is the deviation from the backbonding line seen in the frequency but not the distance plots for Fe(II)O2 adducts with short O-O bonds (Fig. 4, top).
The computed correlations for Fe(II)O2 adducts reveal a breakdown in the backbonding pattern. Both frequency and distance correlations exhibit a reversal of slope, which becomes positive for substituents more strongly donating than –CH3. In this region the Fe-O and O-O bonds become weaker together, contrary to backbonding expectations. This effect is not seen in the experimental frequency correlation, because data are unavailable for adducts with strongly donating porphyrin substituents.
The positive slope is attributed to the dominance of Fe-O σ bonding for strongly donating substituents. Since the Fe-O σ bond involves superoxide donating an electron pair to Fe(III), it is weakened by electron donating substituents, which increase the electron density on the Fe(III). The negative charge on the superoxide also increases, weakening the O-O bond, in concert with the Fe-O bond. In addition, electron donating substituents raise the Fe orbital energies, thereby diminishing the dyz-πy* overlap. Backbonding becomes inconsequential, relative to σ forward bonding. However, as the substituents become more electron withdrawing, backbonding increases in relative importance, making the correlation negative. Because of the essentially complete electron transfer from Fe(II) to O2, FeO2 adducts at are at the edge of the backbonding pattern, and can be pushed out of the pattern entirely by electron donating substituents on the porphyrin.
While the backbonding pattern is shared by all the 5-coordinate FeXO adducts, their responses to proximal ligands and to distal steric and H-bonding effects differ markedly, as described in subsequent sections. Comparison of different XO ligands bound to the same heme protein can discriminate among these effects.
3. Fe(II)CO adducts
CO adducts have been particularly useful in evaluating heme protein mechanisms. Spectral interpretation is relatively straightforward, and data on FeCO adducts are abundant because of their chemical stability, and also because their spectral responses are readily accessible. Both νFeC and νCO RR bands are enhanced in resonance with the heme Soret absorption band, and νCO is in a convenient region of the IR spectrum.
3.1 Backbonding variation
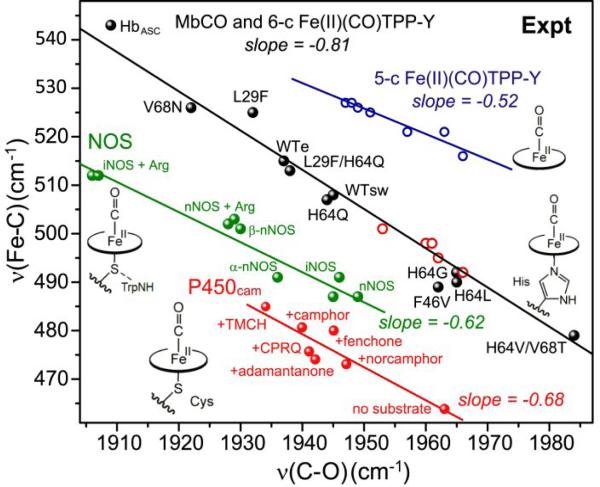
The most common proximal ligand in heme proteins is the imidazole sidechain of histidine residues. When this ligand is modeled with 4-methylimidazole (4-MeImH) in a series of 6-coordinate Fe(II)CO adducts of TPP-Y (Fig. 3), the same set of porphyrins used to establish the 5-coordinate backbonding line (Fig. 2), the result is again a negative linear νFeC/νCO correlation (Fig. 5) [6], but with increased slope and a shift to lower νCO values, relative to the 5-coordinate line. The lower νCO values reflect enhanced backbonding due to the increased electron density on Fe induced by the axial ligand, but the accompanying Fe-C bond strengthening is counterbalanced by σ competition between CO and the axial ligand for the Fe dz2 acceptor orbital. The net result is little change in νFeC, so that the backbonding correlation is shifted. This effect can be reproduced in DFT computations, using the Fe(II)CO P-X set, with pyridine (py) as trans axial ligand26 (Table 1). A negative linear bond distance correlation is also obtained, and the intercept Fe-C distance is longer than for 5-coordinate adducts, demonstrating the σ competition with the trans ligand (Table 2).
Figure 5.
Experimental backbonding correlations of νMX and νXO for FeCO adducts comparing different axial ligands: blue line – none (as Fig. 2), black line – N- methyl imidazole with TPP-Y porphines in CH2Cl2 (red circles) [30] or myoglobin variants (see Fig. 6) with differing distal residues[53-57, 59-61], and ascaris hemoglobin (black dots) [57]; green line – thiolate, with Trp and backbone H-bonds in nitric oxide synthase (NOS) variants [70-73]; red line – thiolate with backbone-only H-bonds (P450) variants[62-67].
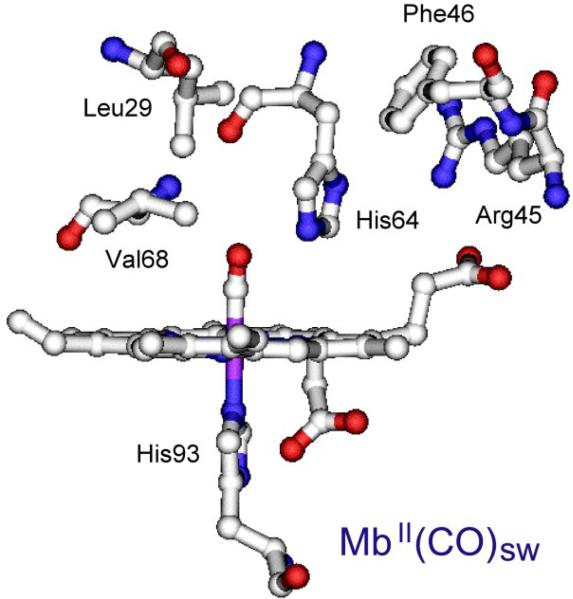
When the FeCO adducts of histidine-ligated heme proteins are examined, they lie on the same line as the model 4-MeImH adducts [30], with points spread out along the line as a result of polar influences of the distal sidechains (Fig. 5). A series of myoglobin (Mb) variants (Fig. 6) with distal residue substitutions has been particularly informative regarding these effects [54, 55]. Phillips et al. showed that for the CO adducts of these variants, the computed electrostatic potential at the bound CO correlated directly with νFeC and inversely with νCO [55]; a positive potential polarizes the FeCO bond, and increases backdonation. Thus backbonding modulation, either by electrostatic polarization or by porphyrin substituent variation, produces the same negative frequency correlation, when the trans ligand is imidazole.
Figure 6.
Structure of the myoglobin heme pocket [pdb ID: 1A6G]. Variants at the indicated distal sidechains were used in constructing the experimental backbonding correlation.
Wild-type Mb has a distal histidine residue (H64), which forms a weak H-bond interaction with bound CO (evidenced by a 2 cm-1 shift of νCO in D2O [56]). The result is a point mid-way up the backbonding line (νCO = 1945 cm-1). Other variants that retain H64 cluster around this position. However, when H64 is replaced by a hydrophobic residue, the point slides down the backbonding line (νCO ~1960 cm-1), reflecting the diminished polarization. Distal residues that produce stronger H-bond interactions lie higher on the line. Elephant Mb (WTe, νCO = 1938 cm-1) [57] has a glutamine in place of H64, while νCO = 1922 cm-1 in a V68N variant; Val68 is directly adjacent to the bound CO, and the Asn replacement interacts strongly. At the top of the line (νCO = 1909 cm-1) is a hemoglobin from the Ascaris nematode, which has distal Gln and Tyr residues, both positioned to H-bond with the bound CO [58]. Meanwhile, the low end of the line (νCO = 1984 cm-1) is occupied by the double mutant H64V/V68T. In this variant the introduced Thr residue is oriented (via H-bonding to a backbone carbonyl) so that its O atom lone pairs point at the bound CO [55, 59-61], providing negative polarity, and inhibiting backbonding. Thus distal polar effects can modulate backbonding over a wide range in these wild-type and mutant heme proteins.
3.2 Thiolate axial ligation
Replacing imidazole with a stronger donor can be expected to decrease νFeC further via σ competition. Indeed, the CO adducts of cytochrome P450 [62-68], which has a thiolate proximal ligand from a cysteine sidechain, occupy a backbonding line below the Mb line, in the νFeC/νCO map (Fig. 5). The P450 points spread along the backbonding line because they include complexes with a series of substrates and inhibitors that induce interaction of the bound CO with distal Thr and Asp residues. These H-bond donors are believed to act as a proton relay in the O2 cleavage reaction catalyzed by the P450 class of enzymes [69, 70].
DFT modeling with CH3S- as axial ligand for FeCO with substituted porphines produces a backbonding line with a lower intercept than for pyridine as axial ligand, as expected26 (Table 2).
The nitric oxide synthase (NOS) enzymes are heme proteins that also have proximal cysteine residues. Their CO adducts form a separate backbonding line [71-74], in between the P450 and Mb lines (Fig. 5). Again the points are spread out along the line because various substrates and inhibitors induce variable interaction of the bound CO with polar groups in the heme pocket. The likely reason that the NOS line lies higher than the P450 line is stronger hydrogen bonding to the thiolate sulfur atom, which lowers the thiolate donor strength. In P450 there are three H-bonds from backbone NH groups [75], while in NOS there are two such H-bonds and an additional, stronger H-bond from a nearby Trp sidechain [76-78].
3.3 Proximal imidazole H-bond modulation
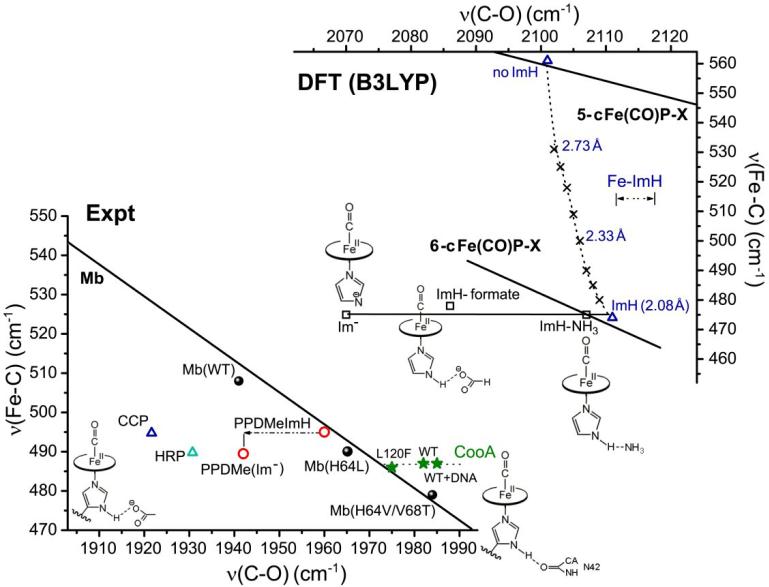
The donor strength of the histidine ligand can also be modulated by H-bonding. In this case H-bond donation from the NH group (opposite to the Fe-bound N atom of the imidazole ring) strengthens the Fe-imidazole bond, by giving the ligand imidazolate character. The proximal imidazole in Mb engages in moderate H-bond donation, to a backbone carbonyl and to the OH group of a nearby serine residue, whereas in peroxidases, there is a strong H-bond to the anionic carboxylate group of an aspartate residue [79]. Reflecting the imidazolate character of the proximal ligand, the νFeC/νCO points of horseradish peroxidase (HRP) [80] and cytochrome c peroxidase (CCP) [81] fall well below the Mb line, and close to the P450 line (Fig. 7). (Depending on solution conditions there are several forms of the peroxidase CO adducts, reflecting a dynamic interplay of proximal and distal interactions[82]). Likewise falling below the line is the model complex in which the trans imidazole is deprotonated, (FeCO)(PPDME)(Im-) (PPDME = protoporphyrin dimethylester) [80].
Figure 7.
Effects of Fe-imidazole bond strength changes on νFeC and νCO of FeCO porphyrin adducts. Top: DFT computed values[22]. The solid line is the backbonding correlation for substituted porphine models, ligated by neutral imidazole. Placing H-bond acceptors (NH3, HCO2-) at the imidazole NH, or deprotonating the imidazole (squares) decreases νCO, with little change in νFeC. Constraining the Fe-imidazole bond to increasing distances (x's) raises νFeC, with only a slight lowering of νCO. Bottom: Experimental data. The solid line is the backbonding correlation for myoglobin variants. Deprotonating the axial imidazole in the PPDME (protoporphyrin dimethyl ester) adduct decreases νCO, with little change in νFeC (red circles)[79]. Similar shifts from the Mb line are seen for HRP (horseradish peroxidase[79]) and CCP (cytochrome c peroxidase [80]) (blue triangles), reflecting a strong H-bond from the proximal imidazole to an aspartate sidechain. A shift to higher νCO is seen for the CO sensor CooA [83], attributed to loss of an asparagine H-bond via heme displacement upon CO binding; the shift is abolished in the L120F mutant, which inhibits the heme displacement (see text).
While νCO is strongly shifted down in (FeCO)(PPDME)(Im-), relative to the neutral imidazole adduct (FeCO)(PPDME)(ImH), there is little change in νFeC. This behavior is consistent with DFT computations showing that ImH deprotonation, or H-bonding [22, 83] shifts νCO but not νFeC (see Fig. 7, top). The stronger trans ligand donation weakens the FeC bond via σ competition, but this is offset by the increased charge on the Fe, which increases backdonation. The two effects on νFeC cancel, and the increased backdonation selectively shifts νCO.
The opposite νCO shift is expected when proximal imidazole H-bonding is diminished. This effect has been observed for the CO sensor heme protein CooA [84], in which H-bond donation from the proximal imidazole is to the amide sidechain of a nearby asparagine, Asn42 [85]. Spectroscopic evidence indicates that CO binding induces a sliding motion of the heme group, as part of the sensor activation mechanism, which involves DNA binding and gene regulation [84, 85]. The νFeC/νCO point lies to the right of Mb line (Fig. 7, bottom), consistent with a weakened Fe-C bond resulting from the heme motion. Displacement from the Mb line is diminished (along with sensor activity) in a Leu29Phe mutant, consistent with the bulky Phe sidechain hindering the heme motion. However the displacement is increased when CooA is bound to its target DNA, indicating increased heme motion in the active complex [85]. All three points lie on a horizontal line, which extrapolates to the Mb line at a position close to that of Mb variants with hydrophobic replacements of the distal histidine (Fig. 7, bottom), consistent with the known hydrophobic structure of the heme pocket in CooA [84]. This behavior indicates that the Fe-C weakening in the CO adduct is due to disruption of the proximal H-bond to Asn42 as a result of the heme sliding.
An alternative mechanism was considered, in which heme sliding might induce mechanical strain on the Fe-His bond, forcing it to weaken. This mechanism could be ruled out by DFT computations, in which mechanical strain was modeled in (ImH)Fe(II)NO porphine by constraining the Fe-His bond to increasing lengths, in silico, reoptimizing the structure and recalculating frequencies [22]. The result was a monotonic increase in νFeC, eventually reaching the 5-coordinate value when the bond was broken, but with little change in νCO (Fig. 7, top). Thus Fe-His weakening from mechanical strain can be readily distinguished from proximal H-bond weakening by a nearly orthogonal expected shift on the νFeC/νCO diagram. No examples of mechanical strain have so far been found among heme protein CO adducts.
3.4 Steric effects: FeCO bending vs compression
Early studies on heme protein FeCO adducts attempted to interpret the data in terms of FeCO bending, since the prevailing view was that the distal histidine of Mb reduced the CO/O2 affinity ratio by sterically imposing a significant degree of bending [2, 13, 17, 86-88]. This view has been overthrown by subsequent experimental and computational developments [88, 89]. The main cause of the reduction in the CO/O2 affinity ratio is the distal imidazole H-bond to the bound ligand, which is much stronger for O2 (effectively superoxide anion in the FeO2 adduct) than for CO [90-93].
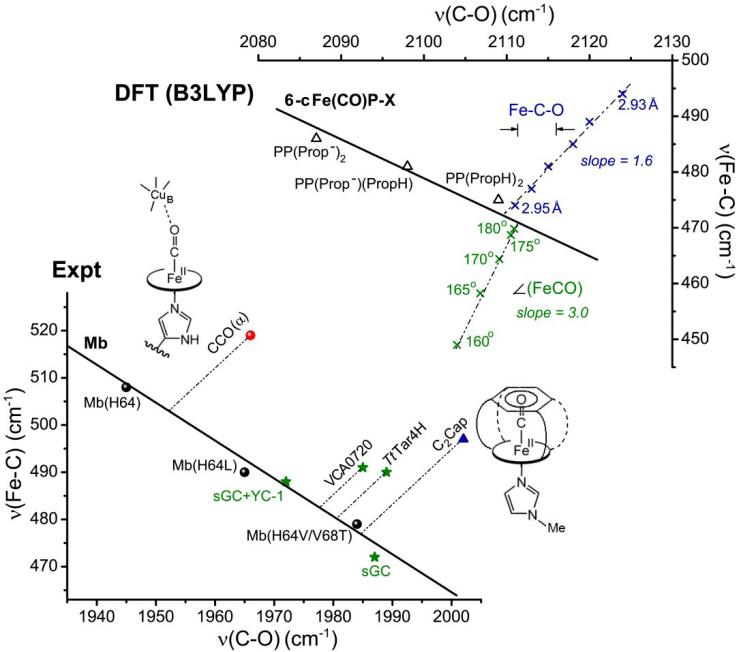
If steric forces did bend the FeCO, the result should be a reduction in both νFeC and νCO because both bond orders would diminish. This effect has been evaluated computationally by constraining the FeCO O atom to positions increasingly far from the heme normal [17, 22]. The result is a steady progression of the νFeC/νCO pairs below the backbonding line (Fig. 8, top). Modest displacements, up to 0.4 Å were judged to be within the experimental scatter, and would not be energetically significant.
Figure 8.
Effects of steric crowding and of strong H-bonding to the heme propionates in Fe(II)CO adducts. Top: DFT modeling. The solid line is the backbonding correlation for imidazole-ligated Fe(II)CO adducts of substituted porphines. Adducts of protoporphyrin IX (heme) with 0, 1 or 2 protons on the propionate substituents fall on the same line, the degree of backbonding increasing with substituent charge[22]. The effect of bending the FeCO unit is downward displacement of the νFeC/νCO from the line, while the effect of Fe-CO bond compression is upward displacement from the line. Bottom: Experimental data. A compression effect is evident in the upward displacement for the imidazole-ligated Fe(II)CO adduct of C2Cap[85], whose structure reveals a close contact of the CO with the capping benzene ring. Compression effects may also explain the upward displacements for cytochrome c oxidase (CCO)[94,95], which holds a Cu+ ion close to the CO, and the H-NOX proteins TrTar4H and VCA0720[101]. Soluble guanylate cyclase (sGC), another member of the H-NOX family, falls on the line, but at an anomalously low position, possibly due to strong H-bonding to the propionates. The upward shift of sGC upon binding the activator YC-1, may signal disruption of these H-bonds[104].
Large downward deviations have not been observed in heme protein CO adducts, and it seems unlikely that steric contacts can significantly bend the FeCO unit. The contacting residues are likely to move away instead, via torsional motions. Even in highly constrained model porphyrins with covalent superstructures, crystal structures show only small FeCO angular distortions, but large displacement of the superstructure, as well as distortions of the porphyrin ring [94].
However, steric crowding can be sufficient to compress the Fe-CO bond somewhat. A documented case is the constrained porphyrin C2Cap, in which a benzene ring is strapped laterally to a porphyrin via short covalent tethers. The crystal structure of the CO adduct, with N-methylimidazole as axial ligand, shows a nearly linear FeCO, but a short distance, 2.80 Å between the O atom and the center of the benzene ring [94]. The νFeC/νCO frequencies, 497/2002 cm-1 [86], place this adduct far above the backbonding line (Fig. 8, bottom). The effect of compression was modeled via DFT, by constraining the distance between the O atom and the Fe atom [22]. Decreasing this distance shortened the Fe-C bond with a smaller shortening of the CO bond. Accordingly, the νFeC/νCO points moved steadily towards higher νFeC frequencies, and slightly higher νCO frequencies (Fig. 8, top).
Among proteins, a compression effect has been suggested for the CO adduct of cytochrome c oxidase (CCO), whose νFeC/νCO point [95, 96] is also far above the backbonding line (Fig. 8, bottom). The CCO heme is part of a binuclear site, which also contains a Cu+ that is close enough to compress the FeCO [97-99]. The Cu+ also provides positive polarity, thereby increasing backbonding. If the compression effect is modeled by drawing a line from the cyt ox νFeC/νCO point, parallel to the computed bond compression line in Fig. 8(top), it intersects the backbonding line at a point between wild-type Mb, with its distal histidine, and mutants with hydrophobic pockets. This point of intersection suggests that the polarizing effect of the Cu+ is somewhat weaker than a H-bond. (This modeling is only suggestive, since the computed compression slope may differ somewhat from the hypothetical experimental slope.) Another possible example of compression is TtTarH, the first member of the extensive H-NOX sensor family [100] for which a crystal structure was available [101]. It has a crowded distal heme pocket, and QM/MM modeling has indicated a significantly shortened Fe-C bond [22]. Its νFeC/νCO point lies well above the backbonding line (Fig. 8 bottom) as does that of VCA0720, another H-NOX protein [102].
3.5 sGC : propionate H-bonding and porphyrin buckling
However, still another member of the H-NOX family, soluble guanylate cyclase (sGC) does lie on the backbonding line. No atomic structure is available for this key mammalian transducer of NO signaling [103]. But homology modeling based on the TtTarH structure suggests that sGC has a large hydrophobic binding pocket, that would be sterically uncrowded [104].
sGC lies at the low end of the backbonding line, even below the H64V/V68T mutant of Mb. However, homology modeling indicates the absence of a negatively polar residue, like the Thr lone pair in Mb(H64V/V68T). A possible source of diminished backbonding is the strong H-bonding to the propionate sidechains of the porphyrin, seen in the TtTarH structure [101]. These H-bonds are donated by a triad of residues in the YxSxR sequence, which is a hallmark of all H-NOX proteins [100]. When the activator molecule YC-1 is added to the sGC-CO adduct, νFeC/νCO moves up the backbonding line [105], suggesting disruption of these H-bonds. Supporting this suggestion is the observation of other changes in the RR spectrum, which indicate an altered conformation of the porphyrin ring [106].
The propionate neutralization hypothesis was tested via DFT modeling [22], which predicts a substantial shift of νFeC/νCO down the backbonding line when the propionates are protonated (Fig. 8, top). This shift is consistent with the inductive effects seen for electron-withdrawing substituents in the TPP-Y porphyrins. The propionic acid substituents are more electron withdrawing than propionate, and diminish the backbonding. Experimental tests of the hypothesis via mutations in the YxSxR sequence [107] were somewhat obscured by the finding of multiple conformations in the resulting variants; however significant νCO lowerings were observed for some of the conformers.
Another suspected source of spectral perturbation was the highly distorted porphyrin ring revealed in the structure of TtTarH [101]. However DFT modeling indicated surprisingly little influence of this distortion on the νFeC and νCO frequencies [22], and this prediction has been borne out by mutational studies in which the steric constraints inducing the porphyrin distortion were relaxed [105, 106]. νFeC and νCO were essentially unaffected.
4. Fe(III)NO adducts
4.1 Lone pair donor interactions
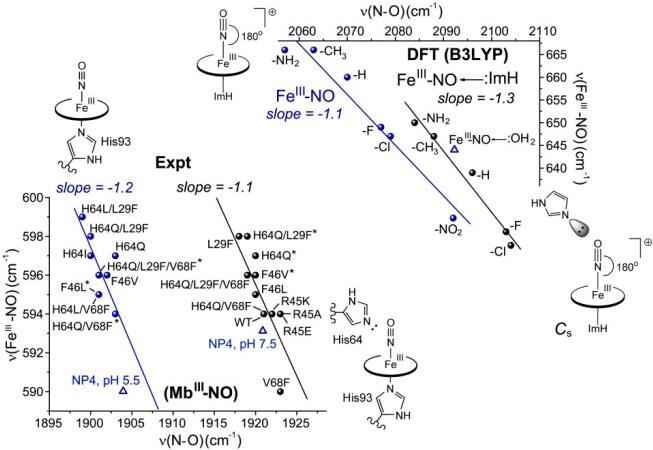
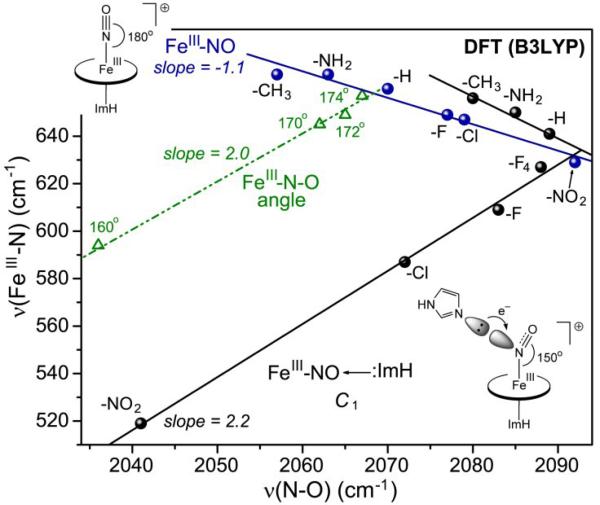
Unlike CO and O2, NO is capable of binding Fe(III) as well as Fe(II) porphyrins. However, Fe(III)NO adducts are prone to reduction, owing to the great stability of Fe(II)NO adducts. Consequently gathering systematic spectroscopic data has been difficult. Use of the graded series of TPP-Y adducts was unsuccessful, because Fe(III)NO reduction was too fast [29]. However, with rapid RR spectral collection, it was possible to collect spectra of the Mb distal variants [29], that had provided useful systematics for Fe(II)CO and Fe(II)NO (see Section 5) adducts. When the results were plotted on a νFeN/νNO map (Fig. 9, bottom), the points appeared as a scatter plot, until it was noticed that the plot followed two parallel negative correlations, depending on whether the variant contained an intact distal histidine residue.
Figure 9.
Effect of distal lone pairs on the νFeN/νNO correlations for imidazole-ligated Fe(III)NO porphyrin adducts. Top: DFT-computed data for complexes of substituted porphines, with and without a lone pair interaction from a distal imidazole; the point for a modeled water lone pair interaction (blue triangle) falls on the same line[29]. Bottom: experimental data for myoglobin variants with and without a distal histidine residue [29]. Shown in blue triangles are points for nitrophorin 4 at pH 5.5, where the NO adduct is enclosed in a hydrophobic pocket, and at pH 7.5, where the pocket is open and contains distal water molecules[108,109].
Fe(III)NO and Fe(II)CO adducts are isoelectronic, and might be expected to show similar backbonding behavior. Indeed electronic structure calculations indicate that the Fe(III)NO ground state is best described as Fe(II)(NO+) [28]. Although the backbonding orbitals are the same for Fe(II)CO and Fe(II)(NO+), the positive charge on the latter changes the character of distal interactions. DFT modeling revealed that when an imidazole molecule was placed near the bound NO, a stable structure could only be obtained if the lone pair of the unprotonated imidazole N: atom, and not the NH proton, was directed toward the NO [29]. The energy of the lone pair interaction was computed to be ~-1.2 kcal/mol [29], consistent with the observed 7-10-fold increase in the Fe(III)NO dissociation rate when the distal histidine in Mb is replaced by apolar residues [90].
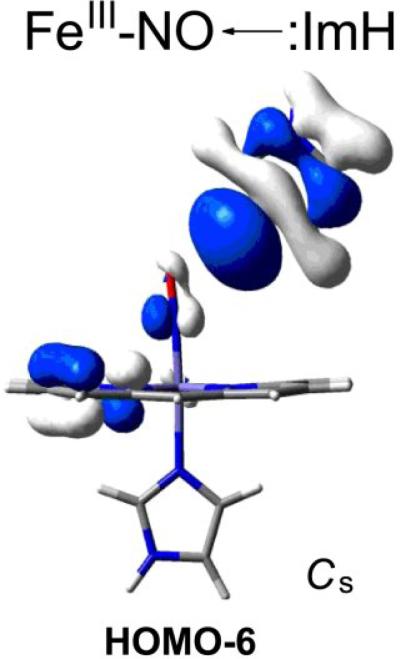
When Fe(III)NO spectra were computed for the P-X series of substituted porphines, with imidazole axial ligands, the result was a negative νFeN/νNO backbonding correlation [29] (Fig. 9, top). When a distal imidazole lone pair interaction was then included, the result was a nearly parallel line, with higher νNO values. The slopes of the computed lines are remarkably close to the experimental Mb slopes, and the νNO upshift is comparable. The origin of this curious shift was traced to a unique orbital interaction: in addition to the nearly degenerate pair of backbonding Fe-dπ and NO π* orbitals that accounts for the negative slope of the νFeN/νNO correlation, there is an orbital (Fig. 10), involving a distal imidazole lone pair interaction with the NO π* orbital, as well as the porphine π orbitals, but not the Fe dπ orbitals. The lone pair pushes electron density out of the NO π* orbital and onto the porphine, thereby strengthening the NO bond, with little effect on the Fe-NO bond, and causing the shift of the νFeN/νNO correlation to higher νNO.
Figure 10.
HOMO-6 can account for the selective shift to higher νCO when a lone pair donor interacts with ONO of Fe(III)NO heme adducts. The interaction pushes electron density out of the NO π* orbital and onto the porphyrin, strengthening the NO bond, with little effect on the Fe-NO bond.
Essentially the same shift was obtained when a lone pair interaction with a distal H2O was modeled (Fig. 9, top) [92]. This result can explain why the νFeN/νNO points for the NO-binding heme protein nitrophorin 4 (NP4) [108], falls on the Mb Fe(III)NO lines with and without a distal histidine, at pH 7.5 and 5.5, respectively (Fig. 9, bottom) [109, 110]. NP4 lacks a distal histidine, or any other polar residue. However, the hydrophobic binding pocket, which is closed at pH 5.5, opens up at pH 7,5 and admits water molecules. Indeed a structured water is found in the crystal structure of the analogous cyanide adduct, next to the bound cyanide [108, 111, 112]. A lone pair interaction with this H2O can explain the NP4 shift at pH 7.5.
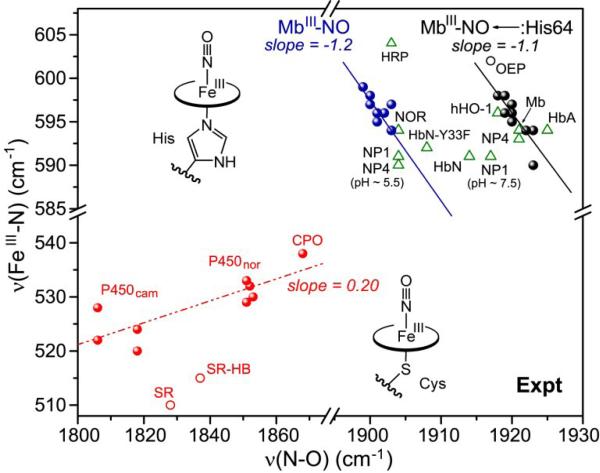
The literature contains a number of heme protein Fe(III)NO adducts, and Fig. 11 plots the available experimental data [6, 29, 82, 113-117]. All the histidine-ligated heme proteins (green triangles) fall between the hydrophobic and distal histidine lines of Mb, but a number of them appear at intermediate values. A likely reason is the presence of attenuated lone-pair interactions. For example, a different nitrophorin, NP1 [118, 119], falls on the hydrophobic line at pH 5.5, at the NP4 value, but has an intermediate position at pH 7.5. Like NP4 the NP1 pocket opens at pH 7.5, but the cyanide adduct crystal structure shows fewer water molecules, and none that are localized near the bound ligand. Proximal effects may also play a role. The intermediate position of HRP [120, 121] likely reflects the donor effect of the strongly H-bonded proximal histidine ligand.
Figure 11.
Experimental νFeN/νNO pattern for Fe(III)NO porphyrin adducts having thiolate (bottom left region) or imidazole (upper right region) proximal residue. Thiolate adducts describe a positive correlation for cysteinate heme proteins [67,122-124] (red dots and dashed red line) and model compounds (red circles), with (SR-HB) and without (SR) an internal H-bond to the thiolate ligand[121]. Histidine-ligated heme proteins fall between the two negative backbonding correlations describing Mb variants with (black line) and without (blue line) a distal histidine (Fig. 9). A number of representatives fall between the lines (green triangles), due to variable lone pair interactions, or to variations in proximal ligand donor strength [ref. 29 and references therein].
4.2 Bending mechanisms
4.2.1 Thiolate ligation
Fe(III)NO adducts are relatively stable in thiolate-ligated porphyrin complexes, because the anionic thiolate stabilizes the Fe(III), relative to the Fe(II) oxidation state. A number of νFeN/νNO data have been reported for such complexes [122] and for heme proteins with cysteinate proximal ligands [68, 123-125]. When these data are plotted on the νFeN/νNO map, a positive, rather than a negative correlation is obtained (Fig. 11).
The positive correlation can be linked to bending of the Fe(III)NO unit, as a result of mixing between the dz2 and dxz orbitals (x being the direction of bending). The bent structure is accommodated by a pair of molecular orbitals dz2-σN and dxz-π*NO [126-129]. Although the Fe(III)NO ground state is Fe(II)(NO+), and is nominally isoelectronic with Fe(II)CO, the NO+ π* orbital energies are lowered sufficiently to allow mixing with the dz2 orbital when the axial ligand is a strong donor. The strongly donating RS- ligand drives up the dz2-σN orbital energy, increasing its mixing with dxz-σ*NO. The Fe-N-O angle is 160° in the crystal structure of a thiolate-ligated Fe(III)NO porphyrin adduct [130], consistent with reported structures of cysteinyl heme proteins [123, 124, 131].
The dz2-σN orbital energy is lowered, and the degree of bending is diminished, if the donor strength of RS– is decreased by H-bonding or protonation. DFT computations yield a Fe-N-O angle of 159° for methylthiolate-ligated Fe(III)NO porphine, but the angle increases to 180° when a proton is added to the thiolate [24]. Other computations indicate that νFeN and νNO increase together as H-bond donors are successively added [27]. This effect underlies the positive νFeN/νNO correlation seen for cysteinyl heme protein Fe(III)NO adducts (Fig. 11). The νFeN/νNO frequencies increase in the order cytochrome P450cam < cytochrome P450nor < chloroperoxidase (CPO), which is the order of increased H-bonding to the cysteinyl sulfur atom, as judged by analyses of the crystal structures [132], and also by vibrational data on the corresponding Fe(II)CO adducts [82]. The greater the donor strength, the greater the bending angle, and the lower the νFeN/νNO frequencies.
4.2.2 Electron-donating meso substituents
DFT modeling by Linder and Rogers [133] established another mechanism for producing a positive νFeN/νNO correlation, namely attaching electron donating substituents to the porphine ring at the meso carbon positions, Cm. The porphine HOMO, a2u, has large coefficients at the Cm and at the pyrrole N atoms. It also has a substantial overlap with the dz2 metal orbital in non-centrosymmetric metallo-porphyrins, such as the MXO adducts under consideration. Consequently electron donating Cm substituents raise the dz2 energy, increasing the dz2-σN/dxz-π*NO mixing, and therefore increasing the Fe-N-O bending. Increasingly strong electron donors at Cm produce a positive νFeN/νNO correlation [133]. This effect has not been observed in heme proteins, all of which have H atoms at Cm and substituents at the pyrrole Cβ atoms. The a2u orbital has nodes at the Cβ atoms, and Cβ substituents have a purely inductive effect. This is why DFT modeling of the backbonding correlations has generally involved substituents at the Cβ positions.
4.2.3 Lone-pair interactions with NNO
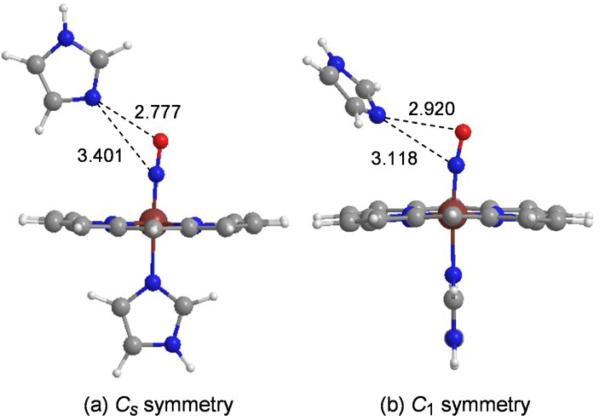
Fe-N-O bending can also be induced by interaction of lone pair donors with the N atom of the bound NO, NNO. Both the O and N atoms are available for such an interaction, but when the O atom is the acceptor, the effect is to maintain the negative νFeN/νNO backbonding correlation, but with upshifted νNO values, as discussed in Section 4.1. The upshifted line in the DFT plot (Fig. 9) was obtained by holding the orientation of the distal ImH in a plane parallel to the proximal ImH, maintaining overall Cs symmetry of the complex [29] (Fig. 12). When the distal ImH was instead allowed to rotate out of this plane, it moved significantly closer to the N atom of the bound NO, due to relief of a steric contact with the porphyrin. At the same time, the FeNO was found to bend, reflecting the lone-pair to NNO interaction. The degree of bending increased as the substituents became increasingly electron withdrawing, and the distal imidazole moved closer to the N atom [29].
Figure 12.
DFT-optimized structures for a distal imidazole interacting with (ImH)Fe(III)NO porphine, (a) restricted to the plane of the proximal ImH (Cs symmetry); (b) allowed to rotate out of the plane (C1 symmetry), thereby relieving a non-bonded contact with the porphine, and allowing the distal ImH to move closer to NNO.
When the νFeN/νNO values were plotted, a bifurcated correlation was found (Fig 13), having a negative slope for electron donating substituents, but a positive slope for electron withdrawing substituents. The break occurred on the electron withdrawing side of the H substituent. (The effect is not seen experimentally in heme proteins, since the Cβ substituents are electron-donating hydrocarbons.) Beyond this point, backbonding is overridden by the bending induced by the lone pair interaction with NNO. The association of bending with a positive νFeN/νNO correlation was confirmed in DFT computations on (ImH)Fe(III)NO porphine, with the Fe-N-O angle constrained [92]. As the angle was lowered from 180°, the νFeN/νNO points steadily fell away from the backbonding line (Fig. 13), just as they did for Fe(II)CO (Fig. 8, top). Indeed the slope of this line for constrained bending is essentially the same as that produced by bending from the lone-pair:NNO interaction induced by electron withdrawing porphine substituents.
Figure 13.
DFT-computed νFeN/νNO correlations for (ImH)Fe(III)NO-P-X, without (blue points and line, as in Fig. 9), and with a distal ImH that is rotated to allowed to interact with NNO (black points and lines). In the latter case, the correlation is negative for electron-donating substituents, but positive for electron-withdrawing substituents, as the ImH approaches NNO, and Fe-N-O angle is lowered. A parallel positive correlation is obtained if bending is induced by constraining the Fe-N-O angle (green triangles and line).
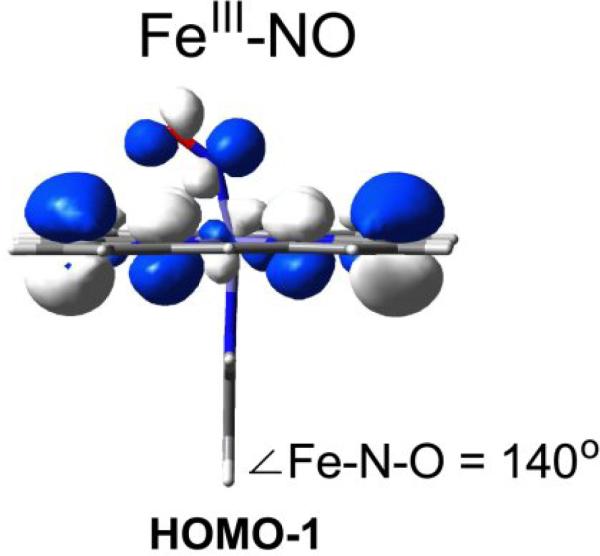
Fig. 14 shows the physical mechanism underlying the effect of bending, which induces an antibonding combination of the dxz and π*NO orbitals. As a result the HOMO-1 is antibonding with respect to both the Fe-N and the N-O bond. As bending increases both bonds weaken in concert, producing a positive νFeN/νNO correlation.
Figure 14.
The HOMO-1 a2u-type orbital for bent (ImH)Fe(III)(NO) porphine (electron density has been removed from the front and back sides of the molecule, to show the Fe–N–O contribution). The HOMO-1 is antibonding with respect to both the NO and Fe-NO bonds, explaining the positive νFeN/νNO correlation as the Fe-N-O angle decreases.
4.3 Stronger nucleophiles; reductive nitrosylation
Because the heme group lacks electron withdrawing substituents, the lone pair of a distal histidine, or of a water molecule, is attracted to the ONO atom of heme protein Fe(III)NO adducts (see in Section 4.1), as is that of a modeled peptide carbonyl group [24]. However, stronger nucleophiles would likely shift toward the NNO atom, bending the Fe-N-O unit and interacting with the sp2 orbital. This is the probable pathway of ‘reductive nitrosylation’ [134, 135], in which hydroxide ion attacks the bound NO, forming nitrous acid, HONO, and Fe(II) heme (Fig. 15). The Fe(II) heme is trapped as the stable Fe(II)NO adduct by excess NO in solution. Because of the requirement for hydroxide, the rate of Fe(III)NO autoreduction increases with increasing pH.
Figure 15.

Mechanism of Fe(III)NO reductive nitrosylation in heme proteins. The strong nucleophile, OH-, attacks NNO, producing the indicated intermediate, which releases nitrous acid. The resulting Fe(II) heme is trapped by excess NO as the Fe(II)NO adduct.
This process was modeled via DFT, by placing a hydroxide in proximity to the bound NO in (ImH)Fe(III)NO porphine [29]. Optimization led the hydroxide to attack the NNO, and produce a stable HONO adduct. This adduct had elongated Fe-NHONO and Fe-NImH bonds, and a lowered Mulliken charge on the Fe (1.071e vs 1.106e for the starting (ImH)Fe(III)NO porphine), demonstrating Fe reduction. A Fe-bound HONO intermediate is consistent with kinetic studies of reductive nitrosylation in heme proteins [135]. In principle, a similar mechanism of reductive nitrosylation would be available to nucleophiles other than hydroxide, including nitrite, thiols and amines, and possibly to NO- in a suggested mechanism for the NO reductase enzyme [29].
5. Fe(II)NO adducts
5.1 Axial ligation preserves backbonding but shifts νFeN up
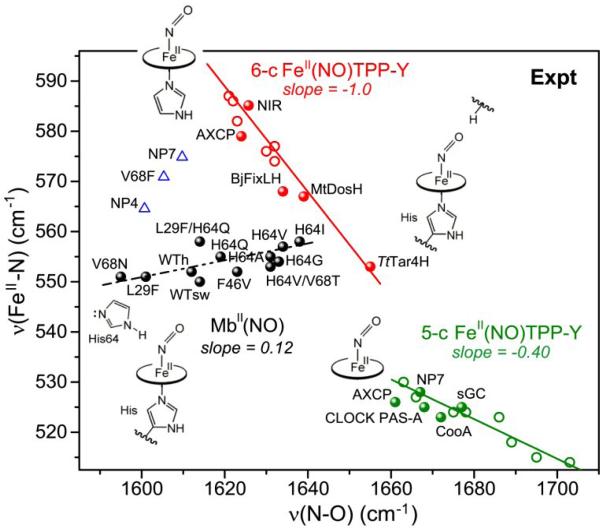
Six-coordinate Fe(II)NO adducts have posed special problems for analysis of the vibrational pattern, because the νFeN/νNO points for heme proteins initially appeared as a scatterplot [54, 136], and because gathering RR data on protein-free porphyrin adducts is experimentally difficult. The difficulty arises because NO exerts a strong trans effect on Fe(II), resulting in an extraordinarily long and weak bond to an axial ligand [137]. Irradiation by the Raman laser is sufficient to dissociate the axial ligand, so that solution spectra contain signal only from the 5-coordinate Fe(II)NO adduct [54]. This problem was eventually overcome by freezing solutions containing sufficient ligand concentration to form the 6-coordinate adduct, as judged by the absorption spectrum [30].
Frozen solution RR spectra for a series of (4-MeImH)Fe(II)NO adducts of the same TPP-Y porphyrins as used for the analysis of 5-coordinate adducts (Fig. 2) again yielded a negative νFeN/νNO correlation [35] (Fig. 16 – red circles). However, instead of lower νFeX values, as observed for Fe(II)CO adducts (Fig. 5), the 6-coordinate Fe(II)NO adducts have higher νFeX values than the 5-coordinate adducts. This result is counter-intuitive, since the NO trans effect should result in a weakening of the Fe-NO bond when an axial ligand is bound. Indeed, the DFT-computed Fe-NO distance does increase when an axial ImH is bound [30].
Figure 16.
Experimental νFeN/νNO correlations for Fe(II)NO porphyrin adducts. Green line – 5-coordinate adducts of substituted TPP's (circles) and of several heme proteins (points). Red line – 6-coordinate adducts of substituted TPP's (circles) and of several heme proteins (points) likely having H-bonds directed at the O atom of the FeNO. Black line – 6-coordinate adducts of myoglobin variants having H-bonds of different strengths directed at the N atom of the FeNO. Blue triangles – other heme proteins, likely having additional backbonding mechanisms [References to original data can be found in ref.6].
The apparent discrepancy between bond weakening and frequency up-shift is attributable to altered vibrational mixing between Fe-N stretching and Fe-N-O bending coordinates in the bent Fe(II)NO adducts (see discussion in Section 2.). Because of this mixing, the connection between mode frequency and bond strength is vitiated. DFT calculations indicated a lower Fe-NO force constant for six-coordinate (ImH)FeNO adduct than for the 5-coordinate adduct, as expected from the bond weakening, but a lower effective mass for the ‘νFeN’ mode, as a result of altered coordinate mixing, resulting in a higher frequency [30]. The computed up-shift was less than observed, reflecting the imperfect calculation of mode frequency and composition by DFT. However, the results establish a mechanism for the paradoxical νFeN upshift in the 6-coordinate adducts.
5.2 Distal effects; ambidentate H-bonding
In contrast to the well-behaved (ImH)Fe(II)NO model porphyrins, the data for Fe(II)NO heme proteins had seemed to describe a scatter plot [54, 136], until it was realized, with the help of DFT modeling that the bound NO can be ambidentate with respect to H-bonding [23].
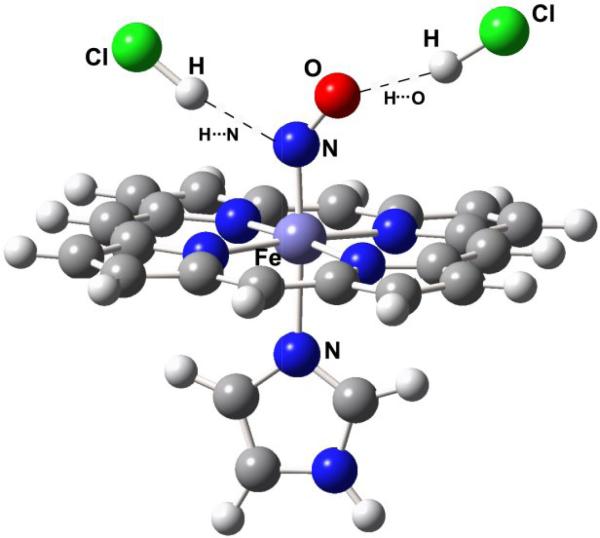
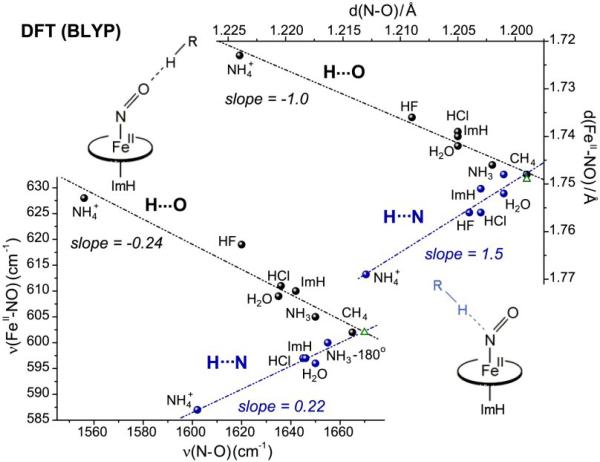
When a H-bond donor was placed computationally in the vicinity of the NO in (ImH)Fe(II)NO porphine, optimization led to either of two stable structures, with H-bonding to either O or N (Fig. 17) [23]. This result contrasts with the computational modeling of H-bonding to the Fe(II)CO adduct, for which a single structure with an optimum C-O.....H angle or ~100° was obtained [138]. In the case of CO, a π* orbital, partially filled by back-bonding serves as a delocalized acceptor. For NO, however, the intrinsic bending produces two potential acceptors, the O atom, which accumulates charge via backbonding, and the incipient sp2 orbital, on the back side of the N atom, which can be polarized by H-bonding. In the initial Fe(II)NO structure, the computed Mulliken charge on the O atom is substantial, -0.2, and increases upon H-bonding to O (up to -0.3). The initial charge on N is small, -0.005, but increases substantially upon H-bonding to N (up to -0.12) [23].
Figure 17.
DFT-computed structures of (ImH)Fe(II)NO porphine, with a H-bond donor placed near either NNO or ONO, and optimized. Either structure is stable.
H-bonding to Fe(II)CO adducts moves the νFeX/νXO point up the backbonding line (Fig. 5), but for Fe(II)NO this is only the case when the ONO is the H-bond acceptor. DFT modeling shows that when H-bond donors of varying strength interact with ONO or NNO, the νFeN/νNO correlation is bifurcated (Fig. 18, bottom) [23]. H-bonding to ONO produces a backbonding line, while H-bonding to NNO produces a line with positive slope. Similar results are obtained for the correlation of Fe-N and N-O distances (Fig. 18, top), confirming that both bonds weaken in concert when the H-bond acceptor is NNO, while Fe-N weakens and N-O strengthens when the acceptor is ONO, as expected for backbonding. The reason for the positive NNO correlation is the same as the bending-induced positive correlation for Fe(III)NO adducts (Section 4.2.3.), namely mixing of the dz2-σN and dxz-σ*NO orbitals, which induces an antibonding effect for both the Fe-X and X-O bonds (Fig. 14). The stronger the H-bond to NNO the greater the mixing, as electron density is drawn into the sp2 orbital on NNO. As might be expected, H-bonding also decreases the Fe-N-O angle; however, the computed angle changes are small, <4°[30], in contrast to the large angle changes induced by lone-pair interactions at NNO for Fe(III)NO adducts (Section 4.2.3.).
Figure 18.
Correlations of DFT(BLYP)-computed bond distances (top) and frequencies (bottom) for imidazole-ligated Fe(II)NO porphine adducts with H-bond donors of differing strengths, directed at either the O (black points and line) or the N (blue points and line) atom of the bound NO. Green triangles represent structures without distal interaction.
Coming back to Fe(II)NO heme proteins, a similar bifurcation is observed when the experimental data are plotted (Fig. 16) [54, 139-141]. Some proteins (red dots) fall on the same backbonding line as the (4-MeImH)Fe(II)NO TPP-Y adducts (red circles), presumably because distal H-bonds, if any, are directed at the ONO atom. Indeed the structure of one of these proteins, nitrite reductase (NIR) [142], reveals a strong H-bond from a distal histidine to ONO.
Other heme protein Fe(II)NO adducts fall below the line, and a group of Mb variants (black dots) describe a positive correlation with a slope close to that of the computed correlation for H-bonding to NNO (Fig. 18). In Mb, unlike NIR, the NδH of the distal histidine is closer to NNO than to ONO [143-145]. The νFeN/νNO point for wild-type Mb falls far from the backbonding line, but when the distal histidine is replaced by a weaker H-bonding residue, glutamine (H64Q), the point moves toward the line, along the positive correlation, and when it is replaced by hydrophobic residues (H64V,I,A) the point falls close to the backbonding line. When a valine residue that contacts NO from the side is replaced by asparagine (V68N), the point moves farther away, still on the positive correlation, implicating a strong H-bond to NNO from the asparagine. Thus the positive correlation defines the NNO H-bonding line, in conformity with the DFT modeling. (Reasons for differing positions of other Mb variants are discussed in ref.[30])
Some heme proteins fall between the backbonding and NNO H-bonding line (blue triangles). Likely this dispersion reflects backbonding variations in proteins with NNO H-bonds of varying strength.
We note also that heme protein Fe(II)NO adducts in which the Fe-histidine bond is broken (NP7[146], AXP[147], CLOCK PAS-A[148], CooA[147], and myoglobin at pH 4 [149] – green dots) fall close to the line for 5-coordinate adducts, with small variations in the extent of backbonding. Evidently distal interactions have similar effects on the Fe(II)NO electronic structure in these adducts.
6. Fe(II)O2 adducts
6.1 Experimental Data
Vibrational data on Fe(II)O2 adducts are sparse because of several experimental difficulties. As mentioned in Section 2.1, these adducts are subject to rapid autooxidation. Porphyrin Fe(II)O2 adducts react rapidly with additional Fe(II) porphyrin to form Fe(II)OOFe(II) dimers, which promptly break down, eventually forming Fe(III)OH species. This process can be inhibited sterically, by employing superstructured porphyrins [31, 32, 150-153], or by encapsulating the heme in a heme protein. Even so, the Fe(II)O2 adducts are subject to autooxidation by other mechanisms at rates that depend on solution conditions [32].
Another serious difficulty is that the O-O stretching mode, νOO, is normally (i.e. in adducts with imidazole axial ligands) not detectable in RR spectra, due to weak enhancement. Apparently the O-O displacement is small in the resonant ν-ν* states, probably because of the essentially complete electron transfer in the Fe(III)(O2-) ground state, which effectively decouples the O2- from the electronic excitation. While the νOO mode is active in IR spectra, its frequency, ~1160 cm-1, places it in a spectral region that is crowded with porphyrin and protein vibrations, making detection and assignment difficult [153].
However, there are circumstances under which νOO does become detectable in RR spectra, presumably reflecting altered electronic coupling, although the mechanisms are currently obscure [154]. RR enhancement of νOO is found when the axial ligand is thiolate; data are available for a number of cysteinyl heme proteins and model complexes [6, 82]. RR enhancement of the νOO band is also observed for imidazole-ligated heme proteins with strong distal H-bonds to the bound O2 [3, 154, 155].
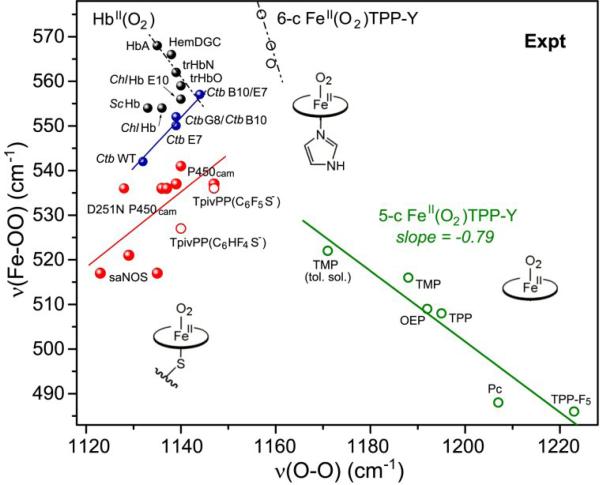
The available νFeO/νOO data are plotted Fig. 19. The 5-coordinate adducts (green circles) have been discussed in Section 2.1, and data for the 6-coordinate adducts with nitrogenous bases are limited to three complexes of the sterically hindered “picket fence” porphyrin [156-160]. The line through these three points is only suggestive. It is evident, however, that binding a nitrogenous axial ligand pushes νFeO up, although the Fe-O bond should (and does, see Section 6.2.) weaken. This behavior is similar to that of Fe(II)NO adducts, and the source of the anomalous upshift is likewise a change in the ‘νFeX’ mode composition [38].
Figure 19.
Experimental data for Fe(II)O2 adducts. Green circles – 5-coordinate adducts (as in Fig. 2); black circles – imidazole-ligated adducts; black dots – histidine-ligated heme proteins, with various distal H-bond interactions; red dots – cysteine-ligated heme proteins; red circles – thiolate-ligated porphyrin adducts. The blue line connects variants of a single protein, Ctb, in which distal H-bond donors are successively replaced. [References to original data can be found in ref.6]
Because of the special requirements for RR enhancement of νOO, data are available from only two sets of heme proteins, those having cysteinate proximal ligands (red dots) [154, 161-163], and those having strong H-bonding to the bound O2 (black dots) [6, 164-166]. The former display a positive correlation, albeit with substantial scatter. As in the case of Fe(III)NO adducts ( Section 4.2.1.) the positive correlation for cysteinate-ligated Fe(II)O2 adducts likely reflects different extents of H-bonding to the cysteinate S atom, producing variable dz2-σN/dxz-π*OO mixing due to the changing axial donor strength. This interpretation is supported by a pair of Fe(II)O2 model compounds, TpivPP(C6HF4S–) and TpivPP(C6F5S–) (red circles) [167, 168] that have thiolate axial ligands, with and without an internal H-bond to the S atom. Their νFeO/νOO points fall on the positive correlation, with the H-bonded model falling higher.
The heme proteins with strong H-bonding to the bound O2 describe a fan, bracketed by lines of positive and negative slope. This behavior is similar to that of Fe(II)NO heme proteins (Fig. 16), and may have a similar explanation, namely H-bonding to either the inner or outer O atom (Oi or Oo). In one microbial hemoglobin, the H-bond hypothesis is supported by the observation that νFeO and νOO move together to steadily higher values (blue dots in Fig. 19) as two strong distal H-bond donors are consecutively mutated [155].
6.2 DFT Modeling
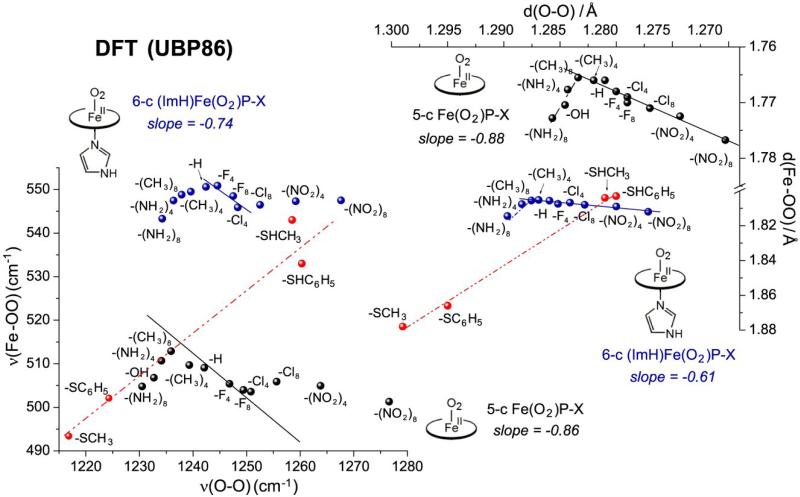
DFT modeling of 6-coordinate Fe(II)O2 adducts with imidazole as axial ligand shows the same pattern as the 5-coordinate adducts [49] (Fig. 20). In both cases, varying the substituents on the porphine produces well-behaved negative backbonding correlations in the distance plots for electron-withdrawing substituents. In both cases there is a break to a positive correlation for electron-donating substituents, reflecting the dominance of σ over π bonding, as discussed in Section 2.1. The frequency plots show a similar pattern, but the points deviate from the backbonding line for the most electron-withdrawing substituents, for the 6- as well as the 5-coordinate adducts.
Figure 20.
Correlations of DFT(UBP86)-computed bond distances (top) and frequencies (bottom), for 5-coordinate (blue) and imidazole-ligated (black) Fe(II)O2 P-X adducts. Both show positive correlations for electron-donating, and negative correlations for electron-withdrawing substituents. Also plotted (red) are thiol- and thiolate-ligated adducts, showing positive correlations for variable donor strengths.
Although the 6-coordinate pattern is the same as for 5-coordinate adducts, the points are systematically shifted to longer Fe-O distances, as expected from σ-donor competition between the O2– and ImH ligands for the Fe(III) dz2 acceptor orbital. Despite the longer Fe-O bonds, the νFeO frequencies shift to higher values, reflecting a shift in mode composition induced by the axial ligation [38, 49], as also seen for Fe(II)NO adducts ( Section 5.1).
Fig. 20 also shows the effects of replacing ImH with thiol or thiolate ligands in Fe(II)O2 adducts with unsubstituted porphine[49]. The neutral thiol points are not far from the ImH points, but deprotonation shifts the points to longer Fe-O distances, reflecting the strong donor character of thiolate anions. The shift is greater for methyl- than for phenyl-thiolate, the expected order of donor strengths. In this case, the νFeO frequency is well behaved, shifting to lower values, in the same order. The positive correlation defined by these points has a slope quite similar to the experimental correlation of the cysteinyl heme proteins (Fig. 19). This agreement supports the view that the variation among these proteins reflects changes in thiolate donor strength from H-bonding differences.
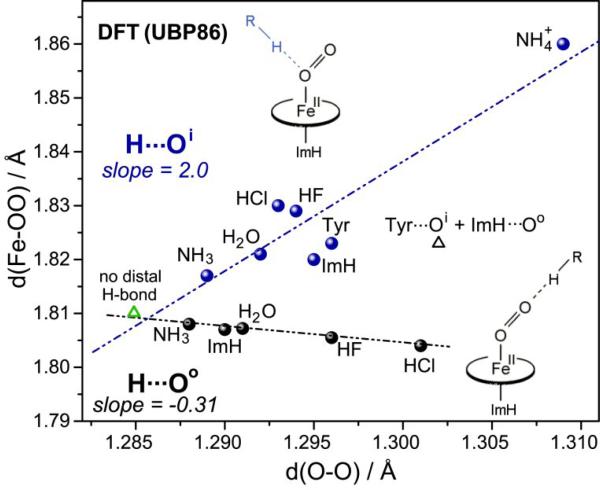
With regard to the effects of H-bonding to bound O2, DFT modeling [49] reveals that H-bond donors can stably bond to either the inner or the outer atom (Oi or Oo), as is the case for bound NO (Fig. 17). As in the case of Fe(II)NO, effects on bonding depend on whether the H-bond acceptor is Oi or Oo. When H-bond donors of varying strength are positioned near one atom or the other, and the geometry is optimized, the Fe-O and O-O bond distances correlate negatively if the acceptor is Oo, but positively if the acceptor is Oi (Fig. 21). This result is the same as for Fe(II)NO adducts except that the positive slope is larger (2.0 v. 1.5), and the negative slope is smaller (-0.31 v -1.0), for Fe(II)O2. As discussed in Section 5.2, the positive correlation is attributable to increased antibonding for both Fe-O and O-O bonds due to increased dz2-σO and dxz-π*OO mixing, as the sp2 orbital on Oi is increasingly polarized by the H-bonding. The negative correlation is the expected backbonding effect, as H-bonding to Oo polarizes the entire Fe(II)O2 unit, drawing Fe electrons into the π orbitals and weakening the O-O bond and strengthening the Fe-O bond. However, as noted in Section 2.1, backbonding is less effective for Fe(II)O2 than for Fe(II)CO or Fe(II)NO, because of the Fe(III)(O2-) electronic structure. The lesser importance of backbonding is reflected in the shallow negative correlation with H-bonding when Oi is the acceptor.
Figure 21.
Correlations of DFT(UBP86)-computed bond distances for imidazole-ligated Fe(II)O2 porphine adducts with H-bond donors of differing strengths, directed at either the outer (black points and line) or inner O (blue points and line) atom of the bound O2. Green triangle represents the structure without distal interaction.
Vibrational mode computations for the Fe(II)O2 adducts are currently in progress [49]. However, the well behaved distance correlations reinforce the interpretation offered in Section 6.1 for the heme protein frequency data (Fig. 19), namely that H-bonding to Oo increases backbonding, while H-bonding to Oi increases the orbital mixing that weakens the Fe-O and O-O bonds simultaneously.
7. Conclusions
The backbonding motif is clearly evident in negative νFeX/νXO correlations for 5-coordinate Fe(II)XO porphyrin adducts of all three gaseous molecules, CO, NO and O2. DFT successfully models the backbonding correlations. However, the computations show that Fe(II)O2 is at the edge of the backbonding pattern, and moves to a regime where σ bonding is dominant, when the modeled porphyrin substituents are electron donating. The diminished importance of backbonding variation for Fe(II)O2 is attributable to essentially complete electron transfer from Fe(II) to O2, resulting in a Fe(III)(O2–) ground state.
The backbonding correlations hold, despite the mixing of Fe-X stretching and Fe-X-O bending in the observed ‘νFeX’ mode, when the adducts are bent (NO and O2). However, the effects of changes in mode composition can be seen in altered backbonding slopes when computed bond distances, instead of frequencies, are correlated. More dramatically, altered mode mixing is responsible for the rise in νFeX when an axial ligand is bound to Fe(II)NO or Fe(II)O2 adducts, although the bond distance increases, as expected from the σ competition between the axial ligand and XO. Fe(II)O2 adducts are particularly prone to mode mixing alterations; systematic deviations from the computed backbonding correlation are seen in the frequency, but not the bond distance plots, even for the 5-coordinate Fe(II)O2 adducts.
For Fe(II)CO adducts, the effect of axial ligation is to shift the backbonding correlation, reflecting the σ bonding competition. This competition weakens the Fe-X bond, but the weakening is countered by increased backbonding due to the electron donation from the axial ligand. The increased backbonding lowers νXO, but there is little change in νFeX. Consequently, changes in axial ligand donor strength produce horizontal shifts of the νFeX/νXO points from the backbonding line.
However, for Fe(II)NO and Fe(II)O2 adducts, changes in axial donor strength produce positive νFeX/νXO correlations, because of changes in the dz2-σX and dxz-π*XO mixing in these bent structures. Increased mixing weakens both the Fe-X and X-O bonds. The same effect is seen for Fe(III)NO adducts, for which increasing the axial donor strength raises the dz2 sufficiently to induce dz2-σN and dxz-π*NO mixing, and bend the Fe-N-O unit.
For Fe(II)CO adducts, changes in distal electrostatic or H-bonding interactions alter the polarization of the FeCO unit, and shift the νFeC/νCO point up (positive or H-bonding interactions) or down (negative or electron pair donor interactions) the backbonding lines. For Fe(II)NO and Fe(II)O2 adducts, however, H-bonding produces a straightforward polarization effect on the entire FeXO unit, only if it is directed at the outer atom. H-bonding to the inner atom is also a stable interaction, and produces a positive νFeX/νXO correlation, again because of enhanced dz2-σX/dxz-π*XO mixing. Finally, Fe(III)NO adducts do not support distal H-bond interactions, but do support lone-pair donor interactions. When the interaction is with the O atom, the effect is to raise νNO, as electron density is driven out of the NO π* orbital, with little effect on νFeN. Computation indicates that interaction with the NNO atom would bend the Fe-N-O unit and produce a positive νFeN/νNO correlation. This mechanism has yet to be observed experimentally, but likely facilitates nucleophillic attack on NNO, e.g. by OH– during reductive nitrosylation of Fe(III)NO adducts.
νFeX/νXO maps are a powerful tool for monitoring heme protein interactions with the bound ligand, interactions that direct the protein activity. The data are most readily interpreted for Fe(II)CO adducts, which respond to proximal and distal interactions in a straightforward manner. However, the added complexities revealed by the other adducts can provide more detailed information about the structural dynamics of the protein.
Research Highlights.
Negative correlations between Fe-X and X-O stretching frequencies establish backbonding in XO adducts (X = C, N, O) of heme proteins.
For Fe(II)CO adducts, donation from the trans axial ligand decreases νCO, with little change in νFeC, and shifts the backbonding correlation.
For Fe(III)NO, Fe(II)NO and Fe(II)O2, dz2-dxz orbital mixing produces positive νFeX/νXO correlations, as the trans donation increases.
For Fe(II)NO and Fe(II)O2, negative or positive correlations are induced by H-bonding to the outer or inner XO atom.
Fe(III)NO adducts do not support distal H-bonds, but do support lone pair donor interactions. Strong donors interact with N, bending the FeNO.
Research Highlights.
The extent of backbonding in XO adducts (X = C, N, O) of heme proteins can be monitored via their Fe-X and X-O stretching frequencies, νFeX and νXO, for which negative correlations have been established through substituent effects on model heme adducts, and supported by DFT computations.
For Fe(II)CO adducts, increasing the donor strength of the trans axial ligand decreases νCO, with little change in νFeC, and shifts the backbonding correlation. For Fe(III)NO, Fe(II)NO and Fe(II)O2, increasing the trans donor strength produces positive νFeX/νXO correlations, reflecting enhanced dz2-dxz orbital mixing.
H-bonding to Fe(II)XO from heme pocket residues increases backbonding, but for NO and O2, H-bonding to the inner atom of the Fe(II)XO adduct produces a positive νFeX/νXO correlation, again due to enhanced orbital mixing.
Fe(III)NO adducts do not support distal H-bonds, but do support interaction with lone pair donors. For weak donors, e.g. imidazole or water, the effect is to increase νXO, with little change in νFeX, producing a shifted backbonding correlation. Stronger donors, e.g. hydroxide, are drawn toward the N atom, and can form a new adduct, e.g. HONO.
Acknowledgement
This work was supported by NIH Grant GM33576 to T.G.S.
Abbreviations
- IR
infrared
- RR
resonance Raman
- DFT
density functional theory
- QM/MM
quantum mechanical/molecular mechanical
- H-bond
hydrogen bond
- HOMO
highest occupied molecular orbital
- cyt P450cam
cytochrome P450 camphor hydroxylase
- P450nor
nitric oxide reductase cytochrome P450
- swMb
sperm whale myoglobin
- H-NOX
Heme-Nitric oxide/OXygen binding domain
- sGC
soluble guanylate cyclase
- Hb
hemoglobin
- HbASC
Ascaris hemoglobin
- HbN, HbO
hemoglobin I & II from Mycobacterium tuberculosis
- ChlHb
Chlamydomonas hemoglobin
- ScHb
Synechocystis hemoglobin
- HemDGC
heme-containing diguanylate cyclase
- Ctb
hemoglobin III from Campylobacter jenjuni
- hHO-1
human Heme oxygenase isoform 1
- NOS
nitric oxide synthase
- iNOS, nNOS
inducible & neuronal nitric oxide synthases
- saNOS
Staphylococcus aureus NOS
- NIR, NOR
nitrite & nitric oxide reductase
- CPO
chloroperoxidase
- HRP
horseradish peroxidase
- CCP
cytochrome c peroxidase
- CCO
cytochrome c oxidase
- AXCP
cytochrome c′ from Alcaligenes xylosoxidans
- BjFixLH
Bradyrhozobium japonicum FixL heme-PAS
- MtDosH
Methanobacterium thermoautotrophicum Dos heme-PAS
- CLOCK PAS-A
mammalian circadian protein CLOCK
- NP
nitrophorin
- CooA
carbon monoxide oxidation activator protein
- Arg
arginine
- Trp
tryptophan
- TMCH
3,3,5,5-tetramethylcyclohexanone
- CPRQ
camphoroquinone
- VCA0720
an H-NOX protein from Vibrio cholerae
- TtTar4H
Thermoanaerobacter tengcongensis Tar4 protein heme domain
- TPP, TMP, OEP
tetraphenyl-, tetramethyl- & octaethyl- porphyrins
- Pc
phthalocyanine
- PPDME or PPIXDME
protoporphyrin IX dimethylester
- PP(ProP-)2, PP(Prop-)(PropH), PP(PropH)2
adducts of protoporphyrin IX with 0, 1 or 2 protons on the propionate substituents
- TpivP
picket fence porphyrin
- N-MeIm
N-methylimidazole
- ImH, MeImH
imidazole, 4-methylimidazole
- SR
model Fe(III)-NO porphyrin-alkanethiolate complex
- SR-HB
model Fe(III)-NO porphyrin-alkanethiolate complex with intramolecular NH-S hydrogen bond
- YC-1
3-(5’-hydroxymethyl-2’-furyl)-1-benzylindazole
- C2Cap
5,10,15,20-[pyromellitoyl(tetrakis-o-oxyethoxy-phenyl)]porphyrin
- CH2Cl2
dichloromethane
- DMF
dimethylformamide
- Bz
benzene
Footnotes
Publisher's Disclaimer: This is a PDF file of an unedited manuscript that has been accepted for publication. As a service to our customers we are providing this early version of the manuscript. The manuscript will undergo copyediting, typesetting, and review of the resulting proof before it is published in its final citable form. Please note that during the production process errors may be discovered which could affect the content, and all legal disclaimers that apply to the journal pertain.
References
- 1.Spiro TG. The resonance Raman Spectroscopy of Metalloporphyrins and Heme Proteins. In: Lever ABP, Gray HB, editors. Iron Porphyrins, Part 2, Physical Bioinorganic Chemistry Series. Addison-Wesley; Reading MA: 1983. pp. 89–159. [Google Scholar]
- 2.Kerr EA, Yu N-T. In: Biological Applications of Raman Spectroscopy. Spiro TG, editor. John Wiley & Sons; New York: 1988. pp. 39–96. [Google Scholar]
- 3.Lu C, Egawa T, Batabyal D, Mukai M, Yeh SR. Microbial hemoglobins: Structure, function, and folding. In: Ghosh A, editor. The Smallest Biomolecules: Diatomics and Their Interactions with Heme Proteins. Elsevier; Amsterdam: 2008. pp. 235–266. [Google Scholar]
- 4.Pal B, Kitagawa T. Resonance Raman studies of the activation mechanism of soluble guanylate cyclase. In: Ghosh A, editor. The Smallest Biomolecules: Diatomics and Their Interactions with Heme Proteins. Elsevier; Amsterdam: 2008. pp. 540–563. [Google Scholar]
- 5.Rousseau DL, Li D, Hayden EY, Deng H, Yeh SR. Ligand-protein Interactions in mammalian nitric oxide synthase. In: Ghosh A, editor. The Smallest Biomolecules: Diatomics and Their Interactions with Heme Proteins. Elsevier; Amsterdam: 2008. pp. 465–497. [Google Scholar]
- 6.Spiro TG, Ibrahim M, Wasbotten IH. CO, NO and O2 as vibrational probes of heme protein active sites. In: Ghosh A, editor. The Smallest Biomolecules: Diatomics and Their Interactions with Heme Proteins. Elsevier; Amsterdam: 2008. pp. 95–123. and references therein. [Google Scholar]
- 7.Barlow CH, Ohlsson PI, Paul KG. Biochemistry. 1976;15:2225–2229. doi: 10.1021/bi00655a031. [DOI] [PubMed] [Google Scholar]
- 8.Yoshikawa S, Choc MG, Otoole MC, Caughey WS. J. Biol. Chem. 1977;252:5498–5508. [PubMed] [Google Scholar]
- 9.Caughey WS, Shimada H, Choc MG, Tucker MP. Proc. Natl. Acad. Sci. U.S.A. - Biol. Sci. 1981;78:2903–2907. doi: 10.1073/pnas.78.5.2903. [DOI] [PMC free article] [PubMed] [Google Scholar]
- 10.Brown WE, Sutcliffe JW, Pulsinelli PD. Biochemistry. 1983;22:2914–2923. doi: 10.1021/bi00281a021. [DOI] [PubMed] [Google Scholar]
- 11.Paul KG, Smith ML, Ohlsson PI. Inorg. Chim. Acta. Bioinorg. Chem. 1983;79:169–169. [Google Scholar]
- 12.Smith ML, Ohlsson PI, Paul KG. FEBS Lett. 1983;163:303–305. [Google Scholar]
- 13.Li XY, Spiro TG. J. Am. Chem. Soc. 1988;110:6024–6033. doi: 10.1021/ja00226a017. [DOI] [PubMed] [Google Scholar]
- 14.Spiro TG, Kozlowski PM, Zgierski MZ. J. Raman Spectrosc. 1998;29:869–879. [Google Scholar]
- 15.Vogel KM, Kozlowski PM, Zgierski MZ, Spiro TG. J. Am. Chem. Soc. 1999;121:9915–9921. [Google Scholar]
- 16.Vogel KM, Kozlowski PM, Zgierski MZ, Spiro TG. Inorg. Chim. Acta. 2000;297:11–17. [Google Scholar]
- 17.Kozlowski PM, Vogel KM, Zgierski MZ, Spiro TG. J. Porphyrins Phthalocyanines. 2001;5:312–322. [Google Scholar]
- 18.Spiro TG, Zgierski MZ, Kozlowski PM. Coord. Chem. Rev. 2001;219:923–936. [Google Scholar]
- 19.Marti MA, Scherlis DA, Doctorovich FA, Ordejon P, Estrin DA. J. Biol. Inorg. Chem. 2003;8:595–600. doi: 10.1007/s00775-003-0452-9. [DOI] [PubMed] [Google Scholar]
- 20.De Angelis F, Jarzecki AA, Car R, Spiro TG. J. Phys. Chem. B. 2005;109:3065–3070. doi: 10.1021/jp0451851. [DOI] [PubMed] [Google Scholar]
- 21.Tangen E, Svadberg A, Ghosh A. Inorg. Chem. 2005;44:7802–7805. doi: 10.1021/ic050486q. [DOI] [PubMed] [Google Scholar]
- 22.Xu C, Ibrahim M, Spiro TG. Biochemistry. 2008;47:2379–2387. doi: 10.1021/bi702254y. [DOI] [PMC free article] [PubMed] [Google Scholar]
- 23.Xu C, Spiro TG. J. Biol. Inorg. Chem. 2008;13:613–621. doi: 10.1007/s00775-008-0349-8. [DOI] [PMC free article] [PubMed] [Google Scholar]
- 24.Linder DP, Rodgers KR. J. Biol. Inorg. Chem. 2007;12:721–731. doi: 10.1007/s00775-007-0223-0. [DOI] [PubMed] [Google Scholar]
- 25.Lehnert N, Galinato MGI, Paulat F, Richter-Addo GB, Sturhahn W, Xu N, Zhao J. Inorg. Chem. 2010;49:4133–4148. doi: 10.1021/ic902181e. [DOI] [PMC free article] [PubMed] [Google Scholar]
- 26.Lehnert N, Sage JT, Silvernail N, Scheidt WR, Alp EE, Sturhahn W, Zhao J. Inorg. Chem. 2010;49:7197–7215. doi: 10.1021/ic1010677. [DOI] [PMC free article] [PubMed] [Google Scholar]
- 27.Paulat F, Lehnert N. Inorg. Chem. 2007;46:1547–1549. doi: 10.1021/ic070023f. [DOI] [PubMed] [Google Scholar]
- 28.Praneeth VKK, Paulat F, Berto TC, DeBeer George S, Nather C, Sulok C, Lehnert N. J. Am. Chem. Soc. 2008;130:15288–15303. doi: 10.1021/ja801860u. [DOI] [PubMed] [Google Scholar]
- 29.Soldatova AV, Ibrahim M, Olson JS, Czernuszewicz RS, Spiro TG. J. Am. Chem. Soc. 2010;132:4614–4625. doi: 10.1021/ja906233m. [DOI] [PMC free article] [PubMed] [Google Scholar]
- 30.Ibrahim M, Xu C, Spiro TG. J. Am. Chem. Soc. 2006;128:16834–16845. doi: 10.1021/ja064859d. [DOI] [PMC free article] [PubMed] [Google Scholar]
- 31.Collman JP. Acc. Chem. Res. 1977;10:265–272. [Google Scholar]
- 32.Momenteau M, Reed CA. Chem. Rev. 1994;94:659–698. and references therein. [Google Scholar]
- 33.Bajdor K, Oshio H, Nakamoto K. J. Am. Chem. Soc. 1984;106:7273–7274. [Google Scholar]
- 34.Mizutani Y, Hashimoto S, Tatsuno Y, Kitagawa T. J. Am. Chem. Soc. 1990;112:6809–6814. [Google Scholar]
- 35.Proniewicz LM, Paeng IR, Nakamoto K. J. Am. Chem. Soc. 1991;113:3294–3303. [Google Scholar]
- 36.Jensen KP, Ryde U. J. Biol. Chem. 2004;279:14561–14569. doi: 10.1074/jbc.M314007200. [DOI] [PubMed] [Google Scholar]
- 37.Kuta J, Patchkovskii S, Zgierski MZ, Kozlowski PM. J. Comput. Chem. 2006;27:1429–1437. doi: 10.1002/jcc.20454. [DOI] [PubMed] [Google Scholar]
- 38.Liu Y, Sun H. J. Comput. Chem. 2011;32:1279–1285. doi: 10.1002/jcc.21709. [DOI] [PubMed] [Google Scholar]
- 39.Rutkowska-Zbik D, Jaworska M, Witko M. Struct. Chem. 2004;15:431–435. [Google Scholar]
- 40.Selcuki C, van Eldik R, Clark T. Inorg. Chem. 2004;43:2828–2833. doi: 10.1021/ic0347945. [DOI] [PubMed] [Google Scholar]
- 41.Sigfridsson E, Ryde U. J. Inorg. Biochem. 2002;91:101–115. doi: 10.1016/s0162-0134(02)00426-9. [DOI] [PubMed] [Google Scholar]
- 42.Ghosh A. J. Biol. Inorg. Chem. 2006;11:671–673. doi: 10.1007/s00775-006-0134-5. [DOI] [PubMed] [Google Scholar]
- 43.Ghosh A. J. Biol. Inorg. Chem. 2006;11:712–724. doi: 10.1007/s00775-006-0135-4. [DOI] [PubMed] [Google Scholar]
- 44.Scheidt WR, Hoard JL. J. Am. Chem. Soc. 1973;95:8281–8288. doi: 10.1021/ja00806a013. [DOI] [PubMed] [Google Scholar]
- 45.Ellison MK, Scheidt WR. Inorg. Chem. 1998;37:382–383. doi: 10.1021/ic971109j. [DOI] [PubMed] [Google Scholar]
- 46.RichterAddo GB, Hodge SJ, Yi GB, Khan MA, Ma T, VanCaemelbecke E, Guo N, Kadish KM. Inorg. Chem. 1996;35:6530–6538. doi: 10.1021/ic960031o. [DOI] [PubMed] [Google Scholar]
- 47.RichterAddo GB, Hodge SJ, Yi GB, Khan MA, Ma TS, VanCaemelbecke E, Guo N, Kadish KM. Inorg. Chem. 1997;36:2696–2696. [Google Scholar]
- 48.Godbout N, Sanders LK, Salzmann R, Havlin RH, Wojdelski M, Oldfield E. J. Am. Chem. Soc. 1999;121:3829–3844. [Google Scholar]
- 49.Soldatova AV, Ibrahim M, Spiro TG. in preparation.
- 50.Liao MS, Huang MJ, Watts JD. J. Phys. Chem. A. 2010;114:9554–9569. doi: 10.1021/jp1052216. [DOI] [PMC free article] [PubMed] [Google Scholar]
- 51.Rovira C, Kunc K, Hutter J, Ballone P, Parrinello M. J. Phys. Chem. A. 1997;101:8914–8925. [Google Scholar]
- 52.Sun Y, Hu XB, Li HR, Jalbout AF. J. Phys. Chem. C. 2009;(113):14316–14323. [Google Scholar]
- 53.Wilson EB, Decius JC, Cross PC. Molecular vibrations. Dover Publications; 1980. [Google Scholar]
- 54.Coyle CM, Vogel KM, Rush TS, Kozlowski PM, Williams R, Spiro TG, Dou Y, Ikeda-Saito M, Olson JS, Zgierski MZ. Biochemistry. 2003;42:4896–4903. doi: 10.1021/bi026395b. [DOI] [PubMed] [Google Scholar]
- 55.Phillips GN, Teodoro ML, Li TS, Smith B, Olson JS. J. Phys. Chem. B. 1999;103:8817–8829. [Google Scholar]
- 56.Unno M, Christian JF, Olson JS, Sage JT, Champion PM. J. Am. Chem. Soc. 1998;120:2670–2671. [Google Scholar]
- 57.Kerr EA, Yu NT, Bartnicki DE, Mizukami H. J. Biol. Chem. 1985;260:8360–8365. [PubMed] [Google Scholar]
- 58.Das TK, Friedman JM, Kloek AP, Goldberg DE, Rousseau DL. Biochemistry. 2000;39:837–842. doi: 10.1021/bi9922087. [DOI] [PubMed] [Google Scholar]
- 59.Anderton CL, Hester RE, Moore JN. Biochim. Biophys. Acta, Protein Struct. Mol. Enzymol. 1995;1253:1–4. doi: 10.1016/0167-4838(95)00177-v. [DOI] [PubMed] [Google Scholar]
- 60.Cameron AD, Smerdon SJ, Wilkinson AJ, Habash J, Helliwell JR, Li TS, Olson JS. Biochemistry. 1993;32:13061–13070. doi: 10.1021/bi00211a016. [DOI] [PubMed] [Google Scholar]
- 61.Biram D, Garratt CJ, Hester RE. Biochim. Biophys. Acta. 1993;1163:67–74. doi: 10.1016/0167-4838(93)90280-5. [DOI] [PubMed] [Google Scholar]
- 62.Jung C, Hoa GHB, Schroder KL, Simon M, Doucet JP. Biochemistry. 1992;31:12855–12862. doi: 10.1021/bi00166a021. [DOI] [PubMed] [Google Scholar]
- 63.Nagano S, Shimada H, Tarumi A, Hishiki T, Kimata-Ariga Y, Egawa T, Suematsu M, Park SY, Adachi S, Shiro Y, Ishimura Y. Biochemistry. 2003;42:14507–14514. doi: 10.1021/bi035410p. [DOI] [PubMed] [Google Scholar]
- 64.Okeefe DH, Ebel RE, Peterson JA, Maxwell JC, Caughey WS. Biochemistry. 1978;17:5845–5852. doi: 10.1021/bi00619a036. [DOI] [PubMed] [Google Scholar]
- 65.Unno M, Christian JF, Sjodin T, Benson DE, Macdonald IDG, Sligar SG, Champion PM. J. Biol. Chem. 2002;277:2547–2553. doi: 10.1074/jbc.M108917200. [DOI] [PubMed] [Google Scholar]
- 66.Uno T, Nishimura Y, Makino R, Iizuka T, Ishimura Y, Tsuboi M. J. Biol. Chem. 1985;260:2023–2026. [PubMed] [Google Scholar]
- 67.Wells AV, Li PS, Champion PM, Martinis SA, Sligar SG. Biochemistry. 1992;31:4384–4393. doi: 10.1021/bi00133a002. [DOI] [PubMed] [Google Scholar]
- 68.Hu SZ, Kincaid JR. J. Am. Chem. Soc. 1991;113:2843–2850. [Google Scholar]
- 69.Martinis SA, Atkins WM, Stayton PS, Sligar SG. J. Am. Chem. Soc. 1989;111:9252–9253. [Google Scholar]
- 70.Imai M, Shimada H, Watanabe Y, Matsushimahibiya Y, Makino R, Koga H, Horiuchi T, Ishimura Y. Proc. Natl. Acad. Sci. U.S.A. 1989;86:7823–7827. doi: 10.1073/pnas.86.20.7823. [DOI] [PMC free article] [PubMed] [Google Scholar]
- 71.Fan BC, Wang JL, Stuehr DJ, Rousseau DL. Biochemistry. 1997;36:12660–12665. doi: 10.1021/bi9715369. [DOI] [PubMed] [Google Scholar]
- 72.Li D, Stuehr DJ, Yeh SR, Rousseau DL. J. Biol. Chem. 2004;279:26489–26499. doi: 10.1074/jbc.M400968200. [DOI] [PubMed] [Google Scholar]
- 73.Wang JL, Stuehr DJ, Ikeda-Saito M, Rousseau DL. J. Biol. Chem. 1993;268:22255–22258. [PubMed] [Google Scholar]
- 74.Wang JL, Stuehr DJ, Rousseau DL. Biochemistry. 1997;36:4595–4606. doi: 10.1021/bi962309u. [DOI] [PubMed] [Google Scholar]
- 75.Schlichting I, Jung C, Schulze H. FEBS Lett. 1997;415:253–257. doi: 10.1016/s0014-5793(97)01135-6. [DOI] [PubMed] [Google Scholar]
- 76.Crane BR, Arvai AS, Ghosh DK, Wu CQ, Getzoff ED, Stuehr DJ, Tainer JA. Science. 1998;279:2121–2126. doi: 10.1126/science.279.5359.2121. [DOI] [PubMed] [Google Scholar]
- 77.Fischmann TO, Hruza A, Niu XD, Fossetta JD, Lunn CA, Dolphin E, Prongay AJ, Reichert P, Lundell DJ, Narula SK, Weber PC. Nat. Struct. Biol. 1999;6:233–242. doi: 10.1038/6675. [DOI] [PubMed] [Google Scholar]
- 78.Raman CS, Li HY, Martasek P, Kral V, Masters BSS, Poulos TL. Cell. 1998;95:939–950. doi: 10.1016/s0092-8674(00)81718-3. [DOI] [PubMed] [Google Scholar]
- 79.Smulevich G, Mauro JM, Fishel LA, English AM, Kraut J, Spiro TG. Biochemistry. 1988;27:5477–5485. doi: 10.1021/bi00415a014. [DOI] [PubMed] [Google Scholar]
- 80.Evangelistakirkup R, Smulevich G, Spiro TG. Biochemistry. 1986;25:4420–4425. doi: 10.1021/bi00363a037. [DOI] [PubMed] [Google Scholar]
- 81.Smulevich G, Evangelistakirkup R, English A, Spiro TG. Biochemistry. 1986;25:4426–4430. doi: 10.1021/bi00363a038. [DOI] [PubMed] [Google Scholar]
- 82.Spiro TG, Wasbotten IH. J. Inorg. Biochem. 2005;99:34–44. doi: 10.1016/j.jinorgbio.2004.09.026. and references therein. [DOI] [PubMed] [Google Scholar]
- 83.Franzen S. J. Am. Chem. Soc. 2001;123:12578–12589. doi: 10.1021/ja0108988. [DOI] [PubMed] [Google Scholar]
- 84.Coyle CM, Puranik M, Youn H, Nielsen SB, Williams RD, Kerby RL, Roberts GP, Spiro TG. J. Biol. Chem. 2003;278:35384–35393. doi: 10.1074/jbc.M301000200. [DOI] [PubMed] [Google Scholar]
- 85.Ibrahim M, Kerby RL, Puranik M, Wasbotten IH, Youn H, Roberts GP, Spiro TG. J. Biol. Inorg. Chem. 2006;281:29165–29173. doi: 10.1074/jbc.M605568200. [DOI] [PMC free article] [PubMed] [Google Scholar]
- 86.Ray GB, Li XY, Ibers JA, Sessler JL, Spiro TG. J. Am. Chem. Soc. 1994;116:162–176. [Google Scholar]
- 87.Ghosh A, Bocian DF. J. Phys. Chem. 1996;100:6363–6367. doi: 10.1021/jp953544+. [DOI] [PubMed] [Google Scholar]
- 88.Spiro TG, Kozlowski PM. J. Am. Chem. Soc. 1998;120:4524–4525. [Google Scholar]
- 89.Spiro TG, Kozlowski PM. Acc. Chem. Res. 2001;34:137–144. doi: 10.1021/ar000108j. [DOI] [PubMed] [Google Scholar]
- 90.Olson JS, Phillips GN. J. Biol. Inorg. Chem. 1997;2:544–552. [Google Scholar]
- 91.Pauling L, Weiss JJ. Nature. 1964;203:182–&. [PubMed] [Google Scholar]
- 92.Phillips SEV, Schoenborn BP. Nature. 1981;292:81–82. doi: 10.1038/292081a0. [DOI] [PubMed] [Google Scholar]
- 93.Lukin JA, Simplaceanu V, Zou M, Ho NT, Ho C. Proc. Natl. Acad. Sci. U.S.A. 2000;97:10354–10358. doi: 10.1073/pnas.190254697. [DOI] [PMC free article] [PubMed] [Google Scholar]
- 94.Kim K, Ibers JA. J. Am. Chem. Soc. 1991;113:6077–6081. [Google Scholar]
- 95.Das TK, Tomson FL, Gennis RB, Gordon M, Rousseau DL. Biophys. J. 2001;80:2039–2045. doi: 10.1016/S0006-3495(01)76177-2. [DOI] [PMC free article] [PubMed] [Google Scholar]
- 96.Wang JL, Takahashi S, Hosler JP, Mitchell DM, Fergusonmiller S, Gennis RB, Rousseau DL. Biochemistry. 1995;34:9819–9825. doi: 10.1021/bi00031a001. [DOI] [PubMed] [Google Scholar]
- 97.Powers L, Chance B, Ching Y, Angiolillo P. Biophys. J. 1981;34:465–498. doi: 10.1016/S0006-3495(81)84863-1. [DOI] [PMC free article] [PubMed] [Google Scholar]
- 98.Thomson AJ, Greenwood C, Gadsby PMA, Peterson J, Eglinton DG, Hill BC, Nicholls P. J. Inorg. Biochem. 1985;23:187–197. doi: 10.1016/0162-0134(85)85025-x. [DOI] [PubMed] [Google Scholar]
- 99.Scott RA. Ann. Rev. Biophys. Biophyschem. 1989;18:137–158. doi: 10.1146/annurev.bb.18.060189.001033. [DOI] [PubMed] [Google Scholar]
- 100.Boon EM, Marletta MA. J. Inorg. Biochem. 2005;99:892–902. doi: 10.1016/j.jinorgbio.2004.12.016. [DOI] [PubMed] [Google Scholar]
- 101.Pellicena P, Karow DS, Boon EM, Marletta MA, Kuriyan J. Proc. Natl. Acad. Sci. U.S.A. 2004;101:12854–12859. doi: 10.1073/pnas.0405188101. [DOI] [PMC free article] [PubMed] [Google Scholar]
- 102.Derbyshire ER, Winter MB, Ibrahim M, Deng S, Spiro TG, Marletta MA. Biochemistry. 2011;50:4281–4290. doi: 10.1021/bi200341b. [DOI] [PMC free article] [PubMed] [Google Scholar]
- 103.Denninger JW, Marletta MA. Biochim. Biophys. Acta, Rev. Bioenerg. 1999;1411:334–350. doi: 10.1016/s0005-2728(99)00024-9. [DOI] [PubMed] [Google Scholar]
- 104.Karow DS, Pan DH, Davis JH, Behrends S, Mathies RA, Marletta MA. Biochemistry. 2005;44:16266–16274. doi: 10.1021/bi051601b. [DOI] [PMC free article] [PubMed] [Google Scholar]
- 105.Ibrahim M, Derbyshire ER, Marletta MA, Spiro TG. Biochemistry. 2010;49:3815–3823. doi: 10.1021/bi902214j. [DOI] [PMC free article] [PubMed] [Google Scholar]
- 106.Tran R, Boon EM, Marletta MA, Mathies RA. Biochemistry. 2009;48:8568–8577. doi: 10.1021/bi900563g. [DOI] [PMC free article] [PubMed] [Google Scholar]
- 107.Tran R, Weinert EE, Boon EM, Mathies RA, Marletta MA. Biochemistry. 2011;50:6519–6530. doi: 10.1021/bi200551s. [DOI] [PMC free article] [PubMed] [Google Scholar]
- 108.Weichsel A, Andersen JF, Roberts SA, Montfort WR. Nat. Struct. Biol. 2000;7:551–554. doi: 10.1038/76769. [DOI] [PubMed] [Google Scholar]
- 109.Nienhaus K, Maes EM, Weichsel A, Montfort WR, Nienhaus GU. J. Biol. Chem. 2004;279:39401–39407. doi: 10.1074/jbc.M406178200. [DOI] [PubMed] [Google Scholar]
- 110.Zaczek MB, Zareba AA, Czernuszewicz RS, Montfort W. J. Porphyrins Phthalocyanins. 2006;10:928. [Google Scholar]
- 111.Roberts SA, Weichsel A, Qiu Y, Shelnutt JA, Walker FA, Montfort WR. Biochemistry. 2001;40:11327–11337. doi: 10.1021/bi0109257. [DOI] [PubMed] [Google Scholar]
- 112.Kondrashov DA, Roberts SA, Weichsel A, Montfort WR. Biochemistry. 2004;43:13637–13647. doi: 10.1021/bi0483155. [DOI] [PubMed] [Google Scholar]
- 113.George SJ, Allen JWA, Ferguson SJ, Thorneley RNF. J. Biol. Chem. 2000;275:33231–33237. doi: 10.1074/jbc.M005033200. [DOI] [PubMed] [Google Scholar]
- 114.Pinakoulaki E, Gemeinhardt S, Saraste M, Varotsis C. J. Biol. Chem. 2002;277:23407–23413. doi: 10.1074/jbc.M201913200. [DOI] [PubMed] [Google Scholar]
- 115.Walker FA. J. Inorg. Biochem. 2005;99:216–236. doi: 10.1016/j.jinorgbio.2004.10.009. [DOI] [PubMed] [Google Scholar]
- 116.Mukai M, Ouellet Y, Ouellet H, Guertin M, Yeh S-R. Biochemistry. 2004;43:2764–2770. doi: 10.1021/bi035798o. [DOI] [PubMed] [Google Scholar]
- 117.Wang J, Lu S, Moenne-Loccoz P, Ortiz de Montellano PR. J. Biol. Chem. 2003;278:2341–2347. doi: 10.1074/jbc.M211131200. [DOI] [PubMed] [Google Scholar]
- 118.Ding X-D, Weichsel A, Andersen JF, Shokhireva TK, Balfour C, Pierik AJ, Averill BA, Montfort WR, Walker FA. J. Am. Chem. Soc. 1999;121:128–138. [Google Scholar]
- 119.Maes EM, Walker FA, Montfort WR, Czernuszewicz RS. J. Am. Chem. Soc. 2001;123:11664–11672. doi: 10.1021/ja0031927. [DOI] [PubMed] [Google Scholar]
- 120.Benko B, Yu N-T. Proc. Natl. Acad. Sci. U. S. A. 1983;80:7042–7046. doi: 10.1073/pnas.80.22.7042. [DOI] [PMC free article] [PubMed] [Google Scholar]
- 121.Tomita T, Haruta N, Aki M, Kitagawa T, Ikeda-Saito M. J. Am. Chem. Soc. 2001;123:2666–2667. doi: 10.1021/ja001431k. [DOI] [PubMed] [Google Scholar]
- 122.Suzuki N, Higuchi T, Urano Y, Kikuchi K, Uchida T, Mukai M, Kitagawa T, Nagano T. J. Am. Chem. Soc. 2000;122:12059–12060. [Google Scholar]
- 123.Obayashi E, Tsukamoto K, Adachi S, Takahashi S, Nomura M, Iizuka T, Shoun H, Shiro Y. J. Am. Chem. Soc. 1997;119:7807–7816. [Google Scholar]
- 124.Shimizu H, Obayashi E, Gomi Y, Arakawa H, Park S-Y, Nakamura H, Adachi S-I, Shoun H, Shiro Y. J. Biol. Chem. 2000;275:4816–4826. doi: 10.1074/jbc.275.7.4816. [DOI] [PubMed] [Google Scholar]
- 125.Singh UP, Obayashi E, Takahashi S, Iizuka T, Shoun H, Shiro Y. Biochim. Biophys. Acta. 1998;1384:103–111. doi: 10.1016/s0167-4838(98)00006-5. [DOI] [PubMed] [Google Scholar]
- 126.Hawkins TW, Hall MB. Inorg. Chem. 1980;19:1735–1739. [Google Scholar]
- 127.Hoffmann R, Chen MM-L, Thorn DL. Inorg. Chem. 1976;16:503–511. [Google Scholar]
- 128.Mingos DMP. Inorg. Chem. 1973;12:1209–1211. [Google Scholar]
- 129.Pierpont CG, Eisenberg R. J. Am. Chem. Soc. 1971;93:4905–4907. [Google Scholar]
- 130.Xu N, Powell DR, Cheng L, Richter-Addo GB. Chem. Commun. 2006:2030–2032. doi: 10.1039/b602611g. [DOI] [PubMed] [Google Scholar]
- 131.Pant K, Crane BR. Biochemistry. 2006;45:2537–2544. doi: 10.1021/bi0518848. [DOI] [PubMed] [Google Scholar]
- 132.Rousseau DL, Li D, Couture M, Yeh SR. J. Inorg. Biochem. 2005;99:306–323. doi: 10.1016/j.jinorgbio.2004.11.007. [DOI] [PubMed] [Google Scholar]
- 133.Linder DP, Rodgers KR. Inorg. Chem. 2005;44:1367–1380. doi: 10.1021/ic049045h. [DOI] [PubMed] [Google Scholar]
- 134.Ford PC, Fernandez BO, Lim MD. Chem. Rev. 2005;105:2439–2455. doi: 10.1021/cr0307289. [DOI] [PubMed] [Google Scholar]
- 135.Hoshino M, Maeda M, Konishi R, Seki H, Ford PC. J. Am. Chem. Soc. 1996;118:5702–5707. [Google Scholar]
- 136.Park ES, Boxer SG. J. Phys. Chem. B. 2002;106:5800–5806. [Google Scholar]
- 137.Scheidt WR, Barabanschikov A, Pavlik JW, Silvernail NJ, Sage JT. Inorg. Chem. 2010;49:6240–6252. doi: 10.1021/ic100261b. [DOI] [PMC free article] [PubMed] [Google Scholar]
- 138.Franzen S. J. Am. Chem. Soc. 2002;124:13271–13281. doi: 10.1021/ja017708d. [DOI] [PubMed] [Google Scholar]
- 139.Andrew CR, George SJ, Lawson DM, Eady RR. Biochemistry. 2002;41:2353–2360. doi: 10.1021/bi011419k. [DOI] [PubMed] [Google Scholar]
- 140.Karow DS, Pan DH, Tran R, Pellicena P, Presley A, Mathies RA, Marletta MA. Biochemistry. 2004;43:10203–10211. doi: 10.1021/bi049374l. [DOI] [PubMed] [Google Scholar]
- 141.Tomita T, Gonzalez G, Chang AL, Ikeda-Saito M, Gilles-Gonzalez MA. Biochemistry. 2002;41:4819–4826. doi: 10.1021/bi0158831. [DOI] [PubMed] [Google Scholar]
- 142.Das TK, Wilson EK, Cutruzzola F, Brunori M, Rousseau DL. Biochemistry. 2001;40:10774–10781. doi: 10.1021/bi002327i. [DOI] [PubMed] [Google Scholar]
- 143.Brucker EA, Olson JS, Ikeda-Saito M, Phillips GN. Proteins Struct. Funct. Gen. 1998;30:352–356. [PubMed] [Google Scholar]
- 144.Copeland DM, SoareS AS, West AH, Richter-Addo GB. J. Inorg. Biochem. 2006;100:1413–1425. doi: 10.1016/j.jinorgbio.2006.04.011. [DOI] [PubMed] [Google Scholar]
- 145.Copeland DM, West AH, Richter-Addo GB. Proteins Struct. Funct. Gen. 2003;53:182–192. doi: 10.1002/prot.10495. [DOI] [PubMed] [Google Scholar]
- 146.He CM, Neya S, Knipp M. Biochemistry. 2011;50:8559–8575. doi: 10.1021/bi201073t. [DOI] [PubMed] [Google Scholar]
- 147.Reynolds MF, Parks RB, Burstyn JN, Shelver D, Thorsteinsson MV, Kerby RL, Roberts GP, Vogel KM, Spiro TG. Biochemistry. 2000;39:388–396. doi: 10.1021/bi991378g. [DOI] [PubMed] [Google Scholar]
- 148.Lukat-Rodgers GS, Correia C, Botuyan MV, Mer G, Rodgers KR. Inorg. Chem. 2010;49:6349–6365. doi: 10.1021/ic902388q. [DOI] [PMC free article] [PubMed] [Google Scholar]
- 149.Tomita T, Hirota S, Ogura T, Olson JS, Kitagawa T. J. Phys. Chem. B. 1999;103:7044–7054. [Google Scholar]
- 150.Almog J, Baldwin JE, Huff J. J. Am. Chem. Soc. 1975;97:227–228. [Google Scholar]
- 151.Chang CK. J. Am. Chem. Soc. 1977;99:2819–2822. doi: 10.1021/ja00450a080. [DOI] [PubMed] [Google Scholar]
- 152.Tani F, Matsu-ura M, Ariyama K, Setoyama T, Shimada T, Kobayashi S, Hayashi T, Matsuo T, Hisaeda Y, Naruta Y. Chem. A. Europ. J. 2003;9:862–870. doi: 10.1002/chem.200390096. [DOI] [PubMed] [Google Scholar]
- 153.Tsuchida E, Komatsu T, Nakata T, Hasegawa E, Nishide H, Inoue H. J. Chem. Soc. Dal. Trans. 1991:3285–3289. [Google Scholar]
- 154.Das TK, Couture M, Ouellet Y, Guertin M, Rousseau DL. Proc. Natl. Acad. Sci. U.S.A. 2001;98:479–484. doi: 10.1073/pnas.98.2.479. [DOI] [PMC free article] [PubMed] [Google Scholar]
- 155.Lu C, Egawa T, Wainright LM, Poole RK, Yeh SR. J. Biol. Chem. 2007;282:13627–13636. doi: 10.1074/jbc.M609397200. [DOI] [PubMed] [Google Scholar]
- 156.Nakamoto K, Paeng IR, Kuroi T, Isobe T, Oshio H. J. Mol. Struct. 1988;189:293–300. [Google Scholar]
- 157.Wagner WD, Paeng IR, Nakamoto K. J. Am. Chem. Soc. 1988;110:5565–5567. [Google Scholar]
- 158.Walters MA, Spiro TG, Suslick KS, Collman JP. J. Am. Chem. Soc. 1980;102:6857–6858. [Google Scholar]
- 159.Burke JM, Kincaid JR, Peters S, Gagne RR, Collman JP, Spiro TG. J. Am. Chem. Soc. 1978;100:6083–6088. [Google Scholar]
- 160.Collman JP, Brauman JI, Halbert TR, Suslick KS. Proc. Natl. Acad. Sci. U.S.A. 1976;73:3333–3337. doi: 10.1073/pnas.73.10.3333. [DOI] [PMC free article] [PubMed] [Google Scholar]
- 161.Bangcharoenpaurpong O, Rizos AK, Champion PM, Jollie D, Sligar SG. J. Biol. Chem. 1986;261:8089–8092. [PubMed] [Google Scholar]
- 162.Chartier FJM, Blais SP, Couture M. J. Biol. Chem. 2006;281:9953–9962. doi: 10.1074/jbc.M513893200. [DOI] [PubMed] [Google Scholar]
- 163.Sjodin T, Christian JF, Macdonald IDG, Davydov R, Unno M, Sligar SC, Hoffman BM, Champion PM. Biochemistry. 2001;40:6852–6859. doi: 10.1021/bi002510b. [DOI] [PubMed] [Google Scholar]
- 164.Bruha A, Kincaid JR. J. Am. Chem. Soc. 1988;110:6006–6014. doi: 10.1021/ja00226a014. [DOI] [PubMed] [Google Scholar]
- 165.Hirota S, Ogura T, Appelman EH, Shinzawaitoh K, Yoshikawa S, Kitagawa T. J. Am. Chem. Soc. 1994;116:10564–10570. [Google Scholar]
- 166.Potter WT, Tucker MT, Houtchens RA, Caughey WS. Federation Proceedings. 1985;44:1781–1781. [Google Scholar]
- 167.Chottard G, Schappacher M, Ricard L, Weiss R. Inorg. Chem. 1984;23:4557–4561. [Google Scholar]
- 168.Hu SZ, Schneider AJ, Kincaid JR. J. Am. Chem. Soc. 1991;113:4815–4822. [Google Scholar]


