Abstract
Sensory systems often detect multiple types of inputs. For example, a receptor in a cell-signaling system often binds multiple kinds of ligands, and sensory neurons can respond to different types of stimuli. How do sensory systems compare these different kinds of signals? Here, we consider this question in a class of sensory systems – including bacterial chemotaxis- which have a property known as fold-change detection: their output dynamics, including amplitude and response time, depends only on the relative changes in signal, rather than absolute changes, over a range of several decades of signal. We analyze how fold-change detection systems respond to multiple signals, using mathematical models. Suppose that a step of fold F1 is made in input 1, together with a step of F2 in input 2. What total response does the system provide? We show that when both input signals impact the same receptor with equal number of binding sites, the integrated response is multiplicative: the response dynamics depend only on the product of the two fold changes, F1F2. When the inputs bind the same receptor with different number of sites n1 and n2, the dynamics depend on a product of power laws,  . Thus, two input signals which vary over time in an inverse way can lead to no response. When the two inputs affect two different receptors, other types of integration may be found and generally the system is not constrained to respond according to the product of the fold-change of each signal. These predictions can be readily tested experimentally, by providing cells with two simultaneously varying input signals. The present study suggests how cells can compare apples and oranges, namely by comparing each to its own background level, and then multiplying these two fold-changes.
Introduction
Sensory systems can often detect multiple types of inputs. For example, receptors in cells often bind multiple ligands. Well-known examples are bacterial chemotaxis receptors where each receptor detects several chemo-attractants; Tar, for example, can bind the attractants aspartate and maltose, and the repellents Ni and Co ions [1]–[3]. In mammalian cells, the EGF receptor can bind a family of hormone ligands including EGF, TGF-α, EPR, amphiregulin and more [4], [5]. Similar multi-input situations occur in neuronal sensory systems: Sensory neurons in C. elegans can detect multiple inputs, as exemplified by the neuron ASH which can detect both touch and noxious chemicals [6], [7]. In addition to detection of multiple inputs by the same detector component (receptor or neuron), often multiple detectors impinge on the same downstream integration unit to produce an output.
Thus, a question of general interest is how sensory systems interpret multiple input signals, each of which can change over time.
We address this question for sensory systems which have fold-change detection, a property recently defined in theoretical and experimental studies [8]–[15]. Fold-change detection means that the system responds to fold (relative) changes in the input rather than the input’s absolute levels – at least over a range of several decades of input signal strength. Thus, a step change in input levels from 1 to 2 and a step from 2 to 4 results in precisely the same response dynamics, including amplitude and duration. The same output dynamics occur because both steps have the same fold change, F = 2. Fold change detection (FCD) goes beyond Weber’s law [16], [17], a feature commonly found in physiological sensory systems. Weber’s law states that response amplitude is proportional to the relative change in signal; in FCD systems, the entire response profile including both its amplitude and its duration (adaptation time) is a function only of fold changes. Recent experiments on bacterial chemotaxis have demonstrated FCD over a 3-order of magnitude range of the chemo-attractant alpha-methyl aspartate and also glucose [12], [13].
Here we ask how fold-change detection systems respond to multiple signals. Suppose that a step of F1 is made in input 1, together with a step of F2 in input 2: what total response does the system provide? We show that when both independent signals impact the same receptor with equal number of binding sites, the integrated response is multiplicative: the response dynamics depend only on the product of the two fold changes, F1F2.
In cases where the inputs bind the same receptor with different number of sites, the dynamics depend only on a product of power laws, resulting in a log-linear formula . In this case, a step of F1 in input 1 together with a step F2 in input 2 is equivalent to a step of
  (or
(or  ) in ligand one (two) where ligand two (one) is kept constant.
When the two inputs affect different receptors, other types of integration may be found and generally the system is not constrained to respond in a way determined by the product of the fold change of each signal.
Finally, we analyze the constraints of signal integration in a general three layered sensory system with FCD. We find a broad set of systems that integrate signals in a log-linear form similar to the case of shared receptors.
Results
Fold-change Detection Mechanism in the Chemotaxis System of E.coli, the Case of a Single Input
For completeness, and to provide nomenclature for the following results, we first summarize the results of Ref [9] on the fold change detection (FCD) mechanism in the chemotaxis system of E.coli. The dynamic equations are based on the model of Tu, Shimizu and Berg [18] which describes the chemotaxis response to temporal signals in good agreement with a wide range of experiments [19]–[23]. In the model, the variables are the methylation level of the receptors, and the activity of the receptor-kinase complex a (see Fig.1A). Briefly, chemoattractant binding lowers receptor methylation, which lowers kinase activity, leading the cells to reduce their rate of random direction changes (called tumbles) and thus swim on average up the gradient of attractant [2], [24].
Figure 1. Fold change detection (FCD) in bacterial chemotaxis in the single input situation and its experimental test by Lazova et al.
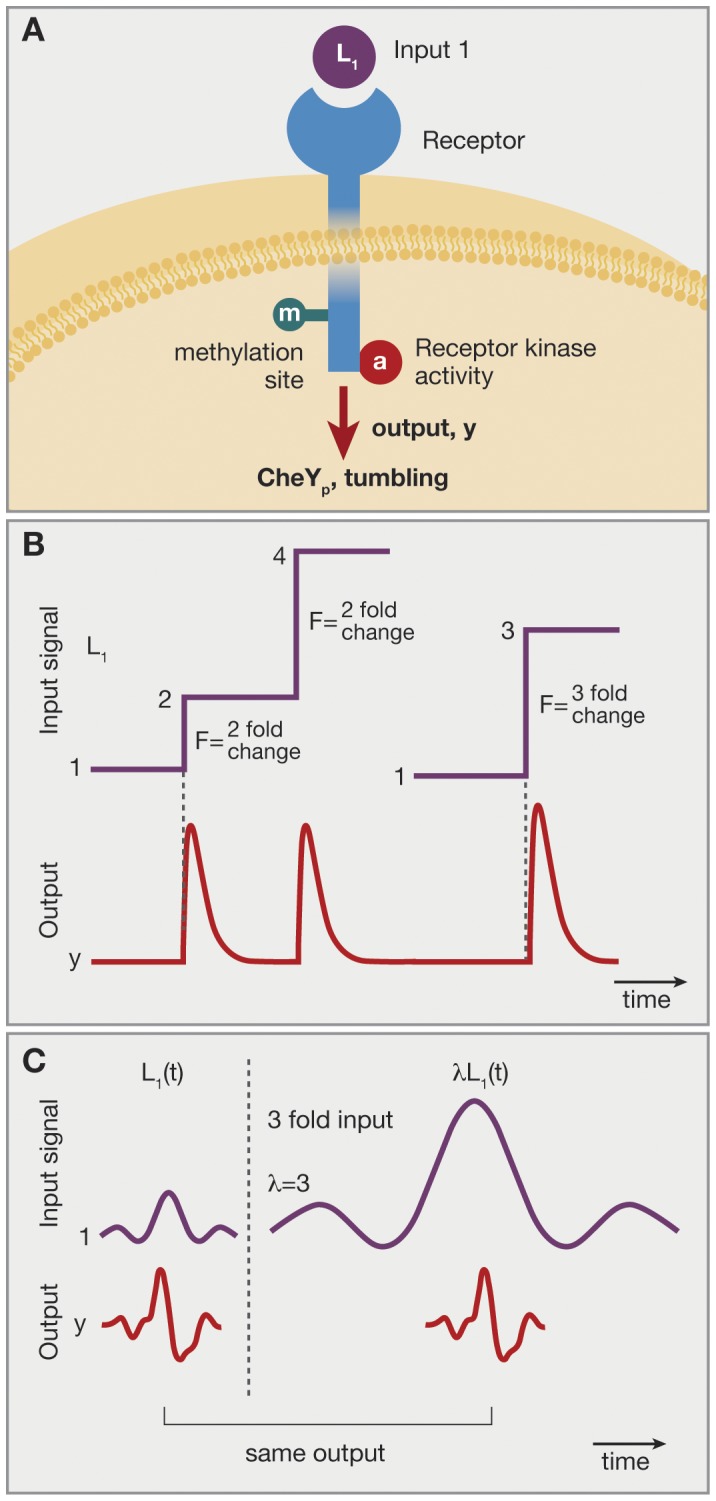
(A) The chemoreceptor Tar binds the ligand MeAsp (L1). Its associated kinase activity is modified by methylation. The output is CheYp which lead to bacterial tumbles. (B) Analysis of Shoval et al of the Tu et al model of chemotaxis predicted that the system shows fold change detection. For example, two steps of the same fold of L1 should yield the same output dynamics, including the same amplitude and response time, over a wide range of background L1 concentrations. (C) Lazova et al tested this prediction by means of E.coli strains in which the output (CheYp level) is read out optically – by means of FRET - in a flow cell in which L1 levels can be changed over time. Over a 2-order of magnitude range of concentrations, output was invariant to multiplying L1(t) by a constant factor. Data from Lazova et al [12].
The model equations describe the change in methylation, m, due to an integral feedback loop [25]–[28], which provides exact adaptation to the activity a at a steady state value a0:
| (1) |
where  is a decreasing function that crosses zero when a = a0 (which makes a0 the fixed point of the system’s activity).
Receptor activity in the Tu et al model is described using a Monod-Wyman-Changeux (MWC) mechanism [29] for a receptor cluster with n binding sites which is affected both by ligand binding and methylation:
| (2) |
Here,  is the receptor activity dependence on input ligand levels L, given by a standard MWC term [18], [30]:
 |
(3) |
Where  are the receptor affinities of the inactive and active states for the ligand L. This results in a power law form for the activity -
  - in the region
  .
.
The power-law region spans several orders of magnitude of concentration. For example, the Tar receptor and the attractant methyl-aspartate show a power-law region which spans a 160 fold range in ligand levels [30], between  and
and  .
.
By using the transformation  (where y is the receptor activity and x represents an effective methylation-dependent affinity) one finds a set of dynamic equations in the above mentioned concentration range (1).
| (4) |
| (5) |
These equations show FCD, because they obey the sufficient conditions for FCD presented by Shoval et al. [9], [11]: the system is stable [31] and the equation for y(t) (Eq. (5)) remains invariant under the transformation  for
for  .
.
Thus, the output y(t) for a given input stimulus  is equal to the dynamics for the same input multiplied by a constant,
  . Intuitively, FCD can be seen by comparing two step stimuli with equal fold-change. The response of a step from input level
  to
to  , has exactly the same dynamics - response amplitude and adaptation time - as a step from level
  to
to  . Both of these steps have the same fold change F = b/a.
The FCD property applies as long as the inputs are within the range of concentrations  . Note especially that stimulations starting from L = 0, including the pioneering chemotaxis experiments of Berg and Tedesco [19] in which response time was found to be additive in input ligand levels, are outside the FCD range.
Recent experiments by Lazova et al. [12] tested the prediction of FCD in E coli chemotaxis. Cells in which chemotaxis activity can be read out fluorescently [20], were placed in a flow chamber allowing control of input stimuli  . Cells were presented with stimuli
  of alpha-methyl-aspartate with different values of
  . The experiments revealed two FCD regimes in which the output is independent of
  (see Fig.1C). These regimes together span three orders of magnitude of ligand concentrations. In another set of experiments, Masson et al [13] used a noninvasive imaging method in a microfluidic device to measure the chemotactic response function of E. coli. They find that both for alpha-methyl-aspartate and glucose, the response shape does not depend on ligand background levels over a range of at least 3 orders of magnitude, implying FCD.
In the following, we expand the model to two different input ligands binding the same receptor.
Two Inputs for the Same Receptor with an Equal Number of Binding Sites are Integrated as the Product of their Fold Changes
We start by considering a MWC model of a receptor which binds two different input ligands in an independent way [3]. We wish to characterize the response to fold changes in the two ligand concentrations, F1 and F2 respectively, in terms of the equivalent fold change needed in one of the ligands. We define E1(F1,F2) as the fold change in input ligand one (L1), keeping ligand two (L2) constant, which produces the same output dynamic y(t) as a simultaneous fold change of F1 in ligand one (L1) and F2 in ligand two (L2). An equivalent definition applies for E2(F1,F2). In this section we show that for the case of equal number of binding sites for both ligands,  .
.
Consider a MWC model for receptor activity dependent on two input ligands, following ref [3], [9]. Each ligand has n binding sites and binding is independent of the other ligand (see Fig.2A). The resulting activity dependence on the input ligands L1 and L2 is (as shown in Eq. 7, 8 of ref [3]):
Figure 2. Product-rule integration of two input signals in an FCD system, where both inputs bind the same receptor with the same number of sites.
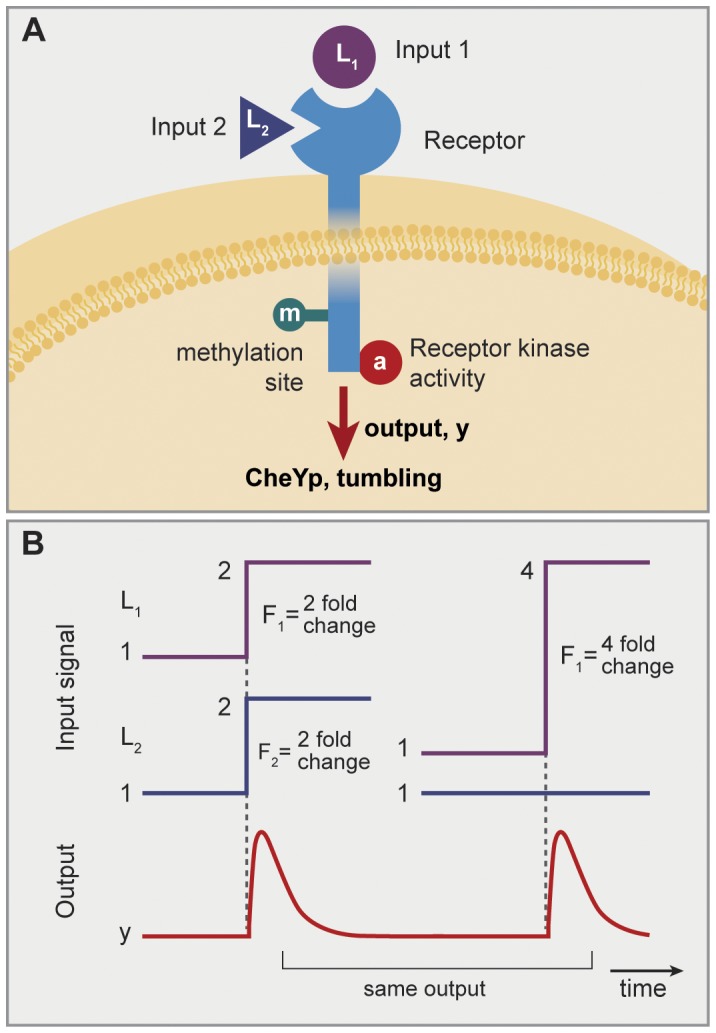
(A) Example of a receptor that binds to input ligands, the Tar receptor that binds both MeAsp, and maltose. (B) Response to simultaneous steps of L1 and L2 of folds F1 and F2 is dependent only on F1F2. Thus, steps with F1 = 4 and F2 = 1 shows the same output dynamics as two steps with F1 = 2 and F2 = 2, since in both cases F1F2 = 4. This holds as long as all concentrations are not too high or too low, that is - only in the FCD concentration range.
 |
(6) |
and  are the receptor’s affinities in the inactive and active states for the ligands L1 and L2 respectively. Similarly to the single ligand case, in the range where
  and
and  , the activity dependence on both ligand levels is a power law,
| (7) |
Repeating the analysis of the previous section, we define the transformation  to find the following set of equations
| (8) |
| (9) |
where we used the activity function calculated in Eq.(7). This set of equations again obeys the FCD conditions of Shoval et al [9]. Note that the effective input in the equations is the product  . The system is therefore FCD for
  . In particular, a simultaneous step of fold F1 in L1 and fold F2 in L2 yields the same response as a step of size F1F2 in ligand L1 alone, keeping L2 constant (and equivalently a step of F1F2 in L2 keeping L1 constant, see Fig. 2B). Thus,
  .
.
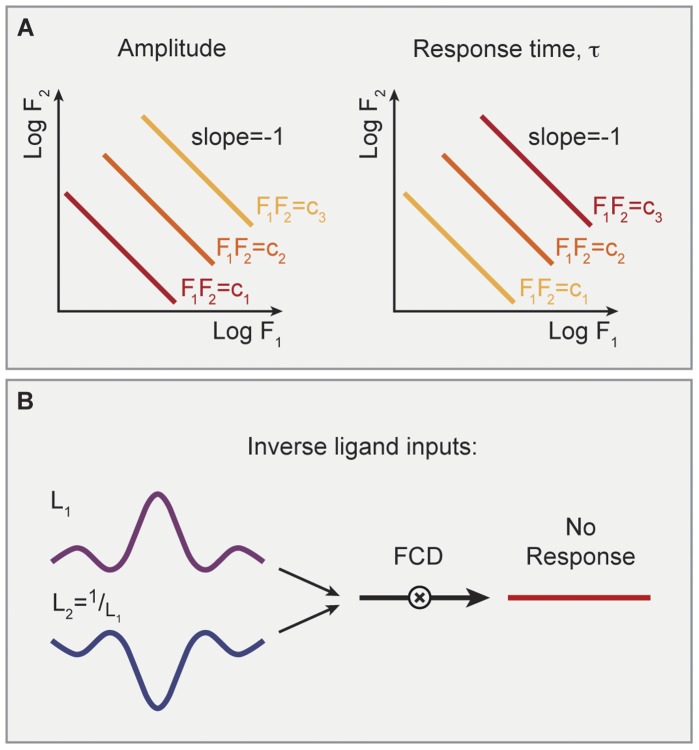
To test this product-rule for interpretation of multiple signals, consider the following potential experiment. One measures the response (amplitude and pulse duration) for many combinations of simultaneous step changes of fold F1 in ligand one (L1) and fold F2 in ligand two (L2). Plotting the amplitude or duration in the plane whose coordinates are log F1 and log F2, one should obtain straight line contours with slope minus one (see Fig.3A). An interesting implication of the multiplicative nature of the signal integration is that two signals which are inverse to each other,  , should yield no response (see Fig. 3B).
Figure 3. Log linear integration of signals.
(A) Two inputs to the same receptor with equal number of binding sites are predicted to show linear equi-amplitude and equi-response time curves in the (log F1, log F2) plane. Results shown are for the model of bacterial chemotaxis, with parameters y0 = 1,n = 1. With increasing values of F1F2 - amplitude rises (red to yellow) and response time decreases (yellow to red) (B) Two simultaneous input time curves which are inverse, namely L1(t) = c/L2(t), are predicted to yield no response.
It should be noted that the range of inputs over which the product rule applies is finite, namely,  and
and  . As mentioned above, this range is about 160-fold for the Tar receptor and its ligand methyl-aspartate.
In Material S1 we present results for the cases when ligand bindings are not independent (interacting or exclusive). We show that for a certain range of concentrations and parameters FCD still holds when ligand binding are interacting, but cannot be attained when ligand binding is strictly mutually exclusive.
We next treat the case where the number of binding sites differs between the two ligands.
Two Inputs for the Same Receptor with Differing Number of Binding Sites are Integrated in a Log-linear Manner
We now consider the case where the number of binding sites for each ligand is not equal. This may relate, for example, to models of heterogeneous bacterial chemoreceptor complexes [3]. We denote the number of binding sites for ligand one by n1 and for ligand two by n2. When ligand levels are in the range where fold change detection holds for each ligand alone ( and
and  ) Eq. (7) takes the following form:
| (10) |
This form suggests that the two input signals are weighted differently. One can write Eq. (10) as:
 |
(11) |
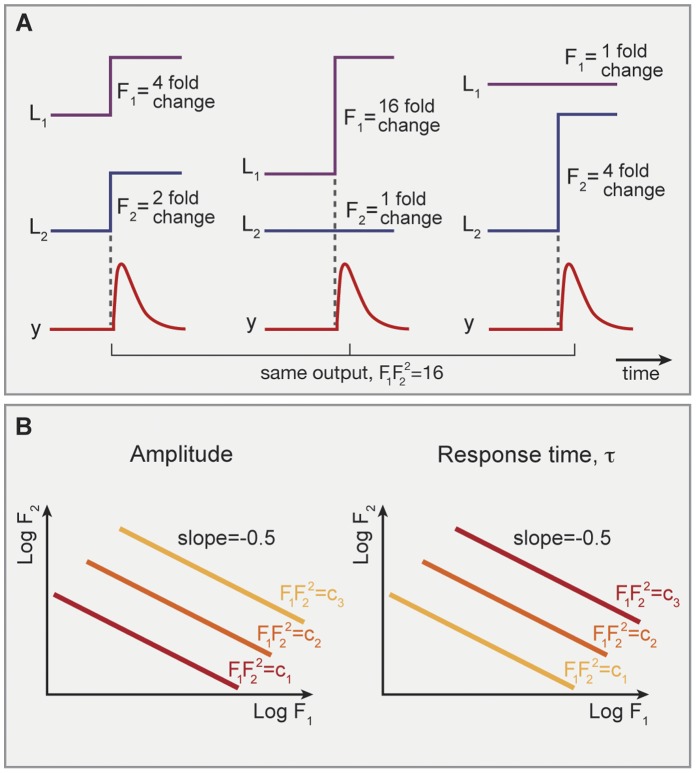
Thus, the integration of two ligands is not equivalent to the product of their fold changes. Instead, the dynamic response for a simultaneous fold change of F1 and F2 in the two inputs results in equivalent dynamics as a fold change of  in ligand one (L1), keeping ligand two (L2) constant. Similarly, for the second ligand
  (see Fig.4A). Again, experimentally mapping the response for different fold change steps of size F1 and F2, should yield straight line contours in the (logF1, logF2) plane, with slopes of
  (See Fig. 4B).
Figure 4. Power-law product rule for integration of two input signals in an FCD system, where both inputs bind the same receptor with different number of sites.
(A) Let L1 have one binding site, and L2 have two sites. Response to simultaneous steps of L1 and L2 of folds F1 and F2 is dependent only on  . Thus, steps with F1 = 4 and F2 = 2 shows the same output dynamics as two steps with F1 = 16 and F2 = 1 or two steps of F1 = 1 and F2 = 4, since in all cases
  (B) Linear equi-response contours in the (log F1, log F2) plane. With increasing values of
  - amplitude rises (red to yellow) and response time decreases (yellow to red).
We next describe a generalization of these results for a system with a shared internal layer of inputs integration. This generalization suggests that such systems have an invariant dynamic response property of the two folds.
A General FCD System with a Single Internal Layer Component Integrates Inputs in a Log-linear Manner
We next describe signal integration for a general three layer sensing system composed of a layer of two inputs (u1,u2), an internal layer with one degree of freedom (denoted x, e.g. the modification state of a receptor binding two ligands) and an output (denoted y). This sensing system is assumed to be a FCD system for each input, and the input levels are assumed to be in the FCD regime, so that the system responds to fold changes in either input. The model allows for any type of interaction between the three computational layers, including activation and inhibition, feed-forward and feedback. The dynamic equations for x and y are generally.
| (12) |
| (13) |
For the system to obey FCD, the above set of equations must obey scalar symmetry [9], [11]: be invariant to multiplications by a scalar in u1 and u2,  and
and  . Consider the following transformation of the inputs of the system:
| (14) |
| (15) |
| (16) |
In the methods section, we analyze the more general case in which  .
.
For the system to be FCD in both inputs, the dynamics of y must remain the same. Therefore we have the condition:  . These considerations yield the following transformed set of dynamic equations:
| (17) |
| (18) |
This results in the following equality between the two dynamic sets of equations:
| (19) |
| (20) |
Following Euler’s homogeneity rule, one differentiates Eqn. (19–20) with respect to  and
and  , at the point
  and gets the following constraints on the functional form of the functions f and g:
| (21) |
| (22) |
where  are the scaled dynamic functions and the power laws are determined by the partial derivative of the transformation function
  with respect to
  and
and  at the point
  as follows:
  and
and  . Therefore, the only allowed form of input integration is one where the two signals are integrated as the product of power-laws of the signals:
| (23) |
Thus, log E1 is a linear combination of log F1 and log F2. For example, the transformation , yields the conserved invariant of the dynamic response,
  which means that the equivalent response in each signal is
  and
and  . A solution for the general case of two input signals with one shared internal layer is presented in the Methods section.
A FCD System with Two Internal Layer Components does not Necessarily Integrate Inputs in a Log-linear Manner
We next show that a system with a separate internal component for each input (e.g. two different receptors for two ligands) does not necessarily yield an invariant dynamic response.
Consider the case where each input signal has its own internal layer component, x1 and x2. The general dynamic equations are
| (24) |
| (25) |
| (26) |
Following the same procedure of the previous section yields these constraints on the differentials functional form:
| (27) |
| (28) |
| (29) |
Therefore, each signal is scaled by its own internal layer component (xi), and there are no constraints on their integration since the two internal components can decouple the effects of each signal.
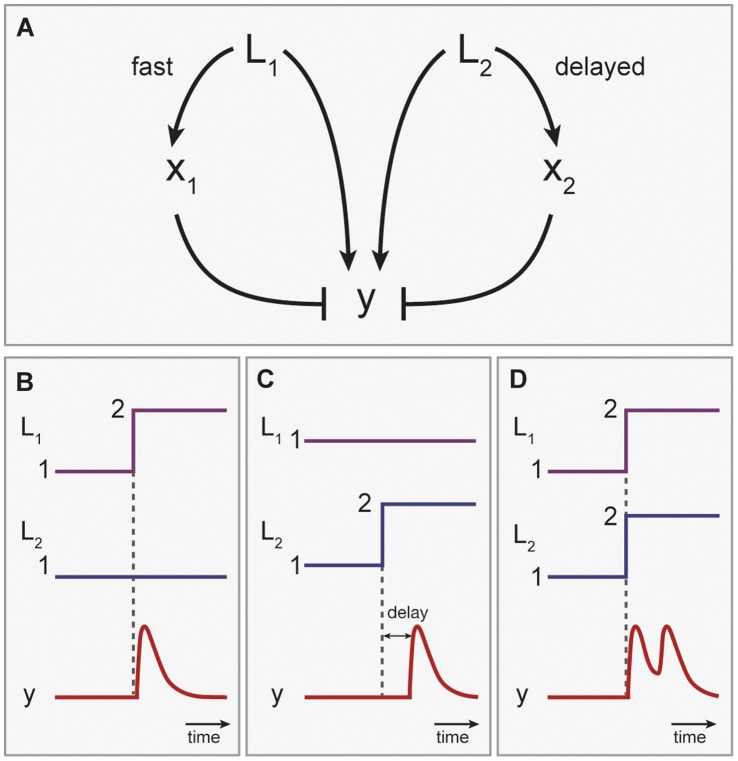
Moreover, the separation of the response to the two inputs may allow a delayed response in one, such that the two inputs have separation of time scales as well. Consider the following system which has fold response to each of the signals
| (30) |
| (31) |
| (32) |
although this system obeys the FCD conditions of Ref [9] for each signal on its own, it may not present an invariant dynamic response since  and
and  may dictate two different time scales, e.g.
  , such that the system first reacts as if there is a change only in u1. Then, after the first dynamic pulse has ended, the second pulse initiates (see Fig.5). Note that in this case E1 cannot be defined: there is no stimulus on a single input that provides the same time-course as simultaneous stimuli of two inputs (see Fig. 5). Therefore, a separation of the internal layer components does not necessarily lead to an invariant dynamic response. However, such a system can in special cases still have simple integration rules for the two inputs, as shown in Material S1.
Figure 5. FCD systems with two internal layer components need not generally integrate multiple signals in a log-linear manner.
(A) A model where each input interacts with its own internal layer component. In cases where one pathway has fast dynamics and the second pathway has a delay, the response to fold change steps in input one and two can be temporally separated. (B) Response to a step in L1 is a fast pulse. (C) Response to a step in L2 is a delayed pulse. (D) Response to simultaneous steps of L1 and L2 gives a two-pulse shape, and is thus not equivalent to any step of a single ligand.
Discussion
This study considered FCD sensory systems with multiple input signals. We show that when both signals impact the same receptor with equal number of binding sites, described by a MWC model [3], the integrated response is multiplicative: the system dynamics depend only on the product of the fold changes in the two stimuli F1F2. In cases where the inputs bind the same receptor with different number of sites, the result is a product of power laws,  . In both cases, plotting response amplitude or duration to step stimuli in the (log F1, log F2) plane is predicted to yield linear contours, with a slope
  , over the range of input concentrations in which FCD is valid (i.e. both ligand concentrations are in the range
  and
and  ). The cases of dependent ligand binding (interacting or exclusive) are discussed in Material S1, where we show that for a certain range of concentrations and parameters, interacting ligands can show FCD but exclusive binding of ligands excludes FCD. When the two inputs affect different receptors, or when the MWC picture is not applicable, other types of integration may be found and generally the system is not constrained to respond in a multiplicative (log-linear) way.
These results may address the question of how sensory systems compare apples and oranges. When the two signals sensed by the system are very different in nature (for example touch and noxious chemicals [7]), how can the system compare them? We find that FCD systems can compare different signals by relating each signal to its own previous level, by means of its fold-change, and then by multiplying these fold changes. In this way, each signal is normalized to its ambient level, enabling the comparison of two ‘non-dimensional’ factors, namely the fold-change in each signal.
By suitably designing the detector elements, the sensory system can create contours of equal response, with a given slope in the (logF1, logF2) plane, that appropriately weigh changes in the inputs to produce a desired response. Thus, a higher sensitivity to fold change in signal one than in signal two can be achieved by making the effective cooperativity coefficient n1 for signal one larger than for signal two.
One avenue for further research is to study more general models that provide FCD, and ask what is the largest class of signal integration functions spanned by all FCD mechanisms.
The present considerations may apply to a range of systems from molecular detection by receptors, neuronal sensory systems in simple organisms, and perhaps also to physiological sensory systems in humans such as taste and smell. A psychophysical experiment on taste, for example, may use different stimuli sensed by the same receptors such as cold temperature and menthol [32], or hot temperatures and capsaicin [33]. An interesting prediction is that no response is predicted upon specific ratios of increase in one signal together with a decrease in the other.
Methods
General Solution for FCD Systems with Two Inputs and a Single Internal Layer Component
We now describe the general formula for integration of two input signals sensed by a single shared internal component (e.g. a shared receptor). For simplicity we start with the one ligand case and then expand to the case of two ligands. Consider the following general transformation [11]
| (33) |
| (34) |
Then, following the procedure described in Eq.(14–22) one has [11].
| (35) |
| (36) |
Note that since  and
and  obey the FCD conditions of Shoval et al [9],
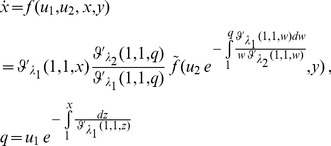
  can be multiplied by a constant and maintain FCD response. Similarly, for two inputs and a general transformation:
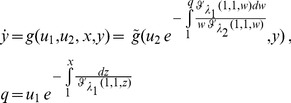
  one has the following dynamic set of equations
 |
(37) |
 |
(38) |
Eqn. (37–38) define the general formula for FCD systems which integrate two inputs by a shared single internal layer component.
Supporting Information
The online supplementary material includes additional information about the methods and results presented above. We present results for the cases when the two ligand bindings are dependent (interacting or exclusive). We also present special cases where a FCD system with two internal layer components has simple integration rules for the two inputs.
(DOCX)
Funding Statement
The research leading to these results has received funding from the European Research Council under the European Union’s Seventh Framework Programme (FP7/2007-2013)/ERC grant agreement number 249919 and the Israel Science Foundation (ISF 675/09). Uri Alon is the incumbent of the Abisch-Frenkel Professorial Chair. The funders had no role in study design, data collection and analysis, decision to publish, or preparation of the manuscript.
References
- 1.Eisenbach M, Lengeler JW, Varon M, Gutnick D, Meili R, et al.. (2004) Chemotaxis. 1st ed. Imperial College Press. [Google Scholar]
- 2.Berg HC (2004) E. coli in motion. Springer. [Google Scholar]
- 3. Mello BA, Tu Y (2005) An allosteric model for heterogeneous receptor complexes: Understanding bacterial chemotaxis responses to multiple stimuli. Proceedings of the National Academy of Sciences of the United States of America 102: 17354–17359. [DOI] [PMC free article] [PubMed] [Google Scholar]
- 4. Citri A, Yarden Y (2006) EGF–ERBB signalling: towards the systems level. Nat Rev Mol Cell Biol 7: 505–516. [DOI] [PubMed] [Google Scholar]
- 5. Linggi B, Carpenter G (2006) ErbB receptors: new insights on mechanisms and biology. Trends in Cell Biology 16: 649–656. [DOI] [PubMed] [Google Scholar]
- 6. Troemel ER, Kimmel BE, Bargmann CI (1997) Reprogramming chemotaxis responses: sensory neurons define olfactory preferences in C. elegans. Cell 91: 161–169. [DOI] [PubMed] [Google Scholar]
- 7.Bargmann C (2006) Chemosensation in C. elegans. WormBook. Available:http://www.ncbi.nlm.nih.gov/books/NBK19746/. [DOI] [PMC free article] [PubMed]
- 8. Goentoro L, Shoval O, Kirschner MW, Alon U (2009) The Incoherent Feedforward Loop Can Provide Fold-Change Detection in Gene Regulation. Molecular Cell 36: 894–899. [DOI] [PMC free article] [PubMed] [Google Scholar]
- 9. Shoval O, Goentoro L, Hart Y, Mayo A, Sontag E, et al. (2010) Fold-change detection and scalar symmetry of sensory input fields. Proceedings of the National Academy of Sciences 107: 15995–16000. [DOI] [PMC free article] [PubMed] [Google Scholar]
- 10. Ma W, Trusina A, El-Samad H, Lim WA, Tang C (2009) Defining Network Topologies that Can Achieve Biochemical Adaptation. Cell 138: 760–773. [DOI] [PMC free article] [PubMed] [Google Scholar]
- 11. Shoval O, Alon U, Sontag E (2011) Symmetry Invariance for Adapting Biological Systems. SIAM Journal on Applied Dynamical Systems 10: 857. [Google Scholar]
- 12. Lazova MD, Ahmed T, Bellomo D, Stocker R, Shimizu TS (2011) Response rescaling in bacterial chemotaxis. Proceedings of the National Academy of Sciences 108: 13870–13875. [DOI] [PMC free article] [PubMed] [Google Scholar]
- 13. Masson J-B, Voisinne G, Wong-Ng J, Celani A, Vergassola M (2012) Noninvasive inference of the molecular chemotactic response using bacterial trajectories. PNAS 109: 1802–1807. [DOI] [PMC free article] [PubMed] [Google Scholar]
- 14. Celani A, Shimizu TS, Vergassola M (2011) Molecular and Functional Aspects of Bacterial Chemotaxis. Journal of Statistical Physics 144: 219–240. [Google Scholar]
- 15. Russo G, Slotine J-JE (2011) Symmetries, stability, and control in nonlinear systems and networks. Physical Review E, Statistical, Nonlinear, and Soft Matter Physics 84: 041929. [DOI] [PubMed] [Google Scholar]
- 16.Keener JP, Sneyd J (1998) Mathematical physiology. Springer. [Google Scholar]
- 17.Weber EH, Ross HE, Murray DJ (1996) E.H. Weber on the tactile senses. Psychology Press. 276 p. [Google Scholar]
- 18. Tu Y, Shimizu TS, Berg HC (2008) Modeling the chemotactic response of Escherichia coli to time-varying stimuli. Proceedings of the National Academy of Sciences 105: 14855–14860. [DOI] [PMC free article] [PubMed] [Google Scholar]
- 19. Berg HC, Tedesco PM (1975) Transient response to chemotactic stimuli in Escherichia coli. Proceedings of the National Academy of Sciences 72: 3235–3239. [DOI] [PMC free article] [PubMed] [Google Scholar]
- 20. Sourjik V, Berg HC (2002) Receptor sensitivity in bacterial chemotaxis. Proceedings of the National Academy of Sciences of the United States of America 99: 123–127. [DOI] [PMC free article] [PubMed] [Google Scholar]
- 21. Sourjik V, Berg HC (2004) Functional interactions between receptors in bacterial chemotaxis. Nature 428: 437–441. [DOI] [PubMed] [Google Scholar]
- 22. Keymer JE, Endres RG, Skoge M, Meir Y, Wingreen NS (2006) Chemosensing in Escherichia coli: Two regimes of two-state receptors. PNAS 103: 1786–1791. [DOI] [PMC free article] [PubMed] [Google Scholar]
- 23. Hansen CH, Endres RG, Wingreen NS (2008) Chemotaxis in Escherichia coli: a molecular model for robust precise adaptation. PLoS Comput Biol 4(1): e1. [DOI] [PMC free article] [PubMed] [Google Scholar]
- 24. Vladimirov N, Sourjik V (2009) Chemotaxis: how bacteria use memory. Biol Chem 390: 1097–1104. [DOI] [PubMed] [Google Scholar]
- 25. Barkai N, Leibler S (1997) Robustness in simple biochemical networks. Nature 387: 913–917. [DOI] [PubMed] [Google Scholar]
- 26. Alon U, Surette MG, Barkai N, Leibler S (1999) Robustness in bacterial chemotaxis. Nature 397: 168–171. [DOI] [PubMed] [Google Scholar]
- 27. Yi T-M, Huang Y, Simon MI, Doyle J (2000) Robust perfect adaptation in bacterial chemotaxis through integral feedback control. Proceedings of the National Academy of Sciences of the United States of America 97: 4649–4653. [DOI] [PMC free article] [PubMed] [Google Scholar]
- 28. Eduardo DS (2003) Adaptation and regulation with signal detection implies internal model. Systems & Control Letters 50: 119–126. [Google Scholar]
- 29. Monod J, Wyman J, Changeux J-P (1965) On the nature of allosteric transitions: A plausible model. Journal of Molecular Biology 12: 88–118. [DOI] [PubMed] [Google Scholar]
- 30. Mello BA, Tu Y (2007) Effects of Adaptation in Maintaining High Sensitivity over a Wide Range of Backgrounds for Escherichia coli Chemotaxis. Biophysical Journal 92: 2329–2337. [DOI] [PMC free article] [PubMed] [Google Scholar]
- 31.Sontag ED (1998) Mathematical control theory: deterministic finite dimensional systems. Springer. 552 p. [Google Scholar]
- 32. McKemy DD, Neuhausser WM, Julius D (2002) Identification of a cold receptor reveals a general role for TRP channels in thermosensation. Nature 416: 52–58. [DOI] [PubMed] [Google Scholar]
- 33. Caterina MJ, Schumacher MA, Tominaga M, Rosen TA, Levine JD, et al. (1997) The capsaicin receptor: a heat-activated ion channel in the pain pathway. Nature 389: 816–824. [DOI] [PubMed] [Google Scholar]
Associated Data
This section collects any data citations, data availability statements, or supplementary materials included in this article.
Supplementary Materials
The online supplementary material includes additional information about the methods and results presented above. We present results for the cases when the two ligand bindings are dependent (interacting or exclusive). We also present special cases where a FCD system with two internal layer components has simple integration rules for the two inputs.
(DOCX)


