

Abstract
Adipose tissue functions as a key endocrine organ by releasing multiple bioactive substances, and plays a key role in the integration of systemic metabolism. We have previously shown that B cell activating factor is produced mainly in visceral adipose tissue and affects insulin sensitivity in obese individuals. In this study, we identified the signals that lead to production of B cell activating factor in adipocytes. 3T3-L1 and C3H/10T 1/2-clone 8 cells showed increased B cell activating factor expression upon exposure to hydrogen peroxide, and these changes were inhibited by treatment with the antioxidant N-acetyl-cysteine. B cell activating factor levels in both serum and visceral adipose tissue were increased in high fat diet-fed mice, and these increases were correlated with oxidative stress. In addition, serum BAFF levels in high fat diet-fed mice were reduced by N-acetyl-cysteine treatment. We also found that oxidative stress-induced B cell activating factor expression in adipocytes was regulated by NF-κB activation. These data indicate that control of the redox state in visceral adipose tissue is a potentially useful target for treating metabolic syndromes through regulation of adipokine production.
Keywords: B cell activation factor, adipocytes, obesity, oxidative stress, nuclear factor-κB
Introduction
The incidence of obesity and its associated disorders is increasing rapidly worldwide.(1) Obesity increases the risk of cardiovascular diseases and type 2 diabetes mellitus, and accounts for a substantial proportion of global morbidity and mortality.(2,3) Moreover, being overweight or obese is an established risk factor for cancer and cancer-related mortality.(4,5)
Accumulating evidence indicates that obesity causes low-grade chronic inflammation that contributes to the systemic metabolic dysfunction that is associated with obesity-linked disorders.(6,7) Adipose tissue has traditionally been considered to be a long-term energy storage organ, but it is now known that it plays a key role in the integration of systemic metabolism. Moreover, adipose tissue functions as a key endocrine organ by releasing multiple bioactive substances, known as adipokines, that have pro-inflammatory or anti-inflammatory activities.(8) Adipokines including cytokines, chemokines and acute-phase molecules are thought to provide an important link between obesity, insulin resistance, and related inflammatory disorders.(9) The production of adipokines is regulated by pro-inflammatory factors, such as tumor necrosis factor (TNF) and interleukin (IL)-6, as well as by hypoxia and oxidative stress.(10,11)
B cell activating factor (BAFF) has been identified as a factor that promotes the expansion and differentiation of the B-cell population, which leads to increased serum immunoglobulin levels.(12,13) BAFF is expressed on the surface of monocytes, macrophages, dendritic cells, neutrophils, activated T cells, malignant B cells, and epithelial cells.(14,15) Recently, a relationship between BAFF and adipocytes has been observed.(16–19) We have previously reported that the serum BAFF level is increased in diet-induced obese mice and in patients with nonalcoholic steatohepatitis.(19,20) BAFF is produced mainly in white adipose tissue, particularly visceral adipose tissue (VAT), and autocrine or paracrine BAFF and BAFF-receptor interactions in VAT lead to impaired insulin sensitivity via inhibition of insulin signaling pathways and alterations in adipokine production.(19) However, the factors that induce BAFF expression in adipocytes are not clear.
This study aimed to identify the signals that induce BAFF expression in adipocytes. Our data indicate that oxidative stress can induce BAFF expression in adipocytes through activation of the nuclear factor (NF)-κB pathway.
Materials and Methods
Cell culture and treatment
3T3-L1 pre-adipocytes and C3H/10T 1/2-clone 8 (C3H) pre-adipocytes were purchased from DS Pharma Biomedical Japan (Osaka, Japan) and the Health Science Research Resources Bank (Tokyo, Japan), respectively. These cells were cultured in 3T3-L1 pre-adipocyte medium containing high-glucose Dulbecco’s modified Eagle’s medium (DMEM) with bovine calf serum (Zen-Bio, Research Triangle Park, NC) at 37°C under a 5% CO2 humidified atmosphere. The 2-day post-confluent cells (designated as day 0) were incubated for 2 days with 10% fetal bovine serum (FBS)/DMEM (GIBCO/Invitrogen, Gland Island, NY), 1 mM 3-isobuthy-1-methylxanthine (IBMX) (Sigma-Aldrich, St. Louis, MO), 0.5 µM dexamethasone (Sigma), and 10 µg/ml insulin (Wako Pure Chem. Ind. Ltd., Osaka, Japan). The cells were then incubated in 10% FBS/DMEM with 10 µg/ml insulin on every alternate day. On day seven after induction, fully differentiated 3T3-L1 or C3H adipocytes were incubated with fresh medium containing hydrogen peroxide (H2O2) (Wako) for 3 h, with or without 10 mM N-acetyl-cysteine (NAC) (Sigma). In some experiments, fully differentiated 3T3-L1 adipocytes were incubated with interferon (IFN)-γ (Wako), tissue necrosis factor (TNF)-α (Wako), or lipopolysaccharide (LPS) (Sigma) for 3 h.
To explore the underlying mechanisms of BAFF expression in adipocytes, fully differentiated 3T3-L1 adipocytes were incubated with control peptide or with NF-κB p65 (Ser276) inhibitory peptide (150 µM; Imgenex, San Diego, CA) for 1 h. These cells were incubated for 3 h in the presence or absence of 0.5 mM H2O2.
Cell viability
Cell viability was measured by a nonradioactive colorimetric assay (WST-1; Roche Applied Science, Tokyo, Japan) based on the cleavage of a tetrazolium salt as recommended by the manufacturer’s protocol. WST-1 assays detect only living cells, and the signal generated is directly proportional to the number of live cells. After exposure to H2O2 with or without NAC treatment for 3 h, the WST-1 reagent in DMEM medium was applied for 2 h at 37°C under a 5% CO2 humidified atmosphere, and the amount of dye was measured at 450 nm with a plate reader (Biochrom Asys Expert 96; Biochrom LTD., Cambridge, UK).
Animals and treatment
Male C57BL/6J mice (CLEA Japan, Tokyo, Japan) at 5 weeks of age were maintained at the Department of Biological Resources, Integrated Center for Science, Ehime University, Ehime, Japan under controlled conditions (22°C, 55% humidity, and 12 h light/12 h dark) for 3 weeks. These 8-week-old mice were then randomly divided into three groups. The diet of the normal diet (ND) group (control) comprised 13% fat, 26% protein, and 60% carbohydrates (360 kcal/100 g). The diet of the high-fat diet (HFD) group comprised 60% fat, 20% protein, and 20% carbohydrates (520 kcal/100 g) (D12492; Research Diets, New Brunswick, NJ), as described previously.(21) NAC was dissolved in regular tap water and the pH of the solution was adjusted to 7.4 with sodium hydroxide (Wako). The HFD plus NAC (HFD + NAC) group was fed a HFD and given NAC orally (10 mg/ml in drinking water). All animals were fed these diets for 24 weeks prior to being euthanized. All animal procedures were performed in accordance with the institutional guidelines for animal care of Ehime University.
Immunohistochemical staining for oxidative stress markers
Oxidative DNA damage was investigated by immunohistochemical staining of 8-hydroxy-deoxyguanosine (8-OHdG). Tissue samples were fixed for a few days in Bouin’s solution and processed for paraffin embedding. Sections (3-µm thick) were cut from paraffin wax blocks, mounted on pre-coated glass slides, de-paraffinized, and rehydrated. 8-OHdG staining was performed using an amino acid polymer detection system and the Histofine Mouse Stain Kit (Nichirei, Tokyo, Japan). The sections were then incubated with the anti-8-OHdG monoclonal mouse primary antibody (dilution factor: 1:20; N45.1; Japan Institute for the Control of Aging, Nikken Seil, Shizuoka, Japan) overnight at 4°C. Negative control experiments were also performed, in which the first antibodies were omitted. The total number of cells was counted using ten different high-power fields from each section.
Measurement of BAFF and oxidative stress
BAFF level in the serum was measured using a commercially available ELISA kit (R&D Systems, Minneapolis, MN). The levels of oxidative stress in serum were measured with a thiobarbituric acid reactive substances assay kit (Cayman Chemical Co., Ann Arbor, MI) according to the manufacturer’s protocol.
Real-time reverse-transcription PCR
RNA was extracted using the RNeasy Plus Mini kit (Qiagen, Hilden, Germany) and the RNeasy Plus Lipid kit (Qiagen). Reverse transcription reactions were performed using the High-Capacity cDNA Reverse Transcription kit (Applied Biosystems, Foster City, CA), and the real-time PCR analysis was performed using SYBR Green I (Roche Diagnostics, Basel, Switzerland). The pairs of sequence-specific primers that were used are as follows: B cell activating factor (BAFF), forward 5'-AACACTGCCCAACAATTCCT-3', reverse 5'-GGCGCTGTCTGCATCTTC-3'; monocyte chemotactic protein (MCP)-1, forward 5'-CATCCACGTGTTGGCTCA-3', reverse 5'-GATCATCTTGCTGGTGAATGAGT-3'; adiponectin, forward 5'-GGAGAGAAAGGAGATGCAGGT-3', reverse 5'-CTTTCCTGCCAGGGGTTC-3'; glyceraldehyde-3-phosphate dehydrogenase (GAPDH), forward 5'-TGCACCACCAACTGCTTA-3', reverse 5'-AACATCATCCCTGCATCC-3'. The final result for each sample was normalized to the respective GAPDH value.
NF-κB activity assay
Nuclear protein extract was prepared using the Nuclear Extract kit (Active Motif, Carlsbad, CA) according to the manufacturer’s protocol. NF-κB activation was analyzed with the TransAM NF-κB p65 transcription factor assay kit (Active Motif) according to the manufacturer’s protocol.
Statistical analysis
All data were analyzed using JMP8.0 (SAS, Cary, NC). Results are presented as the mean ± SEM. Normally distributed data were analyzed using ANOVA and Student’s t tests. Correlations were assessed by Pearson’s correlation coefficient. A p value less than 0.05, 0.01, or 0.001 was considered as statistically significant in each comparison.
Results
Reactive oxygen species (ROS) induced the expression of BAFF in adipocytes
We have previously shown that 3T3-L1 adipocytes express BAFF upon cellular differentiation,(19) but the underlying mechanisms for this process have not been identified. We first analyzed which types of stimuli triggered the induction of BAFF in adipocytes in vitro. BAFF mRNA expression in 3T3-L1 adipocytes was not influenced by treatment with cytokines (IFN-γ and TNF-α) or LPS (Fig. 1A). The mRNA expression levels of BAFF and MCP-1, however, were increased by treatment with H2O2 (Fig. 1B). The adiponectin mRNA levels in 3T3-L1 adipocytes were not altered by incubation with H2O2 for 3 h (control 1.42E-02 ± 4.81E-03; H2O2 1.64E-02 ± 5.63E-03: n = 7). C3H cells, from another adipocyte cell line, also showed increased mRNA expression levels of BAFF and MCP-1 upon treatment with H2O2 (Fig. 1C). NAC treatment inhibited the increase in the mRNA expression of BAFF and MCP-1 (Fig. 2). Cell viability, as measured by the WST-1 assay, was the same among the three groups in both cell lines (data not shown).
Fig. 1.

Effects of H2O2 on gene expression in adipocytes. (A) 3T3-L1 adipocytes were cultured in the presence or absence of IFN-γ (10 or 100 ng/ml), TNF-α (1 or 10 ng/ml), or LPS (100 or 1000 ng/ml) for 3 h (n = 5). (B) 3T3-L1 adipocytes were incubated for 3 h in the absence or presence of H2O2. The mRNA expression levels of BAFF and MCP-1 were increased by treatment with H2O2 (n = 6). (C) In C3H adipocytes, the mRNA expression levels of BAFF and MCP-1 were increased by treatment with H2O2 (n = 6). The mRNA level was examined by real-time RT-PCR, and gene expression levels were normalized to GAPDH mRNA expression. The degree of change in gene expression is based on the mean expression level of the control. Values are expressed as the mean ± SEM. *p<0.05, **p<0.01, and ***p<0.001 as compared with the control value.
Fig. 2.
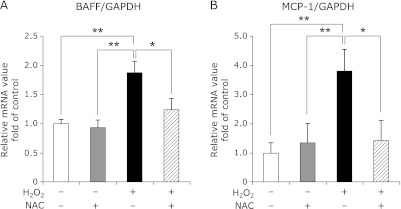
Effect of an antioxidant on gene expression in the 3T3-L1 adipocytes. (A and B) The mRNA expression levels of BAFF and MCP-1 in the 3T3-L1 adipocytes exposed to H2O2, with or without the antioxidant N-acetyl-cysteine (NAC). The 3T3-L1 adipocytes were pretreated with NAC (10 mM) as described in Materials and methods. (A) The mRNA level of BAFF was examined by RT-PCR (n = 6). (B) The mRNA level of MCP-1 was examined by RT-PCR (n = 5). Gene expression levels were normalized to GAPDH mRNA expression, and the degree of change in gene expression is based on the mean expression level of the control. Values are expressed as the mean ± SEM. *p<0.05 and **p<0.01 between the two values.
Serum BAFF levels correlated with oxidative stress
The HFD-fed mice are a widely used animal model for studies in the field of obesity research,(19,21) and we used this mouse model to investigate the relationship between BAFF and oxidative stress in vivo. The body weight and weights of organs and tissues of HFD-fed mice were significantly higher than those of ND-fed mice (Table 1).
Table 1.
Characteristics of ND-fed mice, ND-fed mice treated with NAC, HFD-fed mice, and HFD-fed mice treated with NAC at 32 week age
| ND (n = 10) | NAC (n = 10) | HFD (n = 10) | HFD + NAC (n = 10) | |
|---|---|---|---|---|
| Body weight (g) | 32.1 ± 0.61 | 33.2 ± 0.43 | 51.9 ± 1.01*** | 56.3 ± 0.92***,†† |
| VAT weight (g) | 0.85 ± 0.07 | 0.85 ± 0.07 | 1.50 ± 0.09*** | 1.41 ± 0.07*** |
| VAT weight/Body weight (%) | 2.62 ± 0.18 | 2.56 ± 0.22 | 2.93 ± 0.24 | 2.51 ± 0.12 |
| Liver weight (g) | 1.57 ± 0.05 | 1.46 ± 0.02 | 3.10 ± 0.22*** | 3.92 ± 0.30***,† |
| Spleen weight (g) | 0.098 ± 0.005 | 0.101 ± 0.005 | 0.143 ± 0.006*** | 0.159 ± 0.009*** |
NAC, N-acetyl-L-cysteine; ND, ND-fed mice; NAC, ND-fed mice treated with NAC 10 mg/ml; HFD, HFD-fed mice; HFD + NAC, HFD-fed mice treated with NAC 10 mg/ml; VAT, visceral adipose tissue. Data are shown as mean ± SEM. ***p<0.001 vs ND, †p<0.05 vs HFD, ††p<0.01 vs HFD.
In addition, and consistent with our previous report,(19) the serum concentration of BAFF in HFD-fed mice was significantly higher than that in ND-fed mice (Fig. 3A). However, the serum BAFF concentration did not correlate with body weight (Fig. 3B).
Fig. 3.
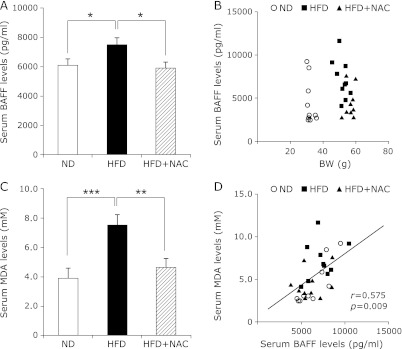
Levels of lipid peroxidation and serum BAFF in mice. (A) Serum BAFF in ND, HFD, and HFD + NAC mice at 32 weeks of age (n = 9). Values are expressed as mean ± SEM. *p<0.05 as compared with HFD. (B) Correlation between serum concentrations of BAFF and body weight in all mice. ND, ○; HFD, ■; HFD + NAC, ▲. (C) Serum MDA in ND, HFD, and HFD + NAC mice at 32 weeks of age (n = 9). Values are expressed as mean ± SEM. **p<0.01 and ***p<0.001 as compared with HFD. (D) Correlation between serum concentrations of MDA and BAFF in all mice. A positive correlation was observed between serum concentrations of MDA and BAFF (r = 0.575; p = 0.0009). ND, ○; HFD, ■; HFD + NAC, ▲. Pearson’s correlation coefficient (r) is shown for each relationship.
We tested whether the HFD alters the redox balance by assessing malondialdehyde (MDA) levels, a well-known biomarker for lipid peroxidation.(22) The serum concentration of MDA in HFD-fed mice was significantly higher than that in ND-fed mice (Fig. 3C). To further explore whether serum BAFF levels correlated with oxidative stress, the antioxidant NAC was given to HFD-fed mice. NAC treatment did not affect the body weight in the ND-fed mice, but increased the body weight in the HFD-fed mice (Table 1). Both serum BAFF and MDA levels of HFD-fed mice treated with NAC were reduced in comparison with those of HFD-fed mice without NAC (Fig. 3 A and C). Although the serum MDA concentration did not correlate with body weight (data not shown), the serum MDA concentration was correlated with the serum BAFF concentration (Fig. 3D).
Expression of BAFF in VAT is induced by oxidative stress
It has been reported that in obesity, increased oxidative stress in the blood is due to increased ROS production from accumulated fat deposits.(23) We investigated the oxidative stress levels using 8-OHdG staining as a measure of oxidative stress in VAT. Immunohistochemistry studies revealed that the number of 8-OHdG-positive cells was higher in the VAT from the HFD-fed mice than the VAT from other mice (Fig. 4 A and B). The number of 8-OHdG-positive cells in the liver did not differ between ND-fed and HFD-fed mice (data not shown). Next, the relationship between BAFF and oxidative stress was analyzed at the organ and tissue level in mice; the mRNA expression of BAFF in several organs and tissues obtained from ND-fed and HFD-fed mice was also examined. The BAFF mRNA levels were higher in the VAT from the HFD-fed mice than that from the ND-fed mice (Fig. 4C). On the other hand, BAFF mRNA expression levels in the liver and muscle did not differ between HFD-fed and ND-fed mice (Fig. 4 D and E). In addition, BAFF mRNA levels were significantly lower in the VAT from the HFD-fed mice treated with NAC than in the VAT from the HFD-fed mice without NAC (Fig. 4C). These data indicate that BAFF mRNA expression in VAT is induced by oxidative stress and that this might be associated with an increased serum level of BAFF in HFD-fed mice.
Fig. 4.
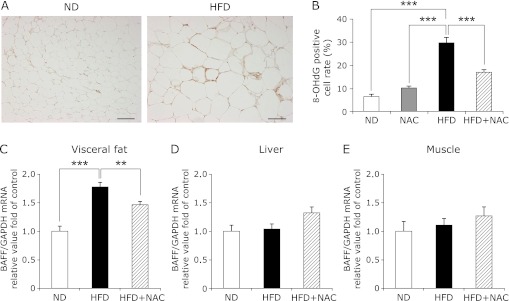
Oxidative stress in visceral adipose tissue is associated with BAFF expression. (A) Immunohistochemical staining of 8-OHdG in sections from visceral adipose tissue from ND-fed (left panel) and HFD-fed (right panel) mice. Bar = 100 µm. (B) The number of 8-OHdG-positive cells is shown according to the percentage of each section in the total number of cells, as described in the Materials and methods (n = 10). Values are expressed as the mean ± SEM. ***p<0.001 between the two values. (C–E) The mRNA expression of BAFF in visceral fat (epididymis) (C) (n = 7), liver (D) (n = 10), and skeletal muscle (E) (n = 10) of ND- (white bars), HFD- (black bar), and HFD + NAC-fed mice (diagonal bar) at 32 weeks of age. The mRNA level of BAFF was examined by RT-PCR, and gene expression levels were normalized to GAPDH mRNA expression. The degree of change in gene expression is based on the mean expression level of the control (ND-fed) mice. Values are expressed as the mean ± SEM. **p<0.01 and ***p<0.001 as compared with the HFD values.
The NF-κB pathway was involved in the enhanced BAFF expression in adipocytes
We analyzed the underlying mechanisms of BAFF expression in adipocytes in response to ROS using 3T3-L1 adipocytes. Several reports have shown that BAFF expression in immunocytes is increased by NF-κB activation,(24–26) and we found that NF-κB p65 was activated by the addition of H2O2 to 3T3-L1 adipocytes (Fig. 5A).
Fig. 5.
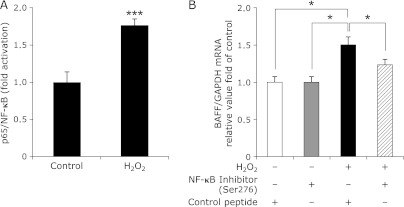
NF-κB p65 is involved in the enhanced BAFF expression induced by ROS in adipocytes. (A) DNA binding of p65. NF-κB p65 activation in the 3T3-L1 adipocytes exposed to H2O2 for 3 h (n = 8). NF-κB p65 activation is shown as fold increase relative to NF-κB p65 binding activity in the controls. Values are expressed as the mean ± SEM. ***p<0.001 as compared with the control value. (B) The mRNA expression levels of BAFF in the 3T3-L1 adipocytes exposed to H2O2 with the control peptide or with the NF-κB p65 (Ser276) inhibitory peptide (n = 5). The 3T3-L1 adipocytes were pretreated with control peptide or with NF-κB p65 inhibitory peptide as described in Materials and Methods. The mRNA level of BAFF was examined by RT-PCR, and gene expression levels were normalized to GAPDH mRNA expression. The degree of change in gene expression is based on the mean expression level of the control. Values are expressed as the mean ± SEM. *p<0.05 between the two values.
Finally, we employed a complementary approach using an NF-κB p65 (Ser276) inhibitory peptide. BAFF mRNA expression was increased by incubation with H2O2 in 3T3-L1 adipocytes treated with the control peptide, and treatment with the NF-κB inhibitory peptide inhibited H2O2-mediated BAFF mRNA expression (Fig. 5B).
Discussion
Obesity is the central and causal component of metabolic syndrome. The mechanistic role of obesity has not been elucidated, but recent studies have shown that the dysregulated production of adipokines is critical in the pathogenesis of metabolic syndrome.(11,23) The production of adipokines is regulated by a variety of factors; for example, the production of leptin is increased by pro-inflammatory factors such as TNF-α, IL-1, and LPS.(27,28) Conversely, the production of adiponectin is inhibited by pro-inflammatory factors, as well as by hypoxia and oxidative stress.(11) Recently, BAFF has been reported to be expressed in mature adipocytes.(16–19) In addition, we have also demonstrated that BAFF levels are preferentially increased in VAT and sera in obese mice, and that BAFF plays a role in the induction of impaired insulin sensitivity.(19) These data indicate that BAFF is an adipokine capable of inducing insulin resistance, and that it may predispose obese individuals to metabolic syndrome.
In this study, we investigated the triggers of enhanced BAFF expression in adipocytes. The expression of BAFF has been reported to change under pro-inflammatory and anti-inflammatory conditions.(13,14,17,26) For example, BAFF is produced by macrophages or dendritic cells upon stimulation with LPS,(14,26) but LPS did not affect BAFF mRNA expression in 3T3-L1 adipocytes (Fig. 1A). The reasons for this discrepancy are not clear, but one possibility is that the expression level of toll-like receptor 4 is much lower in 3T3-L1 adipocytes than in RAW264 macrophages.(29) On the other hand, ROS were associated with BAFF expression in adipocytes in vitro (Fig. 1 and 2). Furukawa et al.(23) showed that incubation with H2O2 increased mRNA expression levels of plasminogen activator inhibitor-1, IL-6, and MCP-1 in 3T3-L1 adipocytes, and that incubation with the antioxidant NAC reversed the effects of H2O2 on the expression level of these genes; this is consistent with our results (Fig. 1 and 2).
In addition, oxidative stress and BAFF expression was increased only in VAT, but not in other tissues examined, including the liver and muscle (Fig. 4). Further, BAFF expression was significantly suppressed by treatment with the antioxidant NAC both in vitro and in vivo (Fig. 2 and 4), indicating that increased BAFF concentration in sera is due to increased ROS production from VAT in obese individuals. The production of ROS has also been reported to increase selectively in VAT from obese mice.(23) Moreover, obese subjects exhibit increased systemic oxidative stress,(23,30) which is enhanced when obesity is associated with abdominal adiposity in humans.(31) These in vitro and in vivo findings indicate that a local increase in oxidative stress in accumulated fat causes dysregulated production of BAFF, and reduction of oxidative stress in fat could improve the dysregulation of adipokines and obesity-related metabolic disorders.
The exact reasons why NAC administration did not decrease the body weight in HFD-fed mice are not understood. However, discrepancies have been found in the effect of NAC in experimental models of obesity.(32–34) In addition, the duration of NAC administration in the present study was longer than that in the previous reports.(32–34) Further studies are necessary to clarify this matter. On the other hand, we observed that the impairment of insulin sensitivity was ameliorated by NAC treatment in HFD-fed mice (data not shown), consistent with the previous reports.(35,36) This indicates that insulin resistance may have some roles in the expression of BAFF by oxidative stress.
Finally, we studied the mechanisms of increased BAFF transcription by ROS in adipocytes using 3T3-L1 cells. Several lines of evidence indicate that the redox status of the cell plays a role in modulating NF-κB activation.(37) Nuclear translocation of NF-κB can be triggered by exposure to H2O2,(38) and adipocytes also express components of the NF-κB pathway.(39) Recent reports have shown that the BAFF gene is regulated by NF-κB activation in human non-Hodgkin lymphoma cells,(24) multiple myeloma,(25) and murine macrophages.(26) Our data show that BAFF expression and NF-κB are activated in 3T3-L1 adipocytes by treatment with H2O2 (Fig. 5A), and the NF-κB p65 inhibitory peptide inhibited ROS-induced upregulation of BAFF in adipocytes (Fig. 5B). We conducted the experiments using other inhibitors, such as LY 294002 (phosphatidylinositol 3-kinase inhibitor), AG490 (Janus kinase (JAK) 1 inhibitor II, JAK2 inhibitor VI, and JAK3 inhibitor VIII), and PD98059 (p44/42 mitogen-activated protein kinase inhibitor), but these did not inhibit ROS-induced BAFF mRNA expression in 3T3-L1 adipocytes (data not shown). This indicates that ROS-induced BAFF expression in adipocytes could be regulated by NF-κB activation. Further studies are required to determine mechanistic basis for the relationship between NF-κB activation and ROS-induced BAFF production.
In summary, the increased ROS in adipocytes causes an increase in BAFF expression. The increased oxidative stress in accumulated fat is one of the important underlying causes of obesity-associated metabolic syndrome, suggesting that controlling the redox state in VAT is a potentially useful target for metabolic syndrome via the regulation of adipokine production.
Acknowledgments
We thank Mr. Kenji Tanimoto, Ms. Sawa Yamamoto, and Ms. Sakiko Sugawara for their valuable contributions to this study. This research was supported in part by Grants-in-Aid for Scientific Research from the Japanese Ministry of Education, Culture, Sports, Science and Technology (JSPS KAKENHI 24590979) and a research grant from Ehime University.
Abbreviations
- BAFF
B cell activating factor
- C3H
C3H/10T 1/2-clone 8
- DMEM
Dulbecco’s modified Eagle’s medium
- FBS
fetal bovine serum
- GAPDH
glyceraldehyde-3-phosphate dehydrogenase
- HFD
high fat diet
- H2O2
hydrogen peroxide
- IBMX
3-isobuthy-1-methylxanthine
- IFN-γ
interferon-gamma
- IL
interleukin
- JAK
janus kinase
- LPS
lipopolysaccharide
- MCP-1
monocyte chemotactic protein-1
- MDA
malondialdehyde
- NAC
N-acetyl-cysteine
- ND
normal diet
- NF-κB
nuclear factor-kappaB
- 8-OHdG
8-hydroxy-deoxyguanosine
- ROS
reactive oxygen species
- TNF
tumor necrosis factor
- VAT
visceral adipose tissue
Conflict of interest
No potential conflicts of interest were disclosed.
References
- 1.Ogden CL, Carroll MD, Curtin LR, McDowell MA, Tabak CJ, Flegal KM. Prevalence of overweight and obesity in the United States, 1999–2004. JAMA. 2006;295:1549–1555. doi: 10.1001/jama.295.13.1549. [DOI] [PubMed] [Google Scholar]
- 2.Calle EE, Thun MJ, Petrelli JM, Rodriguez C, Heath CW., Jr Body-mass index and mortality in a prospective cohort of U.S. adults. N Engl J Med. 1999;341:1097–1105. doi: 10.1056/NEJM199910073411501. [DOI] [PubMed] [Google Scholar]
- 3.Mokdad AH, Ford ES, Bowman BA, et al. Prevalence of obesity, diabetes, and obesity-related health risk factors, 2001. JAMA. 2003;289:76–79. doi: 10.1001/jama.289.1.76. [DOI] [PubMed] [Google Scholar]
- 4.Reeves GK, Pirie K, Beral V, Green J, Spencer E, Bull D. Cancer incidence and mortality in relation to body mass index in the Million Women Study: cohort study. BMJ. 2007;335:1134. doi: 10.1136/bmj.39367.495995.AE. [DOI] [PMC free article] [PubMed] [Google Scholar]
- 5.Renehan AG, Tyson M, Egger M, Heller RF, Zwahlen M. Body-mass index and incidence of cancer: a systematic review and meta-analysis of prospective observational studies. Lancet. 2008;371:569–578. doi: 10.1016/S0140-6736(08)60269-X. [DOI] [PubMed] [Google Scholar]
- 6.Hotamisligil GS. Inflammation and metabolic disorders. Nature. 2006;444:860–867. doi: 10.1038/nature05485. [DOI] [PubMed] [Google Scholar]
- 7.Shoelson SE, Lee J, Goldfine AB. Inflammation and insulin resistance. J Clin Invest. 2006;116:1793–1801. doi: 10.1172/JCI29069. [DOI] [PMC free article] [PubMed] [Google Scholar]
- 8.Ouchi N, Parker JL, Lugus JJ, Walsh K. Adipokines in inflammation and metabolic disease. Nat Rev Immunol. 2011;11:85–97. doi: 10.1038/nri2921. [DOI] [PMC free article] [PubMed] [Google Scholar]
- 9.Tilg H, Moschen AR. Adipocytokines: mediators linking adipose tissue, inflammation and immunity. Nat Rev Immunol. 2006;6:772–783. doi: 10.1038/nri1937. [DOI] [PubMed] [Google Scholar]
- 10.Berg AH, Scherer PE. Adipose tissue, inflammation, and cardiovascular disease. Circ Res. 2005;96:939–949. doi: 10.1161/01.RES.0000163635.62927.34. [DOI] [PubMed] [Google Scholar]
- 11.Hosogai N, Fukuhara A, Oshima K, et al. Adipose tissue hypoxia in obesity and its impact on adipocytokine dysregulation. Diabetes. 2007;56:901–911. doi: 10.2337/db06-0911. [DOI] [PubMed] [Google Scholar]
- 12.Schneider P, MacKay F, Steiner V, et al. BAFF, a novel ligand of the tumor necrosis factor family, stimulates B cell growth. J Exp Med. 1999;189:1747–1756. doi: 10.1084/jem.189.11.1747. [DOI] [PMC free article] [PubMed] [Google Scholar]
- 13.Moore PA, Belvedere O, Orr A, et al. BLyS: member of the tumor necrosis factor family and B lymphocyte stimulator. Science. 1999;285:260–263. doi: 10.1126/science.285.5425.260. [DOI] [PubMed] [Google Scholar]
- 14.Nardelli B, Belvedere O, Roschke V, et al. Synthesis and release of B-lymphocyte stimulator from myeloid cells. Blood. 2001;97:198–204. doi: 10.1182/blood.v97.1.198. [DOI] [PubMed] [Google Scholar]
- 15.Ittah M, Miceli-Richard C, Eric Gottenberg J, et al. B cell-activating factor of the tumor necrosis factor family (BAFF) is expressed under stimulation by interferon in salivary gland epithelial cells in primary Sjögren’s syndrome. Arthritis Res Ther. 2006;8:R51. doi: 10.1186/ar1912. [DOI] [PMC free article] [PubMed] [Google Scholar]
- 16.Pelekanou V, Kampa M, Kafousi M, et al. Expression of TNF-superfamily members BAFF and APRIL in breast cancer: immunohistochemical study in 52 invasive ductal breast carcinomas. BMC Cancer. 2008;8:76. doi: 10.1186/1471-2407-8-76. [DOI] [PMC free article] [PubMed] [Google Scholar]
- 17.Kim YH, Choi BH, Cheon HG, Do MS. B cell activation factor (BAFF) is a novel adipokine that links obesity and inflammation. Exp Mol Med. 2009;41:208–216. doi: 10.3858/emm.2009.41.3.024. [DOI] [PMC free article] [PubMed] [Google Scholar]
- 18.Alexaki VI, Notas G, Pelekanou V, et al. Adipocytes as immune cells: differential expression of TWEAK, BAFF, and APRIL and their receptors (Fn14, BAFF-R, TACI, and BCMA) at different stages of normal and pathological adipose tissue development. J Immunol. 2009;183:5948–5956. doi: 10.4049/jimmunol.0901186. [DOI] [PubMed] [Google Scholar]
- 19.Hamada M, Abe M, Miyake T, et al. B cell-activating factor controls the production of adipokines and induces insulin resistance. Obesity (Silver Spring) 2011;19:1915–1922. doi: 10.1038/oby.2011.165. [DOI] [PubMed] [Google Scholar]
- 20.Miyake T, Abe M, Tokumoto Y, et al. B cell-activating factor is associated with the histological severity of nonalcoholic fatty liver disease Hepatol Int 2012. DOI: 10.1007/s12072-012-9345-8 [DOI] [PubMed] [Google Scholar]
- 21.Miyake T, Akbar SM, Yoshida O, et al. Impaired dendritic cell functions disrupt antigen-specific adaptive immune responses in mice with nonalcoholic fatty liver disease. J Gastroenterol. 2010;45:859–867. doi: 10.1007/s00535-010-0218-4. [DOI] [PubMed] [Google Scholar]
- 22.Del Rio D, Stewart AJ, Pellegrini N. A review of recent studies on malondialdehyde as toxic molecule and biological marker of oxidative stress. Nutr Metab Cardiovasc Dis. 2005;15:316–328. doi: 10.1016/j.numecd.2005.05.003. [DOI] [PubMed] [Google Scholar]
- 23.Furukawa S, Fujita T, Shimabukuro M, et al. Increased oxidative stress in obesity and its impact on metabolic syndrome. J Clin Invest. 2004;114:1752–1761. doi: 10.1172/JCI21625. [DOI] [PMC free article] [PubMed] [Google Scholar]
- 24.Fu L, Lin-Lee YC, Pham LV, Tamayo A, Yoshimura L, Ford RJ. Constitutive NF-κB and NFAT activation leads to stimulation of the BLyS survival pathway in aggressive B-cell lymphomas. Blood. 2006;107:4540–4548. doi: 10.1182/blood-2005-10-4042. [DOI] [PMC free article] [PubMed] [Google Scholar]
- 25.Tai YT, Li XF, Breitkreutz I, et al. Role of B-cell-activating factor in adhesion and growth of human multiple myeloma cells in the bone marrow microenvironment. Cancer Res. 2006;66:6675–6682. doi: 10.1158/0008-5472.CAN-06-0190. [DOI] [PubMed] [Google Scholar]
- 26.Moon EY, Lee JH, Oh SY, et al. Reactive oxygen species augment B-cell-activating factor expression. Free Radic Biol Med. 2006;40:2103–2111. doi: 10.1016/j.freeradbiomed.2006.02.007. [DOI] [PubMed] [Google Scholar]
- 27.Grunfeld C, Zhao C, Fuller J, et al. Endotoxin and cytokines induce expression of leptin, the ob gene product, in hamsters. J Clin Invest. 1996;97:2152–2157. doi: 10.1172/JCI118653. [DOI] [PMC free article] [PubMed] [Google Scholar]
- 28.Sarraf P, Frederich RC, Turner EM, et al. Multiple cytokines and acute inflammation raise mouse leptin levels: potential role in inflammatory anorexia. J Exp Med. 1997;185:171–175. doi: 10.1084/jem.185.1.171. [DOI] [PMC free article] [PubMed] [Google Scholar]
- 29.Suganami T, Tanimoto-Koyama K, Nishida J, et al. Role of the Toll-like receptor 4/NF-κB pathway in saturated fatty acid-induced inflammatory changes in the interaction between adipocytes and macrophages. Arterioscler Thromb Vasc Biol. 2007;27:84–91. doi: 10.1161/01.ATV.0000251608.09329.9a. [DOI] [PubMed] [Google Scholar]
- 30.Keaney JF, Jr, Larson MG, Vasan RS, et al. Obesity and systemic oxidative stress: clinical correlates of oxidative stress in the Framingham Study. Arterioscler Thromb Vasc Biol. 2003;23:434–439. doi: 10.1161/01.ATV.0000058402.34138.11. [DOI] [PubMed] [Google Scholar]
- 31.Sankhla M, Sharma TK, Mathur K, et al. Relationship of oxidative stress with obesity and its role in obesity induced metabolic syndrome. Clin Lab. 2012;58:385–392. [PubMed] [Google Scholar]
- 32.Lin CC, Yin MC. Effects of cysteine-containing compounds on biosynthesis of triacylglycerol and cholesterol and anti-oxidative protection in liver from mice consuming a high-fat diet. Br J Nutr. 2008;99:37–43. doi: 10.1017/S0007114507793881. [DOI] [PubMed] [Google Scholar]
- 33.Wang T, Si Y, Shirihai OS, et al. Respiration in adipocytes is inhibited by reactive oxygen species. Obesity (Silver Spring) 2010;18:1493–1502. doi: 10.1038/oby.2009.456. [DOI] [PMC free article] [PubMed] [Google Scholar]
- 34.Elshorbagy AK, Valdivia-Garcia M, Mattocks DA, et al. Effect of taurine and N-acetylcysteine on methionine restriction-mediated adiposity resistance Metabolism 2012. DOI:10.1016/j.metabol.2012.10.005 [DOI] [PubMed] [Google Scholar]
- 35.Diniz YS, Rocha KK, Souza GA, et al. Effects of N-acetylcysteine on sucrose-rich diet-induced hyperglycaemia, dyslipidemia and oxidative stress in rats. Eur J Pharmacol. 2006;543:151–157. doi: 10.1016/j.ejphar.2006.05.039. [DOI] [PubMed] [Google Scholar]
- 36.El Midaoui A, Ismael MA, Lu H, Fantus IG, de Champlain J, Couture R. Comparative effects of N-acetyl-L-cysteine and ramipril on arterial hypertension, insulin resistance, and oxidative stress in chronically glucose-fed rats. Can J Physiol Pharmacol. 2008;86:752–760. doi: 10.1139/Y08-090. [DOI] [PubMed] [Google Scholar]
- 37.Oliveira-Marques V, Marinho HS, Cyrne L, Antunes F. Role of hydrogen peroxide in NF-κB activation: from inducer to modulator. Antioxid Redox Signal. 2009;11:2223–2243. doi: 10.1089/ars.2009.2601. [DOI] [PubMed] [Google Scholar]
- 38.Flohé L, Brigelius-Flohé R, Saliou C, Traber MG, Packer L. Redox regulation of NF-κB activation. Free Radic Biol Med. 1997;22:1115–1126. doi: 10.1016/s0891-5849(96)00501-1. [DOI] [PubMed] [Google Scholar]
- 39.Berg AH, Lin Y, Lisanti MP, Scherer PE. Adipocyte differentiation induces dynamic changes in NF-κB expression and activity. Am J Physiol Endocrinol Metab. 2004;287:E1178–E1188. doi: 10.1152/ajpendo.00002.2004. [DOI] [PubMed] [Google Scholar]