Abstract
Bone resorption is regulated by a complex system of hormones and cytokines that cause osteoblasts/stromal cells and lymphocytes to produce factors including RANKL, that ultimately result in the differentiation and activation of osteoclasts, the bone resorbing cells.
We used a microarray approach to identify genes upregulated in RANKL-stimulated osteoclast-precursor cells. Osteoclast expression was confirmed by multiple tissue Northern and in situ hybridization analysis. Gene function studies were carried out by siRNA analysis.
We identified a novel gene, which we termed nha-oc/NHA2, which is strongly upregulated during RANKL-induced osteoclast differentiation in vitro and in vivo. nha-oc/NHA2 encodes a novel cation/proton antiporter (CPA), and is the mouse orthologue of a human gene identified in a database search: HsNHA2. nha-oc/NHA2 is selectively expressed in osteoclasts. NHA-oc/NHA2 protein localizes to the mitochondria, where it mediates Na+-dependent changes in mitochondrial pH and Na+ Acetate induced-mitochondrial passive swelling. RNA silencing of nha-oc/nha2 reduces osteoclast differentiation and resorption, suggesting a role for NHA-oc/NHA2 in these processes.
nha-oc/NHA2 therefore is a novel member of the CPA family, and is the first mitochondrial NHA characterized to date. nha-oc/NHA2 is also unique in that it is the first eukaryotic and tissue specific CPA2 characterized to date. NHA-oc/NHA2 displays the expected activities of a bona fide CPA and plays a key role(s) in normal osteoclast differentiation and function.
Keywords: Osteoclast, Mitochondria, Sodium, Proton, Antiporter
Introduction
The electro neutral exchange of Na+ or K+ and H+ down their concentration gradients (antiport activity) is present in all phyla and kingdoms. This activity is essential to control processes such as intracellular pH, cell volume and reuptake of Na+ across several epithelia 1-3. It is also involved in other cellular events such as migration, adhesion, proliferation and apoptosis.
Members of the Cation Proton Antiporter (CPA) superfamily have been reported to catalyze antiport of monovalent cations (Na+, H+, K+ and NH4+). The CPA superfamily can be divided in three families (CPA1, CPA2, and NaT-DC-Na+ - transporting carboxylic acid decarboxylase -) on the basis of their distinct phylogenetic origin 4,5. Members of this family have between 333 and 900 amino acid residues and exhibit 10 -14 putative transmembrane segments (TMSs).
No eukaryotic member of the CPA2 family, has been characterized 4,6. On the other hand, many eukaryotic CPA1 members have been identified and characterized, including many Na+/H+ exchangers from fungi, plants, and mammals,
The Sodium-Proton Exchangers (NHEs), antiporters of the CPA1 family, catalyze Na+ and H+ antiport. NHE activity is also involved in other cellular events such as cell migration, adhesion and proliferation in response to growth factors 7,8. Activation of sodium-proton exchange is also associated with the onset of apoptosis 9-11. Eukaryotic NHEs display a conserved N-terminus consisting of 10 to 12 transmembrane (TM) domains, followed by a less-conserved C-terminal cytoplasmic tail. From a functional standpoint the NHE isoforms differ in their kinetic behavior, sensitivity to inhibitors and regulation by hormonal stimuli 4,6. NHEs can be ubiquitously expressed or relatively tissue/cell specific. In addition, NHEs can localize to the plasma membrane or to cell organelles.
Even though a mitochondrial N+/H+ exchanger has been known to exist for over 40 years, the molecular characterization of the antiporter remains elusive. A presumed mitochondrial NHE has been cloned in yeast 12. A human homologue (named NHE6), originally isolated from a bone marrow cell line, was identified and also shown to localize to mitochondria 12. However, another group reexamined these results because NHE6 mitochondrial localization conflicted with predictions derived from phylogenetic analyses, and showed that NHE6 in fact localized to recycling endosomes 13.
In an Affymetrix Gene Chip microarray screening, we identified a novel gene, which we termed nha-oc/NHA2, which is differentially expressed in RANKL-stimulated osteoclasts compared with their precursors. nha-oc/NHA2 is the mouse orthologue of a previously identified human gene HsNHA2 4. nha-oc/NHA2 belongs to the CPA2 family and based on its similarity to the fungal NHA1, it is likely to be a Na+ and K+/H+ antiporter 4. The goals of the present study were to describe the cloning of nha-oc/NHA2, to characterize its expression in vitro and in vivo, to study the activity of the NHA-oc/NHA2 protein, and to evaluate the effect of nha-oc/NHA2 silencing on osteoclast differentiation and resorption.
Materials and Methods
Cells
RAW 264.7 (TIB-71) mouse macrophage/monocytes were purchased from ATCC. Cells were cultured in DMEM/1.5g/l sodium bicarbonate (JRH Biosciences, Lenexa, KS) supplemented with 10% non heat-inactivated FBS (BioWhitaker). To induce osteoclast differentiation, cells were cultured in the presence of 50 ng/ml soluble RANKL (PeproTech Inc., Rocky Hill, NJ) for up to 5 days with changes of medium and RANKL every other day. Mouse bone marrow cells were obtained from long bones of 2-week old C57Bl/6 mice. Briefly, femurs were dissected and bone marrow cells flushed in alpha-MEM supplemented with 10% FBS. The cells were resuspended, counted and plated in alpha-MEM/FBS supplemented with 50 ng/ml soluble RANKL and 50 ng/ml M-CSF (PeproTech Inc., Rocky Hill, NJ). Cells were cultured for up to 5 days with changes of medium, RANKL and M-CSF every two days. PS120 cells are derived from Chinese hamster lung fibroblasts (CCL39), which lack all N+/H+ antiport activity 14. PS120 cells were grown in DMEM supplemented with 10%FBS and 26 mM sodium bicarbonate.
Microarray hybridization
A genome wide expression screening was conducted to identify genes upregulated during RANKL-induced osteoclast differentiation. Briefly, RNA from undifferentiated and RANKL-stimulated RAW 264.7 and bone marrow cells (BMC) were used as templates to generate mixed cDNA probes by reverse transcription. These probes were hybridized to the Mouse MG-U74Av2 chip from Affymetrix according to the manufacturer's instruction, at the Harvard Bauer Center for Genomics Research (Cambridge, MA). Microarray analysis of CSF-1-induced gene expression changes in tl/tl rats during time course of CSF-1 injections was described in detail in Yang et al 15. In brief, homozygous mutant animals were IP injected daily with 106 Units of recombinant human CSF-1 (Chiron). Four day 0 animals were used as untreated controls, and 4 animals were sacrificed at days 2, 4 and 6. One tibia was collected for TRAP histology for osteoclast counts, and the contralateral tibia and femur were dissected free of extraneous tissue, split longitudinally, flushed with PBS to remove any marrow and flash frozen. Total bone RNA was extracted (TRIAZOL) prepared for microarray hybridization according to the manufacturer's instructions (Affymetrix). Labeled, cRNA from single animals was hybridized to the rat chipset RAE230, giving 4 individual datasets for each time point. Results were analyzed with D-Chip software. Statistical tests done were F- tests to determine equivalence of variance followed by one-tailed t-tests. For both F- and t-tests, the cutoff for significance was 0.05.
Animals were obtained from the breeding colony maintained at the University of Massachusetts Medical School, and all procedures involving animals were approved by the UMMS IACUC.
Sequence analysis
NHA-oc/NHA2 topological prediction analysis was done using the TMHMM Server v. 2.0 (Center for Biological Sequence Analysis, The Technical University of Denmark) 16,17 and the TopPred2 server 18. The hydropathic profiles were generated using the kPROT server from The Bioinformatics and Biological Computing Unit and Genome Center at the Weizmann Institute of Science Weizmann, Rehovot, Israel and Department of Biochemistry, Tel Aviv University, Israel) 19 and the Split 4.0 Server (University of Split, Croatia) 20. The TMRPres2D (Transmembrane protein Re-Presentation in 2 Dimensions tool of The Biophysics and Bioinformatics Laboratory, Department of Cell Biology and Biophysics of the University of Athens) 21 was used to generate a graphic image of NHA-oc/NHA2.
Northern Blotting and RT-PCR
Total RNA was extracted from cells and tissues using the TRIAZOL reagent (Invitrogen). For RT-PCR, 2μg of RNA were reversed-transcribed into cDNA using SuperScript II (Invitrogen, # 18064-022) following the manufacturer's instructions. One-tenth of the cDNA was used as a template for the PCR reaction, using the Platinum PCR Supermix (Invitrogen, # 11306-016) according to the manufacturer's protocol.
For Northern blot analysis, 1.5 μg of poly A+ RNA (isolated using the PolyATtract mRNA Isolation System III from PROMEGA) were size fractionated on a 1.2% agarose denaturing gel and transferred onto nylon membranes. A dsDNA NHA-oc/NHA2 probe was generated by RT-PCR from RANKL-stimulated RAW 264.7 total RNA and 32P-labeled using the Rediprime™ II DNA Labeling System (GE Healthcare, # RPN1633). The membranes were hybridized to the radio labeled probes overnight at 42°C in hybridization solution (50% formamide, 5× SSC, 5× Denhardt's solution, 0.5% SDS and 100 μg/ml salmon sperm DNA), washed twice to remove unbound probe in 1× SSC, 0.2% SDS at 50°C for 20 minutes, and exposed to X-ray film. For tissue expression studies a Mouse Multiple Tissue Northern (MTN) blot was utilized (BD Biosciences, #7762-1). Hybridization and washes were performed according to the manufacturer's instructions.
Primers and plasmids
A full length NHA-oc/NHA2 cDNA (minus the termination codon) was generated by RT-PCR using the following primers:
Forward Primer: 5′ c acc atg gag gat gaa gat aag aca gc 3′
Reverse Primer: 5′ ggc ttc cgt aat gga atc ctc 3′
The full length cDNA was subcloned into pcDNA3.1D/V5-His-TOPO (Invitrogen, K4900-01) to generate an expression plasmid pNHA-oc/NHA2/V5-6X His. For RT-PCR we used the following primers that amplified a 900bp NHA-oc/NHA2 fragment:
NHA-oc/NHA2(900)/S 5′ cca tgc tcc ttt tgc agg aag g 3′
NHA-oc/NHA2(900)/AS 5′ cca tca ggc ttc cgt aat gg 3′
Or a 300bp NHA-oc/NHA2 fragment NHA-oc/NHA2(300)/S 5′ cgc tgg ctt taa cat aaa gg 3′ and NHA-oc/NHA2(900)/AS (see above).
In Situ Hybridization
The nhe-oc/NHA2 radioactive riboprobe was prepared using Ambion T7/Sp6 MAXIscript kit (Catalog #1322). The plasmid template (PCRII/NHA-oc/NHA2 2.2) was constructed by subcloning the full length NHA-oc/NHA2 into PCRII-TOPO (Invitrogen). PCRII/NHA-oc/NHA2 2.2 was linearized with Xho I and transcribed with SP6 to generate the “antisense” 35S-labeled riboprobe. The control “sense” 35S riboprobe was transcribed from a Sac I linearized plasmid with the T7 RNA polymerase. Unincorporated nucleotides and salts were subsequently removed using were removed using Ambion's NucAway Spin Columns (Catalog # 10070).
Radioactive in situ hybridization was done using the Ambion mRNA Locator Kit (Catalog#: 1803), following the manufacturer's instructions. Briefly, paraffin tissue sections were deparaffinized, treated with proteinase K, and hybridized with 35S-labeled riboprobes (100 μl/slide, 10,00 cpm/μl) in hybridization buffer in a humidified chamber at 55°- 60°C overnight. After hybridization, slides were washed, treated with RNase A, dipped in autoradiography emulsions (Fisher Scientific Catalog# NC9444-935), exposed for 3-4 wk and developed. Micrographs were taken with a Stemi SV11 microscope (Carl Zeiss MicroImaging, Inc. Thornwood, NY). The images were captured with Zeiss Axiovision 3.1 software.
Transfections and subcellular fractionation
RAW 264.7 cells were transiently transfected with the indicated plasmids using the Lipofectamine 2000 Transfection Reagent (Invitrogen, # 11668-019) following the manufacturer's instructions. Subcellular fractions were obtained by differential centrifugation using the Endoplasmic Reticulum Isolation Kit (SIGMA, ER0100). Mitochondria were isolated using the Mitochondrial Isolation Kit (SIGMA, MITOISO1). Mitochondria were visualized by incubating the cells with the fluorescent mitochondrial stain Mitofluor Red 589 (Invitrogen Cat #: M22424). Mitochondrial fractions were analyzed by Western Blot analysis using: anti-COX IV (Cytochrome C Oxidase) mouse monoclonal antibody (Abcam, Inc. ab14744) and anti-mouse IgG, HRP-linked Antibody (Cellsignal #7076). Chemiluminescent signal was detected using the LUMIGLO reagents A and B (Cellsignal # 7003) following the manufacturer's instructions. Blots were exposed to X-ray film.
V5 epitope fusion proteins were detected using an anti V5 antibody (Invitrogen, # R960-25) and Alexafluor 488 Goat antimouse IgG2a (Invitrogen Cat#: A21131). Confocal images were taken with a Leica confocal microscope (Leica Microsystems).
Caspase activation
Caspase activation was determined by Western Blot analysis using the Apoptosis Antibody Sampler Kit (Mouse Specific) (Cell Signaling Technology, Inc, #9930). Loading controls were done using a GAPDH antibody (Ambion Inc., #AM4300). RAW 264.7 cells were transfected with pNHA-oc/NHA2/V5-6X His and two days later stimulated with RANKL for one day after which protein extracts were generated using the Novex Tris-Glycine SDS Sample Buffer (2×) (Invitrogen, #LC2675).
Mitochondrial passive swelling
Isolated mitochondria were resuspended in ice-cold swelling buffer containing the following: 50mM sucrose, 200mM mannitol, 50 mM Na+ Acetate, 5mM NaH2PO4, 1mM EGTA, 5mM MOPS and 0.1% BSA (pH 7.15) adjusted with KOH. Protein concentration was determined using the BCA Protein Assay Kit (PIERCE #23225). Absorbance was measured at 546 nm with a Smart Spect 3000 spectrophotometer (BioRad).
Intramitachondrial (H+) measurements
Changes in mitochondrial pH were monitored after abrupt removal of Na+ from an “intracellular-like” medium containing the following: 135mM KCl, 10mM NaCl, 0.5mM KH2PO4, 0.5mM MgCl2, and 20mM HEPES (pH 7.2), as well as 10 μM digitonin 22. The experiments were performed in the presence or absence of 20 μM HMA and 20 μM EIPA, two NHE inhibitors 23, to evaluate the possible involvement of NHA-oc/NHA2. Permeabilized cells were then loaded with the pH-sensitive dye loaded 2′, 7′-bis(2-carboxyethyl)-5(6)carboxyfluorescein (BCECF-450/490- nm) (Molecular Probes) for 10 min and the cells were then washed and post-incubated. Confocal images were taken with a Leica confocal microscope (Leica Microsystems).
RNAi
The following predesigned RNAi molecules were purchased from Qiagen:
Mm_C80638_1 HP siRNA (NM_178877) (catalogue # SI00938931)
Mm_C80638_2 HP siRNA (NM_178877) (catalogue # SI00938938)
The RNAi molecules were transfected twice (day 0 and day 2) into RAW264.7 cells using the HiPerFect Transfection Reagent according to the manufacturer's instructions.
Knock-down efficiency was calculated using Image Quant, an image analysis program from Molecular dynamics. Image Quant allows for accurate volume integration of scanned images. Volume and area integration results are transferred to Microsoft Excel for further analysis and reporting.
Resorption assay
To study the ability of osteoclasts to form resorption pits on sub-micron calcium phosphate films, RAW 264.7 cells were plated on a 16-well Osteologic Multitest Slide (BD Biosciences, Bedford, MA) at a density of 103 cells/well and cultured for 4 days in DMEM/10% FBS with or without 50ng/ml mouse RANKL. After incubation, the slides were washed in 5% sodium hypochlorite for five minutes to remove the cells. Resorption lacunae were visualized using a light microscope.
Results
Cloning and structure of nha-oc/NHA2
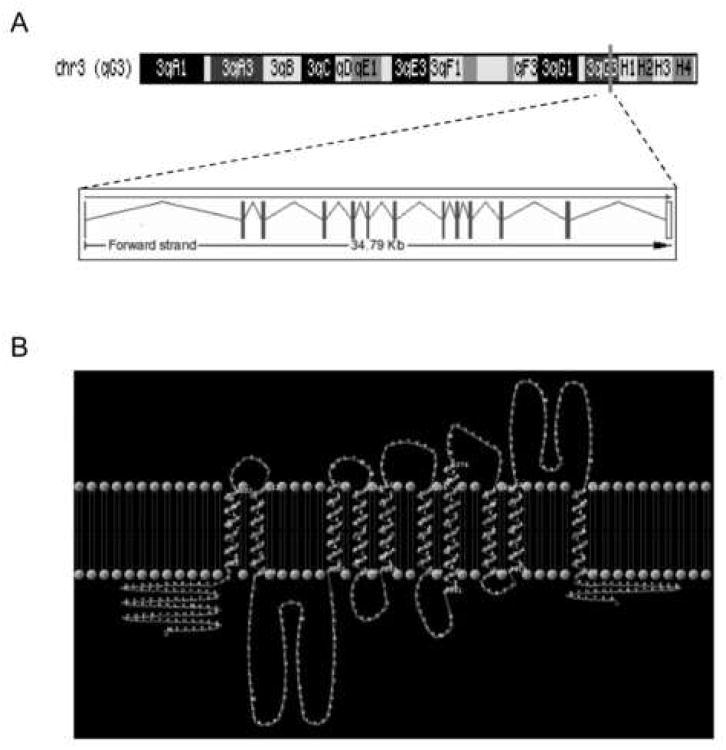
As a means to identify novel molecules involved in RANKL-induced osteoclast differentiation, we conducted a microarray genome-wide screening in RAW 264.7 cells 24 as well as in normal BMC stimulated with RANKL 25. Un-stimulated cells were used as controls. Only genes whose expression was upregulated in both cellular systems were selected for further analysis. Table 1A shows a summary of the results. The p-value calculated for each gene indicates the probability of a RANKL-induced increase in gene expression. A p-value near or equal to zero indicates very high probability. Among the top genes identified in this screening, there are several well-known osteoclast-specific genes (TRAP, c-Fos, Cathepsin K, MMP-9), which validate the screening protocol. Also MIP-1γ, reported to mediate RANKL-induced osteoclast formation and survival 25 and PSTPIP 1, which we reported to be upregulated by RANKL (Battaglino RA, Späete U, Morse LR, Pham L, Stashenko P. (2006) PSTPIP1 silencing by si RNA alters osteoclast morphology and increases resorption in vitro. 28th ASBMR Meeting, Poster #SU230. Philadelphia, PA, September, 2006). Finally, we also identified clone 96481_AT, whose expression was highly upregulated in RANKL-stimulated RAW 264.7 and BMC cells (911 and 280 fold, respectively, Table 1B). Clone 96481_AT contains part of a novel putative Cation Proton Antiporter (CPA), which we termed nha-oc (Sodium Proton Antiporter expressed in osteoclasts). The full-length cDNA contains a 1641 bp open reading frame that encodes a 547 amino acid protein: NHA-oc/NHA2 (Protein id AAH90977.1). nha-oc/NHA2 is the mouse orthologue of a previously identified human gene (HsNHA2). Phylogenetic analysis predicts that nha-oc/NHA2 belongs to the NHA subfamily of the CPA2 family of monovalent cation/proton antiporters 4. nha-oc/NHA2 is located on mouse chromosome 3, region q3G. It contains 13 exons that span ∼34.7 Kb and are predicted to give rise to a 2.0 Kb transcript (Figure 1A).
Table 1. Summary of Results Affymetrix screening.
A partial list displays the top-ranking genes identified in the screening (1A). Induction of nha-oc/NHA2 in bone marrow and RAW 264.7 cells (1B)
| 1A | ||||
|---|---|---|---|---|
| Affymetrix Probe set | Gene Name | Symbol | p-value (RAW) | p-value (BMC) |
| 104761_at | anthrax toxin receptor 2 | Antxr2 | 0 | 0 |
| 160202_at | ATPase, H+ transporting, lysosomal accessory protein 2 | Atp6ap2 | 0 | 0 |
| 98859_at | acid phosphatase 5, tartrate resistant | Acp5, TRAP | 0 | 0 |
| 160901_at | FBJ osteosarcoma oncogene | c-fos | 0 | 0 |
| 160406_at | cathepsin K | Ctsk | 0 | 0 |
| 100581_at | cystatin B | Cstb | 0 | 0 |
| 99957_at | matrix metallopeptidase | 9 Mmp9 | 0 | 0 |
| 103946_at | proline-serine-threonine phosphatase-interacting protein 1 | Pstpip1 | 0 | 0 |
| 104388_at | chemokine (C-C motif) ligand 9 | Ccl9, MIP-1γ | 0 | 0 |
| 97302_at | influenza virus NS1A binding protein | Ivns1abp | 0.000001 | 0 |
| 94556_at | sorting nexin 10 | Snx10 | 0 | 0.000001 |
| 96481_at | expressed sequence C80638 | C80638, NHAoc | 0.000001 | 0 |
| 1B | ||||
| Cell system | Fold Change (uninduced vs RANKL-induced) | |||
|
|
||||
| BMC | 280.4 | |||
| RAW 264.7 | 911.9 | |||
Figure 1.
(A) Genomic localization and gene structure of nha-oc/NHA2
(B) Analysis of NHA-oc/NHA2 using the TMHMM Server v. 2.0 predicts the existence of 10 trans-membrane segments (see also Table 1). Using that data the TMRPres2D tool generated 2 dimensional rendering of NHA-oc/NHA2. The TMHMM analysis predicts that both N- and C-terminus are located on the same side of the membrane
NHA-oc/NHA2 sequence analysis using the TMHMM Server v. 2.0 for the prediction of transmembrane helices in proteins indicated the existence of 10 putative transmembrane (TM) segments (Table 2). Based on these results we generated a possible structure for NHA-oc/NHA2 using the Trans Membrane protein Re-Presentation in 2 Dimensions' tool (TMRpres2D) (Figure 1B).
Table 2. Transmembrane Helix Prediction for NHA-oc/NHA2.
Analysis of NHA-oc/NHA2 amino acid sequence by TMHMM Server v. 2.0 predicts the existence of 10 transmembrane helices.
| Length: 547 AA Number of predicted TMHs: 10 Total probability of N-in: 0.72633 | |||||
|---|---|---|---|---|---|
| AA | position | AA | position | ||
| inside | 1 | 82 | |||
| 1) TMhelix outside | 83 | 102 | 6) TMhelix inside | 306 | 328 |
| 103 | 111 | 329 | 340 | ||
| 2) TMhelix inside | 112 | 134 | 7) TMhelix outside | 341 | 374 |
| 135 | 201 | 375 | 388 | ||
| 3) TMhelix outside | 202 | 224 | 8) TMhelix inside | 389 | 411 |
| 225 | 233 | 412 | 417 | ||
| 4) TMhelix inside | 234 | 256 | 9) TMhelix outside | 418 | 440 |
| 257 | 268 | 441 | 490 | ||
| 5) TMhelix outside | 269 | 291 | 10) TMhelix inside | 491 | 513 |
| 292 | 305 | 514 | 547 | ||
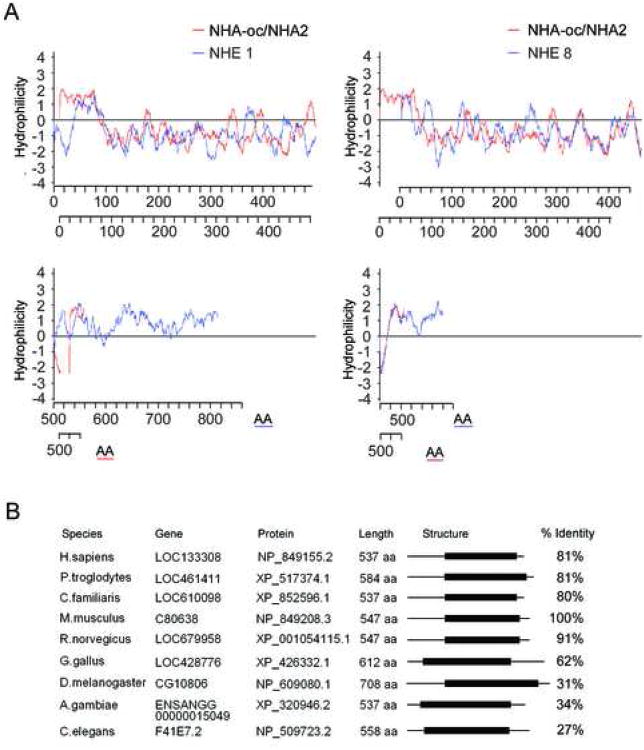
When we compared the hydropathic profiles of NHA-oc/NHA2 with two known NHEs of the CPA1 family (NHE1 and NHE8), using the kPROT server, we found that the profiles were quite comparable (Figure 2A) despite the fact that there is no significant (<10 %) amino acid sequence similarity. NHA-oc/NHA2 has orthologues in all studied metazoans 4 (Figure 2B). These genes therefore comprise a novel group of animal CPA2 genes.
Figure 2.
(A) A comparison between the hydropathic profiles of NHA-oc/NHA2 (red line) and NHE1 (blue line, left panel) or NHE8 (blue line, right panel) shows that NHA-oc/NHA2 has similar structural features, even though there is no significant sequence homology between NHA-oc/NHA2 and either NHE.
(B) nha-oc/NHA2 metazoan orthologues. For all the genes the species, the gene, protein accession numbers, and the shared NHE domain, (shown as a black box) is indicated. The right column indicates the similarity between the mouse NHA-oc/NHA2 and the other orthologues (in percentage).
nha-oc/NHA2 is expressed in differentiated osteoclasts
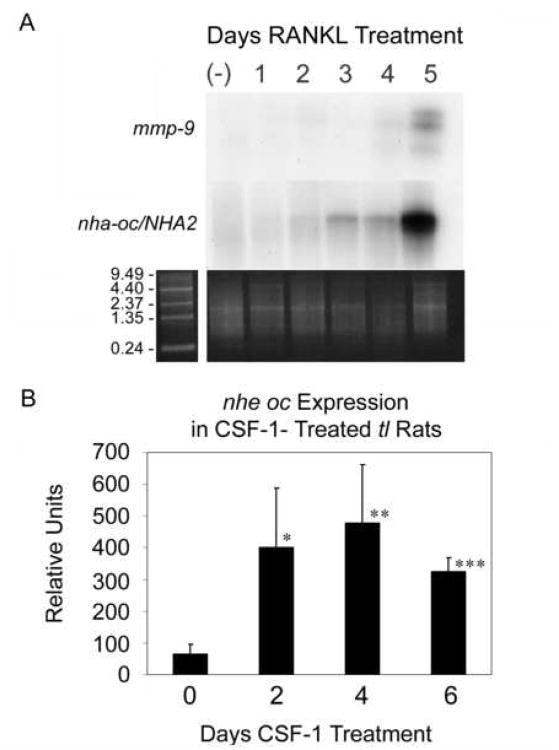
To study nha-oc/NHA2 tissue expression, we performed multiple-tissue Northern Blot analysis. We detected no nha-oc/NHA2 expression in heart, brain, spleen, lung, liver, skeletal muscle, kidney or testis (not shown). nha-oc/NHA2 expression, on the other hand, was clearly observed in differentiating RAW 264.7 after 5 days of stimulation (Figure 3A). In a previous study we had characterized the temporal expression of several osteoclast-specific genes during RANKL stimulation of RAW 264.7 monocytes 24. In that system we detected trap, cathepsin k and mmp-9 mRNA expression after stimulating for 1, 2 and 5 days, respectively 24. This observation suggested that nha-oc/NHA2, like mmp-9, was highly expressed in mature osteoclasts.
Figure 3. nha-oc/NHA2 mRNA expression.
(A) Northern Blot analysis of differentiating RAW 264.7 cells (top panel) shows similar temporal expression of the nha-oc/NHA2 2 Kb message and mmp-9 in response to RANKL stimulation. The ethidium bromide stained poly A+ gel (bottom panel) is shown as a loading control.
(B) RT-PCR analysis of nha-oc/NHA2 expression in tl rats. Each time was done in quadruplicate ie, tibia + femur from 4 different animals, 1 animal per chip. Statistical analyses were done as t-tests assuming equal variances, validated by first doing F-tests for variance using Excel 15 * p < 0.01, ** p < 0.005, *** p < 0.00001.
We next investigated expression in bone during rapid osteoclast differentiation in vivo induced by colony-stimulating factor 1 (CSF-1) in Csf-1-null toothless (tl/tl) rats 15. In CSF-1-treated tl rats (Figure 3B) nha-oc/NHA2 increased after 2 days compared with untreated controls. These results confirm that nha-oc/NHA2 expression is switched off until osteoclast differentiation is initiated by CSF-1/RANKL stimulation.
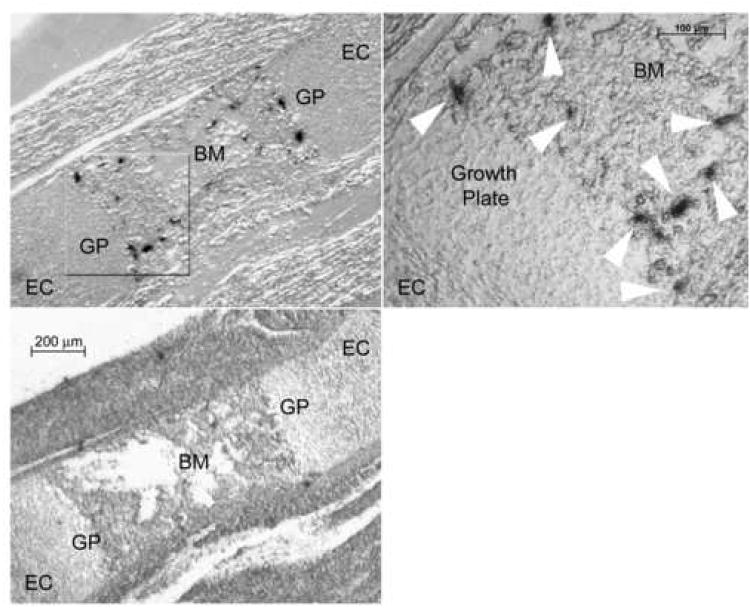
Finally, we studied nha-oc/NHA2 mRNA expression in situ, in 17.5 dpc femur sections. nha-oc/NHA2 expressing cells were seen in a region adjacent to the growth plate, consistent with the location of osteoclasts (Figure 4).
Figure 4.
nha-oc/NHA2 mRNA expression in situ.
Adjacent 17.5 dpc femur sections were hybridized to a 35S-labeled nha-oc/NHA2-specific riboprobe (top, right panel). The highlighted area is shown in a magnified photograph (top, right panel). nha-oc/NHA2 expressing cells (white arrow heads) can be seen on the boundaries of the growth plate, consistent with osteoclast expression. A control (“sense”) 35S-labeled riboprobe was used as a control (bottom, left panel). EC: epiphyseal cartilage, GP: growth plate, BM: bone marrow.
NHA-oc/NHA2 localizes to mitochondria
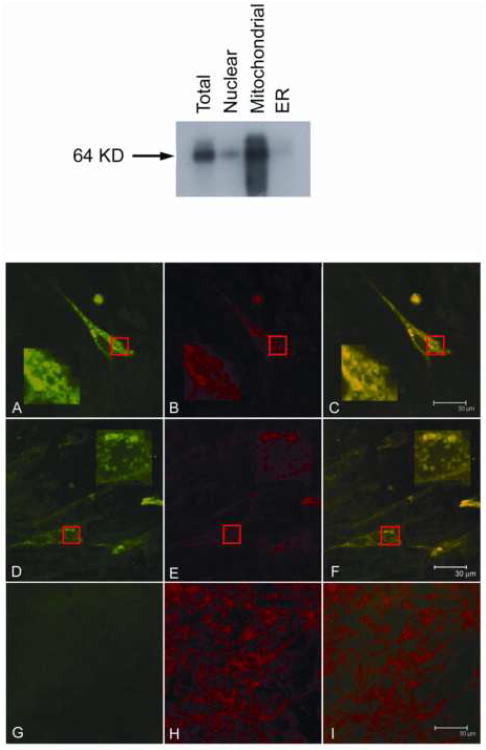
To address the question of NHA-oc/NHA2 subcellular localization we constructed a mammalian expression vector, containing the full-length cDNA (minus the termination codon) fused in frame with a V5 epitope and a 6×-His tag: pNHA-oc/NHA2/V5-6× His (see METHODS). pNHA-oc/NHA2/V5-6X His was transfected into PS120 fibroblasts, which lack all endogenous plasma membrane NHEs 14. Cell fractionation analysis (Figure 5, top) of transfected cells revealed that NHA-oc/NHA2 localizes to the mitochondria. This observation was confirmed by confocal microscopy analysis of PS120 (Figure 5, bottom).
Figure 5.
(top) nha-oc/NHA2 subcellular localization. PS120 cells were transfected with pNHA-oc/NHAoc/V5-6× His. 48 hours later the nuclear, mitochondrial and ER subcellular fractions were separated. Protein extracts were prepared from each fraction and 10 μg each analyzed by western blotting using a α-V5 antibody and an HRP-linked anti mouse antibody. Control total cell extracts were included. A 64 KDa band (the predicted size of the NHA-oc/NHA2/V5-6× His fusion protein) appears predominantly in the mitochondrial fraction.
(bottom) nha-oc/NHA2 subcellular localization. PS120 cells were transfected with pNHA-oc/NHAoc/V5-6× His and stained with α-V5 antibody/Alexafluor 488 Goat anti-mouse IgG2a (primary/secondary) and Mitofluor Red 589 and. Confocal images of representative cells show the antibody-specifc signal in green (panels A and D) and the Mitofluor signal in red (panels B and E) . The superimposed images (in yellow) show co localization (panels C and F). In each case, highlighted areas are magnified to better visualize the staining patterns. Mock-transfected cells were included as controls (panels G, H and I). Note that in mock-transfected cells there is Mitofluor signal but no α-V5 antibody/Alexafluor 488 Goat anti-mouse signal.
NHA-oc/NHA2 mediates Na+-dependent changes in mitochondrial pH
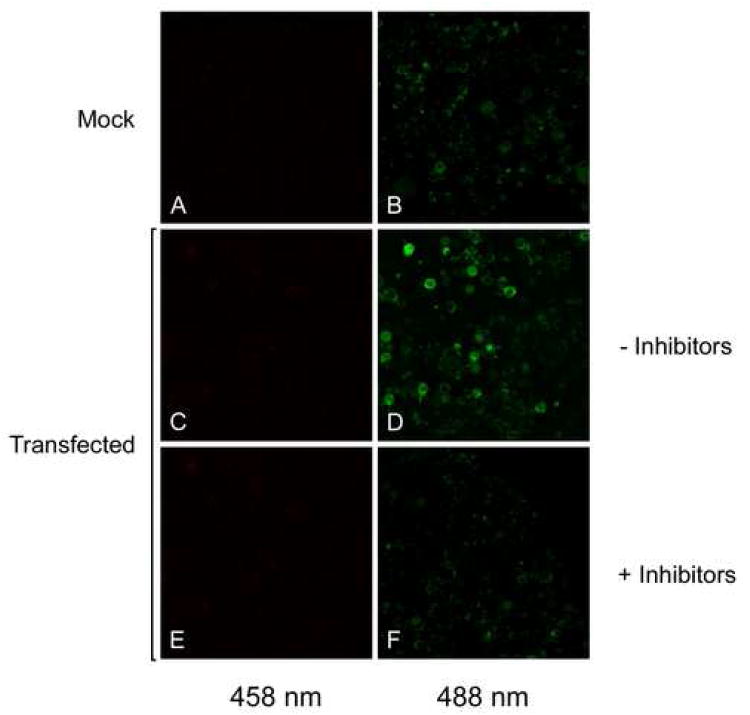
In order to investigate whether NHA-oc/NHA2 possesses typical Cation/Proton Antiporter (CPA) activity, we first studied (Na+)-dependent changes in mitochondrial matrix pH. To that end, we transfected PS 120 cells with pNHE-oc/V5-6×. Transfectected as well as control untransfected PS120 cells were then permeabilized for 10 min in‘intracellular-like’ buffer containing 10mM NaCl (see METHODS) and loaded with the pH-sensitive dye BCECF, whose fluorescent excitation ratio (450/490 nm) is pH-dependent. To test for CPA activity, mitochondrial fluorescence was monitored after abrupt removal of Na+, in the presence and absence of HMA and EIPA, two wide range NHE inhibitors 23. Na+ removal from the medium induced an immediate increase in mitochondrial H+ in pNHE-oc/V5-6× His-transfected cells, which was visualized as a change in the fluorescence at 488 nm (Compare 6C and 6D). This change was markedly attenuated in the presence of a mixture of NHE inhibitors (Compare 6E and 6F). This result indicates that NHA-oc/NHA2 has Sodium/Proton Antiport activity.
NHA-oc/NHA2 mediates matrix swelling in isolated mitochondria
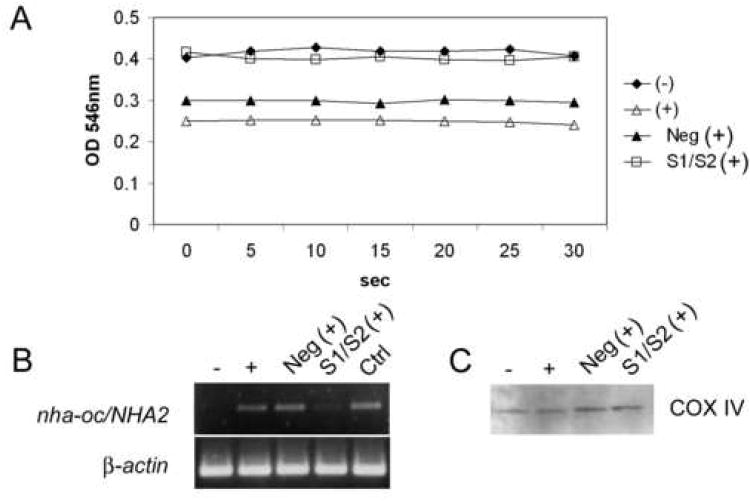
Mitochondrial NHEs have been reported to mediate Na+ acetate-induced increases in matrix volume, also referred to as “passive swelling” 22. To test whether NHA-oc/NHA2 has a similar activity, RAW 264 cells were stimulated with RANKL and transfected with a mixture of two nha-oc/NHA2-specific siRNA molecules. Control cells were transfected with a negative control siRNA molecule. Isolated mitochondria were then resuspended in a Na+ containing “swelling buffer”. Passive swelling, induced by Na+ acetate, can be visualized spectrophotometrically as a decrease in 546nm absorbance. The results (Figure 7A) show that mitochondria from undifferentiated cells show an OD546 nm higher than that of differentiated cells (lanes − and +). Mitochondria from differentiated cells transfected with the siRNA mixture (lane S1/S2 (+)) behave like those from undifferentiated cells, indicating that mitochondrial swelling is dependent on NHA-oc/NHA2 expression. Image Quant densitometric analysis of a typical siRNA experiment shows that the knock-down efficiency of the siRNA mixture under the conditions described was consistently greater than 90% (Figure 7B). Western Blot analysis of the mitochondrial fractions using the mitochondrial-specific anti-COX IV antibody (Figure 7C), show specificity and equal loading.
Figure 7.
NHA-oc/NHA2 mediates Na+- induced mitochondrial swelling.
(A) RAW 264.7 cells were transfected with a mix of nha-oc/NHA2-specific siRNA molecules and stimulated with RANKL. 4 days later mitochondria were isolated and resuspended in Na+-swelling buffer. For this experiments we used equivalent amounts of mitochondria (100μg protein). OD546 was recorded every 5 sec for 30 sec. A drop in OD546 indicates swelling of the mitochondrial matrix. (-) unstimulated cell; (+) RANKL stimulated; (Neg) RANKL stimulated, treated with a control siRNA; (S1/S2) RANKL stimulated, treated with a specific siRNA mix.
(B) RNA from RAW264.7 cells, was analyzed by RT-PCR using nha-oc/NHA2-specific (top) or p-actin (bottom) primers. (-) un-stimulated cells; (+) RANKL stimulated; (Neg) RANKL stimulated, treated with a control siRNA; (S1/S2) RANKL stimulated, treated with a specific siRNA mix. Densitometric analysis of the gel shows that S1/S2 treatment results in a reduction of >90% in the nha-oc/NHA2 amplification product.
(C) As a loading control, 10 μl of each mitochondrial fraction were analyzed by Western Blot analysis using a mitochondrial-specific COX IV antibody. A single 18KDa band of equal intensity can be seen in all lanes.
NHA-oc/NHA2 is required for osteoclast differentiation and function
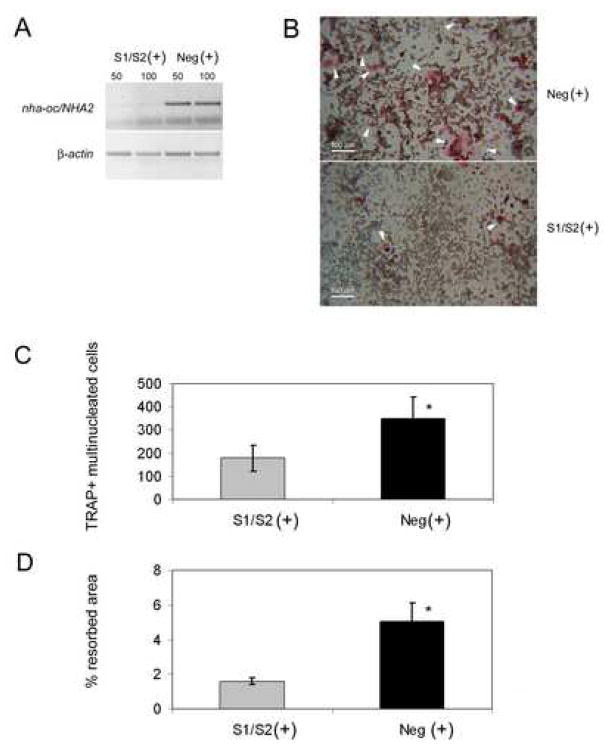
Since NHA-oc/NHA2 is primarily expressed in osteoclasts following RANKL stimulation, we hypothesized that NHA-oc/NHA2 activity may be required for osteoclast differentiation and/or function. To test this proposition, we transfected RAW 264.7 with a mixture of nha-oc/NHA2-specific siRNAs, and stimulated the cells with RANKL for four days. Control cells were transfected with equivalent amounts of negative control siRNA. RT-PCR analysis revealed that siRNA treatment reduced nha-oc/NHA2 message by ∼90% (determined by Image Quant analysis) (Figure 8A) and resulted in a ∼60% inhibition of osteoclast differentiation and resorption activity (Figure 8B, 8C and 8D). nha-oc/NHA2 silencing results inhibits the formation of multinucleated TRAP-positive cells.
Figure 8.
nha-oc/NHA2oc silencing inhibits osteoclast differentiation and activity.
(A) RANKL-stimulated RAW 264.7 cells were transfected with nha-oc/NHA2-specific (S1/S2 (+)) or control (Neg (+)) siRNA. We first tested two siRNA concentrations: 50 nM (lanes 50) or 100 nM (lane 100) and chose the former for further experiments. Total RNA was isolated and subjected to RT-PCR analysis using nha-oc/NHA2- (top) or β-actin (bottom)- specific primers. Image analysis shows that the knock-down efficiency is over 90%.
(B) (C) RANKL-stimulated RAW 264.7 cells were transfected with nha-oc/NHA2-specific (S1/S2 +) or control (Neg +) small inhibiting RNA (siRNA). After 4 days cells were fixed and stained for TRAP. The formation of multinucleated TRAP+ cells (white arrow-heads) is significantly reduced in nha-oc/NHA2-siRNA treated cultures (bottom panel) * p < 0.05
(D) nha-oc/NHA2-silencing inhibits the ability of differentiated RAW 264.7 cells to form resorption pits on a calcium phosphate matrix * p < 0.05.
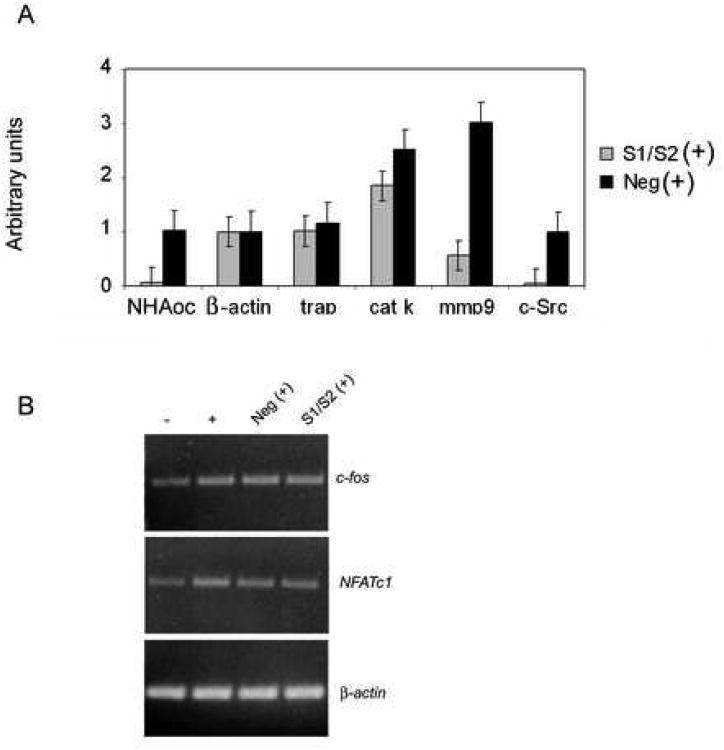
RT-PCR analysis also revealed that, while expression of early markers of osteoclast differentiation cathepsin K and tartrate resistant acid phosphatase –(TRAP)-was only marginally affected, expression of late markers (mmp-9 and c-src) were reduced by more than 90% (Figure 9A), suggesting a role for NHA-oc/NHA2 in later stages of osteoclast maturation. This hypothesis is further supported by the fact that expression of transcription factors c-Fos and NFATc1 was not affected by nha-oc/NHA2 silencing (Figure 9B).
Figure 9.
nha-oc/NHA2 silencing blocks terminal osteoclast differentiation.
(A) nha-oc/NHA2 silencing inhibits expression of the osteoclast-specific genes nha-oc/NHA2, trap, cathepsin K, mmp-9 and c-src. Expression of β-actin is not affected. nha-oc/NHA2silencing also inhibits osteoclast resorption (bottom panel). Experiments were done in triplicates. * p < 0.05.
(C) Expression of c-Fos and NFATc1, like that of TRAP, is not affected by nha-oc/NHA2 silencing, which strengthen the notion that NHA-oc/NHA2 activity is required for terminal osteoclast differentiation.
NHA-oc/NHA2 overexpression inhibits caspase activation in RAW264.7
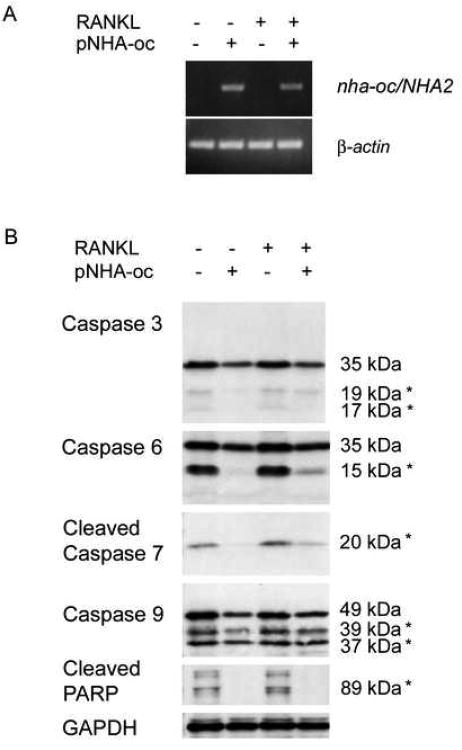
Silencing of nha-oc/NHA2 resulted in decreased numbers of differentiated osteoclasts. Such outcome could also be the result of increased osteoclast apoptosis. At the onset of apoptosis, initiator caspases (-8, -9, -10, -12) get activated by protelytic cleavage. Activated caspases then cleave and activate downstream caspases (including -3, -6 and -7), which in turn can cleave proteins like PARP and induce apoptosis 26. Because NHA-oc/NHA2 is expressed in the mitochondria we hypothesized that its activity could affect caspase activation and therefore control osteoclast apoptosis. We tested this hypothesis by transfecting RAW264.7 monocytes with NHA-oc/NHA2 expression vector, followed by overnight RANKL stimulation. RT-PCR analysis of RAN from transfected and mock-transfected cells shows that nha-oc/NHA2 is expressed only in transfected cells (Figure 10A). nha-oc/NHA2 expression partially protects cells from caspase-9 activation. More remarkable is the inhibition of cleavage of caspases-3, -6, -7, and PARP, in NHA-oc/NHA2 expressing cells (Figure 10B) suggesting that expression of nha-oc/NHA2 prevents cells from undergoing apoptosis.
Figure 10.
nha-oc/NHA2 overexpression prevents caspase activation in RAW 264.7 cells.
RAW 264.7 cells were transfected with pNHA-oc/V5-6X His. 48 hours later cells were stimulated with RANKL overnight (RANKL +, pNHA-oc +). Control cultures were unstimulated (RANKL -, pNHA-oc +). In parallel, cell were mock transfected and either RANKL-stimulated (RANKL +, pNHA-oc -) or not (RANKL -, pNHA-oc -). Three days after the transfection, protein and RNA was prepared and analyzed.
(A) RT-PCR analysis of transfected and mock transfected cells show nha-oc/NHA2 expression only in transfected cells.
(B) Protein extracts were subjected to Western Blot analysis using caspase-specific antibodies. Caspase activation is inhibited in cells expressing nha-oc/NHA2, regardless RANKL stimulation. An asterisk next to the molecular weight indicates that those bands represent the cleaved (not full length) caspase. The antibodies can detect both the full length and the cleaved products (with the exception of those against cleaved caspase 7 and PARP, that only detect the cleaved products)
Discussion
The existence of mitochondrial Na+/H+ antiporters was first proposed in 1961 by Mitchell 27 who noted that, in the context of the chemiosmotic theory of energy coupling, the high electric potential generated in the mitochondrial membrane could cause cations to leak in through the cell membrane. Mitchell then postulated that the coupling membrane must contain diffusion systems to mediate the exchange of cations for H+ ions. This exchange would balance the ion leak 28 therefore preventing swelling and lysis. These studies were carried out in mitochondria and resulted in the discovery of the first known Na+/H+ antiporters 29. Later, mitochondria were shown to contain two distinct Na+/H+ antiporters that were distinguished by their cation selectivity, inhibitor sensitivity, and regulation 30. Using detergents to extract proteins from beef heart mitochondria, the same authors partially purified a protein fraction with a major band of 59 kDa containing Na+/H+ antiport activity 31, although no sequence information was generated.
We identified a gene, nha-oc/NHA2 during the course of a genome-wide screening, performed to identify genes induced as a result of RANKL stimulation of osteoclast precursors in vitro and in vivo. nha-oc/NHA2 is the mouse orthologue of HsNHA2, a human gene previously identified but not characterized. Orthologues of nha-oc/NHA2 are found in all metazoans studied, from C. elegans to man. They define a newly recognized subfamily of metazoan proteins, within the CPA2 family of antiporters 4. Members of this family share a conserved N-terminus (∼500 amino acids) composed of 10 transmembrane segments, and a short C-terminal tail (∼50-100 amino acids), which appears to be a feature of this subfamily. In fact, all known metazoan NHEs described thus far possess a large (∼130 to ∼450 aa) C-terminus that contain several phosphorylation sites as well as binding sites for regulatory factors, suggesting a regulatory function 6.
In their very extensive review 4 the authors examine the phylogenetic relationship among all the genes, found in databases, presumed to be NHEs. They identified two human novel CPA2 antiporters: HsNHA1 and HsNHA2 whose tissue distribution and functional roles was unknown. Both genes map next to each other in human chromosome 4q24 and are 59% identical at the amino-acid level. HsNHA1 was later cloned, named NHEDC1 (Na+/H+ exchanger like domain containing 1) and shown to be expressed in testis 32.
We now report the cloning and characterization of the mouse orthologue of HsNHA2: nha-oc/NHA2, whose expression is restricted to differentiated osteoclasts in vitro and in vivo. This raises the intriguing perspective that the expression of this novel eukaryotic CPA2 family is tissue-specific. In addition, although the mitochondrial Na+/H+ antiporter was the first one to be discovered 29, its molecular identity remained unknown. Our studies show that NHA-oc/NHA2 localizes to the mitochondria where it mediates Na+ acetate-induced increase in mitochondrial volume and Na+-induced change in mitochondrial pH. Therefore NHA-oc/NHA2 is the first mitochondrial CPA cloned to date.
Mitochondria contain between 1000 and 2000 proteins. With very few exceptions (13 in humans) these proteins are nuclear encoded and synthesized in the cytoplasm. Therefore, they need to be later imported into the mitochondria 33 a step mediated by a mitochondrial signal sequence. These sequences are typically N-terminal extensions of some 15–40 amino acids, rich in basic and hydroxylated amino acids. Approximately 30 % of mitochondrial-targeted proteins however, do not contain a typical mitochondrial-targeting signal. Such proteins include the many multiple membrane-spanning metabolite transporters of the inner membrane, such as NHA-oc/NHA2, which does not contain a typical mitochondrial localization signal.
The primary function of the mitochondrion is to supply ATP to the cell. ATP synthesis depends on the existence of a proton gradient across the inner membrane. For that reason, the permeability of this membrane must be tightly controlled. Protons in osteoclasts must be produced in large amounts, transported efficiently, and charge-balanced. Mutations in the genes that control proton generation (carbonic anhydrase II), transport to the resorption lacuna (vATPase subunit) or electro-neutrality (chloride channel) are all known to cause malignant osteopetrosis in humans 34. In summary, control of electron transport in the osteoclastic mitochondria is absolutely essential. It is then not surprising that osteoclasts would require a specific molecule to regulate proton concentration in their very abundant and active mitochondria.
The mechanisms underlying the survival of mature osteoclasts are not fully understood. However, Oursler et al. have shown a role for the mitochondria dependent apoptotic pathway in osteoclasts 35.
The caspase-cascade signaling system is essential in the initiation and execution of apoptosis (reviewed by Fan et al.) 26. Caspases can be activated either through the death receptor-mediated or the stress-induced, mitochondrion-mediated and caspase-9-dependent pathway. When cellular stress (e.g. DNA damage) occurs, pro-apoptotic proteins in the cytosol (for instance procaspase-9) are activated. Activated caspase-9 can in turn activate executioners caspase-3 and caspase-7. The release of cytochrome c from mitochondria is essential in the activation of caspases and the resulting apoptosis 36. Once released, cytosolic cytochrome c interacts with apoptotic protease-activating factor-1 (Apaf-1) in the presence of ATP, stimulating the processing of procaspase- 9 to its active form. Another apoptosis regulatory protein is the mitochondrial protein Smac/Diablo. Upon mitochondrial stress, Smac/Diablo is released from mitochondria and competes with caspases for binding of IAPs (inhibitor of apoptosis proteins). The interaction of Smac/Diablo with IAPs relieves the inhibitory effect of the IAPs on caspases 37.
Our results show that NHA-oc/NHA2 inhibits caspase activation cascade in RAW 264.7 cells and suggest a role in mitochondria-dependent apoptosis in mature osteoclasts. We are currently conducting studies to determine whether expression of NHA-oc.NHA2 has an effect on the release of both cytochrome c and Smac/Diablo from the mitochondria into the cytoplasm.
Skeletal homeostasis during normal bone remodeling requires balance between the number of mature osteoclasts and osteoblasts. Such balance is determined by the ratio between cell proliferation, differentiation and apoptosis. The number of osteoclasts in vivo can decline as the result of apoptosis 38. Our results show that NHA-oc/NHA2 activity is required for osteoclast differentiation, resorptive activity and survival in vitro. Thus, proton exchange by NHA-oc/NHA2 represents a novel mechanism to control osteoclast numbers and ultimately the rate of bone remodeling.
Figure 6.
NHA-oc/NHA2 mediates Na+- induced mitochondrial pH change. PS120 cells were transfected with pNHA-oc/V5-6× His. 48 hours later cells were permeabilized and incubated for 10 min with BCECF in the presence of 50mM Na+ after which Na+ was abruptly removed. Cells were excited at 458 nm (A, C, E) and 488 nm (B, D, F) and confocal microscope images were recorded. Removing Na+ induces a pH change that can be observed as a brighter image at 488 nm (D). That change is greatly reduced in the presence of 20 μM EIPA and 20μM HMA (C). Mock-transfected cells show no change in mitochondrial pH after Na+ removal (A and B).
Acknowledgments
Contract grant sponsor: NIH/NICDR, Contract grant number: DE007378-18
Footnotes
Publisher's Disclaimer: This is a PDF file of an unedited manuscript that has been accepted for publication. As a service to our customers we are providing this early version of the manuscript. The manuscript will undergo copyediting, typesetting, and review of the resulting proof before it is published in its final citable form. Please note that during the production process errors may be discovered which could affect the content, and all legal disclaimers that apply to the journal pertain.
Bibliography
- 1.Burckhardt G, Di Sole F, Helmle-Kolb C. The Na+/H+ exchanger gene family. J Nephrol. 2002;15(5):S3–21. [PubMed] [Google Scholar]
- 2.Demaurex N, Grinstein S. Na+/H+ antiport: modulation by ATP and role in cell volume regulation. J Exp Biol. 1994;196:389–404. doi: 10.1242/jeb.196.1.389. [DOI] [PubMed] [Google Scholar]
- 3.Ritter M, Fuerst J, Woll E, et al. Na(+)/H(+)exchangers: linking osmotic dysequilibrium to modified cell function. Cell Physiol Biochem. 2001;11:1–18. doi: 10.1159/000047787. [DOI] [PubMed] [Google Scholar]
- 4.Brett CL, Donowitz M, Rao R. Evolutionary origins of eukaryotic sodium/proton exchangers. Am J Physiol Cell Physiol. 2005;288:C223–C239. doi: 10.1152/ajpcell.00360.2004. [DOI] [PubMed] [Google Scholar]
- 5.Chang AB, Lin R, Keith SW, Tran CV, Saier MH., Jr Phylogeny as a guide to structure and function of membrane transport proteins. Mol Membr Biol. 2004;21:171–181. doi: 10.1080/09687680410001720830. [DOI] [PubMed] [Google Scholar]
- 6.Orlowski J, Grinstein S. Diversity of the mammalian sodium/proton exchanger SLC9 gene family. Pflugers Arch. 2004;447:549–565. doi: 10.1007/s00424-003-1110-3. [DOI] [PubMed] [Google Scholar]
- 7.Grinstein S, Rotin D, Mason MJ. Na+/H+ exchange and growth factor-induced cytosolic pH changes. Role in cellular proliferation. Biochim Biophys Acta. 1989;988:73–97. doi: 10.1016/0304-4157(89)90004-x. [DOI] [PubMed] [Google Scholar]
- 8.Mahnensmith RL, Aronson PS. The plasma membrane sodium-hydrogen exchanger and its role in physiological and pathophysiological processes. Circ Res. 1985;56:773–788. doi: 10.1161/01.res.56.6.773. [DOI] [PubMed] [Google Scholar]
- 9.Karmazyn M. The myocardial sodium-hydrogen exchanger (NHE) and its role in mediating ischemic and reperfusion injury. Keio J Med. 1998;47:65–72. doi: 10.2302/kjm.47.65. [DOI] [PubMed] [Google Scholar]
- 10.Sun HY, Wang NP, Halkos ME, et al. Involvement of Na+/H+ exchanger in hypoxia/re-oxygenation-induced neonatal rat cardiomyocyte apoptosis. Eur J Pharmacol. 2004;486:121–131. doi: 10.1016/j.ejphar.2003.12.016. [DOI] [PubMed] [Google Scholar]
- 11.Wu KL, Khan S, Lakhe-Reddy S, et al. The NHE1 Na+/H+ exchanger recruits ezrin/radixin/moesin proteins to regulate Akt-dependent cell survival. J Biol Chem. 2004;279:26280–26286. doi: 10.1074/jbc.M400814200. [DOI] [PubMed] [Google Scholar]
- 12.Numata M, Petrecca K, Lake N, Orlowski J. Identification of a mitochondrial Na+/H+ exchanger. J Biol Chem. 1998;273:6951–6959. doi: 10.1074/jbc.273.12.6951. [DOI] [PubMed] [Google Scholar]
- 13.Brett CL, Wei Y, Donowitz M, Rao R. Human Na(+)/H(+) exchanger isoform 6 is found in recycling endosomes of cells, not in mitochondria. Am J Physiol Cell Physiol. 2002;282:C1031–C1041. doi: 10.1152/ajpcell.00420.2001. [DOI] [PubMed] [Google Scholar]
- 14.Sardet C, Franchi A, Pouyssegur J. Molecular cloning, primary structure, and expression of the human growth factor-activatable Na+/H+ antiporter. Cell. 1989;56:271–280. doi: 10.1016/0092-8674(89)90901-x. [DOI] [PubMed] [Google Scholar]
- 15.Yang M, Mailhot G, MacKay CA, et al. Chemokine and chemokine receptor expression during colony stimulating factor-1-induced osteoclast differentiation in the toothless osteopetrotic rat: a key role for CCL9 (MIP-1gamma) in osteoclastogenesis in vivo and in vitro. Blood. 2006;107:2262–2270. doi: 10.1182/blood-2005-08-3365. [DOI] [PMC free article] [PubMed] [Google Scholar]
- 16.Krogh A, Larsson B, von Heijne G, Sonnhammer EL. Predicting transmembrane protein topology with a hidden Markov model: application to complete genomes. J Mol Biol. 2001;305:567–580. doi: 10.1006/jmbi.2000.4315. [DOI] [PubMed] [Google Scholar]
- 17.Sonnhammer EL, von Heijne G, Krogh A. A hidden Markov model for predicting transmembrane helices in protein sequences. Proc Int Conf Intell Syst Mol Biol. 1998;6:175–182. [PubMed] [Google Scholar]
- 18.von Heijne G. Membrane protein structure prediction. Hydrophobicity analysis and the positive-inside rule. J Mol Biol. 1992;225:487–494. doi: 10.1016/0022-2836(92)90934-c. [DOI] [PubMed] [Google Scholar]
- 19.Pilpel Y, Ben Tal N, Lancet D. kPROT: a knowledge-based scale for the propensity of residue orientation in transmembrane segments. Application to membrane protein structure prediction. J Mol Biol. 1999;294:921–935. doi: 10.1006/jmbi.1999.3257. [DOI] [PubMed] [Google Scholar]
- 20.Juretic D, Zoranic L, Zucic D. Basic charge clusters and predictions of membrane protein topology. J Chem Inf Comput Sci. 2002;42:620–632. doi: 10.1021/ci010263s. [DOI] [PubMed] [Google Scholar]
- 21.Spyropoulos IC, Liakopoulos TD, Bagos PG, Hamodrakas SJ. TMRPres2D: high quality visual representation of transmembrane protein models. Bioinformatics. 2004;20:3258–3260. doi: 10.1093/bioinformatics/bth358. [DOI] [PubMed] [Google Scholar]
- 22.Ruiz-Meana M, Garcia-Dorado D, Pina P, et al. Cariporide preserves mitochondrial proton gradient and delays ATP depletion in cardiomyocytes during ischemic conditions. Am J Physiol Heart Circ Physiol. 2003;285:H999–1006. doi: 10.1152/ajpheart.00035.2003. [DOI] [PubMed] [Google Scholar]
- 23.Masereel B, Pochet L, Laeckmann D. An overview of inhibitors of Na(+)/H(+) exchanger. Eur J Med Chem. 2003;38:547–554. doi: 10.1016/s0223-5234(03)00100-4. [DOI] [PubMed] [Google Scholar]
- 24.Battaglino R, Kim D, Fu J, et al. c-myc is required for osteoclast differentiation. J Bone Miner Res. 2002;17:763–773. doi: 10.1359/jbmr.2002.17.5.763. [DOI] [PubMed] [Google Scholar]
- 25.Okamatsu Y, Kim D, Battaglino R, et al. MIP-1 gamma promotes receptor-activator-of-NF-kappa-B-ligand-induced osteoclast formation and survival. J Immunol. 2004;173:2084–2090. doi: 10.4049/jimmunol.173.3.2084. [DOI] [PubMed] [Google Scholar]
- 26.Fan TJ, Han LH, Cong RS, Liang J. Caspase family proteases and apoptosis. Acta Biochim Biophys Sin (Shanghai) 2005;37:719–727. doi: 10.1111/j.1745-7270.2005.00108.x. [DOI] [PubMed] [Google Scholar]
- 27.Mitchell P. Coupling of phosphorylation to electron and hydrogen transfer by a chemi-osmotic type of mechanism. Nature. 1961;191:144–148. doi: 10.1038/191144a0. [DOI] [PubMed] [Google Scholar]
- 28.Mitchell P. Chemiosmotic coupling in oxidative and photosynthetic phosphorylation. Biol Rev Camb Philos Soc. 1966;41:445–502. doi: 10.1111/j.1469-185x.1966.tb01501.x. [DOI] [PubMed] [Google Scholar]
- 29.Mitchell P, Moyle J. Respiration-driven proton translocation in rat liver mitochondria. Biochem J. 1967;105:1147–1162. doi: 10.1042/bj1051147. [DOI] [PMC free article] [PubMed] [Google Scholar]
- 30.Nakashima RA, Garlid KD. Quinine inhibition of Na+ and K+ transport provides evidence for two cation/H+ exchangers in rat liver mitochondria. J Biol Chem. 1982;257:9252–9254. [PubMed] [Google Scholar]
- 31.Garlid KD, Shariat-Madar Z, Nath S, Jezek P. Reconstitution and partial purification of the Na(+)-selective Na+/H+ antiporter of beef heart mitochondria. J Biol Chem. 1991;266:6518–6523. [PubMed] [Google Scholar]
- 32.Ye G, Chen C, Han D, et al. Cloning of a novel human NHEDC1 (Na+/H+ exchanger like domain containing 1) gene expressed specifically in testis. Mol Biol Rep. 2006;33:175–180. doi: 10.1007/s11033-006-0010-y. [DOI] [PubMed] [Google Scholar]
- 33.Stojanovski D, Johnston AJ, Streimann I, Hoogenraad NJ, Ryan MT. Import of nuclear-encoded proteins into mitochondria. Exp Physiol. 2003;88:57–64. doi: 10.1113/eph8802501. [DOI] [PubMed] [Google Scholar]
- 34.Blair HC, Athanasou NA. Recent advances in osteoclast biology and pathological bone resorption. Histol Histopathol. 2004;19:189–199. doi: 10.14670/HH-19.189. [DOI] [PubMed] [Google Scholar]
- 35.Oursler MJ, Bradley EW, Elfering SL, Giulivi C. Native, not nitrated, cytochrome c and mitochondria-derived hydrogen peroxide drive osteoclast apoptosis. Am J Physiol Cell Physiol. 2005;288:C156–C168. doi: 10.1152/ajpcell.00092.2004. [DOI] [PubMed] [Google Scholar]
- 36.Kroemer G, Reed JC. Mitochondrial control of cell death. Nat Med. 2000;6:513–519. doi: 10.1038/74994. [DOI] [PubMed] [Google Scholar]
- 37.Anguiano-Hernandez YM, Chartier A, Huerta S. Smac/DIABLO and colon cancer. Anticancer Agents Med Chem. 2007;7:467–473. doi: 10.2174/187152007781058631. [DOI] [PubMed] [Google Scholar]
- 38.Roodman GD. Cell biology of the osteoclast. Exp Hematol. 1999;27:1229–1241. doi: 10.1016/s0301-472x(99)00061-2. [DOI] [PubMed] [Google Scholar]


