

Abstract
Cyclins E1 drives the initiation of DNA replication, and deregulation of its periodic expression leads to mitotic delay associated with genomic instability. Since it is not known whether the closely related protein cyclin E2 shares these properties, we overexpressed cyclin E2 in breast cancer cells. This did not affect the duration of mitosis, nor did it cause an increase in p107 association with CDK2. In contrast, cyclin E1 overexpression led to inhibition of the APC complex, prolonged metaphase and increased p107 association with CDK2. Despite these different effects on the cell cycle, elevated levels of either cyclin E1 or E2 led to hallmarks of genomic instability, i.e., an increased proportion of abnormal mitoses, micronuclei and chromosomal aberrations. Cyclin E2 induction of genomic instability by a mechanism distinct from cyclin E1 indicates that these two proteins have unique functions in a cancer setting.
Keywords: cyclin E2, genomic instability, mitosis, p107, cyclin E1
Introduction
Cyclin E1 and E2, collectively referred to as cyclin E, drive the transition from G1 to S phase through the binding and activation of CDK2, which phosphorylates the Rb protein and other targets necessary for initiation of DNA replication.1 The G1 to S phase expression of cyclin E and activity of cyclin E-CDK2 are regulated through a combination of transcriptional control, binding of endogenous CDK inhibitors, phosphorylation and degradation.1
Cyclin E1 is an important oncogene in many cancers, and is also a downstream target of other oncogenic pathways, so that aberrant expression of cyclin E1 can occur as a result of activated growth signaling pathways, failed degradation or, less commonly, amplification of the CCNE1 gene.1 The failure to periodically downregulate cyclin E1 during S phase is associated with hyperphosphorylation of Rb throughout the entire cell cycle, promoting uncontrolled proliferation.2 Overexpression of cyclin E1, particularly the hyperstable T380A point mutant, promotes murine neoplasia.3-5 As well as stimulating progression from G1 into S phase, aberrant expression of cyclin E1 or its low molecular weight isoforms inhibits progression through mitosis.6 The mitotic delay is due to cyclin E1-Cdh1 binding, which results in inhibition of the APC complex.7 Ultimately, deregulation of cyclin E1 results in disrupted DNA replication, centrosomal aberrations, chromosome instability and an increased incidence of chromosome breaks and translocations.5,8-10 Deletion or mutation of the F-box protein Fbw7, part of the Skp1-Cul1-Rbx1 ubiquitin ligase complex (SCFFbw7) that targets cyclin E for proteosomal degradation,11,12 is also highly correlated with chromosome instability.13
Although cyclins E1 and E2 are often coordinately regulated, share strong sequence similarity in functional important regions, including the cyclin box and centrosomal localization sequence,14 and appear to be functionally redundant during murine development,1,15-19 there is accumulating evidence that, like many cyclins, they have distinct roles under some circumstances.20 For example, during liver regeneration, cyclin E1 promotes endoreduplication, while cyclin E2 suppresses it.21 In addition, cyclin E2 overexpression, but not cyclin E1 overexpression, is associated with shorter survival in some breast cancer subgroups and vice versa.20,22 Several studies have shown that overexpression of cyclin E1 affects mitotic progression and promotes genomic instability7,9,10,23,24 but cyclin E2 has not been studied in this context. Given the strong role for mitotic disregulation and genome instability in human cancer, we characterized the effects of cyclin E2 on these endpoints in estrogen receptor-positive breast cancer cells, a subtype that overexpresses cyclin E2 more strongly than cyclin E1.22 Intriguingly, we found that while cyclin E2 overexpression did not affect mitotic progression, the protein still induced genomic instability via mechanisms that are distinct from cyclin E1-induced genomic instability.
Results
Cyclin E2 does not impair progress through metaphase, unlike cyclin E1
In order to compare the consequences of cyclin E1 and E2 deregulation, these cyclins were individually overexpressed as V5-fusion proteins in T-47D breast cancer cells using the pMSCV vector, which allowed GFP co-expression using an IRES sequence.25 Overexpressed cyclin E1 was detectable as both the full-length form and low molecular weight forms,26 but after cyclin E2 overexpression, lower molecular weight isoforms were not observed using a polyclonal antibody directed at the C terminus. Subpopulations with similar levels of cyclin overexpression were selected on the basis of equivalent levels of the V5 tag and GFP (cyclin E1–2 and cyclin E2–4; Fig. 1A). These cell lines were synchronized at the G1/S phase boundary with hydroxyurea (HU) in order to assess the effect of cyclin E overexpression on progression through S phase and mitosis. Figure 1B illustrates progress through the cell cycle of cells labeled with BrdU at the time of release from HU arrest. In all three cell lines, the synchronized cells reached G2/M at 9–12 h, as indicated by an increase in the proportion of cells with a 4N DNA content, and many completed mitosis and re-entered G1 phase between 12–27 h. Although overexpression of either cyclin E1 or cyclin E2 did not prevent the completion of DNA synthesis and mitosis, progression through early S phase was slightly delayed (dashed line, 3 h timepoint, Fig. 1B), consistent with previous studies showing that cyclin E1 overexpression prolongs S phase.27,28 The number of cells progressing through S phase was increased to a similar degree in the cyclin E1- and cyclin E2-overexpressing cells, as was the G2/M fraction (Fig. 1C and D) indicating that the levels of cyclin E1 and cyclin E2 expressed in these cell lines had functionally equivalent effects on these endpoints.

Figure 1. Effect of overexpression of cyclin E1 or E2 on cell cycle progression. V5-tagged cyclin E1 and cyclin E2 were retrovirally overexpressed in T-47D cells and GFP-positive cells selected by FACS. (A) Cells were sorted into subpopulations with graded levels of GFP expression, and immunoprobed for cyclins E1 and E2, GFP, V5 and β-actin. Subpopulations with similar increases in full-length cyclin E1 and E2 protein relative to endogenous levels are indicated. E1-V5, E2-V5: V5 tagged cyclin E1 or E2, respectively. LMW, low molecular weight form of cyclin E1. (B) Cells were synchronized at G1/S with HU for 40 h, released into the cell cycle by removal of HU and collected at 0, 3, 9, 12, 15, 27 and 30 h post-release. DNA histograms of PI-stained, BrdU-positive cells are shown, and are representative of quadruplicate experiments. (C) S phase entry in HU-synchronized cells was calculated by quantitating BrdU incorporation at the 3 h timepoint using flow cytometry. Data have been pooled from triplicate experiments: error bars represent S.E.M. (D) The G2/M fraction of HU-synchronized cells was quantitated by flow cytometry of PI-stained cells and is presented relative to empty vector cells 9 h after HU release. Data have been pooled from triplicate experiments, and error bars represent S.E.M. Statistical analysis was performed using two-tailed t-tests, * = p < 0.05; NS = not significant.
To more closely examine the effects of cyclin E overexpression on progression through mitosis, we measured the proportion of 4N cells displaying phosphorylation of histone H3 Ser10, a marker of chromosome condensation. This was at low levels up to 3 h after release but subsequently increased by at least 3-fold at 12 h (Fig. 2A). In control and cyclin E1-overexpressing cells, the timing and magnitude of changes in pSer10-H3 were similar. However, in cyclin E2-overexpressing cells the level of pSer10-H3 staining was consistently ~30% lower than in either of the other cell lines (Fig. 2A) suggesting an impairment of chromosome condensation. Consistent with this interpretation, at the 6 h timepoint many cyclin E2-overexpressing cells did not have tightly condensed chromosomes, in contrast with vector control or cyclin E1-overexpressing cells (Fig. 2B).

Figure 2. Effect of overexpression of cyclin E1 or E2 on transit through G2/M. T-47D cells overexpressing cyclin E1, cyclin E2 or empty vector control were synchronized with HU. (A) Fixed cells were immunostained with α-phospho histone H3 (Ser10) and counterstained with PI at the indicated timepoints. The fraction of cells staining positive for pSer10-H3 was quantitated as a percentage of G2/M cells, determined by flow cytometry. The mean and range of duplicate experiments are shown. (B) Cells fixed 6 h after release from HU arrest were stained with DAPI and imaged on a confocal microscope. (C) Cells were released into the cell cycle for 9 h, fixed and stained with Lamin A/C (red) and nuclear counterstain DAPI (blue), then imaged on a confocal microscope. Serial Z stacks were taken of each imaged cell to confirm diffuse or membrane localization of Lamin A/C throughout the nucleus. (D) Mitotic exit was quantitated using time-lapse microscopy on HU-synchronized cells.
We next examined the localization of the nuclear envelope component Lamin A/C, which becomes dispersed throughout the cell upon nuclear envelope breakdown at prometaphase and remains dispersed during mitosis. At 9 h following release from HU arrest both empty vector and cyclin E1-overexpressing cells generally showed a redistribution of Lamin A/C (Fig. 2C). Empty vector cells had usually reached anaphase, whereas cyclin E1-overexpressing cells were often still in metaphase. However, cyclin E2-overexpressing cells typically retained intact nuclear envelopes, as marked by the distinct membranous localization of Lamin A/C (Fig. 2C).
Time-lapse phase microscopy was used to measure the time of exit from mitosis. Control cells underwent observable anaphase and cytokinesis at a median time of 13.9 h post-HU release, so that 86.4% of the population had undergone mitosis by 17.5 h (Fig. 2C). By contrast, completion of mitosis was significantly delayed in both the cyclin E1- (median 16 h, p < 0.01) and cyclin E2-overexpressing (median 16.3 h, p < 0.001) cells, and > 36% of each population had still not undergone mitosis by 17.5 h after release into the cell cycle (Fig. 2C).
Although all the cyclin E2-overexpressing cells eventually completed mitosis, pSer10-H3 staining, chromosome condensation, nuclear envelope breakdown and exit from mitosis all appeared to be impaired or delayed compared with empty vector control cells. This suggested that mitosis occurred later in the cyclin E2-overexpressing cells, but its duration was not markedly affected. In contrast, pSer10-H3 staining, chromosome condensation and nuclear envelope breakdown were similar in the cyclin E1-overexpressing and empty vector cells, suggesting that they entered mitosis at a similar time. However, mitotic exit was delayed in the cyclin E1-overexpressing cells, which remained in metaphase when the control cells had reached anaphase, consistent with the previous observation of a prolonged metaphase delay in cells overexpressing full-length cyclin E1.7,23
Cyclin E2 does not inhibit the APC complex or lead to increased binding of p107 to CDK2 complexes
To further explore the apparent differences between the effects of cyclins E1 and E2, molecular events involved in G2 and mitosis were examined during entry into mitosis (9 h) and at timepoints when all cell lines had completed mitosis (24 h, 30 h, see Fig. 2D). The metaphase delay following cyclin E1 overexpression occurs via stabilization of the Cdh1 protein leading to inhibition of the APC complex and stabilization of APC targets.7 We confirmed that Cdh1 protein levels are increased in cyclin E1-overexpressing cells (Fig. 3A and B). In contrast, Cdh1 levels in the cyclin E2-overexpressing cells were similar to the control cells (Fig. 3A and B). The APC target proteins cyclin B1, securin and Cdc20 were rapidly degraded in the control and cyclin E2-overexpressing cell lines, with levels declining exponentially from a peak in expression at 9 h (Fig. 3A and C). This again contrasted with a noticeable stabilization of these proteins in the cyclin E1-overexpressing cell line (Fig. 3A and C). In addition, cyclin E1 co-immunoprecipitated Cdh1, but cyclin E2 failed to co-immunoprecipitate Cdh1 at detectable levels, although the two cyclins co-immunoprecipitated similar levels of CDK2 (Fig. 3D). Overall, these data suggest that unlike cyclin E1, cyclin E2 does not interact with Cdh1 or inhibit the APC complex.

Figure 3. Overexpression of cyclin E1, but not cyclin E2, alters APC activity. HU-synchronized cells were released into the cell cycle for 0, 9, 24 and 30 h. Data are representative of, or pooled from, quadruplicate experiments. Error bars where shown represent S.E.M. (A) Cell lysates were immunoblotted for cyclins E1 and E2, Cdh1, securin, Cdc20 and β-actin. (B) Densitometry was performed on Cdh1 immunoblots and normalized to β-actin. (C) G2/M phase expression of cyclin B1, securin, and Cdc20 were quantitated relative to levels at 9 h. Band intensities were normalized to β-actin. (D) Lysates collected 12 h post-HU release were immunoprecipitated with antibodies to cyclins E1 and E2 and IgG control, and then immunoblotted for Cdh1, cyclin E1, cyclin E2, and CDK2. IP, immunoprecipitate; IB, immunoblot; IgG, immunoglobulin G. Arrow(s) indicate protein(s) of interest.
Association with p21Waf1/Cip1, p27Kip1 and p107 is a pathway for control of CDK2 activity during mitosis that can override the effects of deregulated cyclin expression.29 We therefore used HU-synchronized cells to examine whether increased expression of these CDKIs and their association with cyclin E2-CDK2 might minimize the consequences of cyclin E2 overexpression. In empty vector control cells, p21Waf1/Cip1 and p27Kip1 protein increased during cell cycle progression after release from HU arrest but expression of p107 was not altered (Fig. 4A). Overexpression of cyclin E2 reduced p27Kip1 protein expression (to 60% of control at 30 h, Fig. 4A and B) but did not alter p107 expression. However, cyclin E1 overexpression significantly increased p107 mRNA and protein during mitotic exit (1.3x and 3.4x higher at 24 h and 30 h respectively, Fig. 4A and B) and induced slightly higher p21Waf1/Cip1 expression at 30 h. We confirmed that these differences were not due to positioning at different cell cycle stages in the cyclin E1-overexpressing and cyclin E2-overexpressing cells by analyzing cells collected 12 h after HU release in the presence of nocodazole, leading to arrest in prometaphase. Again, cyclin E1-overexpressing cells displayed increases in p107 that were not apparent in cells overexpressing cyclin E2 (Fig. 4C and D).

Figure 4. Cyclin E2 overexpression is associated with low CDKI expression. HU-synchronized cells were released into the cell cycle for 0, 9, 24 and 30 h. (A) Cell lysates were immunoblotted for p21Waf1/Cip1, p27Kip1, p107, cyclins E1 and E2 and β-actin. (B) Lysates collected at 24 h were analyzed for p107 mRNA expression. Densitometry was performed on p21Waf1/Cip1, p27Kip1 and p107 at 30h, and normalized to β-actin. Data in A and B are representative of, or pooled from, quadruplicate experiments. Error bars represent S.E.M. Statistical analysis was performed using repeated measure ANOVA and post-Tukey test, * = p < 0.05; NS = not significant. (C and D) HU-synchronized cells were released into the cell cycle, treated with nocodazole, and cell lysates collected at 12 h post-release. Data are pooled from triplicate experiments and error bars represent S.E.M. (C) Lysates were immunoblotted for p21Waf1/Cip1, p27Kip1, p107, cyclin E1, cyclin E2 and β-actin. (D) Densitometry was performed on the levels of p21Waf1/Cip1, p27Kip1 and p107, and normalized to β-actin levels. Statistical analysis performed using repeated measure ANOVA and post-Tukey test, * = p < 0.05; NS = not significant.
The composition of cyclin E1-CDK2-CDKI and cyclin E2-CDK2-CDKI complexes was then examined. The overexpression of either cyclin E1 or cyclin E2 led to increased association of p21Waf1/Cip1 and p27Kip1 with cyclin E-CDK2 complexes (Fig. 5A and B). However, only the overexpression of cyclin E1 was associated with greater binding of p107 to CDK2 overall (Fig. 5B). Overexpression of cyclin E1 decreased the binding of p107 to cyclin E2, but the converse did not occur (Fig. 5A, p107 blot). Similarly, overexpression of cyclin E1 or E2 did not significantly change the association of p107 with cyclin A (Fig. 5B). Together these observations suggest a preferential interaction of p107 with cyclin E1-CDK2 complexes compared with cyclin E2-CDK2 or cyclin A-CDK2 complexes.

Figure 5. Cyclin E-CDK2 and cyclin A-CDK2 complex composition in cells overexpressing cyclin E1 or cyclin E2. (A) Lysates collected 12 h post-HU release were immunoprecipitated with antibodies to cyclins E1 and E2 and IgG control, and then immunoblotted for p21Waf1/Cip1, p27Kip1, p107, cyclins E1 and E2, and CDK2. * indicates cross-reacting bands, and IgG indicates cross-reaction with small or large IgG bands. Arrow indicates protein of interest. (B) Lysates collected 12 h post-HU release were immunoprecipitated with antibodies to cyclin A and CDK2, and then immunoblotted for p21Waf1/Cip1, p27Kip1, p107, cyclins E1, E2 and A and CDK2. IP, immunoprecipitate; IB, immunoblot; IgG, immunoglobulin. Data are representative of duplicate experiments.
Cyclin E2 induces genomic instability
Since cyclin E2 overexpression did not appear to lead to a delay during metaphase and also did not share cyclin E1 effects on molecular events during G2 and mitosis, we determined whether cyclin E2 overexpression also failed to cause genomic instability, initially by quantitating abnormal metaphases. In both empty vector and cyclin E-overexpressing cell lines a proportion of mitoses were aberrant, as indicated by the presence of chromosomes that failed to align on the metaphase plate or lagged during anaphase (Fig. 6A). Quantitation of the proportion of abnormal mitotic figures revealed that overexpression of either cyclin E1 or cyclin E2 significantly increased the number of aberrant metaphases and anaphases (Fig. 6B). In empty vector cells 87% of metaphase spreads did not display any chromosomal aberrations, and only 2% of cells had two or more abnormalities (Fig. 6C). In contrast, aberrations including chromosome breaks and end-to-end fusions were present in approximately a third of cells overexpressing cyclin E1 or cyclin E2 and 17% or 14%, respectively, had two or more abnormalities.

Figure 6. Mitotic abnormalities in cells overexpressing cyclin E1 or cyclin E2. (A) T-47D cells overexpressing cyclin E1, cyclin E2 or empty vector control were stained for β-tubulin (red), and DNA (DAPI, blue). Shown are the deconvoluted maximum projections from serial 0.5-μm Z-sections, for typical normal and aberrant phenotypes. (B) A minimum of 200 metaphase and anaphase cells were counted from three independent replicates. Statistical analysis was performed using two-tailed t-tests, * = p < 0.05. (C) Metaphase spreads were scored for the presence of chromosomal aberrations. Data are pooled from three independent experiments, each including at least 14 cells per cell line. Empty vector n = 61 cells; cyclin E1 n = 68 cells; cyclin E2 n = 67 cells.
Finally, we quantitated the relative induction of micronuclei, a marker of cyclin E1-induced genomic instability.30 Both cyclin E1 and cyclin E2 overexpression significantly increased micronucleation (Fig. 7A). At greater magnification, the micronuclei in cells overexpressing cyclin E2 were clearly visualized as small nuclear bodies stretching between resolved nuclei, or in several cases as DNA trapped in the midbody between post-mitotic cells (Fig. 7B). The percentage of nuclei with associated micronuclei was increased in cells overexpressing either cyclin E1 or cyclin E2, but cyclin E2 was significantly more effective (Fig. 7C).

Figure 7. Cyclin E2 induces genomic instability. (A) T-47D cells overexpressing cyclin E1, cyclin E2 or empty vector control were stained with DAPI, and imaged on a confocal microscope. Arrows indicate micronuclei. (B) Magnification of micronuclei in cyclin E2 overexpressing cells. Cells are stained with DAPI (blue) and counterstained with Phalloidin (gray). (C) The proportion of cells with associated micronuclei in each population is expressed as a percentage of the total number of nuclei scored (300–600 nuclei per population). Data are pooled from triplicate data sets. Statistical analysis performed using repeated measure ANOVA and post-Tukey test and error bars represent S.E.M. * = p < 0.05; ** = p < 0.01. (D) MCF-7 cells were induced with 70 μM ZnSO4 to express pΔMT cyclin E2 or pΔMT vector control for 2 d then immunoblotted for cyclin E2 and GAPDH. (E) Cells were stained with DAPI (gray), and imaged on a confocal microscope. Representative examples from day 4 are shown. Arrows indicate micronuclei. (F) The proportion of nuclei with associated micronuclei was scored in each population after either 2 or 4 d treatment with 70 μM ZnSO4. At least 500 nuclei were scored per population and data are pooled from duplicate data sets. Statistical analysis was performed using paired t-tests, and error bars represent S.E.M.; * = p < 0.05.
Since a p53-dependent checkpoint protects primary human cells from genetic instability after cyclin E1 overexpression,30,31 we considered the possibility that the cyclin E2-mediated increase in micronuclei might be enhanced by the presence of mutant TP53 in T-47D cells (http://www.sanger.ac.uk/genetics/CGP/CellLines/). We therefore expressed cyclin E2 via a zinc-inducible promoter in p53-wild type MCF-7 human breast cancer cells. Low levels of cyclin E2 induction for 2 d led to a 1.7x increase in micronucleation, which increased to 2.65x after 4 d induction (Fig. 7D and F), confirming that acute overexpression of cyclin E2 was sufficient to induce the formation of micronuclei independently of p53 mutation.
Discussion
Both cyclins E1 and E2 are expressed at high levels in cancer cells, and both can initiate mammary tumorigenesis in mouse models.1,32 However cyclin E2 mRNA is detected at high levels independently of cyclin E1 mRNA in various malignancies,20,22 and cyclin E2 repeatedly features in signatures of poor prognosis in breast cancer that do not include cyclin E1.33-35 We show here that cyclins E1 and E2 have distinct effects on progression through mitosis when overexpressed. Our results are consistent with previous reports of a metaphase delay after overexpression of full-length cyclin E17,23 but do not provide evidence that cyclin E2 also affects the duration of metaphase. Instead, the duration of mitosis appeared to be unaffected by cyclin E2 overexpression (Fig. 2). Similarly, although cyclin E1 was bound by Cdh1, and its overexpression inhibited the degradation of several targets of the APC ubiquitin ligase complex as cells exited mitosis, cyclin E2 did not bind Cdh1, and its overexpression did not inhibit the degradation of APC targets (Fig. 3). This clearly demonstrates functional differences between the two E-type cyclins that may impact on their roles as oncogenes.
The pocket protein p107, along with p21Waf1/Cip1 and p27Kip1, can restrain CDK2/CDK1-induced genomic instability during cell cycle exit,29,36 and overexpression of cyclin E1-CDK2 can prevent nuclear translocation of repressor complexes containing p107 and p130.37 Here we found that cyclin E1 overexpression also coincided with increased expression of p107, likely leading to negative feedback on cyclin E1-CDK2 activity. Immunoprecipitation experiments suggested a predominant interaction between p107 and cyclin E1-CDK2 complexes rather than cyclin A-CDK2 and cyclin E2-CDK2 (Fig. 5). These results are consistent with previous observations of p107 binding to cyclin E1-CDK2 in preference to cyclin A-CDK238,39 and the suppression of CDK2 activity following prolonged cyclin E1 overexpression in other contexts.31 Overall the data in Figures 4 and 5 suggest that p107 may control excessive CDK2 activity following deregulated expression of cyclin E1 but not deregulated expression of cyclin E2.
Although deregulated expression of cyclin E2 did not appear to affect the duration of mitosis, it did lead to an increase in the proportion of mitotic abnormalities and the presence of micronuclei (Figs. 6 and 7). Effects on chromosome segregation are perhaps unexpected for a protein best understood as a regulator of the G1/S transition. However, the cyclin E-CDK2 kinase targets Rb and other pocket proteins, which have important roles as tumor suppressors during G2/M as well as at the G1/S phase transition. Inactivation of Rb, p107 and p130 leads to an increase in the number of lagging chromosomes, compromised chromosome condensation, and an increase in chromosome breaks.40-42 The effects of cyclin E2 overexpression shown here are similar to the effects of pocket protein inactivation. This is to be expected, since deregulation of cyclin E2 and consequent deregulation of CDK2 activity in G2/M will functionally inactivate the pocket proteins. We therefore propose that the failure to increase p107 levels to protect against excessive CDK activity in G2/M contributes to genomic instability in cyclin E2-overexpressing cells (Fig. 8). Cyclin E2-induced genomic instability may also be due to persistent cyclin E2-CDK2 activity toward the machinery for chromatin decondensation43-46 or histone biosynthesis,47,48 both of which are associated with genomic instability.49,50 Finally, it is possible that like cyclin E1, cyclin E2 stimulation of S phase entry may promote replication stress and consequent genomic instabilty when uncoupled from other growth-promoting cellular processes,24,51 although whether the two E-type cyclins play similar roles in DNA replication remains to be demonstrated.
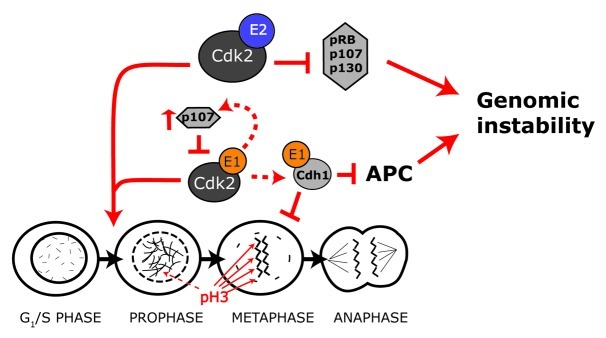
Figure 8. Model of cyclin E1 and E2 action. Both cyclin E1 and cyclin E2 promote G1-S phase progression. However they have different actions during mitosis. Cyclin E1 activates CDK2 to phosphorylate and stabilize Cdh1. This leads to inhibition of the APC and ultimately causes a metaphase delay and genomic instability. Cyclin E1 overexpression also upregulates p107, leading to negative feedback on cyclin E1/CDK2 activity. In contrast cyclin E2 overexpression does not lead to Cdh1 stabilization, metaphase delay or increased levels of p107. In the absence of increased p107 expression, deregulated cyclin E2-CDK2 actvity leads to functional inactivation of pocket proteins and genomic instability.
In summary, we propose a model where cyclin E2 acts to disrupt both G1/S and G2/M functions during tumorigenesis (Fig. 8). This is supported by our demonstration that high expression of cyclin E2 efficiently promotes S phase entry, while also inducing genomic instability. While there is significant redundancy between cyclin E1 and cyclin E2 in settings of normal development and mitosis,52 here we provide evidence that these proteins have unique functions in a cancer setting.
Methods
Cell culture and flow cytometry
All cell lines used were authenticated by STR profiling (CellBank Australia) and cultured for < 6 mo after authentication. Cyclin E1 (CycE1:IOH27850) and cyclin E2 (CycE2: IOH43526) (Invitrogen) were recombined into pMIG-GW-V525 and retrovirus generated and infected into T-47D/EcoR cells as described.53 Subpopulations with graded expression of GFP and cyclin proteins were separated by FACS. MCF-7 cells expressing pΔMT-GW empty vector and pΔMT-GW cyclin E2 WT were generated as described previously.54
T-47D cells were synchronized with 1 mM HU (Merck) treatment for 40 h, washed twice with PBS, and fresh media added. Seventy min post-removal of HU, cells were pulsed with 20 μM BrdU (Sigma) for 15 min, followed by washing twice with PBS before adding fresh media. BrdU incorporation was detected with anti-BrdU-FITC (BD Biosciences), as described previously.54 Phospho-histone H3 was analyzed by flow cytometry as described in55 using Phospho-Histone H3 (Ser10) (Cell Signaling).
Immunoblotting and immunoprecipitation
Protein lysates were harvested as described,56 and 10–30 μg of lysate were separated using NuPage polyacrylamide gels (Invitrogen) prior to transfer to PVDF membranes. Membranes were incubated with the following antibodies: cyclin E1 (HE12), cyclin A2 (C-19), CDK2 (M2), p107 (C-18) Santa Cruz Biotechnology; cyclin E2, cyclin B1 (V152), Cell Signaling; Cdc20 (ab26483) and securin (DCS-280), Abcam; Cdh1 (DH01), CalbioChem; p21Waf1/Cip1 (610233) and p27Kip1 (610241), BD Transduction Laboratories; V5 (R960–25) Invitrogen; β-actin (AC-15) Sigma. Antibodies used for immunoprecipitation were cyclin E1 (C-19), cyclin A (C-19) and CDK2 (C-19) from Santa Cruz Biotechnology, and cyclin E2 from Epitomics.
qRT-PCR analysis
Total RNA was extracted using the RNeasy Minikit (Qiagen) and processed with the Reverse Transcription System (Promega). qRT-PCR was performed on an ABI Prism 7900HT (Applied Biosystems, Invitrogen) using gene Expression Assays p107 - Hs00765713_m1 and human RPLP0 – 4326314E (Applied Biosystems).
Immunofluorescence and microscopy
Cells growing on glass coverslips were fixed with 4% PFA/PBS for 20 min at room temperature and post-fixed with methanol at -20°C for 20 min. Alternatively, cells were fixed in methanol at -20°C for 20 min. DNA was stained with DAPI (Jackson ImmunoResearch Laboratories).
For Lamin A/C immunofluorescence (Fig. 2), samples were blocked with 1% BSA/PBS, incubated with primary antibody (2032, Cell Signaling) at 1:100 for 1 h, followed by 1 h with secondary antibodies then DAPI counterstain. Confocal microscopy was performed on a Leica DMRBE or DMIRE2 microscope (63x/100x PL APO oil objectives). Images were processed with Adobe Photoshop and adjusted for optimal brightness/contrast.
Live cell imaging was performed with a Zeiss Axiovert 200M inverted fluorescence microscope (10x objective; 0.3 N.A.), where cells were maintained at 37°C with 5% CO2 and phase contrast images captured every 5 min from 6 h to 30 h post-HU release. Multidimensional time-lapsed images were aligned using ImageJ software. Exit from mitosis was determined at the time at which anaphase and cytokinesis were observed. At least 100 events in four independent fields were scored per cell line, and data are representative of two separate experiments. Statistical analysis was performed using Kruskal-Wallis one-way ANOVA analysis, and p values calculated using Dunn’s post-test.
To image mitotic figures (Fig. 6), samples were blocked (3% BSA, 0.1% Tween 20 in PBS) for 30 min then incubated with β-tubulin antibody (kind gift of Anna Castro) for 2 h. Images were captured using a Zeiss AxioPlan microscope coupled with a AxioCam MRm camera, using a Plan-NEO FLURA 100X 1.3 lens. Serial 0.5 µm Z-sections were taken and deconvoluted using Huygens 3.0 software. Maximum projections were performed with ImageJ, false coloring and overlays were performed using Adobe Photoshop CS5 Extended software. A minimum of 200 metaphase and anaphase cells were counted from three independent replicates. Metaphase cells were identified by the presence of a mature bipolar spindle and were scored as aberrant if any chromosomes failed to congress to the metaphase plate. Similarly, anaphase cells were identified based on the presence of clearly separated and condensed chromosomes, with any cell with lagging chromosomes in the mid-spindle region scored as aberrant.
For metaphase spreads, proliferating cells were treated with 0.2 µg/ml colcemid (Sigma) for 30 min, harvested then swollen using 75 mM KCl for 10 min and fixed in methanol/acetic acid. Metaphase spreads were then performed as previously described.57 Data have been pooled from three separate experiments.
Acknowledgments
The authors thank Dr Will Hughes for his assistance with live cell microscopy, the MLC Flow Cytometry Facility for assistance with cell sorting, and Ms Christine Lee for assistance with some experiments and figure preparation. This research was supported by the National Health and Medical Research Council of Australia (481307, 535903, 427601), the Cancer Institute NSW (07/CDF/1–28, 11/CDF/3–26, 09/RIG/1–18), the Young Garvan Foundation, the Australian Cancer Research Foundation (ACRF Unit for the Molecular Genetics of Cancer), the Petre Foundation, and the RT Hall Trust. C.E.C. is a National Breast Cancer Foundation (Australia) and Cure Cancer Australia Fellow. A.B. is a Cancer Institute NSW Future Research Leader. A.J.D. is a National Breast Cancer Foundation (Australia) fellow. R.L.S. was a NHMRC Senior Principal Research Fellow. E.A.M. is a Cancer Institute NSW Fellow.
Glossary
Abbreviations:
- APC
anaphase-promoting complex
- CDK
cyclin-dependent kinase
- HU
hydroxyurea
Disclosure of Potential Conflicts of Interest
The authors have no conflicts of interest to declare.
Footnotes
Previously published online: www.landesbioscience.com/journals/cc/article/23512
References
- 1.Hwang HC, Clurman BE. Cyclin E in normal and neoplastic cell cycles. Oncogene. 2005;24:2776–86. doi: 10.1038/sj.onc.1208613. [DOI] [PubMed] [Google Scholar]
- 2.Juan G, Cordon-Cardo C. Intranuclear compartmentalization of cyclin E during the cell cycle: disruption of the nucleoplasm-nucleolar shuttling of cyclin E in bladder cancer. Cancer Res. 2001;61:1220–6. [PubMed] [Google Scholar]
- 3.Bortner DM, Rosenberg MP. Induction of mammary gland hyperplasia and carcinomas in transgenic mice expressing human cyclin E. Mol Cell Biol. 1997;17:453–9. doi: 10.1128/mcb.17.1.453. [DOI] [PMC free article] [PubMed] [Google Scholar]
- 4.Ma Y, Fiering S, Black C, Liu X, Yuan Z, Memoli VA, et al. Transgenic cyclin E triggers dysplasia and multiple pulmonary adenocarcinomas. Proc Natl Acad Sci U S A. 2007;104:4089–94. doi: 10.1073/pnas.0606537104. [DOI] [PMC free article] [PubMed] [Google Scholar]
- 5.Loeb KR, Kostner H, Firpo E, Norwood T, D Tsuchiya K, Clurman BE, et al. A mouse model for cyclin E-dependent genetic instability and tumorigenesis. Cancer Cell. 2005;8:35–47. doi: 10.1016/j.ccr.2005.06.010. [DOI] [PubMed] [Google Scholar]
- 6.Nakayama K, Nagahama H, Minamishima YA, Matsumoto M, Nakamichi I, Kitagawa K, et al. Targeted disruption of Skp2 results in accumulation of cyclin E and p27(Kip1), polyploidy and centrosome overduplication. EMBO J. 2000;19:2069–81. doi: 10.1093/emboj/19.9.2069. [DOI] [PMC free article] [PubMed] [Google Scholar]
- 7.Keck JM, Summers MK, Tedesco D, Ekholm-Reed S, Chuang L-C, Jackson PK, et al. Cyclin E overexpression impairs progression through mitosis by inhibiting APC(Cdh1) J Cell Biol. 2007;178:371–85. doi: 10.1083/jcb.200703202. [DOI] [PMC free article] [PubMed] [Google Scholar]
- 8.Ekholm-Reed S, Méndez J, Tedesco D, Zetterberg A, Stillman B, Reed SI. Deregulation of cyclin E in human cells interferes with prereplication complex asS.E.M.bly. J Cell Biol. 2004;165:789–800. doi: 10.1083/jcb.200404092. [DOI] [PMC free article] [PubMed] [Google Scholar]
- 9.Spruck CH, Won KA, Reed SI. Deregulated cyclin E induces chromosome instability. Nature. 1999;401:297–300. doi: 10.1038/45836. [DOI] [PubMed] [Google Scholar]
- 10.Akli S, Zheng PJ, Multani AS, Wingate HF, Pathak S, Zhang N, et al. Tumor-specific low molecular weight forms of cyclin E induce genomic instability and resistance to p21, p27, and antiestrogens in breast cancer. Cancer Res. 2004;64:3198–208. doi: 10.1158/0008-5472.CAN-03-3672. [DOI] [PubMed] [Google Scholar]
- 11.Koepp DM, Schaefer LK, Ye X, Keyomarsi K, Chu C, Harper JW, et al. Phosphorylation-dependent ubiquitination of cyclin E by the SCFFbw7 ubiquitin ligase. Science. 2001;294:173–7. doi: 10.1126/science.1065203. [DOI] [PubMed] [Google Scholar]
- 12.Welcker M, Clurman BE. FBW7 ubiquitin ligase: a tumour suppressor at the crossroads of cell division, growth and differentiation. Nat Rev Cancer. 2008;8:83–93. doi: 10.1038/nrc2290. [DOI] [PubMed] [Google Scholar]
- 13.Ekholm-Reed S, Spruck CH, Sangfelt O, van Drogen F, Mueller-Holzner E, Widschwendter M, et al. Mutation of hCDC4 leads to cell cycle deregulation of cyclin E in cancer. Cancer Res. 2004;64:795–800. doi: 10.1158/0008-5472.CAN-03-3417. [DOI] [PubMed] [Google Scholar]
- 14.Pascreau G, Churchill ME, Maller JL. Centrosomal localization of cyclins E and A: structural similarities and functional differences. Cell Cycle. 2011;10:199–205. doi: 10.4161/cc.10.2.14444. [DOI] [PMC free article] [PubMed] [Google Scholar]
- 15.Geng Y, Yu Q, Sicinska E, Das M, Schneider JE, Bhattacharya S, et al. Cyclin E ablation in the mouse. Cell. 2003;114:431–43. doi: 10.1016/S0092-8674(03)00645-7. [DOI] [PubMed] [Google Scholar]
- 16.Gudas JM, Payton M, Thukral S, Chen E, Bass M, Robinson MO, et al. Cyclin E2, a novel G1 cyclin that binds Cdk2 and is aberrantly expressed in human cancers. Mol Cell Biol. 1999;19:612–22. doi: 10.1128/mcb.19.1.612. [DOI] [PMC free article] [PubMed] [Google Scholar]
- 17.Lauper N, Beck AR, Cariou S, Richman L, Hofmann K, Reith W, et al. Cyclin E2: a novel CDK2 partner in the late G1 and S phases of the mammalian cell cycle. Oncogene. 1998;17:2637–43. doi: 10.1038/sj.onc.1202477. [DOI] [PubMed] [Google Scholar]
- 18.Zariwala M, Liu J, Xiong Y. Cyclin E2, a novel human G1 cyclin and activating partner of CDK2 and CDK3, is induced by viral oncoproteins. Oncogene. 1998;17:2787–98. doi: 10.1038/sj.onc.1202505. [DOI] [PubMed] [Google Scholar]
- 19.Klotz K, Cepeda D, Tan Y, Sun D, Sangfelt O, Spruck C. SCF(Fbxw7/hCdc4) targets cyclin E2 for ubiquitin-dependent proteolysis. Exp Cell Res. 2009;315:1832–9. doi: 10.1016/j.yexcr.2008.11.017. [DOI] [PubMed] [Google Scholar]
- 20.Caldon CE, Musgrove EA. Distinct and redundant functions of cyclin E1 and cyclin E2 in development and cancer. Cell Div. 2010;5:2. doi: 10.1186/1747-1028-5-2. [DOI] [PMC free article] [PubMed] [Google Scholar]
- 21.Nevzorova YA, Tschaharganeh D, Gassler N, Geng Y, Weiskirchen R, Sicinski P, et al. Aberrant cell cycle progression and endoreplication in regenerating livers of mice that lack a single E-type cyclin. Gastroenterology. 2009;137:691–703, 703, e1-6. doi: 10.1053/j.gastro.2009.05.003. [DOI] [PMC free article] [PubMed] [Google Scholar]
- 22.Caldon CE, Sergio CM, Kang J, Muthukaruppan A, Boersma MN, Stone A, et al. Cyclin E2 overexpression is associated with endocrine resistance but not insensitivity to CDK2 inhibition in human breast cancer cells. Mol Cancer Ther. 2012;11:1488–99. doi: 10.1158/1535-7163.MCT-11-0963. [DOI] [PubMed] [Google Scholar]
- 23.Bagheri-Yarmand R, Biernacka A, Hunt KK, Keyomarsi K. Low molecular weight cyclin E overexpression shortens mitosis, leading to chromosome missegregation and centrosome amplification. Cancer Res. 2010;70:5074–84. doi: 10.1158/0008-5472.CAN-09-4094. [DOI] [PMC free article] [PubMed] [Google Scholar]
- 24.Leontieva OV, Lenzo F, Demidenko ZN, Blagosklonny MV. Hyper-mitogenic drive coexists with mitotic incompetence in senescent cells. Cell Cycle. 2012;11:4642–9. doi: 10.4161/cc.22937. [DOI] [PMC free article] [PubMed] [Google Scholar]
- 25.Caldon CE, Swarbrick A, Lee CS, Sutherland RL, Musgrove EA. The helix-loop-helix protein Id1 requires cyclin D1 to promote the proliferation of mammary epithelial cell acini. Cancer Res. 2008;68:3026–36. doi: 10.1158/0008-5472.CAN-07-3079. [DOI] [PubMed] [Google Scholar]
- 26.Porter DC, Zhang N, Danes C, McGahren MJ, Harwell RM, Faruki S, et al. Tumor-specific proteolytic processing of cyclin E generates hyperactive lower-molecular-weight forms. Mol Cell Biol. 2001;21:6254–69. doi: 10.1128/MCB.21.18.6254-6269.2001. [DOI] [PMC free article] [PubMed] [Google Scholar]
- 27.Ohtsubo M, Roberts JM. Cyclin-dependent regulation of G1 in mammalian fibroblasts. Science. 1993;259:1908–12. doi: 10.1126/science.8384376. [DOI] [PubMed] [Google Scholar]
- 28.Resnitzky D, Gossen M, Bujard H, Reed SI. Acceleration of the G1/S phase transition by expression of cyclins D1 and E with an inducible system. Mol Cell Biol. 1994;14:1669–79. doi: 10.1128/mcb.14.3.1669. [DOI] [PMC free article] [PubMed] [Google Scholar]
- 29.Chibazakura T, McGrew SG, Cooper JA, Yoshikawa H, Roberts JM. Regulation of cyclin-dependent kinase activity during mitotic exit and maintenance of genome stability by p21, p27, and p107. Proc Natl Acad Sci U S A. 2004;101:4465–70. doi: 10.1073/pnas.0400655101. [DOI] [PMC free article] [PubMed] [Google Scholar]
- 30.Minella AC, Grim JE, Welcker M, Clurman BE. p53 and SCFFbw7 cooperatively restrain cyclin E-associated genome instability. Oncogene. 2007;26:6948–53. doi: 10.1038/sj.onc.1210518. [DOI] [PubMed] [Google Scholar]
- 31.Minella AC, Swanger J, Bryant E, Welcker M, Hwang H, Clurman BE. p53 and p21 form an inducible barrier that protects cells against cyclin E-cdk2 deregulation. Curr Biol. 2002;12:1817–27. doi: 10.1016/S0960-9822(02)01225-3. [DOI] [PubMed] [Google Scholar]
- 32.Theodorou V, Kimm MA, Boer M, Wessels L, Theelen W, Jonkers J, et al. MMTV insertional mutagenesis identifies genes, gene families and pathways involved in mammary cancer. Nat Genet. 2007;39:759–69. doi: 10.1038/ng2034. [DOI] [PubMed] [Google Scholar]
- 33.Sotiriou C, Wirapati P, Loi S, Harris A, Fox S, Smeds J, et al. Gene expression profiling in breast cancer: understanding the molecular basis of histologic grade to improve prognosis. J Natl Cancer Inst. 2006;98:262–72. doi: 10.1093/jnci/djj052. [DOI] [PubMed] [Google Scholar]
- 34.van ’t Veer LJ, Dai H, van de Vijver MJ, He YD, Hart AA, Mao M, et al. Gene expression profiling predicts clinical outcome of breast cancer. Nature. 2002;415:530–6. doi: 10.1038/415530a. [DOI] [PubMed] [Google Scholar]
- 35.Wang Y, Klijn JG, Zhang Y, Sieuwerts AM, Look MP, Yang F, et al. Gene-expression profiles to predict distant metastasis of lymph-node-negative primary breast cancer. Lancet. 2005;365:671–9. doi: 10.1016/S0140-6736(05)17947-1. [DOI] [PubMed] [Google Scholar]
- 36.Payne SR, Zhang S, Tsuchiya K, Moser R, Gurley KE, Longton G, et al. p27kip1 deficiency impairs G2/M arrest in response to DNA damage, leading to an increase in genetic instability. Mol Cell Biol. 2008;28:258–68. doi: 10.1128/MCB.01536-07. [DOI] [PMC free article] [PubMed] [Google Scholar]
- 37.Kolupaeva V, Basilico C. Overexpression of cyclin E/CDK2 complexes overcomes FGF-induced cell cycle arrest in the presence of hypophosphorylated Rb proteins. Cell Cycle. 2012;11:2557–66. doi: 10.4161/cc.20944. [DOI] [PMC free article] [PubMed] [Google Scholar]
- 38.Dhillon NK, Mudryj M. Ectopic expression of cyclin E in estrogen responsive cells abrogates antiestrogen mediated growth arrest. Oncogene. 2002;21:4626–34. doi: 10.1038/sj.onc.1205576. [DOI] [PubMed] [Google Scholar]
- 39.Xiao ZX, Ginsberg D, Ewen M, Livingston DM. Regulation of the retinoblastoma protein-related protein p107 by G1 cyclin-associated kinases. Proc Natl Acad Sci U S A. 1996;93:4633–7. doi: 10.1073/pnas.93.10.4633. [DOI] [PMC free article] [PubMed] [Google Scholar]
- 40.van Harn T, Foijer F, van Vugt M, Banerjee R, Yang F, Oostra A, et al. Loss of Rb proteins causes genomic instability in the absence of mitogenic signaling. Genes Dev. 2010;24:1377–88. doi: 10.1101/gad.580710. [DOI] [PMC free article] [PubMed] [Google Scholar]
- 41.Manning AL, Longworth MS, Dyson NJ. Loss of pRB causes centromere dysfunction and chromosomal instability. Genes Dev. 2010;24:1364–76. doi: 10.1101/gad.1917310. [DOI] [PMC free article] [PubMed] [Google Scholar]
- 42.Coschi CH, Martens AL, Ritchie K, Francis SM, Chakrabarti S, Berube NG, et al. Mitotic chromosome condensation mediated by the retinoblastoma protein is tumor-suppressive. Genes Dev. 2010;24:1351–63. doi: 10.1101/gad.1917610. [DOI] [PMC free article] [PubMed] [Google Scholar]
- 43.Alexandrow MG, Hamlin JL. Chromatin decondensation in S-phase involves recruitment of Cdk2 by Cdc45 and histone H1 phosphorylation. J Cell Biol. 2005;168:875–86. doi: 10.1083/jcb.200409055. [DOI] [PMC free article] [PubMed] [Google Scholar]
- 44.Hall C, Nelson DM, Ye X, Baker K, DeCaprio JA, Seeholzer S, et al. HIRA, the human homologue of yeast Hir1p and Hir2p, is a novel cyclin-cdk2 substrate whose expression blocks S-phase progression. Mol Cell Biol. 2001;21:1854–65. doi: 10.1128/MCB.21.5.1854-1865.2001. [DOI] [PMC free article] [PubMed] [Google Scholar]
- 45.Müller-Tidow C, Wang W, Idos GE, Diederichs S, Yang R, Readhead C, et al. Cyclin A1 directly interacts with B-myb and cyclin A1/cdk2 phosphorylate B-myb at functionally important serine and threonine residues: tissue-specific regulation of B-myb function. Blood. 2001;97:2091–7. doi: 10.1182/blood.V97.7.2091. [DOI] [PubMed] [Google Scholar]
- 46.Chi Y, Welcker M, Hizli AA, Posakony JJ, Aebersold R, Clurman BE. Identification of CDK2 substrates in human cell lysates. Genome Biol. 2008;9:R149. doi: 10.1186/gb-2008-9-10-r149. [DOI] [PMC free article] [PubMed] [Google Scholar]
- 47.Lanzotti DJ, Kupsco JM, Marzluff WF, Duronio RJ. string(cdc25) and cyclin E are required for patterned histone expression at different stages of Drosophila embryonic development. Dev Biol. 2004;274:82–93. doi: 10.1016/j.ydbio.2004.06.019. [DOI] [PubMed] [Google Scholar]
- 48.Ma T, Van Tine BA, Wei Y, Garrett MD, Nelson D, Adams PD, et al. Cell cycle-regulated phosphorylation of p220(NPAT) by cyclin E/Cdk2 in Cajal bodies promotes histone gene transcription. Genes Dev. 2000;14:2298–313. doi: 10.1101/gad.829500. [DOI] [PMC free article] [PubMed] [Google Scholar]
- 49.Wei Y, Yu L, Bowen J, Gorovsky MA, Allis CD. Phosphorylation of histone H3 is required for proper chromosome condensation and segregation. Cell. 1999;97:99–109. doi: 10.1016/S0092-8674(00)80718-7. [DOI] [PubMed] [Google Scholar]
- 50.Salzler HR, Davidson JM, Montgomery ND, Duronio RJ. Loss of the histone pre-mRNA processing factor stem-loop binding protein in Drosophila causes genomic instability and impaired cellular proliferation. PLoS One. 2009;4:e8168. doi: 10.1371/journal.pone.0008168. [DOI] [PMC free article] [PubMed] [Google Scholar]
- 51.Bester AC, Roniger M, Oren YS, Im MM, Sarni D, Chaoat M, et al. Nucleotide deficiency promotes genomic instability in early stages of cancer development. Cell. 2011;145:435–46. doi: 10.1016/j.cell.2011.03.044. [DOI] [PMC free article] [PubMed] [Google Scholar]
- 52.Geng Y, Yu Q, Whoriskey W, Dick F, Tsai KY, Ford HL, et al. Expression of cyclins E1 and E2 during mouse development and in neoplasia. Proc Natl Acad Sci U S A. 2001;98:13138–43. doi: 10.1073/pnas.231487798. [DOI] [PMC free article] [PubMed] [Google Scholar]
- 53.Musgrove EA, Hunter L-JK, Lee CSL, Swarbrick A, Hui R, Sutherland RL. Cyclin D1 overexpression induces progestin resistance in T-47D breast cancer cells despite p27(Kip1) association with cyclin E-Cdk2. J Biol Chem. 2001;276:47675–83. doi: 10.1074/jbc.M106371200. [DOI] [PubMed] [Google Scholar]
- 54.Caldon CE, Sergio CM, Schütte J, Boersma MN, Sutherland RL, Carroll JS, et al. Estrogen regulation of cyclin E2 requires cyclin D1 but not c-Myc. Mol Cell Biol. 2009;29:4623–39. doi: 10.1128/MCB.00269-09. [DOI] [PMC free article] [PubMed] [Google Scholar]
- 55.Xu B, Kim St, Kastan MB. Involvement of Brca1 in S-phase and G(2)-phase checkpoints after ionizing irradiation. Mol Cell Biol. 2001;21:3445–50. doi: 10.1128/MCB.21.10.3445-3450.2001. [DOI] [PMC free article] [PubMed] [Google Scholar]
- 56.Prall OWJ, Rogan EM, Musgrove EA, Watts CKW, Sutherland RL. c-Myc or cyclin D1 mimics estrogen effects on cyclin E-Cdk2 activation and cell cycle reentry. Mol Cell Biol. 1998;18:4499–508. doi: 10.1128/mcb.18.8.4499. [DOI] [PMC free article] [PubMed] [Google Scholar]
- 57.MacKay C, Déclais AC, Lundin C, Agostinho A, Deans AJ, MacArtney TJ, et al. Identification of KIAA1018/FAN1, a DNA repair nuclease recruited to DNA damage by monoubiquitinated FANCD2. Cell. 2010;142:65–76. doi: 10.1016/j.cell.2010.06.021. [DOI] [PMC free article] [PubMed] [Google Scholar]