

Abstract
Aims
The trace amine-associated receptor (Taar) family displays high species- and subtype-specific pharmacology. Several trace amines such as β-phenylethylamine (β-PEA), p-tyramine and tryptamine are agonists at TA1 but poorly activate rat and mouse Taar4.
Principal Results
Using rat TA1 and Taar4 chimera, we identified determinants in transmembrane helices 3 and 6, which, when replaced by the corresponding portion of rat TA1, can rescue cell surface expression of rat Taar4. When expressed at the cell surface, rat Taar4 pharmacology was very similar to that of TA1 and coupled to the Gαs-protein/AC pathway. Our data suggest that binding pockets of Taar for surrogate agonists overlap between paralogs.
Conclusions
This implicates that the repertoire of Taar ensures functional redundancy, tissue- and cell-specific expression and/or different downstream signalling rather than different agonist specificity.
Keywords: Taar, trace amine-associated receptor, GPCR
Introduction
The trace amine-associated receptor (Taar) family is a subfamily within the rhodopsin-like GPCR superfamily and consists of nine subtypes in mammals. However, the number of intact and pseudogenes differs remarkably between species. Humans possess only six TAAR genes, but there are 17 functional Taar genes in rat (Lindemann et al., 2005a). TA1 (see Maguire et al., 2009 for trace amine receptor nomenclature used throughout manuscript), the first de-orphanized subtype, is activated by trace amines, namely β-phenylethylamine (β-PEA), p-tyramine and tryptamine and couples to the Gαs-protein/adenylyl cyclase pathway (Borowsky et al., 2001; Bunzow et al., 2001). Furthermore, psychoactive compounds, such as MDMA and amphetamine, 3-iodothyronamine, metabolites of the anti-arrhythmic drug amiodarone and imidazoline derivatives were identified as agonists at TA1 (Borowsky et al., 2001; Bunzow et al., 2001; Scanlan et al., 2004; Snead et al., 2008; Hu et al., 2009). The function and agonist specificity of TA1 has been extensively studied in many different species. Thereby, significant interspecies differences in functional and pharmacological properties were observed (Lindemann and Hoener, 2005b; Reese et al., 2007; Wainscott et al., 2007; Hu et al., 2009). For murine Taar3, Taar4 and Taar5 chemosensory function involving recognition of volatile amines was proposed (Liberles and Buck, 2006). As shown recently, activation of Taar3–5 by volatile amines is also highly species-specific, and there is no evolutionary evidence that volatile amines are the Taar agonists nature selected for (Staubert et al., 2010). Mouse and rat Taar4 were found to be sensitive to degradation products of classical biogenic amines, namely β-PEA, β-methylphenylethylamine and tryptamine, as well as to the imidazoline derivatives naphazoline and xylometazoline and shown to signal via the Gαs-protein/AC pathway (Borowsky et al., 2001; Liberles and Buck, 2006; Staubert et al., 2010). In humans and many primates, TAAR4 is a pseudogene (Staubert et al., 2010). Furthermore, many previous studies identified significant differences in plasma membrane expression of Taar in heterologous cell systems (Borowsky et al., 2001; Bunzow et al., 2001; Miller et al., 2005; Lindemann and Hoener, 2005b; Grandy, 2007; Wainscott et al., 2007; Wolinsky et al., 2007; Barak et al., 2008; ). The molecular basis of subtype- and species-specific differences in agonist specificity and plasma membrane localization is still unclear.
Herein, we addressed the subtype- and species-specific differences in receptor trafficking and functionality using chimeras of rat TA1 and Taar4. We found that differences in receptor pharmacology are mainly caused by improper cellular trafficking of rat Taar4 to the cell surface. We identified determinants in the transmembrane helices 3 and 6 (TM3, TM6), which, when replaced by the corresponding portion of rat TA1, can rescue poor cell surface expression of wild type rat Taar4. Furthermore, we found that the binding pockets of rat TA1 and rat Taar4 for trace amines and psychoactive substances are highly similar. Every chimera expressed at the cell surface induced cAMP accumulation, confirming previous reports of Gαs coupling of rat Taar4. Our findings suggest that agonist binding pockets of Taar are conserved not only between orthologs but also between paralogs. This is consistent with the hypothesis that, despite their high ligand promiscuity, all Taar subtypes have been evolutionarily selected for the same endogenous agonist(s) but might exhibit different downstream signalling and or kinetics of interaction. This hypothesis further implicates that the repertoire of Taar ensures functional redundancy, tissue- and cell-specific expression and expression regulation as found in most other transmitter/receptor systems.
Methods
Materials
If not stated otherwise, all standard substances were purchased from Sigma Aldrich (Taufkirchen, Germany), Merck (Darmstadt, Germany) and C. Roth GmbH (Karlsruhe, Germany). Cell culture material was obtained from Sarstedt (Nürnbrecht, Germany), and primers were purchased from Invitrogen (Karlsruhe, Germany). Primer sequences are provided in the supplement section (Table S1). For expression of Taar in mammalian cell lines, the pcDps vector was used (Okayama and Berg, 1983). Restriction enzymes were purchased from New England Biolabs (Frankfurt/Main, Germany).
Experimental procedures
Taar1 and Taar4 ortholog identification
Various mammalian Taar1 and Taar4 sequences were obtained using the respective rat ortholog nucleotide sequences as query sequence in discontinuous megablast in all available mammalian NCBI trace archives. Trace files producing significant sequence alignments were assembled, analysed (SeqManPro, DNAStar Lasergene Software Suite for Sequence Analysis 7.1.) and manually proofread. Assembled orthologs are listed in Table S2.
Generation of rat Taar1–Taar4 constructs
Genomic DNA samples were prepared from rat and human blood using DNeasy®Blood&Tissue Kit (Qiagen, Hilden, Germany). Primer pairs (Table S1) were used to amplify rat Taar1 (NCBI Reference Sequence: NM_134328.1) and rat Taar4 (NCBI Reference Sequence: NM_175583.1). PCR reactions were performed with a mixture of Taq- and Pfu-polymerase under variable annealing and elongation conditions. A standard PCR reaction (50 μL) contained genomic DNA (100 ng) with primers (400 nM each), ThermoPol reaction buffer (1x), dNTP (125 μM, each) and Taq- and Pfu-polymerase (0.5 U each, Fermentas, St. Leon-Rot, Germany). The reactions were initiated with a denaturation at 95°C for 2 min, followed by 30 cycles of denaturation at 95°C for 30 s, annealing at 55°C for 30 s and elongation at 72°C for 1 min. A final extension step was performed at 72°C for 10 min. Specific PCR products were directly sequenced and/or subcloned into the pCR2.1-TOPO vector (Invitrogen, Paisley, UK) for sequencing. Sequencing reactions were performed with a dye-terminator cycle sequencing kit and applied on a MegaBACE™ 1000 (GE Healthcare Europe GmbH, Munich, Germany).
The full-length rat Taar1 and rat Taar4 were inserted into the mammalian expression vector pcDps and epitope-tagged with an N-terminal haemagglutinin (HA) epitope (YPYDVPDYA) and a C-terminal FLAG-tag (DYKDDDDK) by a PCR-based overlapping fragment approach to allow immunological detection.
Replacement of TM regions in rat Taar1 and rat Taar4 were performed using a PCR-based overlapping fragment approach. Long overlapping primers were designed to replace a certain TM region of rat Taar1 with the respective TM region of rat Taar4. HA- and FLAG-tagged rat Taar1 and rat Taar4 in pcDps served as initial templates. Rat Taar1, rat Taar4 and selected Taar1–Taar4 chimeras were additionally tagged with a sequence encoding the N-terminal 20 amino acids of bovine rhodopsin N terminus (RHOD-tag) as described in Liberles and Buck (2006) between the HA epitope and the respective receptor. Identity of all constructs and correctness of all PCR-derived sequences were confirmed by sequencing. Schematic overview of chimeras is found in Table 1. Exact amino acid sequence description of all chimeras is given in Table S3.
Table 1.
Cell surface expression of rat TA1, Taar4 and chimeras in COS-7 cells
| Scheme | Construct | Cell surface expression (% of rat TA1) | Total expression (% of TA1) |
|---|---|---|---|
 |
TA1 | 100 (13) | 100 (3) |
 |
Taar4 | 15 ± 3 (13) | 293 ± 58 (3) |
 |
RHOD TA1 | 689 ± 52 (9) | 1007 ± 201 (2) |
 |
RHOD Taar4 | 24 ± 6 (9) | 444 ± 4 (2) |
 |
CTM1-3 | 10 ± 1 (4) | 244 ± 65 (3) |
 |
CTM4-7 | 7 ± 1 (4) | 109 ± 35 (3) |
 |
CTM1 | 15 ± 2 (4) | 352 ± 76 (3) |
 |
CTM2 | 115 ± 13 (4) | 176 ± 43 (3) |
 |
CTM3 | 5 ± 1 (4) | 143 ± 46 (3) |
 |
CTM4 | 138 ± 10 (3) | 163 ± 40 (3) |
 |
CTM5 | 155 ± 27 (4) | 275 ± 47 (3) |
 |
CTM6 | 5 ± 1 (4) | 51 ± 16 (3) |
 |
CTM6i | 5 ± 2 (4) | 53 ± 7 (3) |
 |
CTM6o | 6 ± 2 (4) | 89 ± 11 (3) |
 |
CTM7 | 114 ± 15 (4) | 426 ± 77 (3) |
 |
CTM1/7 | 97 ± 9 (4) | 713 ± 55 (3) |
 |
CTM2/3 | 5 ± 2 (3) | 45 ± 5 (3) |
 |
CTM2/4 | 202 ± 17 (4) | 204 ± 51 (3) |
 |
CTM2/5 | 158 ± 6 (4) | 189 ± 17 (3) |
 |
CTM3/6 | 7 ± 4 (3) | 77 ± 4 (3) |
 |
CTM4/5 | 276 ± 6 (4) | 239 ± 15 (3) |
 |
CTM2/4/5 | 137 ± 16 (4) | 186 ± 21 (3) |
 |
CTM2/3/4/5 | 5 ± 3 (3) | 16 ± 7 (3) |
 |
CTM2/4/5/6 | 4 ± 1 (3) | 8 ± 1 (3) |
 |
CTM1/2/4/5/7 | 176 ± 10 (5) | 649 ± 28 (3) |
 |
CTM2-7 | 5 ± 1 (4) | 86 ± 26 (3) |
 |
CTM1-6 | 6 ± 2 (4) | 143 ± 14 (3) |
 |
CTM2-6 | 4 ± 1 (4) | 29 ± 2 (3) |
Cell surface expression levels of rat TA1, rat Taar4 and chimeric constructs were measured by a cell surface elisa. Specific optical density (OD) readings are given as percentage of HA-tagged rat TA1. The non-specific OD value (empty vector) was 0.0018 ± 0.0005 (set 0%) and the OD value of the HA-tagged rat TA1 was 0.0836 ± 0.0208 (set 100%). Total expression levels of rat TA1, rat Taar4 and chimeric constructs were measured by a sandwich elisa. Specific OD readings are given as a percentage of HA-tagged rat TA1. The non-specific OD value (empty vector) was 0.031 ± 0.002 (set 0%), and the OD value of the HA-tagged rat TA1 was 0.100 ± 0.020 (set 100%). The number of independent experiments, each carried out in triplicate, is given in parentheses.
Cell culture and functional assays
HEK-293 cells were grown in Minimum Essential Medium (MEM) supplemented with 10% FBS, 100 U mL−1 penicillin and 100 μg mL−1 streptomycin. COS-7 cells were cultured in DMEM supplemented with 10% FBS, 100 U mL−1 penicillin and 100 μg mL−1 streptomycin. Cells were maintained at 37°C in a humidified 7% CO2 incubator. One day prior to transfection, cells were split into 50 mL cell culture flasks (1.4 × 10⁶ HEK-293 cells per flask or 0.8 × 10⁶ COS-7 cells per flask). Lipofectamine™ 2000 (Invitrogen) was used for transient transfection. For the ALPHAScreen™ cAMP assay, cells were transfected with a total amount of 4 μg plasmid. For the CRE-SEAP (secreted alkaline phosphatase) reporter gene assay cells were co-transfected (3 μg of each) with the rat Taar1, rat Taar4 or chimeric Taar expression plasmid and the CRE-SEAP reporter plasmid (Clontech, Saint-Germain-en-Laye, France). SEAP reporter gene assays, analysing function in correlation to increasing amounts of Taar expression plasmid, were performed in 96-well plates (4 × 10⁴ HEK-293 cells per well), and cells were transfected with 0.2 μg DNA per well (0.1 μg SEAP reporter plasmid and 0.025 μg Taar/0.075 μg pcDps, 0.05 μg/0.05 μg pcDps or 0.1 μg Taar). To measure inositol phosphate (IP) formation, COS-7 cells were split into 12-well plates (1.2 × 10⁵ cells per well) and transfected with a total amount of 0.6 μg of plasmid DNA per well. In case of co-transfection with chimeric G-protein 0.12 μg GαΔ6qi4myr (abbreviated ΔGqi) (generous gifts of Professor Evi Kostenis, Bonn; Kostenis, 2001) and 0.48 μg plasmid encoding receptor were transfected. For immunofluorescence studies, COS-7 cells (1.0 × 10⁵ cells per well) were seeded into six-well plates containing sterilized glass coverslips and co-transfected (0.75 μg of each) with selected receptor construct and bovine β-arrestin-2-GFP (generous gift of Professor Martin Lohse, Würzburg).
ALPHAScreen™ cAMP assay
cAMP content of cell extracts was determined by a non-radioactive cAMP accumulation assay based on the ALPHAScreen™ technology according to the manufacturers' protocol (Perkin Elmer LAS, Rodgau-Jügesheim, Germany). One day after transfection, cells were split into 48-well plates (8 × 10⁴ HEK-293 cells per well). Stimulation with various agonist concentrations was performed in duplicate 48 h after transfection. Reactions were stopped by aspiration of media, and cells were lysed in 50 μL of lysis buffer containing 1 mM 3-isobutyl-1-methylxanthine. From each well, 5 μL of lysate was transferred to a 384-well plate. Acceptor beads (in stimulation buffer without 3-isobutyl-1-methylxanthine) and donor beads were added according to the manufacturers' protocol.
CRE-SEAP reporter gene assay
One day after transfection, cells were split into 96-well plates (4 × 10⁴ HEK-293 cells per well), and serum-free medium with no and increasing concentrations of compounds was added in triplicate the following day. Cells were incubated for 24 h at 37°C and then for 2 h at 65–70°C. An aliquot of the supernatant from each well was then incubated (2–5 min, 21°C) with an equal volume of 1.2 mM 4-methylumbelliferyl phosphate (Sigma-Aldrich, Seelze, Germany) in 2 M diethanolamine bicarbonate with 1 mM MgCl2 and 4.5 mg mL−1 l-homoarginine (pH 10) and fluorescence was measured with a Victor 2–1420 Multilabel counter (Perkin Elmer LAS, Rodgau-Jügesheim, Germany).
Determination of intracellular IP accumulation
Three days after transfection, COS-7 cells were incubated with 74 kBq mL−1 of myo-[3H]inositol (18.6 Ci mmol−1, PerkinElmer Life Sciences) for 18 h. Thereafter, cells were washed once with serum-free DMEM containing 10 mM LiCl followed by incubation for 1 h at 37°C. Agonist-induced increases in intracellular IP levels were determined by anion exchange chromatography as described in Berridge (1983).
Data were analysed using GraphPad Prism version 5.01 for Windows (GraphPad Software, San Diego, CA, http://www.graphpad.com).
Elisa
A direct cellular elisa was used to estimate cell surface expression of N-terminal HA-tagged receptor constructs. For elisa, COS-7 cells were used because of higher expression levels needed for immunological detection of receptor proteins and better attachment of COS-7 cells during washing steps in cell surface elisa. Briefly, COS-7 cells were seeded into 48-well plates (4 × 10⁴ cells per well) and transfected the following day with 0.2 μg DNA per well and 0.5 μL Lipofectamine™ 2000 per well (Invitrogen) according to the manufacturers' protocol. Two days after transfection, cells were formaldehyde-fixed (20 min, room temperature), without disrupting the cell membrane and incubated in blocking solution (DMEM with 10% FBS) for 1 h at 37°C. Cells were then incubated with anti-HA-peroxidase high-affinity rat monoclonal antibody (3F10, Roche Molecular Biochemicals, Mannheim, Germany). After removal of excess unbound antibody by extensive washing, H2O2 and o-phenylenediamine (2.5 mM each in 0.1 M phosphate–citrate buffer, pH 5.0) were added to serve as substrate and chromogen respectively. After 15 min, the enzyme reaction was stopped by adding 1 M H2SO4 containing 0.05 M Na2SO4, and colour development was measured bichromatically at 492 and 620 nm using an elisa reader (TECAN Sunrise plate reader, Crailsheim, Germany). To assess total receptor expression of full-length HA and FLAG double-tagged Taar constructs, a ‘sandwich elisa’ was used as described in Schoneberg et al. (1998). In brief, transfected cells were harvested from 6 cm dishes, and membrane preparations were solubilized in lysis buffer (10 mM Tris–HCl, pH 7.4, 150 mM NaCl, 1 mM DTT, 1 mM EDTA, 1% desoxycholate, 1% Nonidet P-40, 0.2 mM PMSF, 10 μg mL−1 aprotinin) overnight. Microtiter plates (Maxi Sorp, Nunc Immuno plates, Nunc) were coated with a monoclonal antibody directed against the C-terminal FLAG tag (10 mg mL−1 in 0.05 M borate buffer, M2 antibody; Sigma). After incubation with the membrane solubilizates, bound full-length Taar proteins were detected with a peroxidase-labelled anti-HA monoclonal antibody (3F10, Roche Molecular Biochemicals, Mannheim, Germany) (see above).
Immunofluorescence
Studies of immunofluorescence were carried out to examine internalization of rat TA1 and rat Taar4 upon stimulation (20 min at 37°C) with 50 μM tryptamine. Arginine vasopressin receptor 2 (AVPR2, NCBI Reference Sequence: NM_019404.1) stimulated with 10 nM of arginine vasopressin (20 min 37°C) served as positive control. For immunofluorescence, staining cells were fixed 48 h after transfection, permeabilized with 0.5% Triton X-100 in PBS (PBS-TX) and probed with a monoclonal anti-FLAG antibody (Sigma; 10 μg mL−1 F9291 in PBS-TX). The primary mouse antibody was detected using an anti-mouse-IgG TRITC (Sigma, T2402) as secondary antibody. Fluorescence images were obtained with a confocal laser-scanning microscope (LSM 510; Carl Zeiss Jena, Jena, Germany).
Results and Discussion
Different cell surface expression levels probably cause functional differences between rat TA1 and Taar4
The structure–function relationships in TA1 and molecular causes of species-specific differences in its pharmacology have been extensively studied (Borowsky et al., 2001; Bunzow et al., 2001; Lindemann and Hoener, 2005b; Reese et al., 2007; Wainscott et al., 2007; Hu et al., 2009). However, little is known about the other Taar subtypes probably because of difficulties in their experimental testing. For example, the TA1 agonists β-PEA and tryptamine are very low efficient agonists activating mouse and rat Taar4 orthologs through the Gαs-protein/AC pathway (Borowsky et al., 2001; Liberles and Buck, 2006; Staubert et al., 2010). These different pharmacological properties may be caused by structural differences between the two Taar subtypes. Both receptors exhibit approximately 47% identity (Figure 1) at the amino acid level, an identity where other GPCR subtypes still share similar binding and signal transduction properties (e.g. 47% identity between muscarinic M1 and M3 acetylcholine receptors and 46% identity between β1 and β2 adrenoceptors). Mammalian orthologs of TA1 and Taar4 show high conservation at the amino acid level and present 80.7% and 83.0% identity respectively (Figure S1, Table S4).
Figure 1.
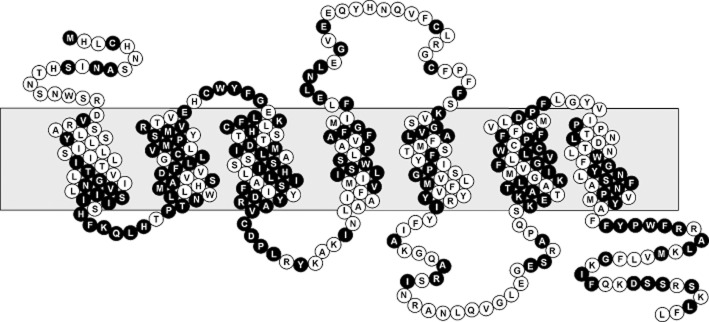
Snake plot of rat TA1. Positions highlighted in black are identical (46.8% identity) between rat TA1 and rat Taar4.
Transient expression of N-terminally HA-tagged rat TA1 in COS-7 cells followed by a direct cellular elisa revealed reasonable cell surface expression (Table 1). In contrast, cell surface expression of rat Taar4 was 10-fold lower compared to TA1. To control that low cell surface expression is not due to a lack of protein synthesis or degradation, we first performed immunoprecipitation of double tagged (HA and FLAG) full-length rat Taar with an anti-FLAG antibody and detection via anti-HA-peroxidase antibody in Western blot. As well known for many other GPCR (reviewed in Javitch, 2004), both rat TA1 and Taar4 appeared as high molecular weight species due to SDS-resistant oligomer formation (data not shown). Therefore, quantity of full-length receptor protein was determined using sandwich elisa. This capture assay measures full-length receptor proteins containing an N-terminal HA-tag and a C-terminal FLAG-tag. We found that rat Taar4 was approximately threefold higher expressed compared with TA1 (Table 1).
Next, we asked whether the N-terminal fusion of the first 20 amino acids of bovine rhodopsin (RHOD-tag) increases the cell surface expression of rat Taar4 as shown before for mouse Taar4 (Liberles and Buck, 2006). Cell surface expression of rat TA1 was about sevenfold increased compared with no RHOD-tag (Table 1). However, there was no significant influence on rat Taar4 plasma membrane expression (Table 1).
Rat TA1 and Taar4 have both been shown to be activated by β-PEA (Borowsky et al., 2001). In our heterologous expression system and cAMP assays, rat TA1 showed robust β-PEA-induced cAMP formation, whereas cAMP levels of rat Taar4-transfected HEK-293 cells remained unchanged (Table 2, Figure 2). Using the more sensitive CRE-SEAP assay, rat Taar4- and RHOD-tagged Taar4-transfected HEK-293 cells responded upon β-PEA stimulation (Figure 2, Table 3). Rat TA1 and Taar4 significantly differed in plasma membrane expression, which probably causes the differences in their signal transduction abilities.
Table 2.
Functional characterization of rat TA1, Taar4 and chimeras
| β-PEA | p-tyramine | Tryptamine | |||||
|---|---|---|---|---|---|---|---|
| Basal cAMP (fold over control) | Emax (fold over control) | EC50 (μM) | Emax (fold over control) | EC50 (μM) | Emax (fold over control) | EC50 (μM) | |
| rat TA1 | 2.0 ± 0.2 (40) | 10.7 ± 1.0 (14) | 0.44 ± 0.06 | 13.8 ± 2.0 (13) | 0.18 ± 0.04 | 13.8 ± 2.2 (13) | 0.56 ± 0.10 |
| rat Taar4 | 1.4 ± 0.1 (15) | 1.4 ± 0.3 (7) | – | 1.4 ± 0.4 (4) | – | 1.4 ± 0.4 (4) | – |
| CTM1-3 | 1.1 ± 0.1 (16) | 1.2 ± 0.2 (6) | – | 1.2 ± 0.2 (5) | – | 1.5 ± 0.2 (5) | – |
| CTM4-7 | 1.3 ± 0.1 (11) | 1.1 ± 0.2 (3) | – | 1.4 ± 0.5 (4) | – | 1.6 ± 0.7 (4) | – |
| CTM1 | 0.7 ± 0.1 (10) | 0.8 ± 0.4 (4) | – | 0.8 ± 0.2 (3) | – | 1.4 ± 0.5 (3) | – |
| CTM2 | 2.8 ± 0.3 (27) | 37.9 ± 8.8 (11) | 0.34 ± 0.07 | 19.0 ± 2.7 (11) | 0.07 ± 0.01 | 24.3 ± 4.8 (5) | 0.32 ± 0.08 |
| CTM3 | 1.1 ± 0.2 (9) | 0.9 ± 0.4 (3) | – | 1.5 ± 0.6 (3) | – | 1.4 ± 0.4 (3) | – |
| CTM4 | 2.4 ± 0.1 (25) | 29.3 ± 6.3 (10) | 0.52 ± 0.09 | 22.4 ± 3.0 (8) | 0.20 ± 0.04 | 18.7 ± 3.0 (7) | 1.30 ± 0.55 |
| CTM5 | 2.6 ± 0.1 (26) | 27.5 ± 4.9 (10) | 0.19 ± 0.04 | 20.2 ± 2.5 (8) | 1.53 ± 0.03 | 16.7 ± 2.0 (8) | 1.30 ± 0.37 |
| CTM6 | 1.0 ± 0.1 (15) | 1.0 ± 0.3 (5) | – | 1.0 ± 0.3 (5) | – | 1.2 ± 0.3 (5) | – |
| CTM6i | 1.0 ± 0.1 (9) | 3.0 ± 0.6 (3) | 17.61 ± 0.07 | 2.9 ± 0.7 (3) | 10.93 ± 1.59 | 4.2 ± 1.1 (3) | 17.31 ± 8.66 |
| CTM6o | 0.8 ± 0.1 (6) | 2.1 ± 0.7 (2) | 27.70 ± 7.92 | 2.8 ± 0.1 (2) | 26.62 ± 9.26 | 2.3 ± 0.1 (2) | 44.32 ± 1.10 |
| CTM7 | 1.2 ± 0.1 (11) | 3.3 ± 0.9 (3) | 3.70 ± 0.91 | 2.7 ± 0.7 (4) | 1.80 ± 0.77 | 3.1 ± 1.0 (4) | 1.53 ± 0.20 |
| CTM1/7 | 1.0 ± 0.1 (7) | 2.1 ± 0.1 (3) | 3.46 ± 0.85 | 2.3 ± 0.2 (2) | 16.56 ± 9.63 | 2.4 ± 0.5 (2) | 10.55 ± 3.58 |
| CTM2/3 | 0.9 ± 0.4 (3) | 0.9 ± 0.3 (3) | – | 0.9 ± 0.4 (3) | – | 1.2 ± 0.4 (3) | – |
| CTM2/4 | 2.4 ± 0.1 (18) | 31.9 ± 6.1 (6) | 0.41 ± 0.10 | 29.5 ± 7.2 (6) | 0.29 ± 0.13 | 30.9 ± 10.3 (6) | 1.32 ± 0.40 |
| CTM2/5 | 2.8 ± 0.2 (19) | 41.4 ± 8.2 (7) | 0.21 ± 0.07 | 40.8 ± 6.5 (6) | 1.73 ± 0.50 | 34.2 ± 5.1 (6) | 0.69 ± 0.16 |
| CTM3/6 | 1.2 ± 0.4 (3) | 0.8 ± 0.3 (3) | – | 0.7 ± 0.2 (3) | – | 1.3 ± 0.4 (3) | – |
| CTM4/5 | 1.9 ± 0.1 (13) | 34.8 ± 8.5 (5) | 0.35 ± 0.04 | 16.9 ± 5.8 (4) | 3.50 ± 0.48 | 19.5 ± 8.4 (4) | 1.62 ± 0.69 |
| CTM2/4/5 | 2.0 ± 0.3 (15) | 37.1 ± 6.5 (7) | 0.91 ± 0.19 | 32.7 ± 7.7 (4) | 22.49 ± 8.77 | 36.4 ± 7.7 (4) | 2.84 ± 0.54 |
| CTM2/3/4/5 | 0.4 ± 0.1 (3) | 0.3 ± 0.1 (3) | – | 0.4 ± 0.2 (3) | – | 0.3 ± 0.1 (3) | – |
| CTM2/4/5/6 | 0.7 ± 0.2 (3) | 0.6 ± 0.1 (3) | – | 0.6 ± 0.2 (3) | – | 0.8 ± 0.1 (3) | – |
| CTM1/2/4/5/7 | 1.7 ± 0.2 (6) | 7.5 ± 0.1 (2) | 18.09 ± 1.43 | 2.3 ± 0.5 (2) | – | 9.7 ± 2.0 (2) | 27.96 ± 7.03 |
| CTM2-7 | 0.6 ± 0.1 (3) | 1.2 ± 0.1 (3) | – | 1.2 ± 0.2 (3) | – | 1.0 ± 0.2 (3) | – |
| CTM1-6 | 1.3 ± 0.5 (3) | 1.1 ± 0.5 (3) | – | 1.2 ± 0.5 (3) | – | 0.7 ± 0.3 (3) | – |
| CTM2-6 | 1.4 ± 0.3 (3) | 1.3 ± 0.3 (3) | – | 1.0 ± 0.4 (3) | – | 1.4 ± 0.5 (3) | – |
HEK-293 cells were transfected with receptor constructs and agonist-induced cAMP accumulation was determined with the ALPHAScreen™ technology (see Experimental procedures). The basal cAMP level of non-stimulated mock-transfected HEK-293 (control) was 8.75 ± 1.38 amol per cell. Emax and EC50 values were determined from concentration–response curves of agonists (agonists 10 nM – 100 μM) using GraphPad Prism. Data are given as mean ± SEM of 2–14 independent experiments (number indicated in parenthesis), each performed in duplicates.
Figure 2.
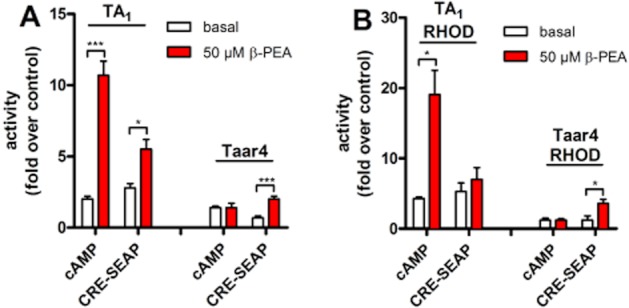
Functional characterization of rat TA1 and Taar4 in cAMP and CRE-SEAP assays. (A) HEK-293 cells were transfected with rat TA1 and rat Taar4 and agonist-induced activation was determined with the ALPHAScreen™ technology (cAMP) or using a CRE-SEAP assay (see Experimental Procedures). (B) To increase plasma membrane targeting Taar were N-terminally tagged with the first 20 amino acids of rhodopsin (RHOD-TA1, RHOD-Taar4). Receptor activities, under basal and agonist-stimulated conditions, are given as x-fold over non-stimulated mock-transfected HEK-293. Emax values were determined from stimulation with 50 μM of β-PEA. Data are given as mean ± SEM of at least three independent experiments each performed in triplicates. Unpaired t-tests were performed using GraphPad Prism version 5.01 for Windows (GraphPad Software, San Diego, CA, http://www.graphpad.com). ***P < 0.001, **P < 0.01, *P < 0.05.
Table 3.
Functional characterization of rat TA1, rat Taar4 and chimeras in HEK-293 cells using a CRE-SEAP reporter gene assay
| Basal SEAP activity (fold over negative control) | β-PEA | ||
|---|---|---|---|
| Emax (fold over negative control) | EC50 (μM) | ||
| rat TA1 | 2.4 ± 0.3 | 4.7 ± 0.7 (5) | 0.16 ± 0.05 |
| rat Taar4 | 0.7 ± 0.1 | 2.0 ± 0.2 (11) | 2.50 ± 0.83 |
| CTM1-3 | 0.7 ± 0.1 | 5.0 ± 7.7 (5) | 49.77 ± 14.51 |
| CTM4-7 | 1.5 ± 0.1 | 1.7 ± 0.1 (3) | – |
| CTM1 | 1.2 ± 0.1 | 6.6 ± 0.3 (3) | 14.74 ± 2.13 |
| CTM2 | 4.7 ± 0.8 | 5.0 ± 0.2 (3) | – |
| CTM3 | 0.4 ± 0.1 | 1.8 ± 0.2 (3) | 10.03 ± 2.85 |
| CTM4 | 4.2 ± 0.6 | 7.7 ± 0.8 (3) | 0.51 ± 0.20 |
| CTM5 | 2.6 ± 0.7 | 5.1 ± 0.7 (4) | 0.13 ± 0.03 |
| CTM6 | 1.2 ± 0.1 | 2.2 ± 0.2 (2) | 41.82 ± 5.79 |
| CTM6i | 1.6 ± 0.1 | 7.8 ± 0.2 (2) | 0.96 ± 0.21 |
| CTM6o | 0.9 ± 0.1 | 4.4 ± 0.1 (2) | 2.55 ± 1.35 |
| CTM7 | 1.4 ± 0.3 | 5.1 ± 0.3 (3) | 0.42 ± 0.04 |
| CTM1/7 | 0.8 ± 0.3 | 4.6 ± 2.1 (2) | 13.91 ± 0.05 |
| CTM2/4 | 2.6 ± 0.7 | 5.1 ± 0.7 (3) | 0.13 ± 0.03 |
| CTM2/5 | 3.6 ± 0.7 | 6.6 ± 1.0 (3) | 0.03 ± 0.01 |
| CTM4/5 | 3.1 ± 0.5 | 7.2 ± 1.0 (3) | 1.06 ± 0.09 |
| CTM2/4/5 | 2.2 ± 0.6 | 8.4 ± 1.5 (3) | 0.07 ± 0.02 |
| CTM1/2/4/5/7 | 0.9 ± 0.1 | 4.8 ± 0.7 (2) | 1.19 ± 0.31 |
HEK-293 cells were transiently co-transfected with CRE-SEAP reporter plasmid (Clontech) and respective receptor construct and tested for agonist-induced SEAP activity. The basal value of non-stimulated mock-transfected HEK-293 determined was 184 125 ± 28 625 cpm per well. Data are given as mean ± SEM of 2–11 independent experiments, each performed in triplicates. Emax and EC50 values were determined from concentration–response curves of agonists (agonists 10 nM – 100 μM) using GraphPad Prism.
Transmembrane helices 3 and 6 of rat TA1 rescue cell surface expression and function of rat Taar4
To identify determinants causing trafficking deficiency of rat Taar4, chimeras with rat TA1 were systematically generated (Table S3). As shown in Table 1, all constructs except CTM1 containing both, TM3 and TM6 of rat TA1 (CTM2, CTM4, CTM5, CTM7, CTM1/7, CTM2/4, CTM2/5, CTM4/5, CTM2/4/5, CTM1/2/4/5/7), showed high cell surface expression levels. Cell surface expression of CTM1 was restored by additional exchange of TM7 (CTM1/7), suggesting that interaction of TM1 and TM7 is crucial for rat TA1 trafficking. In contrast, all constructs containing TM3 and/or TM6 of rat Taar4 (CTM1-3, CTM4-7, CTM3, CTM6, CTM2/3, CTM3/6, CTM2/3/4/5, CTM4/5, CTM2/4/5/6, CTM2-7, CTM1-6, CTM2-6) were poorly delivered to the cell surface (Table 1). To analyse whether low cell surface expression is due to a lack of receptor protein expression, a total cellular elisa was performed. Except of CTM2-6, CTM2/3/4/5 and CTM2/4/5/6 all constructs are expressed at high levels in the cell (Table 1). Determinants in TM1 and TM7 of rat Taar4 are likely responsible for higher total expression levels compared with rat TA1. CTM1, CTM7 exhibited three- to fourfold, CTM1/7 and CTM1/2/4/5/7 six- to sevenfold higher total expression levels in comparison with rat TA1. In accordance, CTM2-6 showed only 30% of rat TA1 total expression. To analyse whether only one or multiple positions of e.g. TM6 contribute to intracellular retention, the N-terminal (CTM6i) and the C-terminal (CTM6o) halves of TM6 of rat Taar4 were introduced into rat TA1. As shown in Table 1, both chimeric constructs were retained intracellularly, indicating that multiple determinants within TM6 of rat Taar4 were responsible for construct retention.
All constructs were expressed in HEK-293 cells and functionally tested in cAMP assays. Most chimera presenting high cell surface expression (CTM2, CTM4, CTM5, CTM2/4, CTM2/5, CTM4/5, CTM2/4/5, CTM1/2/4/5/7) responded with robust cAMP formation upon β-PEA stimulation (Emax values in Table 2). In most cases, high cell surface expression correlated with increased basal activity, a property seen also in COS-7 cells (Table 4). Additionally, CTM1/7, CTM7, CTM6i and CTM6o displayed some activity following β-PEA stimulation.
Table 4.
Functional characterization of rat TA1, Taar4 and chimeras in COS-7 cells using a cAMP accumulation assay
| Basal cAMP (fold over negative control) | β-PEA | ||
|---|---|---|---|
| Emax (fold over negative control) | EC50 (μM) | ||
| rat TA1 | 7.3 ± 0.7 | 11.4 ± 1.3 (4) | 1.09 ± 0.43 |
| rat Taar4 | 0.5 ± 0.1 | 0.7 ± 0.2 (6) | – |
| CTM1-3 | 0.6 ± 0.1 | 0.7 ± 0.3 (2) | – |
| CTM4-7 | 0.7 ± 0.1 | 0.7 ± 0.3 (2) | – |
| CTM1 | 1.4 ± 0.2 | 5.3 ± 2.1 (2) | 21.21 ± 8.14 |
| CTM2 | 8.0 ± 0.5 | 13.9 ± 2.2 (4) | 0.23 ± 0.10 |
| CTM3 | 0.8 ± 0.1 | 0.6 ± 0.1 (2) | – |
| CTM4 | 4.3 ± 0.3 | 8.4 ± 3.4 (3) | 0.12 ± 0.03 |
| CTM5 | 7.8 ± 0.4 | 15.3 ± 3.5 (3) | 0.30 ± 0.11 |
| CTM6 | 1.0 ± 0.1 | 4.2 ± 1.7 (2) | 42.99 ± 17.40 |
| CTM6i | 1.9 ± 0.1 | 7.4 ± 2.7 (3) | 20.30 ± 7.13 |
| CTM6o | 1.5 ± 0.2 | 4.1 ± 1.0 (3) | 2.30 ± 0.84 |
| CTM7 | 1.0 ± 0.1 | 9.8 ± 0.2 (2) | 4.31 ± 2.69 |
| CTM1/7 | 0.7 ± 0.1 | 6.7 ± 2.4 (2) | 4.06 ± 2.93 |
| CTM2/4 | 7.2 ± 0.4 | 16.3 ± 5.5 (2) | 0.36 ± 0.04 |
| CTM2/5 | 12.5 ± 0.9 | 39.6 ± 14.4 (2) | 0.52 ± 0.05 |
| CTM4/5 | 7.2 ± 0.5 | 20.5 ± 4.5 (2) | 0.53 ± 0.23 |
| CTM2/4/5 | 4.6 ± 0.4 | 19.8 ± 5.6 (4) | 0.37 ± 0.12 |
| CTM1/2/4/5/7 | 2.6 ± 0.5 | 7.4 ± 2.8 (2) | 8.75 ± 0.27 |
For functional characterization COS-7 cells were transiently transfected with rat TA1, rat Taar4 or TA1-Taar4 chimeras, and non-radioactive cAMP assays were performed as described in Experimental procedures. Emax and EC50 values were determined from concentration–response curves of agonists (agonists 10 nM – 1 μM) using GraphPad Prism. Data are presented as mean ± SEM. of two to six independent experiments (number indicated in parentheses), each carried out in duplicate. cAMP levels (32.3 ± 5.6 amol per cell) of non-stimulated empty vector served as basal values.
In summary, our data clearly showed that rat Taar4 gained cell surface expression and signalling when both TM3 and TM6 of rat TA1 were introduced. This indicates that these helices of rat Taar4 contain some retention signals.
Rat TA1 and Taar4 present a similar pharmacological profile
The low cell surface expression (Table 1) and functionality only in the CRE-SEAP assay (Figure 2, Table 3) did not allow for comparison of agonist potencies between wild-type rat TA1 and Taar4. Therefore, only the response to one high concentration (10 μM) of a number of TA1 agonists was tested at rat Taar4 and chimeric constructs. As shown in Figure 3A, rat Taar4 did not respond to any TA1 agonists tested. All chimeras presenting high cell surface expression (Table 1) showed a very similar efficacy profile for TA1 agonists when compared with rat TA1 (Figure 3D: CTM4, CTM5; Figure 3E: CTM2/4, CTM2/5, Figure 3F: CTM2, CTM4/5, Figure 3G: CTM2/4/5). Also, lower expressed constructs (Figure 3B: CTM7, CTM1/7, Figure 3C: CTM6i, CTM6o) showed similar efficacy profiles as rat TA1 but at lower Emax levels. However, some differences in ligand specificities between chimeras were obtained. When stimulated with 10 μM β-PEA or tryptamine, all chimeras reasonably expressed at the cell surface except of CTM1/2/4/5/7 showed a robust response. However, β-PEA and tryptamine showed a 41-fold and 50-fold reduced potency, respectively, at CTM1/2/4/5/7 compared with rat TA1 (see Table 2).
Figure 3.
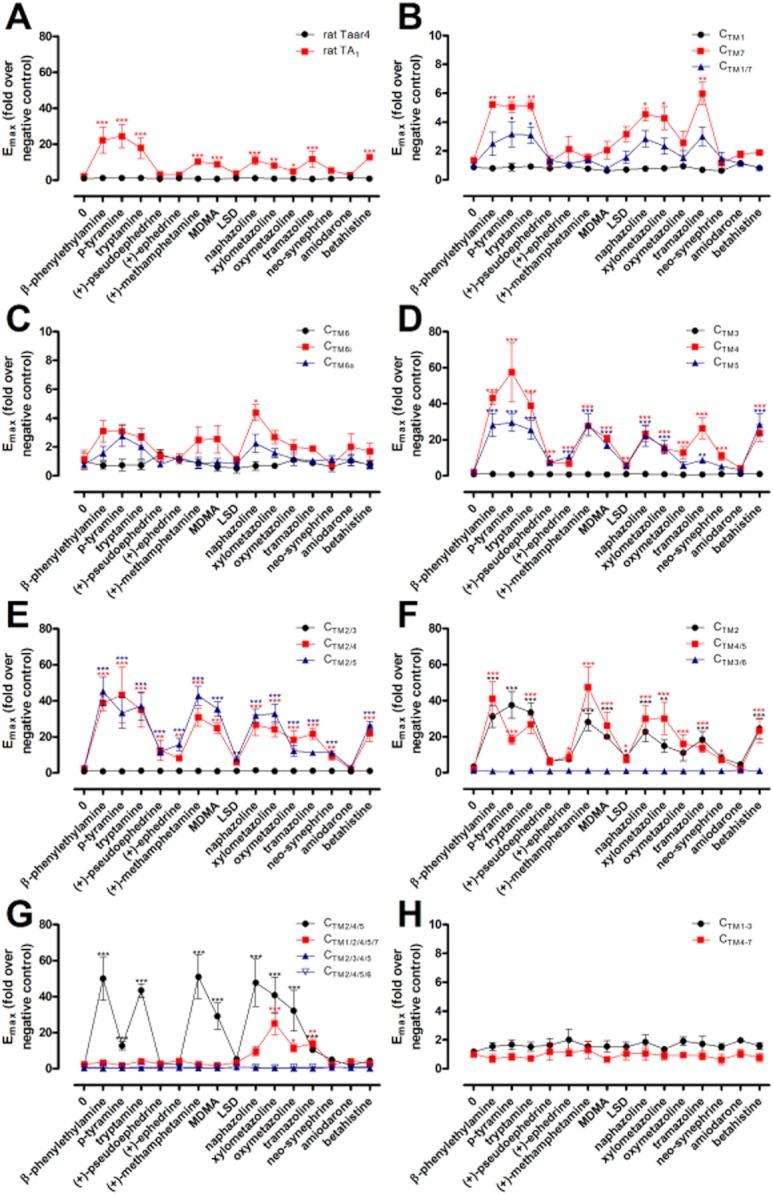
Ligand profiling of rat TA1, Taar4 and chimeras. HEK-293 cells were transfected with receptor constructs and agonist-induced cAMP accumulation was determined with the ALPHAScreen™ technology (see Experimental Procedures). The basal cAMP level of non-stimulated mock-transfected HEK-293 was 8.75 ± 1.38 amol per cell. Emax values were determined from stimulation with 10 μM of respective substance (except LSD: 1 μM). Data are given as mean ± SEM of 3–5 independent experiments each performed in duplicate. All Emax values are shown in Supplementary Table S5. One-way anova of log data was performed followed by Dunnett's multiple comparison test to determine the statistical significance of each agonist-induced signal in comparison with the signal of respective unstimulated receptor construct using GraphPad Prism version 5.01 for Windows (GraphPad Software, http://www.graphpad.com). ***P < 0.001, **P < 0.01, *P < 0.05.
(+)-Pseudoephedrine and (+)-ephedrine activated rat TA1 to very low extent. Both substances also activated chimera CTM2, CTM4, and CTM5. However, this property was lost in CTM2/4/5, indicating that activation by (+)-pseudoephedrine and (+)-ephedrine is more specific for rat TA1. In contrast, CTM2/4/5 but not CTM1/7 and CTM1/2/4/5/7 were activated by (+)-methamphetamine, MDMA and betahistine. Naphazoline, xylometazoline, oxymetazoline and tramazoline still activated CTM1/7, CTM2/4/5 and CTM1/2/4/5/7, suggesting that Taar4 preferentially recognizes imidazoline derivatives (Figure 3). This indicates that these TMs determine some specificity for surrogate agonists but not for the trace amines β-PEA and tryptamine. One should note that we measured only receptor activation using cAMP accumulation assays. Loss of receptor activation by a certain substance at a certain chimera does not exclude that the substance still binds to the receptor construct.
For β-PEA, p-tyramine and tryptamine potencies were determined for all functional constructs. Introduction of TM2, TM4, TM5 and TM7 of rat Taar4 had no gross effects on potencies (EC50 variability <10-fold) of these ligands in HEK-293 (see Table 2) and COS-7 cells (see Table 4), whereas CTM6i and CTM6o significantly shifted the concentration–response curve of all agonists to higher EC50 values. Also the combination of several TM led to higher EC50 values most significant for CTM1/7, CTM2/4/5 and CTM1/2/4/5/7. It is of interest to note that some agonist-specific changes in potency were observed for some constructs. For example, β-PEA and tryptamine showed only minor increases in EC50 values (two- to fivefold) at CTM2/4/5, whereas EC50 value of p-tyramine was 125-fold shifted towards higher concentration. This indicates that major parts of the binding pockets for p-tyramine and β-PEA are overlapping but obviously not identical.
Because the agonist profiles showed only minor differences between chimeras, one can assume that the ability to stimulate Taar constructs correlates with cell surface expression. With sensitive assays and at very high expression levels, rat Taar4 was activated by β-PEA (Figure 2, Table 3) and tryptamine (Bunzow et al., 2001; Staubert et al., 2010). Consequently, the functional differences between rat TA1 and rat Taar4 (see Figure 2) are most probably caused by intracellular retention of Taar4. Generally, the binding site of aminergic GPCR is mainly composed of residues of TM3, TM5, TM6 and TM7 (Bridges and Lindsley, 2008; Cherezov et al., 2007; Rosenbaum et al., 2007). In fact, Asp3.32 (relative numbering system of GPCR based on Ballesteros and Weinstein, 1995), which acts as the counterion in aminergic GPCR for the charged amine residue of the ligands, is identical in rat TA1 and rat Taar4 and conserved among mammalian Taar orthologs. The same is true for Phe6.51 and Phe6.52, which interact with the catechol ring of the ligands (Strader et al., 1989a,b; Strader et al., 1994; Wieland et al., 1996; Strader et al., 1988; Zuurmond et al., 1999; Liapakis et al., 2000; Shi and Javitch, 2002a). All residues that are supposed to be involved in the rotamer toggle switch model of aminergic GPCR (Ballesteros et al., 2001; Shi et al., 2002b; Yao et al., 2006; Tan et al., 2008) are identical between rat TA1 and Taar4 and highly conserved among mammalian orthologs (Asp3.49, Arg3.50, Glu6.30, Trp6.48, Pro6.50, Phe6.52). Furthermore, some ligands are recognized by both Taar and adrenoceptors (Kleinau et al., 2011), supporting a high conservation of the binding pocket.
In a recent study, residue Asn7.39 of TA1 was shown to control the specificity for the β-phenyl ring of TA1 ligands (Tan et al., 2009). However, we observe only minor differences in β-PEA EC50 for chimeras containing TM7 of rat Taar4 (Leu7.39), supporting the finding of Kleinau et al. (2011) that this position cannot be assumed crucial for activation by β-PEA. It has been suggested that p-tyramine is probably binding to rat TA1 with its hydroxyl group engaged in hydrogen bond interactions with Ser5.46 (Tan et al., 2009). This residue is 100% conserved among all mammalian TA1 orthologs, and rat Taar4 exhibits an Ala5.46, which is also conserved among mammals. This may be the reason for the decreased ability of p-tyramine recognition of all chimeras with TM5 of rat Taar4.
Signalling properties of rat TA1 and Taar4
Activation of rat Taar4 was only detected in CRE-SEAP reporter gene assays (Figure 2, Table 3). We assumed that the high sensitivity of this reporter gene assay system accounts for these findings. We additionally performed cAMP accumulation assays in COS-7 cells, which give higher expression levels of our receptor constructs compared with HEK-293. This is due to the SV40 promoter in the pcDps vector (Okayama and Berg, 1983). Thereby, we obtained activation by β-PEA of chimeras with comparable (e.g. CTM1) or even lower (e.g. CTM6) cell surface expression levels than rat Taar4 (like, e.g. CTM6) (Table 1, Table 4). Activation of these chimeras by β-PEA was not found in transiently transfected HEK-293 cells (Table 2). In contrast, cAMP formation upon β-PEA stimulation was not detectable in COS-7 cells transiently transfected with CTM1-3, CTM4-7 and CTM3 (Table 4), although CTM1-3 and CTM3 activation by β-PEA was observed in CRE-SEAP reporter gene assays (Table 3). These findings suggest the involvement of another Gαs-independent signalling pathway activated by rat Taar4 upon agonist stimulation. That CRE-mediated reporter gene transcription can occur independent of Gαs through the MAPK pathway had been shown before for propranolol action at the β2 adrenoceptor (Baker et al., 2003). Gβγ subunits of activated Gαi-coupled receptors as well as PKC (activated through Gαq) can mediate activation of the MAPK pathway. Both can also be monitored by performing SRE- or NFAT-SEAP reporter gene assays (Cheng et al., 2010). However, we did not observe activation of SRE- or NFAT-SEAP reporter genes upon β-PEA stimulation of rat Taar4, although low increase in basal activity was detected (Figure S2). Rat TA1 exhibited a very high basal activity not only in CRE-SEAP, but also in SRE- and NFAT-SEAP assays, suggesting the involvement of Ca2+, PKC and MAPK in rat TA1 signalling independent of agonist stimulation. This high basal activity was not detected for CTM1/2/4/5/7 but a slight β-PEA-depended increase in SRE-SEAP co-expressing cells (Figure S2).
β-Arrestin can activate CREB directly or indirectly through activation of the MAPK cascade (Ma and Pei, 2007). We analysed the involvement of β-arrestin-2 by performing immunofluorescence studies. Before fixation transfected, cells were incubated for 20 min in absence or presence of agonist at 37°C. As well-established positive control (Rompler et al., 2006; Barak et al., 2008), we coexpressed β-arrestin-2 and the V2 vasopressin receptor (AVPR2), which present co-localization in vacuoles upon vasopressin (AVP) stimulation (Figure 4). Similarly, co-localization of rat TA1 and β-arrestin-2 in vacuoles was found after stimulation with tryptamine. No formation of internalization vacuoles was observed for stimulated rat Taar4 expressing COS-7 cells (Figure 4). However, rat Taar4 was mainly expressed in intracellular compartments, probably Golgi apparatus and endoplasmic reticulum and not detectable by immunofluorescence at the cell surface. This is comparable with our cell surface elisa data (Table 1) and explains the absence of any visible agonist-induced internalization of rat Taar4.
Figure 4.
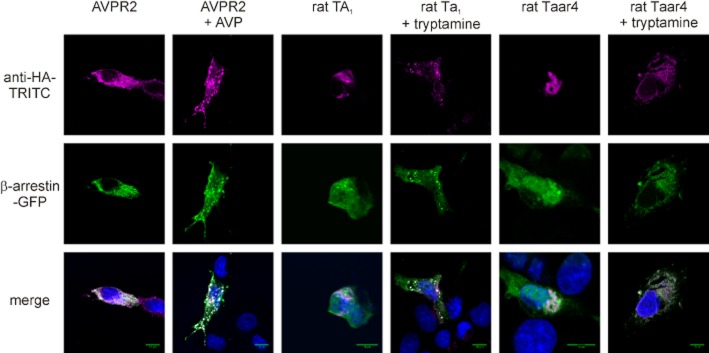
β-Arrestin-2-mediated desensitization of rat TA1 but not Taar4. COS-7 cells were cotransfected with bovine β-arrestin-2-GFP and HA-tagged versions of the V2 vasopressin receptor (AVPR2), rat TA1 or rat Taar4. Cells were fixed, permeabilized and HA-tagged GPCR were detected with an anti-HA monoclonal antibody and a secondary TRITC-labelled anti-mouse IgG antibody. For control purposes, AVPR2-transfected cells were incubated with 100 nM AVP for 20 min at 37°C prior to fixation. Cells transfected with rat TA1 or rat Taar4 were incubated with 50 μM tryptamine for 20 min at 37°C prior to fixation. Specific fluorescence of HA-tagged GPCR and GFP and the overlay of both plus DAPI are shown.
To further screen for pathway involved in Taar signalling, we analysed rat TA1 and Taar4 in classical IP assays, also in the presence of chimeric G-proteins (Kostenis et al., 2005). First, rat TA1 and Taar4 were studied for IP formation following agonist stimulation. As shown in Supplementary Figure S3A, no significant activation of the Gαq/PLC pathway was found. Gαi was monitored by co-transfecting a chimeric G-protein (GαΔ6qi4myr, abbreviated ΔGqi), which directs Gαi activation to the Gαq pathway. Only marginal IP formation was found upon tryptamine stimulation of both Taar (Figure S3B). Thus, our data clearly demonstrated that Gαs activation is the major signalling pathway upon stimulation of rat TA1 and Taar4. However, we cannot rule out the involvement of additional pathways in Taar signalling, leading to small increases in intracellular IP and calcium levels and/or MAPK activation. Due to their low cell surface expression levels, Taar signal transduction is still not completely understood, and further studies are required to ultimately clarify Taar signalling.
Conclusion
The different functionality of rat Taar subtypes 1 and 4 mainly correlates with receptor's cell surface expression rather than with specific amino acid residues involved in ligand binding specificity. This suggests that the repertoire of Taar subtypes most probably ensures functional redundancy, tissue- and cell-specific expression and/or different downstream signalling but not different agonist specificity. Taar therefore are in line with other aminergic GPCR presenting multiple subtypes such as adrenoceptors, dopamine, serotonin and histamine receptors. However, one question remains open: Why are Taar poorly expressed at the cell surface? It needs to be clarified whether cofactors or other receptors, as shown for odorant receptor (Bush and Hall, 2008; Matsunami et al., 2009), are required for proper cell surface expression of Taar or whether Taar may function intracellularly as suggested for the l-DOPA receptor OA1 (Lopez et al., 2008).
Acknowledgments
We are very grateful to Petra Krumbholz for excellent technical assistance, Thomas Hermsdorf for his help with Western blot and Simone Prömel for her help with the LSM. This work was supported by the Deutsche Forschungsgemeinschaft (Sfb610 and SPP1629).
Glossary
- AC
adenylyl cyclase
- TA1
trace amine receptor 1
- Taar
trace amine-associated receptor
- TM
transmembrane region
Conflict of Interest
None.
Supporting Information
Additional Supporting Information may be found in the online version of this article at the publisher's web-site:
Figure S1 Structural conservation of rat TA1 and rat Taar4. Amino acid sequences of rat TA1 and rat Taar4 are shown. Positions conserved in 27 mammalian species (Bos taurus, Choloepus hoffmanni, Cavia porcellus, Dasypus novemcinctus, Dipodomys ordii, Equus caballus, Erinaceus europaeus, Echinops telfairi, Felis catus, Loxodonta africana, Monodelphis domestica, Macropus eugenii, Myotis lucifugus, Macaca mulatta, Microcebus murinus, Mus musculus, Ornithorhynchus anatinus, Oryctolagus cuniculus, Papio hamadryas, Pongo pygmaeus, Pteropus vampyrus, Rattus norvegicus, Sorex araneus, Saguinus oedipus, Saimiri sciureus, Sus scrofa, Tupaia belangeri) are depicted in black. Positions that vary only by two amino acids are shown in gray. Positions given in white are not preserved during evolution. With 83.0% identity Taar4 is slightly higher conserved than TA1 (80.7%).
Figure S2 Functional characterization of rat TA1, rat Taar4 and CTM1/2/4/5/7 in SEAP reporter gene assays. Correlation of basal or stimulated receptor activity and the amount of transfected plasmid DNA. HEK-293 cells were transfected with 25, 50 or 100 ng of the indicated plasmid DNA per well in 96-well plate. The total amount of transfected plasmid DNA was constant since differences were compensated by addition of respective amount empty vector. (A–C) CRE-SEAP reporter gene assay in presence or absence of β-PEA. (D–F) SRE-SEAP reporter gene assay. (G–I) NFAT-SEAP reporter gene assay. SEAP activity is expressed as fold over basal levels of HEK-293 cells transfected with empty vector pcDps. Data are presented as mean ± SEM of two to four independent experiments, each carried out in triplicate.
Figure S3 Functional characterization of rat TA1 and rat Taar4 in IP assays. (A) IP accumulation in presence and absence of agonist. M3 muscarinic ACh receptor (NCBI Reference Sequence: NM_000740.2) served as positive control. (B) GαΔ6qi4myr (abbreviated ΔGqi) turns the Gαi-coupled signal into the Gαq pathway (PLC activation measured as PI turnover). M4 muscarinic ACh receptor (NCBI Reference Sequence: NM_000741.2) served as positive control.
Table S1 Primers used for rat Taar1 and rat Taar4 amplification and generation of chimeras.
Table S2 NCBI database accession numbers and sequence description.
Table S3 Detailed description of rat TA1-Taar4 chimeras generated in this study.
Table S4 Structural comparison of TA1 and Taar4 orthologs.
Table S5 Functional characterization of rat TA1, rat Taar4 and chimeras in HEK-293 cells using a cAMP accumulation assay.
References
- Baker JG, Hall IP, Hill SJ. Agonist and inverse agonist actions of beta-blockers at the human beta 2-adrenoceptor provide evidence for agonist-directed signaling. Mol Pharmacol. 2003;64:1357–1369. doi: 10.1124/mol.64.6.1357. [DOI] [PubMed] [Google Scholar]
- Ballesteros JA, Weinstein H. Integrated methods for the construction of three-dimensional models and computational probing of structure-function relations in G protein-coupled receptors. Methods Neurosci. 1995;25:366–428. [Google Scholar]
- Ballesteros JA, Jensen AD, Liapakis G, Rasmussen SG, Shi L, Gether U, et al. Activation of the beta 2-adrenergic receptor involves disruption of an ionic lock between the cytoplasmic ends of transmembrane segments 3 and 6. J Biol Chem. 2001;276:29171–29177. doi: 10.1074/jbc.M103747200. [DOI] [PubMed] [Google Scholar]
- Barak LS, Salahpour A, Zhang X, Masri B, Sotnikova TD, Ramsey AJ, et al. Pharmacological characterization of membrane-expressed human trace amine-associated receptor 1 (TAAR1) by a bioluminescence resonance energy transfer cAMP biosensor. Mol Pharmacol. 2008;74:585–594. doi: 10.1124/mol.108.048884. [DOI] [PMC free article] [PubMed] [Google Scholar]
- Berridge MJ. Rapid accumulation of inositol trisphosphate reveals that agonists hydrolyse polyphosphoinositides instead of phosphatidylinositol. Biochem J. 1983;212:849–858. doi: 10.1042/bj2120849. [DOI] [PMC free article] [PubMed] [Google Scholar]
- Borowsky B, Adham N, Jones KA, Raddatz R, Artymyshyn R, Ogozalek KL, et al. Trace amines: identification of a family of mammalian G protein-coupled receptors. Proc Natl Acad Sci U S A. 2001;98:8966–8971. doi: 10.1073/pnas.151105198. [DOI] [PMC free article] [PubMed] [Google Scholar]
- Bridges TM, Lindsley CW. G-protein-coupled receptors: from classical modes of modulation to allosteric mechanisms. ACS Chem Biol. 2008;3:530–541. doi: 10.1021/cb800116f. [DOI] [PubMed] [Google Scholar]
- Bunzow JR, Sonders MS, Arttamangkul S, Harrison LM, Zhang G, Quigley DI, et al. Amphetamine, 3,4-methylenedioxymethamphetamine, lysergic acid diethylamide, and metabolites of the catecholamine neurotransmitters are agonists of a rat trace amine receptor. Mol Pharmacol. 2001;60:1181–1188. doi: 10.1124/mol.60.6.1181. [DOI] [PubMed] [Google Scholar]
- Bush CF, Hall RA. Olfactory receptor trafficking to the plasma membrane. Cell Mol Life Sci. 2008;65:2289–2295. doi: 10.1007/s00018-008-8028-z. [DOI] [PMC free article] [PubMed] [Google Scholar]
- Cheng Z, Garvin D, Paguio A, Stecha P, Wood K, Fan F. Luciferase Reporter Assay System for Deciphering GPCR Pathways. Curr Chem. Genomics. 2010;4:84–91. doi: 10.2174/1875397301004010084. [DOI] [PMC free article] [PubMed] [Google Scholar]
- Cherezov V, Rosenbaum DM, Hanson MA, Rasmussen SG, Thian FS, Kobilka TS, et al. High-resolution crystal structure of an engineered human beta2-adrenergic G protein-coupled receptor. Science. 2007;318:1258–1265. doi: 10.1126/science.1150577. [DOI] [PMC free article] [PubMed] [Google Scholar]
- Grandy DK. Trace amine-associated receptor 1-Family archetype or iconoclast? Pharmacol Ther. 2007;116:355–390. doi: 10.1016/j.pharmthera.2007.06.007. [DOI] [PMC free article] [PubMed] [Google Scholar]
- Hu LA, Zhou T, Ahn J, Wang S, Zhou J, Hu Y, et al. Human and mouse trace amine-associated receptor 1 have distinct pharmacology towards endogenous monoamines and imidazoline receptor ligands. Biochem J. 2009;424:39–45. doi: 10.1042/BJ20090998. [DOI] [PubMed] [Google Scholar]
- Javitch JA. The ants go marching two by two: oligomeric structure of G-protein-coupled receptors. Mol Pharmacol. 2004;66:1077–1082. doi: 10.1124/mol.104.006320. [DOI] [PubMed] [Google Scholar]
- Kleinau G, Pratzka J, Nurnberg D, Gruters A, Fuhrer-Sakel D, Krude H, et al. Differential modulation of Beta-adrenergic receptor signaling by trace amine-associated receptor 1 agonists. PLoS ONE. 2011;6:e27073. doi: 10.1371/journal.pone.0027073. [DOI] [PMC free article] [PubMed] [Google Scholar]
- Kostenis E. Is Galpha16 the optimal tool for fishing ligands of orphan G-protein-coupled receptors? Trends Pharmacol Sci. 2001;22:560–564. doi: 10.1016/s0165-6147(00)01810-1. [DOI] [PubMed] [Google Scholar]
- Kostenis E, Martini L, Ellis J, Waldhoer M, Heydorn A, Rosenkilde MM, et al. A highly conserved glycine within linker I and the extreme C terminus of G protein alpha subunits interact cooperatively in switching G protein-coupled receptor-to-effector specificity. J Pharmacol Exp Ther. 2005;313:78–87. doi: 10.1124/jpet.104.080424. [DOI] [PubMed] [Google Scholar]
- Liapakis G, Ballesteros JA, Papachristou S, Chan WC, Chen X, Javitch JA. The forgotten serine. A critical role for Ser-2035.42 in ligand binding to and activation of the beta 2-adrenergic receptor. J Biol Chem. 2000;275:37779–37788. doi: 10.1074/jbc.M002092200. [DOI] [PubMed] [Google Scholar]
- Liberles SD, Buck LB. A second class of chemosensory receptors in the olfactory epithelium. Nature. 2006;442:645–650. doi: 10.1038/nature05066. [DOI] [PubMed] [Google Scholar]
- Lindemann L, Hoener MC. A renaissance in trace amines inspired by a novel GPCR family. Trends Pharmacol Sci. 2005b;26:274–281. doi: 10.1016/j.tips.2005.03.007. [DOI] [PubMed] [Google Scholar]
- Lindemann L, Ebeling M, Kratochwil NA, Bunzow JR, Grandy DK, Hoener MC. Trace amine-associated receptors form structurally and functionally distinct subfamilies of novel G protein-coupled receptors. Genomics. 2005a;85:372–385. doi: 10.1016/j.ygeno.2004.11.010. [DOI] [PubMed] [Google Scholar]
- Lopez VM, Decatur CL, Stamer WD, Lynch RM, McKay BS. L-DOPA is an endogenous ligand for OA1. Plos Biol. 2008;6:e236. doi: 10.1371/journal.pbio.0060236. [DOI] [PMC free article] [PubMed] [Google Scholar]
- Ma L, Pei G. Beta-arrestin signaling and regulation of transcription. J Cell Sci. 2007;120:213–218. doi: 10.1242/jcs.03338. [DOI] [PubMed] [Google Scholar]
- Maguire JJ, Parker WA, Foord SM, Bonner TI, Neubig RR, Davenport AP. International Union of Pharmacology. LXXII. Recommendations for trace amine receptor nomenclature. Pharmacol Rev. 2009;61:1–8. doi: 10.1124/pr.109.001107. [DOI] [PMC free article] [PubMed] [Google Scholar]
- Matsunami H, Mainland JD, Dey S. Trafficking of mammalian chemosensory receptors by receptor-transporting proteins. Ann N Y Acad Sci. 2009;1170:153–156. doi: 10.1111/j.1749-6632.2009.03888.x. [DOI] [PMC free article] [PubMed] [Google Scholar]
- Miller GM, Verrico CD, Jassen A, Konar M, Yang H, Panas H, et al. Primate trace amine receptor 1 modulation by the dopamine transporter. J Pharmacol Exp Ther. 2005;313:983–994. doi: 10.1124/jpet.105.084459. [DOI] [PubMed] [Google Scholar]
- Okayama H, Berg P. A cDNA cloning vector that permits expression of cDNA inserts in mammalian cells. Mol Cell Biol. 1983;3:280–289. doi: 10.1128/mcb.3.2.280. [DOI] [PMC free article] [PubMed] [Google Scholar]
- Reese EA, Bunzow JR, Arttamangkul S, Sonders MS, Grandy DK. Trace amine-associated receptor 1 displays species-dependent stereoselectivity for isomers of methamphetamine, amphetamine, and para-hydroxyamphetamine. J Pharmacol Exp Ther. 2007;321:178–186. doi: 10.1124/jpet.106.115402. [DOI] [PubMed] [Google Scholar]
- Rompler H, Yu HT, Arnold A, Orth A, Schoneberg T. Functional consequences of naturally occurring DRY motif variants in the mammalian chemoattractant receptor GPR33. Genomics. 2006;87:724–732. doi: 10.1016/j.ygeno.2006.02.009. [DOI] [PubMed] [Google Scholar]
- Rosenbaum DM, Cherezov V, Hanson MA, Rasmussen SG, Thian FS, Kobilka TS, et al. GPCR engineering yields high-resolution structural insights into beta2-adrenergic receptor function. Science. 2007;318:1266–1273. doi: 10.1126/science.1150609. [DOI] [PubMed] [Google Scholar]
- Scanlan TS, Suchland KL, Hart ME, Chiellini G, Huang Y, Kruzich PJ, et al. 3-Iodothyronamine is an endogenous and rapid-acting derivative of thyroid hormone. Nat Med. 2004;10:638–642. doi: 10.1038/nm1051. [DOI] [PubMed] [Google Scholar]
- Schoneberg T, Schulz A, Biebermann H, Gruters A, Grimm T, Hubschmann K, et al. V2 vasopressin receptor dysfunction in nephrogenic diabetes insipidus caused by different molecular mechanisms. Hum Mutat. 1998;12:196–205. doi: 10.1002/(SICI)1098-1004(1998)12:3<196::AID-HUMU7>3.0.CO;2-F. [DOI] [PubMed] [Google Scholar]
- Shi L, Javitch JA. The binding site of aminergic G protein-coupled receptors: the transmembrane segments and second extracellular loop. Annu Rev Pharmacol Toxicol. 2002a;42:437–467. doi: 10.1146/annurev.pharmtox.42.091101.144224. [DOI] [PubMed] [Google Scholar]
- Shi L, Liapakis G, Xu R, Guarnieri F, Ballesteros JA, Javitch JA. Beta2 adrenergic receptor activation. Modulation of the proline kink in transmembrane 6 by a rotamer toggle switch. J Biol Chem. 2002b;277:40989–40996. doi: 10.1074/jbc.M206801200. [DOI] [PubMed] [Google Scholar]
- Snead AN, Miyakawa M, Tan ES, Scanlan TS. Trace amine-associated receptor 1 (TAAR1) is activated by amiodarone metabolites. Bioorg Med Chem Lett. 2008;18:5920–5922. doi: 10.1016/j.bmcl.2008.08.013. [DOI] [PMC free article] [PubMed] [Google Scholar]
- Staubert C, Boselt I, Bohnekamp J, Rompler H, Enard W, Schoneberg T. Structural and functional evolution of the trace amine-associated receptors TAAR3, TAAR4 and TAAR5 in primates. PLoS ONE. 2010;5:e11133. doi: 10.1371/journal.pone.0011133. [DOI] [PMC free article] [PubMed] [Google Scholar]
- Strader CD, Sigal IS, Candelore MR, Rands E, Hill WS, Dixon RA. Conserved aspartic acid residues 79 and 113 of the beta-adrenergic receptor have different roles in receptor function. J Biol Chem. 1988;263:10267–10271. [PubMed] [Google Scholar]
- Strader CD, Candelore MR, Hill WS, Dixon RA, Sigal IS. A single amino acid substitution in the beta-adrenergic receptor promotes partial agonist activity from antagonists. J Biol Chem. 1989a;264:16470–16477. [PubMed] [Google Scholar]
- Strader CD, Candelore MR, Hill WS, Sigal IS, Dixon RA. Identification of two serine residues involved in agonist activation of the beta-adrenergic receptor. J Biol Chem. 1989b;264:13572–13578. [PubMed] [Google Scholar]
- Strader CD, Fong TM, Tota MR, Underwood D, Dixon RA. Structure and function of G protein-coupled receptors. Annu Rev Biochem. 1994;63:101–132. doi: 10.1146/annurev.bi.63.070194.000533. [DOI] [PubMed] [Google Scholar]
- Tan ES, Groban ES, Jacobson MP, Scanlan TS. Toward deciphering the code to aminergic G protein-coupled receptor drug design. Chem Biol. 2008;15:343–353. doi: 10.1016/j.chembiol.2008.03.004. [DOI] [PMC free article] [PubMed] [Google Scholar]
- Tan ES, Naylor JC, Groban ES, Bunzow JR, Jacobson MP, Grandy DK, et al. The molecular basis of species-specific ligand activation of trace amine-associated receptor 1 (TAAR(1) ACS Chem Biol. 2009;4:209–220. doi: 10.1021/cb800304d. [DOI] [PMC free article] [PubMed] [Google Scholar]
- Wainscott DB, Little SP, Yin T, Tu Y, Rocco VP, He JX, et al. Pharmacologic characterization of the cloned human trace amine-associated receptor1 (TAAR1) and evidence for species differences with the rat TAAR1. J Pharmacol Exp Ther. 2007;320:475–485. doi: 10.1124/jpet.106.112532. [DOI] [PubMed] [Google Scholar]
- Wieland K, Zuurmond HM, Krasel C, Ijzerman AP, Lohse MJ. Involvement of Asn-293 in stereospecific agonist recognition and in activation of the beta 2-adrenergic receptor. Proc Natl Acad Sci U S A. 1996;93:9276–9281. doi: 10.1073/pnas.93.17.9276. [DOI] [PMC free article] [PubMed] [Google Scholar]
- Wolinsky TD, Swanson CJ, Smith KE, Zhong H, Borowsky B, Seeman P, et al. The Trace Amine 1 receptor knockout mouse: an animal model with relevance to schizophrenia. Genes Brain Behav. 2007;6:628–639. doi: 10.1111/j.1601-183X.2006.00292.x. [DOI] [PubMed] [Google Scholar]
- Yao X, Parnot C, Deupi X, Ratnala VR, Swaminath G, Farrens D, et al. Coupling ligand structure to specific conformational switches in the beta2-adrenoceptor. Nat Chem Biol. 2006;2:417–422. doi: 10.1038/nchembio801. [DOI] [PubMed] [Google Scholar]
- Zuurmond HM, Hessling J, Bluml K, Lohse M, Ijzerman AP. Study of interaction between agonists and asn293 in helix VI of human beta(2)-adrenergic receptor. Mol Pharmacol. 1999;56:909–916. doi: 10.1124/mol.56.5.909. [DOI] [PubMed] [Google Scholar]
Associated Data
This section collects any data citations, data availability statements, or supplementary materials included in this article.