Abstract
Objectives:
The authors examined magnitude/variability of residual sleep disordered breathing (SDB) at pressures around the therapeutic continuous positive airway pressure (CPAP), and described a multinight approach to CPAP titration/retitration consisting of recording airflow and summarizing SDB over multiple nights at multiple pressures and choosing an optimal pressure from these summarized data.
Design:
Prospective, single-center nonblinded study.
Patients:
Ten female/18 male patients with obstructive sleep apnea-hypopnea syndrome (OSAHS) (respiratory disturbance index [RDI] 67/h), 17 newly-initiated, 11 chronic CPAP users.
Interventions:
A custom CPAP device (Fisher & Paykel Healthcare) recording airflow and pre-programmed to vary CPAP between 2-3 cm H2O below and 1-2 cm H2O above prescription pressure as determined by a full laboratory titration.
Results:
Airflow and pressure continuously recorded for multiple nights (15.9 ± 5.1 nights) at four to seven different pressures in each patient. SDB events manually scored from the airflow as apnea (airflow reduction > 90%), hypopnea (airflow reduction > 30% lasting 10 to 120 sec with inspira-tory flow limitation [IFL]) and runs of sustained IFL > 2 min identified. RDI = (apnea + hypopnea)/total sleep time calculated for each night and an obstruction index, including sustained IFL, also was calculated. PressureMultinight was obtained for each patient from multiple nights of data using two mathematical techniques. Night-to-night variability of SDB indices was low in some patients and significant in others. PressureMultinight could be determined in 17 of 28 patients and was similar to the in-laboratory pressure.
Conclusions:
This study showed that recording multiple nights of CPAP airflow in the home and analyzing these data for residual SDB provided useful information, including the possibility of determining a therapeutic prescription for fixed CPAP in most patients and identification of others with significant physiologic variability of SDB.
Citation:
Callahan CY; Norman RG; Taxin Z; Mooney AM; Rapoport DM; Ayappa I. Multinight recording and analysis of continuous positive airway pressure airflow in the home for titration and management of sleep disordered breathing. SLEEP 2013;36(4):535-545.
Keywords: CPAP Titration, General, Obstructive Sleep Apnea, Severity Metric, Sleep Disordered Breathing, Treatment Algorithm
INTRODUCTION
Continuous positive airway pressure (CPAP) is currently the standard treatment for obstructive sleep apnea/hypopnea, and has been shown to improve both subjective and objective short-and long-term outcomes in this syndrome.1–3 Until recently, titration of CPAP to a therapeutic pressure was performed based on data collected over 4 to 8 h in an attended laboratory setting.4 It is generally assumed that this provides the reference gold standard technique. Implicit in this approach is the idea of a single optimal CPAP that can be determined with no more than a single night of data. The competing idea of a continuously adjusting autotitrating machine has not been shown to be superior,5 and may in fact cause problems in some patients due to overtitration/undertitration of pressure or due to the effects on sleep of changes in pressure.6–8 The standard approach of using single pressure (whether from a manual or automatic period of titration) is supported by extensive experience and limited data showing that re-titration on a subsequent night by the same technique as on the original titration may not show much difference in most patients.9,10 Furthermore, current adherence monitoring has shown that a CPAP pressure selected by single-night titration results in therapy without significant residual sleep disordered breathing (SDB) events,11 in many but not all patients. Other data show that more than 50% of patients may need a pressure change after initial titration12,13 and in one study the change was ≥ 3 cm H2O on retitration in more than 25% of the patients.9 However, few or no data exist on actual night-to-night variation of physiology during non-varying CPAP, and no data are published addressing whether the pressure selected is the lowest effective pressure. Finally, there is debate about what titration endpoint is needed to produce the best therapeutic result.14,15 Recommended approaches range from eliminating all apneas and hypopneas to titrating pressure to a level that abolishes all evidence of sustained elevated upper airway resistance as suggested by inspiratory flow limitation,16 snoring, or other indirect indices of elevated effort. Furthermore, one needs to choose between a pressure that is the highest pressure needed at any time in the study and one that works most of the time (during 90-95% of the study). To fully assess the effect of a single CPAP setting, it would be desirable to know both the degree of night-to-night variation of treatment effect over multiple nights as well as establishing if this variability is equally present across patients.
The current study was designed to evaluate SDB over many nights at multiple CPAP settings, using several severity indices based exclusively on the flow signal (available from the CPAP generator) over a range of pressures both above and below the previously chosen in-laboratory titration CPAP. A secondary purpose was to use this pattern of response of SDB indices to different pressures over all recorded nights to derive a logical algorithm for prescribing a single CPAP for ongoing treatment. In principle, our approach allows assessment of all interactions that actually occur between the single-pressure therapy and the patient's behavior in the home setting over a prolonged period rather than a few h or over 1 night. This approach should better reflect the effect of single-pressure therapy and better define the optimal pressure because this slow home titration allows: (1) short-term adaptive reflexes to pressure changes to occur and modify the expression of residual SDB, avoiding overreaction to transient physiology and changes in sleep state, (2) evaluation of the final pressure setting over a prolonged period including all positions and sleep stages, but only to the degree these are actually assumed by the patient, and (3) evaluation and integration of night-to-night variability into the prescription.
This article thus reports data on the sustained interaction over time between CPAP and severity of residual SDB (including variability) and also provides proof-of-concept data on a multinight approach to initial CPAP titration and retitration. In addition to face validity, we show feasibility and tolerance by patients of this algorithm, and a final pressure setting often, but not always, similar to the in-laboratory manual titration.
METHODS
This was a prospective, single-site study that took place in an academic setting. The study was approved by the NYU School of Medicine institutional review board and informed consent was obtained from all patients prior to initiation of custom CPAP.
Patients
Twenty-eight patients were recruited at the NYU Sleep Disorders Center from patients in whom obstructive sleep apnea-hypopnea syndrome (OSAHS) was diagnosed by previous polysomnography and for whom CPAP treatment was prescribed. OSAHS was previously diagnosed in 11 patients who had been on chronic CPAP for > 3 mo with self-reported usage. Seventeen patients had not previously used CPAP except during the laboratory titration.
Protocol
All patients without previous CPAP use had a full night in-laboratory manual CPAP titration that was used to establish the reference for CPAP treatment. For those patients who were already using CPAP, no retitration was performed in the laboratory; the previously established CPAP value was used as the reference therapeutic pressure and also the starting pressure for the current study. After this (new or previously established) therapeutic CPAP was defined, our slow multinight data collection was performed in the home using a custom CPAP machine built for this purpose by Fisher & Paykel Healthcare (Fisher & Paykel Healthcare, Aukland, NZ). The CPAP generator continuously recorded the airflow and delivered pressure signals onto a USB memory stick digitized at 50 Hz; after downloaded raw signals could be visualized for up to 100 nights. The pressure for each night of treatment was preset through software to collect multiple nights of data at different CPAP pressures in each patient. The device was programmed to change pressure every 2 days over 2 weeks at predetermined times to obtain full nights of data at each pressure. A single pressure was set for each entire night of treatment and ranged from 2-3 cm H2O below to 1-2 cm H2O above the previously established therapeutic pressure. The pressures were varied above and below the laboratory pressure so as not to expose the patient to subtherapeutic pressures continuously. A typical sequence was to start with the previous therapeutic pressure on the first 2 nights, then raise the pressure by 1 cm H2O, lower it to 1 cm H2O below the previous therapeutic, return to therapeutic pressure, raise by 2 cm H2O above and lower to 2 cm H2O below, etc. The CPAP machine provided heated humidification but did not provide bi-level pressure, expiratory pressure relief, or a pressure ramp. Data were collected using this CPAP machine and downloaded from the USB memory stick after 2 weeks of home use. The raw tracing was visualized and each night of data was manually scored off-line for respiratory events by an experienced scorer. All scoring was reviewed by one of the authors (IA).
Nocturnal Polysomnography
All in-laboratory nocturnal polysomnography (NPSG) testing was attended by a sleep technician and performed according to 2007 American Academy of Sleep Medicine (AASM) guidelines with a full sleep and respiratory montage.17 During the diagnostic NPSG, respiratory airflow was assessed with a nasal cannula connected to a pressure transducer (PROTECH PTAF2, Phillips Respironics, Inc., Murrysville, PA) and an oral thermistor. On a night separate from the diagnostic study, an in-laboratory CPAP titration study was performed manually by a sleep technician present during a full-night NPSG. Monitoring was according to 2007 AASM guidelines and similar to the diagnostic study except that airflow was recorded from the output of the CPAP generator. Pressure was raised until all SDB events, including obstructive apneas, hypopneas, and runs of inspiratory flow limitation were eliminated. After the study was completed, a single optimal pressure was identified for each patient following review of the study by a physician. All diagnostic and CPAP NPSGs were scored according to AASM guidelines to obtain the respiratory disturbance index (RDI, alternative rule for hypopneas using desaturation and/or arousal). Patients were educated about the function, purpose and maintenance of CPAP and mask fitting was optimized.
Data Analysis
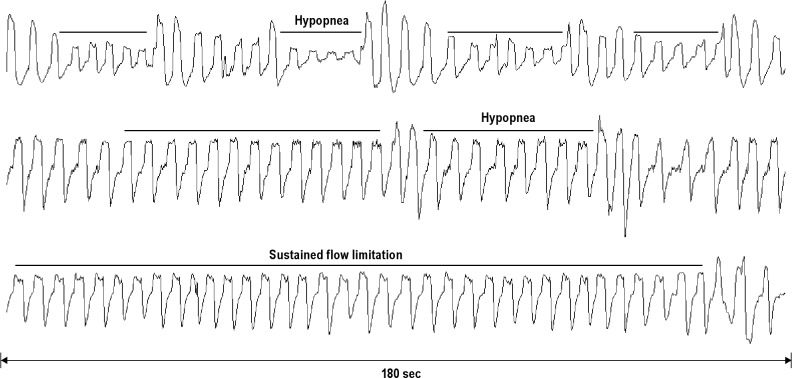
Airflow was continuously recorded from the CPAP machine during the period of home multinight titration for at least 1 night at each pressure. Each night of data was scored manually off-line. Analyses were based both on the amplitude of the flow signal and contour of the inspiratory airflow signal.18 Because these in-home data contain only airflow and CPAP pressure, rules for scoring respiratory events had to be modified from those recommended by the AASM for in-laboratory determination of the apnea-hypopnea index (AHI). We developed rules for scoring both discrete SDBFlow events (> 10 sec and < 2 min) and continuous periods > 2 min of high-resistance breathing. These rules are intended to capture the full range of abnormal breathing but also to approximate the in-laboratory rules. Discrete events included apneas and hypopneas. Apneas were defined when airflow amplitude was < 10% of baseline for > 10 sec. Flow-defined hypopneas were scored when there was any visible reduction in airflow lasting 10-120 sec associated with flow limitation (a change in the inspiratory airflow contour, (Figure 1)) or a reduction in airflow ≥ 50% of baseline airflow in the absence of flow limitation. Because oxygen saturation and electroencephalogram recording of sleep were not available, these ancillary signal criteria could not be used to define hypopnea. The denominator of time during which events were counted, or total valid sleep period (TVSP), was determined as the total time when there was a valid flow signal at pressure. The flow-based index of SDB (RDIFlow) was calculated as the sum of the number of apneas plus flow hypopneas divided by the TVSP. Sustained (> 2 min) periods of high-resistance breathing were inferred from visual recognition by a human observer of the presence of flattening on the inspiratory airflow contour19 (“flow-limitation”). Sustained inspiratory flow limitation (%SFL) was quantified by calculating the percentage of time spent with this pattern of breathing relative to TVSP. We have previously shown good reliability (both interscorer and intrascorer) for manual scoring of respiratory events and %SFL using the previously mentioned rules that rely only on the airflow signal.18,20 We also have shown that RDIFlow (the SDB index derived from only the airflow signal) was highly correlated with RDI using full NPSG.18
Figure 1.
Examples of scored sleep disordered breathing events. Airflow tracings over a 180-sec interval are shown (x-axis). The top and middle tracings are examples of hypopneas (> 10 sec, < 2 min). The bottom tracing shows sustained flow limitation (> 2 min).
To combine RDIFlow, the discrete variable, and %SFL, the variable indicative of sustained upper airway dysfunction, into one index, we calculated an obstruction index (OIFlow) according to the method described in the supplemental material: OIFlow = RDIFlow + %SFL / 3. For each patient RDIFlow, %SFL, and OIFlow were calculated separately for each night of airflow data collected on the CPAP machine.
For each patient a plot was made of RDIFlow and OIFlow against pressure for all nights and, where possible, an optimal pressure (PressureMultinight) was obtained for RDIFlow versus CPAP and OIFlow versus CPAP using two nonsubjective mathematical techniques. In a first analysis, the data in each plot were fitted to a single linear regression (SLR). If an acceptable fit (R2 ≥ 0.5) was found, the pressure was extrapolated to where the SDBFlow index fell to < 10 to obtain a PressureSLRMultinight. Because the visual shape of the data plots in many patients suggested an inflection of the regression line, we also calculated the pressure at this inflection for each plot using a piecewise, two-step linear regression inflection model where the overall combined sum of the residuals was minimized to obtain a PressureIPMultinight. To show a valid inflection point calculation, we required a combined R2 ≥ 0.5, and the number of patients who met this criterion for each method was tabulated. All regressions were performed using Sigma Plot (Sigma Plot 11, Systat-Software, San Jose, CA). Thus, using RDIFlow versus CPAP and OIFlow versus CPAP, two PressureMultinight could be determined using each of the two techniques and these were compared to the in-laboratory reference CPAP as an absolute difference. In addition, the residual SDBFlow indices for each patient were calculated as the average RDIFlow or OIFlow at pressures higher than PressureMultinight. Variability (pooled for all pressures above the optimal pressure where this could be determined) was expressed as the standard deviation of the RDIFlow or OIFlow.
RESULTS
Anthropomorphic and NPSG baseline characteristics for the 28 patients are shown in Table 1.
Table 1.
Baseline characteristics
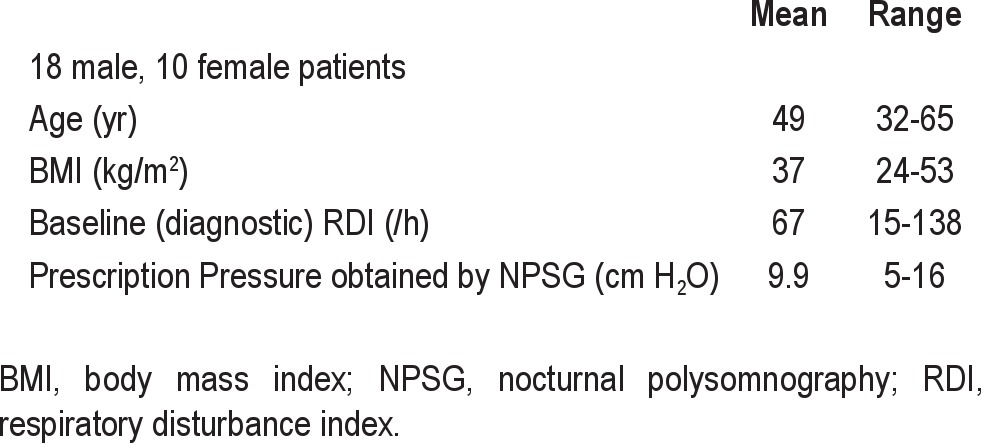
During the home CPAP monitoring period used for the multinight titration, CPAP machine airflow was collected on 15.9 ± 5.1 nights (mean ± standard deviation, minimum-maximum 6-32 nights) at four to seven different pressures in each patient. In two patients (No. 5 and No. 17) no data were available above the prescribed therapeutic pressure determined from the in-laboratory NPSG because the patients appeared not to have used CPAP on those nights. Figure 2 shows the distribution of hours of CPAP adherence during the data collection period. The mean CPAP adherence was 5.9 ± 1.3 h/night.
Figure 2.
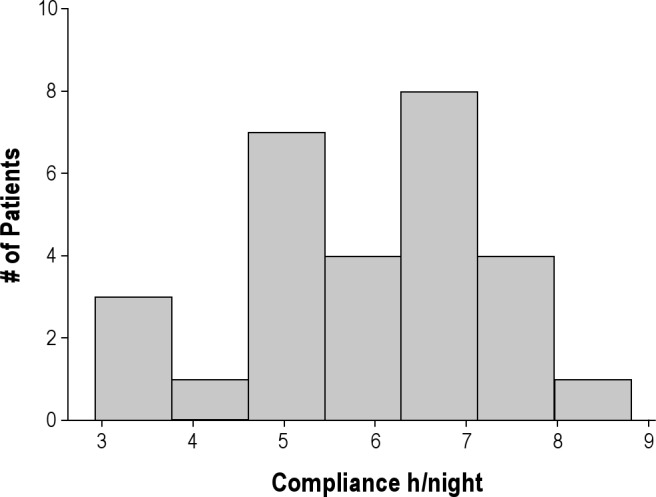
Histogram showing the distribution of h of continuous positive airway pressure adherence during the multiple nights of continuous positive airway pressure flow data collection in 28 patients. Compliance is given as h per night and is shown on the x-axis. The number of patients is shown on the y-axis. The average number of nights recorded was 15.9 ± 5.1.
Figure 3A and B shows data from a representative patient of RDIFlow (A) and OIFlow (B) plotted against the set pressure on 12 nights of data collected. As pressure increased, visual inspection of the plots shows that both SDBFlow indices decreased. For the RDIFlow (A) no statistically significant inflection point could be determined mathematically (R2 < 0.5), although an inflection point is visually suggested at 13 cm H2O. However, for OIFlow (B) the mathematically determined inflection point (Pressure-Multinight) using the two-step piecewise regression line (R2 = 0.52) was 13 cm H2O and agreed with the previously determined prescription pressure from the in-laboratory NPSG. The alternate technique of obtaining PressureMultinight versus CPAP failed to be fit with an R2 ≥ 0.5; thus the SLR could not be used in this patient to determine PressureMultinight.
Figure 3.
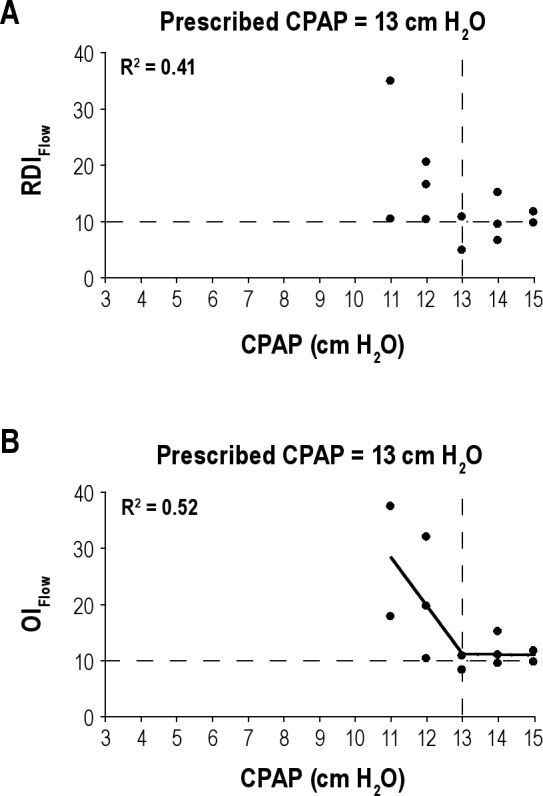
(A) Example of RDIFlow plotted (on the y-axis) against the CPAP (x-axis) on 12 nights in a representative patient. Each solid circle represents the RDIFlow on a single night and at a given CPAP. No linear regression line is shown as the R2 < 0.5, although an inflection is visually suggested at 13 cm H2O. The vertical dashed line marks the prescribed CPAP from in-laboratory manual titration and the horizontal dashed line is a reference for an RDIFlow = 10 events/h. (B) Example of OIFlow plotted (on the y-axis) against the CPAP (x-axis) on 12 nights in a representative patient. Each solid circle represents the OIFlow on a single night and at a given CPAP. Using two-step piecewise linear regression (solid line) the R2 = 0.52 and the PressureIPMultingiht = 13 cm H2O. The vertical dashed line marks the prescribed CPAP and was the same as the PressureIPMultinight. The vertical dashed line marks the prescribed CPAP from in-laboratory manual titration and the horizontal dashed line is a reference for an OIFlow = 10. CPAP, continuous positive airway pressure; OI, obstruction index; RDI, respiratory disturbance index.
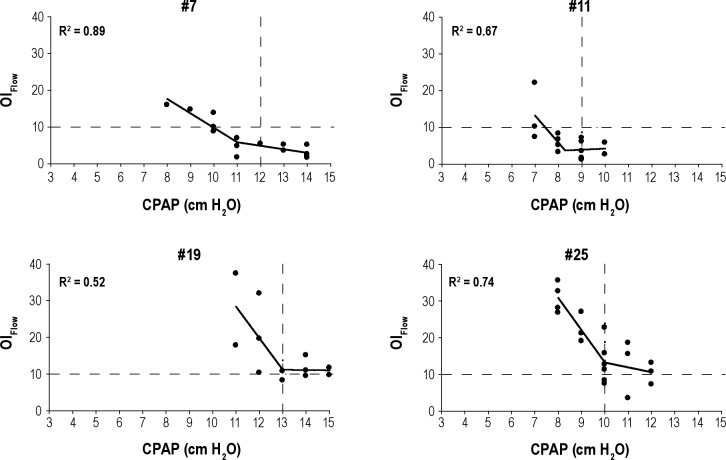
Table 2 shows the PressureMultinight obtained in each patient from the two SDB indices and using the two techniques. For each patient there were two mathematically determined inflection pressures using plots of RDIFlow versus CPAP and OIFlow versus CPAP and two pressures obtained from the SLR method extrapolating RDIFlow and OIFlow < 10. Data are not included in the table if the R2 did not meet the pre-determined cutoff. Table 3 summarizes the number of patients in whom good regression relationships were found for each technique for OIFlow versus CPAP and RDIFlow versus CPAP and also compares the pressure derived from these plots (PressureMultinight) to the in-laboratory reference pressure. Inflection points were seen in 17 of 28 patients using OIFlow versus CPAP, and PressureMultinight was within 1.3 cm H2O of the in-laboratory reference pressure in these 17 patients. Inflection points were seen in only 11 of 28 patients using RDIFlow versus CPAP and PressureMultinight was within 2.2 cm H2O of the in-laboratory reference pressure. Figure 4 shows data from four representative patients of the 17 who showed a definite inflection on the relationship of OIFlow to pressure with R2 ≥ 0.5. In two of these the relationship of RDIFlow to CPAP is weaker (R2 < 0.5). The plots from all 28 patients are shown in the supplemental material.
Table 2.
Determination of PressureMultinight from plots of RDIFlow versus CPAP and OIFlow versus CPAP by the inflection point and simple linear regression techniquesa
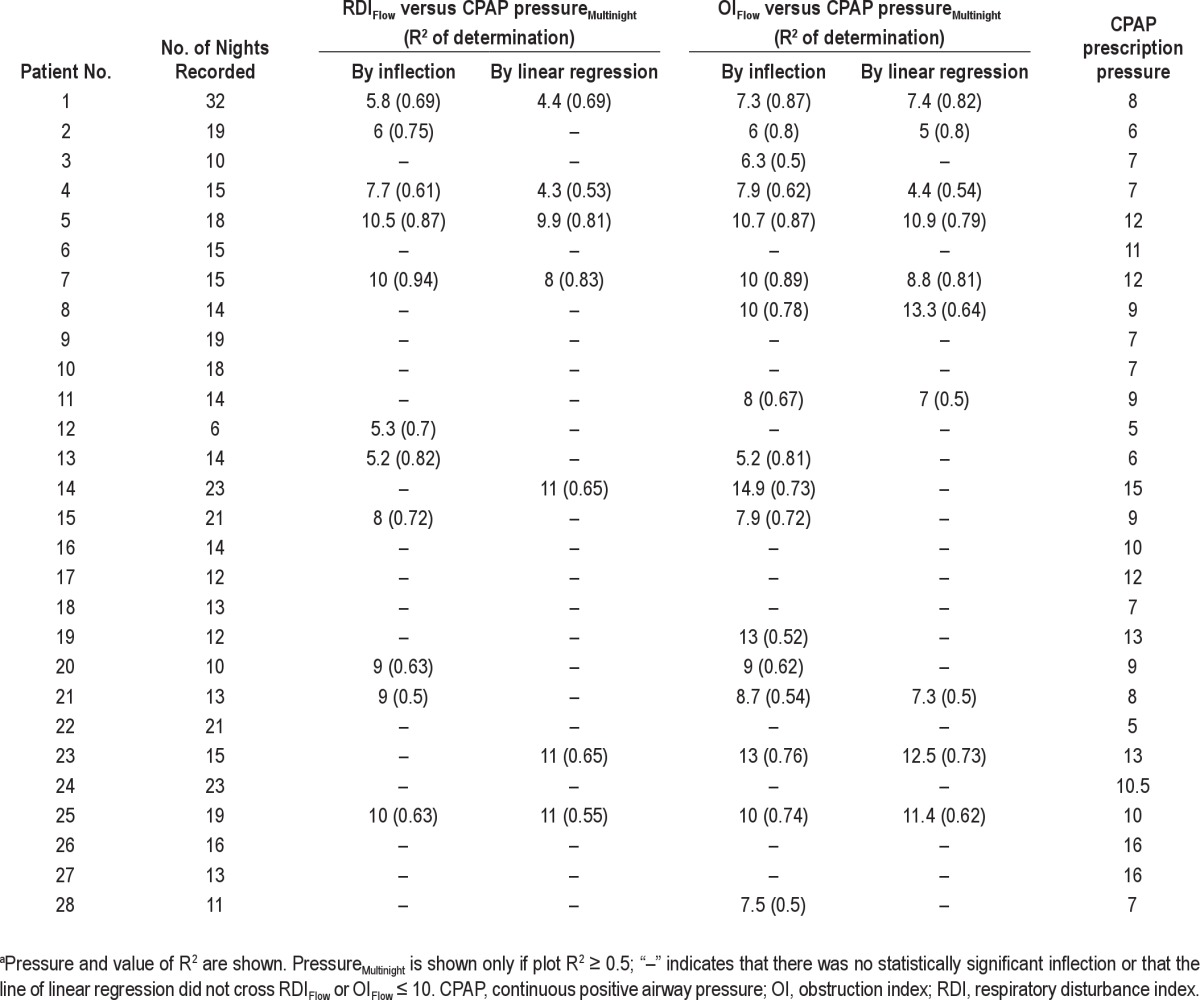
Table 3.
Summary of results and comparison of methodsa
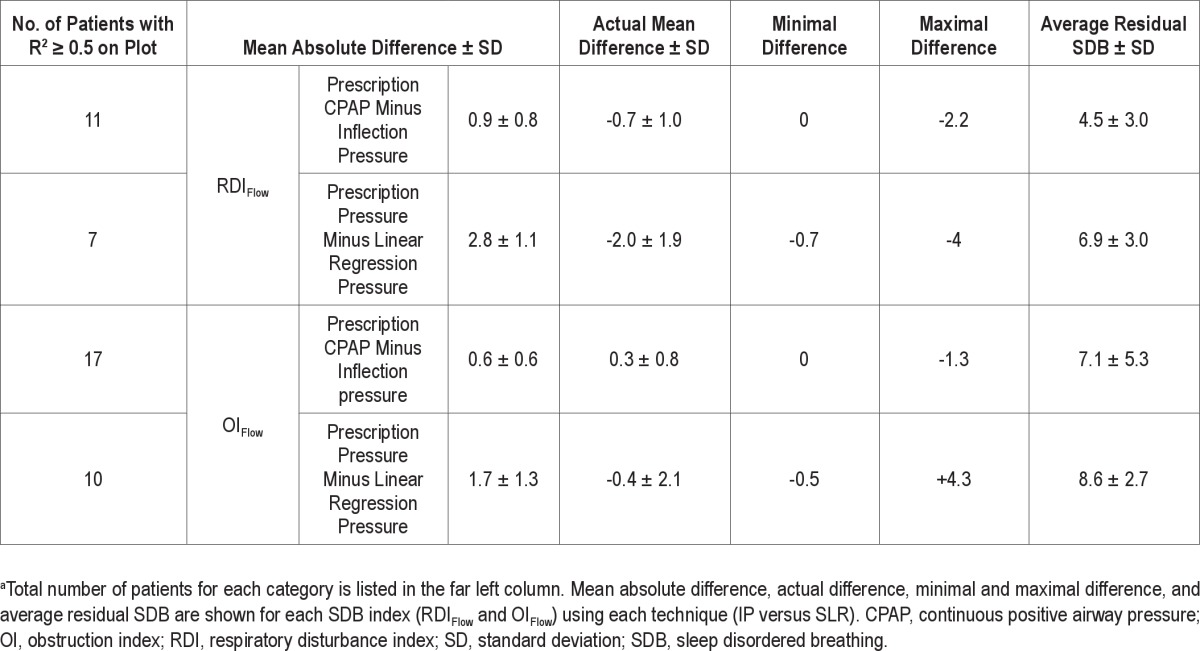
Figure 4.
Graphs depicting four patients with good (both visually and statistically meeting our cutoff of R2 ≥ 0.5) inflection points for OIFlow versus CPAP. Patients included are Nos. 7, 11, 19, and 25. For each graph, OIFlow is on the y-axis and CPAP is on the x-axis (in cm H2O). Each solid circle represents the OIFlow for a single night at a specific CPAP. R2 for the corresponding patient is displayed in each graph. Two-step piecewise linear regression (solid line) is shown for each patient. Vertical dashed lines represent prescribed CPAP and horizontal dashed lines show the reference point for OIFlow = 10. CPAP, continuous positive airway pressure; OI, obstruction index.
Table 3 also shows that in those patients where an inflection could be determined, the average residual SDB variability (standard deviation) was low (three to five events/h). However, below the inflection point, the variability in residual SDB was substantial in several patients (e.g., for patient No. 5 in the supplemental material the obstruction index ranged from 10 to 40 at 9 cm H2O). This could have led to a significant variation in titration if only a single night had been recorded.
In our data PressureMultinight could be obtained in 7 of 28 patients using SLR analysis of RDIFlow versus pressure, and in 10 of 28 patients using a SLR analysis of OIFlow versus pressure. The difference in pressure between PressureMultinight and in-laboratory reference pressure was smaller when using the inflection point technique compared to the SLR technique (4 versus 1 to 2 cm H2O) for both OIFlow and RDIFlow. Compared with SLR, R2 was higher using the two-step piecewise technique. The residual RDI-Flow and OIFlow at pressures higher than PressureMultinight were lower for the inflection pressure technique than the SLR technique.
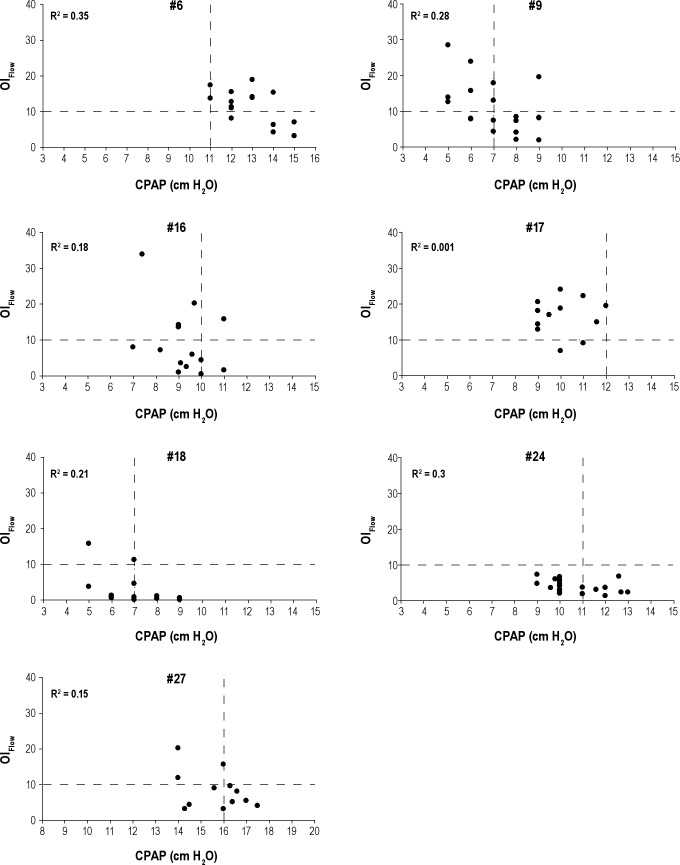
In 11 of 28 patients no PressureMultinight could be determined using the inflection technique. In two patients, R2 value just missed 0.5 and there was a visual suggestion of an inflection point (Figure 5). In seven patients (Figure 6) insufficient nights were collected at lower and/or higher pressures to obtain an acceptable inflection point. In two patients (Figure 7) there was minimal or no change in overall OIFlow from highest to lowest pressures because SDB was present only in rapid eye movement (REM), diluting the SDB calculated for the entire night.
Figure 5.
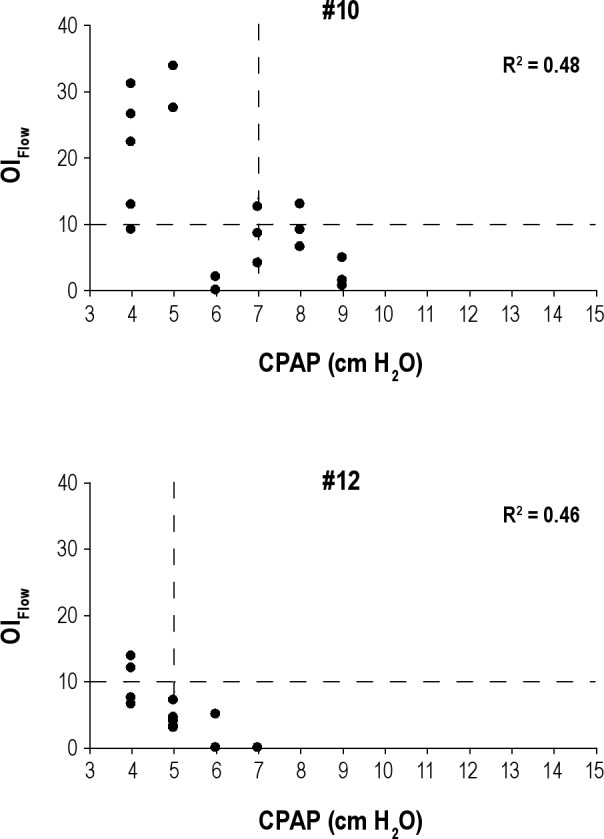
Graphs depicting patient Nos. 10 and 12 with R2 that was close but did not meet our predetermined cutoff (R2 ≥ 0.5). OIFlow is on the y-axis and CPAP is on the x-axis (in cm H2O). Each solid circle represents the OIFlow for a single night at a specific CPAP. R2 for the corresponding patient is displayed in each graph. Vertical dashed lines represent prescribed CPAP and horizontal dashed lines show the reference point for OIFlow = 10. CPAP, continuous positive airway pressure; OI, obstruction index.
Figure 6.
Graphs depicting patient Nos. 6, 9, 16, 17, 18, 24, and 27 in whom additional nights were needed at lower and/or higher pressures to obtain an acceptable inflection point. OIFlow is on the y-axis and CPAP is on the x-axis (in cm H2O). Each solid circle represents the OIFlow for a single night at a specific CPAP. R2 for the corresponding patient is displayed in each graph. Vertical dashed lines represent prescribed CPAP and horizontal dashed lines show the reference point for OIFlow = 10.CPAP, continuous positive airway pressure; OI, obstruction index.
Figure 7.

Graphs showing no or minimal change in overall SDBFlow indices from lowest to highest pressures due to rapid eye movement-obstructive sleep apnea. OIFlow is on the y-axis and CPAP is on the x-axis (in cm H2O). Each solid circle represents the OIFlow for a single night at a specific CPAP. R2 for the corresponding patient is displayed in each graph. Vertical dashed lines represent prescribed CPAP and horizontal dashed lines show the reference point for OIFlow. CPAP, continuous positive airway pressure; OI, obstruction index.
DISCUSSION
The purpose of this study was to assess the behavior of residual SDB at multiple CPAP pressures that were sustained for at least 2 entire nights of use, both above and below the prescribed therapeutic setting of pressure. To our knowledge, these are the only such data to exist over multiple pressures and not relying on an unverified automated scoring reported from CPAP adherence monitoring software.
An additional purpose of this study was to assess utility and feasibility of a new multinight approach to titration and management of CPAP using data obtained in the at-home setting. PressureMultinight obtained from our algorithm was found to be similar to the pressure obtained from in-laboratory reference pressure using standard manual titration in many but not all patients.
Our algorithm as implemented in the current study had some limitations, but seven of 11 failures to obtain a PressureMultinight were due to insufficient data collection that could have been remedied by additional nights of data obtained at higher or lower pressures. In the cases where despite a wide-enough range of tested pressures and variability in the OIFlow and RDIFlow makes selecting a single therapeutic pressure difficult, it can be argued that the information gained from our multinight testing suggests no such pressure exists and that autotitrating positive airway pressure (APAP) may be indicated. Alternatively, one could use the highest pressure needed with some degree of confidence or accept using a demonstrably subtherapeutic pressure and know that this was the case. The value of these approaches is not the subject of the current study and needs to be evaluated in future studies using suitable clinical endpoints.
An alternative to our approach of multinight testing is the use of unattended APAP titration algorithms.15,21 Given the improved automated algorithms for responding to SDB events, possible lower cost of unattended titration, and more timely processing of patients in the setting of limited laboratory resources, APAP has been increasingly used in clinical algorithms.22,23 APAP was initially developed to replace a fixed CPAP, obviating titration and improving the match between delivered pressure and a changing CPAP need. In most group analyses, the use of APAP has not been shown to be inferior to CPAP24,25 but overall it has not resulted in increased adherence to therapy.5,26 Furthermore, several reports have shown that APAP, at least in some patients and depending on the specific machine algorithm, has limitations. Reported problems include overtitration and undertitration,7 especially in the presence of mask leak6 and the occurrence of runaway pressure triggered by poor signal and the irregular breathing of arousal.27 Because APAP is based on relatively rapid changes in delivered CPAP that are intended to respond to rapid changes in CPAP need, it may not allow for reflex changes in physiology. Two examples are the instability of pressure needed to treat SDB often occurs at sleep onset and hysteresis that may exist in the optimal treatment pressure (i.e., when raising pressure more CPAP is needed to correct flow abnormalities than when lowering CPAP).28 In addition, at least one article has suggested that changes in pressure may themselves cause arousal.8 These short-term limitations of APAP may translate to disadvantages of APAP for long-term therapy, and there is one report that long-term blood pressure did not improve on APAP but did with CPAP.29 Using our approach of identifying patients with night-to-night variability in the effect of a single therapeutic CPAP, testing could determine whether a small subset of specifically identified patients would benefit from APAP.
Independent of its long-tem use as sustained therapy for SDB, APAP used in an unattended home setting is now a common modality to titrate patients for setting a single therapeutic CPAP as a long-term prescription. The 2007 AASM guidelines for titration with APAP15 recommend close follow-up for patients titrated with APAP and recommend manual retitration if there is any question of effectiveness after education on OSAHS has been accomplished and mask fitting optimized, implying that pressure re-titration plays a significant role in acceptance and efficacy of therapy. Although many algorithms exist for converting data obtained during a night of APAP to a fixed CPAP prescription,14 there is little consensus on which formula should be used or how many nights of data are needed. At least one article shows that using a single night of APAP to prescribe a single CPAP results in significant night-to-night variability in this prescrition.30
Our multinight, multipressure approach to obtaining data with which to make a decision about a single CPAP is based on several assumptions that are similar to those used in current manual in-laboratory titration protocols. All of these vary the CPAP and recommend some period of observation after each change of pressure, ranging from 1 to 30 min, to allow for physiologic adaptation and to avoid reaching unnecessarily high pressures. Although unproven, it is believed that the optimal CPAP is the highest of the transiently lowest effective pressures.14,31 It is also believed that the choice of pressure will affect long-term adherence to therapy.14 To avoid overtitration, some laboratories (including ours) insist on testing the effect of a reduction in pressure once optimal pressure appears to have been attained. Central apneas that appear with excessive CPAP and disappear when pressure is lowered highlight the importance of this final step. Until now, it has not been determined what time period is needed to adequately test the effect on a patient of choosing any given pressure. In the current study, we provide some reference data for this choice, and suggest that with the enhanced ability to collect these data from the CPAP machine in the home, it may be advantageous to use longer collection periods than used in the single-night laboratory protocols.
In addition to obtaining a reliable prescription pressure in newly diagnosed patients, patients on long-term CPAP may need management of their pressure setting9,12 and this involves assessing the efficacy of their current CPAP prescription prior to any change of this pressure. Our multinight protocol provides one way to obtain these data in a current CPAP user. As with some examples, the efficacy of multiple pressures can be assessed to evaluate complaints of residual sleepiness or need for change in pressure due to weight gain/loss or aging. Our current study had equal numbers of new and chronic CPAP users, and we did not find any significant differences in their tolerance of suboptimal pressures or overall adherence to our protocol. Although there were no demonstrable differences in the pressure-flow relationships seen in the patients in the two groups, our dataset is too small to definitively address this finding.
Our best analysis of the residual SDB seen on the multiple nights of flow data recorded used the obstruction index (OIFlow), whereas the conventional indices used to describe severity of SDB are AHI4% and RDI. Neither of these capture sustained flow limitation, which has been shown to be associated with increased upper airway resistance28,32,33 and associated with clinical consequences.17,34,35 Raising CPAP to eliminate inspira-tory flow limitation is the usual clinical practice during laboratory and unattended CPAP titrations, and at least one study has shown that increasing CPAP to treat residual inspiratory flow-limitation after elimination of apnea and hypopnea resulted in improved outcomes.16 Our obstruction index was designed to combine the RDI that captures discrete events and sustained flow limitation with an appropriate weighting (see supplemental material) to provide a sensitive measure of SDB across the range of treated disease. It is also evident from our data in individual patients that the OIFlow can be significantly elevated even in the presence of a low RDIFlow (patients No. 1 and No. 2 in supplemental material). Thus, we think that our choice of the OIflow as a titration variable was justified.
In all the SDB indices we obtained, the denominator was time with valid flow signal time, whereas in a full NPSG this denominator is the total sleep time. In a previous article18 we showed that the valid flow time was only 15% greater than the total sleep time on a diagnostic full PSG in patients with RDI < 40/h, and resulted in no significant bias in the calculated RDI. Thus, in the current study we may have underestimated the SDB indices at subtherapeutic CPAP, but probably by less than 15% (the amount seen in the untreated setting), and it is unlikely this would change the findings.
As implemented, our multinight protocol generated a substantial amount of data that needed to be reviewed to obtain the plots from which PressureMultinight was derived. In the current study, we performed all analyses by manual scoring prior to a mathematical fit of the resulting plots of SDB index versus pressure. This degree of labor intensity is not intended to represent a practical approach to clinical patient care, but raises the possibility of automation. Even with existing autoscoring algorithms (as in the auto-titrating devices and in ambulatory device systems) it is possible our approach could be automated, but this remains to be tested with each algorithm. In this study, patients required two visits to the sleep center, but only to pick up and drop off the customized CPAP, and this could easily be replaced with remote data access that is currently coming into use. Finally, in the current study we started the pressure titration with an initial pressure obtained from the in-laboratory reference pressure and this would be applicable to re-titration of CPAP only. However, starting at a previously titrated pressure is not necessary. Alternative approaches would be to use a sufficiently wide range of pressures until the inflection is established, starting with an initial pressure from a prediction equation30,36 or performing a rough titration with APAP prior to initiating the multinight protocol.
A final question raised by analysis of entire nights of data is the issue of intermittent, positional, or REM- related SDB, where indices obtained for the entire night do not reflect periods of residual SDB. This is highlighted by data from a patient who had SDB only in REM on the diagnostic study (RDI total 16.2/h, REM AHI 48.8/h, subject No. 22). In this patient our algorithm predicted that the lowest pressure tested was therapeutic when in fact REM-related SDB persisted. A modification to our algorithm which monitors the hourly SDB would overcome this limitation, although this was not tested in our current data-set. Of note, this same limitation exists in the entire night AHI reported on most compliance reports and in laboratory titrations that have limited REM or supine time.
CONCLUSION
In summary, this study showed that recording multiple nights of CPAP airflow in the home and analyzing these data for residual SDB provided useful information, including the possibility of determining a therapeutic prescription for fixed CPAP in most patients and identification of those others with significant physiologic variability of SDB. Recordings at multiple pressures also provide the opportunity to re-evaluate effectiveness of CPAP, with application to chronic management of OSAHS. Overall, pressures that would have been prescribed compared favorably with those obtained from in-laboratory titration in many, but not all, patients and it can be argued that the pressure previously prescribed was suboptimal because it was based on a single night of data. Automation of several aspects of our protocol might allow a clinically useful device to be developed, but the current study demonstrates the feasibility as well as utility of multinight data collection of flow signal from a CPAP device. Whether this approach is advantageous over existing CPAP titration approaches needs to be further tested in a prospective manner.
DISCLOSURE STATEMENT
This study was partially supported by Fisher and Paykel Healthcare. Dr. Norman has received research support from Fisher & Paykel Healthcare for development of novel CPAP devices, including a project for development of an algorithm utilizing the slow titration approach reported in this paper. In addition, he has received research support from Ventus Medical for unrelated projects. The present study used CPAP machines provided at no cost by Fisher & Paykel Healthcare. Dr. Norman holds multiple US and foreign patents covering techniques and analysis algorithms for the diagnosis of OSAHS and techniques for administering CPAP. Several of these have been licensed to Fisher & Paykel Healthcare, Health C'Air and Advanced Brain Monitoring, and generate royalties paid to NYU and distributed in part to the inventors. Dr. Rapoport has received research support from Fisher & Paykel Healthcare for development of novel CPAP devices, including a project for development of an algorithm utilizing the slow titration approach reported in this paper. In addition, he has received research support from Ventus Medical for unrelated projects. He has also been a paid speaker for Fisher & Paykel Healthcare, Ventus Medical and BioMarin and receives consulting fees from Fisher & Paykel Healthcare exceeding $10,000/yr. The present study used CPAP machines provided at no cost by Fisher & Paykel Healthcare. The present paper describes an algorithm that is the subject of development efforts by Dr. Rapoport and Fisher & Paykel Healthcare. Dr. Rapoport holds multiple US and foreign patents covering techniques and analysis algorithms for the diagnosis of OSAHS and techniques for administering CPAP. Several of these have been licensed to Fisher & Paykel Healthcare, Health C'Air and Advanced Brain Monitoring, and generate royalties paid to NYU and distributed in part to the inventors. Dr. Ayappa has received research support from Fisher & Paykel Healthcare for development of novel CPAP devices, including a project for development of an algorithm utilizing the slow titration approach reported in this paper. In addition, she has received research support from Ventus Medical for unrelated projects. The present study used CPAP machines provided at no cost by Fisher & Paykel Healthcare. The present paper describes an algorithm that is the subject of development efforts by Dr. Ayappa and Fisher & Paykel Healthcare. Dr. Ayappa holds multiple US and foreign patents covering techniques and analysis algorithms for the diagnosis of OSAHS and techniques for administering CPAP. Several of these have been licensed to Fisher & Paykel Healthcare and Advanced Brain Monitoring, and generate royalties paid to NYU and distributed in part to the inventors. The other authors have indicated no financial conflicts of interest.
ACKNOWLEDGMENTS
The work was performed at the Sleep Disorders Center of Pulmonary, Critical Care and Sleep Medicine Department, New York University School of Medicine, New York, NY. Supported by grants from: Fisher & Paykel Healthcare, NIH R01HL81310, NIH 1 UL1RR029893, Foundation for Research in Sleep Disorders.
Footnotes
A commentary on this article appears in this issue on page 463.
SUPPLEMENTAL MATERIAL
DEFINITION OF THE OBSTRUCTION INDEX
For both diagnosis and during continuous positive airway pressure (CPAP) titration, current practice is to quantify severity of sleep disordered breathing (SDB) by the frequency of occur-rence of individual discrete events: apnea, hypopnea, and respiratory effort-related arousals (RERAs) are counted and divided by sleep or recording time to give, respectively, apnea index (AI) and apnea hypopnea indices (AHI4% or respiratory disturbance index [RDI]). Other markers of sustained elevated resistance, such as snoring and long periods of sustained flow limitation (SFL), have been qualitatively assessed in parallel analyses, but there is little consensus on how these should be reported. Because sustained events are by definition prolonged and thus cannot be numerous, counting and adding them to the AHI does not capture their severity. To date, no single metric is in use that combines the discrete events with sustained events such as SFL. In several prior abstracts1–3 and in the current article, we propose a combination of the discrete and continuous aspects of elevated upper airway resistance that has face validity for diagnosis, severity, and in the objective titration of CPAP treatment for SDB. Although applicable to any definition of apnea, hypopnea, and other discrete events (e.g., AASM-recommended and alternate criteria or definitions for ambulatory discrete events without electroencephalographic monitoring), we define Obstruction Index (OI): = (#Apneas + #Hypopneas + #RERAs) / Time + %SFL / 3
Where:
- Discrete events must last between 10 sec and 2 min and are defined as follows:
- Apnea: airflow amplitude < 10% baseline Hypopnea: Flow-based airflow amplitude < 50% baseline
- RERAs: sequences of breaths with inspiratory flow limitation that do not meet the criteria for hypopnea, terminated by sinusoidal breath (s).We have previously shown these events, when less than 2 min long, are equivalent to RERAs.4
- Sustained inspiratory flow limitation events (SFL) must last > 2 min and are defined as follows:
- SFL: breath sequences showing the characteristic flattened inspiratory flow contour for each breath.
Time: In a polysomonography (PSG) this would be the total sleep time, whereas in ambulatory monitoring it would be the total time when there was a valid flow signal. This is referred to as total valid sleep period in the current article and is used as the denominator for RDIFlow, OIFlow, and %SFL in the current study.
The use of the factor 1/3 for the %SFL contribution to the OI is based on observations in both laboratory subjects and normal patients and a large dataset from the Sao Paulo epidemiologic study5 that showed that the 95% upper limit of normal of %SFL in normal patients was approximately 30%. Thus dividing this value by 3 makes a normal patient with no apneas or hypopneas have an OI of 10 (roughly consistent with the upper limit of RDI in normal patients).
To further show the utility of the OI in patients with obstructive sleep apnea-hypopnea syndrome, data from the first 10 patients in the current study (all male; ages 34–65 yr, baseline RDI = 56/h (range 15–100/h) had their in-laboratory PSGs and home flow downloads scored for apneas, hypopneas, RERAs, and SFL. In Figure S1 the x-axis are CPAP pressures (diagnosis = 0 cm H20) relative to the average CPAP prescription (which ranged from 6–14 cm H2O) from the laboratory titration. Of note, the mean nightly CPAP use in these 10 patients was 5.9 h and there was a range of 11–32 nights on CPAP per patient. On the y-axis the mean for all patients for AHIFlow, RDIFlow, %SFL, and OIFlow is shown for each pressure.
Figure S1 shows that as CPAP is progressively raised discrete events (AHIFlow, and RDIFlow) fall, but disappear at a pressure when sustained events (%SFL) are still present. %SFL was often not present during diagnostic studies when discrete events predominated and thus does not fall monotonically. In contrast, the OIFlow behaves monotonically as it is elevated in the diagnostic study, decreases with CPAP, and falls to a plateau above therapeutic CPAP prescription. Thus, the OI shows face validity as a metric of SDB and it provides a sensitive, monotonic marker of upper airway obstruction that combines the sensitivity of sustained %SFL during CPAP titration with the diagnostic utility of AHI and RDI off CPAP.
Individual patient data RDI and OI over all nights where flow data was collected.
SUPPLEMENTAL REFERENCES
- 1.Ayappa I, Norman RG, Rapoport DM. An integrated index of obstruction in OSAHS. Proc Am Thorac Soc. 2005;2:A764. [Google Scholar]
- 2.Ayappa I, Norman RG, Rapoport DM. Relationship between an obstruction Index and daytime performance in OSAHS. Proc Am Thorac Soc. 2006;3:A566. [Google Scholar]
- 3.Ayappa IA, Keating J, Norman RG, Mooney AM, Walsleben JA, Rapo-port DM. An experimental human model of sleep disordered breathing. Am J Respir Crit Care Med. 2011;183:A6073. [Google Scholar]
- 4.Ayappa I, Norman RG, Krieger AC, Rosen A, O'Malley R L, Rapoport DM. Non-invasive detection of respiratory effort-related arousals (REras) by a nasal cannula/pressure transducer system. Sleep. 2000;23:763–71. doi: 10.1093/sleep/23.6.763. [DOI] [PubMed] [Google Scholar]
- 5.Palombini LO, Tufik S, Rapoport DM, et al. Inspiratory flow limitation in a normal population of adults in Sao Paulo. Sleep. 2012;35:A148. doi: 10.5665/sleep.3122. [DOI] [PMC free article] [PubMed] [Google Scholar]
REFERENCES
- 1.Patel SR, White DP, Malhotra A, Stanchina ML, Ayas NT. Continuous positive airway pressure therapy for treating sleepiness in a diverse population with obstructive sleep apnea: results of a meta-analysis. Arch Intern Med. 2003;163:565–71. doi: 10.1001/archinte.163.5.565. [DOI] [PubMed] [Google Scholar]
- 2.Marin JM, Carrizo SJ, Vicente E, Agusti AGN. Long-term cardiovascular outcomes in men with obstructive sleep apnoea-hypopnoea with or without treatment with continuous positive airway pressure: an observational study. Lancet. 2005;365:1046–53. doi: 10.1016/S0140-6736(05)71141-7. [DOI] [PubMed] [Google Scholar]
- 3.Siccoli MM, Pepperell JC, Kohler M, Craig SE, Davies RJ, Stradling JR. Effects of continuous positive airway pressure on quality of life in patients with moderate to severe obstructive sleep apnea: data from a randomized controlled trial. Sleep. 2008;31:1551–8. doi: 10.1093/sleep/31.11.1551. [DOI] [PMC free article] [PubMed] [Google Scholar]
- 4.Kushida CA, Chediak A, Berry RB, et al. Clinical guidelines for the manual titration of positive airway pressure in patients with obstructive sleep apnea. J Clin Sleep Med. 2008;4:157–71. [PMC free article] [PubMed] [Google Scholar]
- 5.Smith I, Lasserson TJ. Pressure modification for improving usage of continuous positive airway pressure machines in adults with obstructive sleep apnoea. Cochrane Database Syst Rev. 2009:CD003531. doi: 10.1002/14651858.CD003531.pub3. [DOI] [PubMed] [Google Scholar]
- 6.Valentin A, Subramanian S, Quan SF, Berry RB, Parthasarathy S. Air leak is associated with poor adherence to autoPAP therapy. Sleep. 2011;34:801–6. doi: 10.5665/SLEEP.1054. [DOI] [PMC free article] [PubMed] [Google Scholar]
- 7.Farre R, Montserrat JM, Rigau J, Trepat X, Pinto P, Navajas D. Response of automatic continuous positive airway pressure devices to different sleep breathing patterns: a bench study. Am J Respir Crit Care Med. 2002;166:469–73. doi: 10.1164/rccm.2111050. [DOI] [PubMed] [Google Scholar]
- 8.Marrone O, Insalaco G, Bonsignore MR, Romano S, Salvaggio A, Bonsignore G. Sleep structure correlates of continuous positive airway pressure variations during application of an autotitrating continuous positive airway pressure machine in patients with obstructive sleep apnea syndrome. Chest. 2002;121:759–67. doi: 10.1378/chest.121.3.759. [DOI] [PubMed] [Google Scholar]
- 9.Series F, Marc I, Cormier Y, La Forge J. Required levels of nasal continuous positive airway pressure during treatment of obstructive sleep apnoea. Eur Respir J. 1994;7:1776–81. doi: 10.1183/09031936.94.07101776. [DOI] [PubMed] [Google Scholar]
- 10.Choi S, Mullins R, Crosby JH, Davies RJ, Stradling JR. Is (re)titration of nasal continuous positive airway pressure for obstructive sleep apnoea necessary? Sleep Med. 2001;2:431–5. doi: 10.1016/s1389-9457(00)00085-x. [DOI] [PubMed] [Google Scholar]
- 11.Kushida CA, Berry RB, Blau A, et al. Positive airway pressure initiation: a randomized controlled trial to assess the impact of therapy mode and titration process on efficacy, adherence, and outcomes. Sleep. 2011;34:1083–92. doi: 10.5665/SLEEP.1166. [DOI] [PMC free article] [PubMed] [Google Scholar]
- 12.Netzer NC, Juhasz J, Hofmann M, Hohl K, Strohl KP, Kupper TE. The need for pressure changes in CPAP therapy 2-3 months after initial treatment: a prospective trial in 905 patients with sleep-disordered breathing. Sleep Breath. 2011;15:107–12. doi: 10.1007/s11325-010-0332-9. [DOI] [PubMed] [Google Scholar]
- 13.Konermann M, Sanner B, Burmann-Urbanek M, Horstensmeyer D, Laschewski F. [Constancy of the nCPAP pressure values in the long-term monitoring of patients with obstructive sleep apnea] Dtsch Med Wochenschr. 1995;120:125–9. doi: 10.1055/s-2008-1047776. [DOI] [PubMed] [Google Scholar]
- 14.Berry RB, Parish JM, Hartse KM. The use of auto-titrating continuous positive airway pressure for treatment of adult obstructive sleep apnea. An American Academy of Sleep Medicine review. Sleep. 2002;25:148–73. [PubMed] [Google Scholar]
- 15.Morgenthaler TI, Aurora RN, Brown T, et al. Practice parameters for the use of autotitrating continuous positive airway pressure devices for titrating pressures and treating adult patients with obstructive sleep apnea syndrome: an update for 2007. An American Academy of Sleep Medicine report. Sleep. 2008;31:141–7. doi: 10.1093/sleep/31.1.141. [DOI] [PMC free article] [PubMed] [Google Scholar]
- 16.Meurice JC, Paquereau J, Denjean A, Patte F, Series F. Influence of correction of flow limitation on continuous positive airway pressure efficiency in sleep apnoea/hypopnoea syndrome. Eur Respir J. 1998;11:1121–7. doi: 10.1183/09031936.98.11051121. [DOI] [PubMed] [Google Scholar]
- 17.Iber C, Ancoli-Israel S, Chesson AL, Quan SF. 1st ed. Westchester, IL: American Academy of Sleep Medicine; 2007. The AASM manual for the scoring of sleep and associated events: rules terminology and technical specifications. [Google Scholar]
- 18.Ayappa I, Norman RG, Suryadevara M, Rapoport DM. Comparison of limited monitoring using a nasal-cannula flow signal to full polysomnography in sleep-disordered breathing. Sleep. 2004;27:1171–9. doi: 10.1093/sleep/27.6.1171. [DOI] [PubMed] [Google Scholar]
- 19.Hosselet JJ, Norman RG, Ayappa I, Rapoport DM. Detection of flow limitation with a nasal cannula/pressure transducer system. Am J Respir Crit Care Med. 1998;157:1461–7. doi: 10.1164/ajrccm.157.5.9708008. [DOI] [PubMed] [Google Scholar]
- 20.Norman RG, Rapoport DM, Ayappa I. Detection of flow limitation in obstructive sleep apnea with an artificial neural network. Physiol Meas. 2007;28:1089–1100. doi: 10.1088/0967-3334/28/9/010. [DOI] [PubMed] [Google Scholar]
- 21.Mulgrew AT, Fox N, Ayas NT, Ryan CF. Diagnosis and initial management of obstructive sleep apnea without polysomnography: a randomized validation study. Ann Intern Med. 2007;146:157–66. doi: 10.7326/0003-4819-146-3-200702060-00004. [DOI] [PubMed] [Google Scholar]
- 22.Flemons WW, Douglas NJ, Kuna ST, Rodenstein DO, Wheatley J. Access to diagnosis and treatment of patients with suspected sleep apnea. Am J Respir Crit Care Med. 2004;169:668–72. doi: 10.1164/rccm.200308-1124PP. [DOI] [PubMed] [Google Scholar]
- 23.McArdle N, Singh B, Murphy M, et al. Continuous positive airway pressure titration for obstructive sleep apnoea: automatic versus manual titration. Thorax. 2010;65:606–11. doi: 10.1136/thx.2009.116756. [DOI] [PubMed] [Google Scholar]
- 24.Stradling JR, Barbour C, Pitson DJ, Davies RJ. Automatic nasal continuous positive airway pressure titration in the laboratory: patient outcomes. Thorax. 1997;52:72–5. doi: 10.1136/thx.52.1.72. [DOI] [PMC free article] [PubMed] [Google Scholar]
- 25.Masa JF, Jimenez A, Duran J, et al. Alternative methods of titrating continuous positive airway pressure: a large multicenter study. Am J Respir Crit Care Med. 2004;170:1218–24. doi: 10.1164/rccm.200312-1787OC. [DOI] [PubMed] [Google Scholar]
- 26.Vennelle M, White S, Riha RL, Mackay TW, Engleman HM, Douglas NJ. Randomized controlled trial of variable-pressure versus fixed-pressure continuous positive airway pressure (CPAP) treatment for patients with obstructive sleep apnea/hypopnea syndrome (OSAHS) Sleep. 2010;33:267–71. doi: 10.1093/sleep/33.2.267. [DOI] [PMC free article] [PubMed] [Google Scholar]
- 27.Ayappa I, Norman RG, Whiting D, et al. Irregular respiration as a marker of wakefulness during titration of CPAP. Sleep. 2009;32:99–104. [PMC free article] [PubMed] [Google Scholar]
- 28.Condos R, Norman RG, Krishnasamy I, Peduzzi N, Goldring RM, Rapo-port DM. Flow limitation as a noninvasive assessment of residual upper-airway resistance during continuous positive airway pressure therapy of obstructive sleep apnea. Am J Respir Crit Care Med. 1994;150:475–80. doi: 10.1164/ajrccm.150.2.8049832. [DOI] [PubMed] [Google Scholar]
- 29.Patruno V, Aiolfi S, Costantino G, et al. Fixed and autoadjusting continuous positive airway pressure treatments are not similar in reducing cardiovascular risk factors in patients with obstructive sleep apnea. Chest. 2007;131:1393–9. doi: 10.1378/chest.06-2192. [DOI] [PubMed] [Google Scholar]
- 30.Stradling JR, Hardinge M, Paxton J, Smith DM. Relative accuracy of algorithm-based prescription of nasal CPAP in OSA. Respir Med. 2004;98:152–4. doi: 10.1016/j.rmed.2003.09.009. [DOI] [PubMed] [Google Scholar]
- 31.Teschler H, Berthon-Jones M. Intelligent CPAP systems: clinical experience. Thorax. 1998;53:S49–54. doi: 10.1136/thx.53.2008.s49. [DOI] [PMC free article] [PubMed] [Google Scholar]
- 32.Clark SA, Wilson CR, Satoh M, Pegelow D, Dempsey JA. Assessment of inspiratory flow limitation invasively and noninvasively during sleep. Am J Respir Crit Care Med. 1998;158:713–22. doi: 10.1164/ajrccm.158.3.9708056. [DOI] [PubMed] [Google Scholar]
- 33.Ayappa I, Norman RG, Hosselet JJ, Gruenke RA, Walsleben JA, Rapo-port DM. Relative occurrence of flow limitation and snoring during continuous positive airway pressure titration. Chest. 1998;114:685–90. doi: 10.1378/chest.114.3.685. [DOI] [PubMed] [Google Scholar]
- 34.Guilleminault C, Stoohs R, Clerk A, Cetel M, Maistros P. A cause of excessive daytime sleepiness. The upper airway resistance syndrome. Chest. 1993;104:781–7. doi: 10.1378/chest.104.3.781. [DOI] [PubMed] [Google Scholar]
- 35.Guilleminault C, Winkle R, Korobkin R, Simmons B. Children and nocturnal snoring: evaluation of the effects of sleep related respiratory resistive load and daytime functioning. Eur J Pediatr. 1982;139:165–71. doi: 10.1007/BF01377349. [DOI] [PubMed] [Google Scholar]
- 36.Hoffstein V, Mateika S. Predicting nasal continuous positive airway pressure. Am J Respir Crit Care Med. 1994;150:486–8. doi: 10.1164/ajrccm.150.2.8049834. [DOI] [PubMed] [Google Scholar]
Associated Data
This section collects any data citations, data availability statements, or supplementary materials included in this article.
Supplementary Materials
Individual patient data RDI and OI over all nights where flow data was collected.


