

Abstract
Soluble epoxide hydrolase inhibitors (sEHIs) are anti-inflammatory, analgesic, anti-hypertensive, cardio- and renal-protective in multiple animal models. However, the earlier adamantyl-containing urea-based inhibitors are rapidly metabolized. Therefore, new potent inhibitors with the adamantyl group replaced by a substituted phenyl group were synthesized to presumptively offer better pharmacokinetic (PK) properties.. Here we describe the improved PK profile of these inhibitors and the anti-inflammatory effect of the most promising one in a murine model. The PK profiles of inhibitors were determined following p.o. administration and serial bleeding in mice. The anti-inflammatory effect of 1-trifluoromethoxyphenyl-3-(1-propionylpiperidin-4-yl)urea(TPPU), the most promising inhibitor among the five sEHIs tested, was investigated in a lipopolysaccharide (LPS)-challenged murine model. The earlier broadly-used adamantyl-containing sEHI, trans-4-[4-(3-adamantan-1-yl-ureido)-cyclohexyloxy]-benzoic acid (t-AUCB), was used for comparison. Compared with the earlier adamantyl-containing urea-based inhibitors, substituted phenyl-containing urea-based inhibitors afford more favorable PK properties, such as higher Cmaxs, larger AUCs and longer t1/2s, which, as expected, show more stable metabolic stability. Moreover, oral administration of TPPU dramatically reversed the shifts caused by LPS-challenge in plasma levels of inflammatory cytokines, epoxides and corresponding diols, which is more potent than t-AUCB. The substituted phenyl-containing sEHIs are more metabolically stable than those with adamantyl group, resulting in more potent efficacy in vivo. This indicates a new strategy for development of sEHIs for further study toward clinical trials.
Keywords: anti-inflammation, bioavailability, pharmacokinetics, eicosanoids, metabolic profiling
1. Introduction
Soluble epoxide hydrolase (sEH) is a ubiquitous enzyme that catalyzes the conversion of epoxides into the corresponding vicinal diols by the addition of water (Hammock et al., 1980; Morisseau and Hammock, 2005; Newman et al., 2005). For example, sEH catalyzes the metabolism of anti-inflammatory and vasodilatory epoxyeicosatrienoic acids (EETs) into the more polar and pro-inflammatory dihydroxyeicosatrienoic acid (DHETs) (Chacos et al., 1983; Morisseau and Hammock, 2005; Newman et al., 2005). Pharmacological inhibition of sEH by sEH inhibitors (sEHIs) has been demonstrated to be an effective approach to reduce inflammation, pain, and hypertension among others (Ingraham et al., 2011; Qiu et al., 2011). Significant progress has been made in recent years in the development of the amide-, urea- and carbamate-based compounds as potent sEHIs (Morisseau et al., 1999). N,N′-Dicyclohexylurea (DCU) was the first sEHI tested in spontaneously hypertensive rats (SHR), and it was effective in lowering blood pressure (Yu et al., 2000). Another sEHI 1-cyclohexyl-3-dodecyl urea (CDU) was reported not only to attenuate human vascular smooth muscle cell proliferation dose-dependently in vitro (Davis et al., 2002), but also to be anti-hypertensive and renal protective in a rodent model of angiotensin II-induced hypertension (Imig et al., 2002; Zhao et al., 2004). However, these inhibitors have high melting points and poor solubility in either water or oil, which limits their pharmacological use. Therefore a new series of N, N′-substituted urea was then designed to desirably improve the water solubility and melting point from the early inhibitors (Kim et al., 2004; Morisseau et al., 2002). Among such series, 1-adamantanyl-3-{5-[2-(2-ethoxyethoxy)ethoxy]pentyl}urea (AEPU), N-adamantyl-N′-dodecylurea (ADU), 12-(3-adamantan-1-yl-ureido)-dodecanoic acid (AUDA) and its butyl ester (AUDA-BE) have been widely tested in animal models for anti-inflammation (Schmelzer et al., 2005; Smith et al., 2005), analgesic (Inceoglu et al., 2006; Schmelzer et al., 2006), anti-hypertension (Imig et al., 2005; Loch et al., 2007; Revermann et al., 2009), renal-protection (Huang et al., 2007; Parrish et al., 2009), and cardio-protection (Dorrance et al., 2005; Xu et al., 2006). These compounds have improved water solubility and melting points in comparison to the earlier sEHIs such as DCU and CDU. However, they were rapidly metabolized and excreted due to the facile oxidation of their flexible alkyl chain, which limits their use in vivo. Therefore, conformationally-restricted sEHIs such as 1-(1-acetypiperidin-4-yl)-3-adamantanylurea (APAU) and trans-4-[4-(3-adamantan-1-yl-ureido)-cyclohexyloxy]-benzoic acid (t-AUCB) were synthesized based on the hypothesis that conformationally-restricted compounds will eliminate beta oxidation, resulting in improved metabolic stability (Hwang et al., 2007; Jones et al., 2006). This hypothesis was supported by subsequent pharmacokinetics (PK) studies in murine and canine models (Liu et al., 2009; Tsai et al., 2010).
In several biological studies both the cis- and trans-isomers of AUCB demonstrated anti-inflammatory (Liu et al., 2009; Manhiani et al., 2009; Rose et al., 2010), anti-hypertensive (Revermann et al., 2009), cardio-protective (Ai et al., 2009; Chaudhary et al., 2010; Li et al., 2009) and renal-protective effects (Manhiani et al., 2009). However, the adamantyl group has been shown in pharmacology to be metabolically unstable (Lamoureux and Artavia, 2010). For example, the adamantyl group at t-AUCB gave an attractive PK profile for once a day oral dosing in dogs, but in other species it required higher and more frequent doses for efficacy. Interestingly, we found in previous studies that TPAU (containing 4-trifluoro-methoxy-phenyl group) is more metabolically stable than APAU (containing adamantyl group) (Liu et al., 2009; Tsai et al., 2010), suggesting a possibility that replacement of an adamantyl group by a substituted phenyl group may improve the metabolic stability of urea-based sEHIs. To test this hypothesis, a series of substituted phenyl urea-based compounds were synthesized. The PK profiles of five such inhibitors that afford favorable IC50s in vitro (Table 1) were then tested in a murine model at four different doses with single oral administration. Here we present the PK profiles of these compounds and the anti-inflammatory effect of 1-(4-trifluoro-methoxy-phenyl)-3-(1-propionylpiperidin-4-yl)urea (TPPU), the most promising compound among the five tested compounds in murine models.
Table 1.
Structure and in vitro activity of the sEH inhibitors
| Inhibitors | Structures | IC50 (nM)a, b |
|
|---|---|---|---|
| Human sEH | Murine sEH | ||
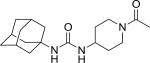
| APAU |
|
7.0 (300) | 9 |
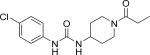
| CPPU |
|
10 (280) | 23 |
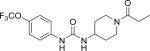
| TPPU |
|
3.7 (48) | 8.3 |
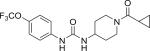
| TCPU |
|
0.4 (38) | 5.3 |
| TUPS |
|
2.9 (26) | 5.1 |
| t-AUCB |
|
1.3 (5) | 8 |
| t-TUCB |
|
5.2 (9) | 11 |
The data are presented as a mean of triplicate bioassay, the relative standard deviation (RSD) for each compound is less than 20%.
Fluorescent-based assay: human and mouse sEHs were incubated with inhibitors for 5 min in 25 mM Bis-Tris/HCl buffer (200 μL; pH 7.0) at 30°C before introduction of the fluorescent substrate (CMNPC, [S] = 5 μM), results are averages of three separate measurements each based on multiple concentrations both above and below the IC50. The fluorescent assay can overestimate the relative potency of sEH inhibition for piperidine-containing urea based sEH inhibitors. The IC50 values determined using [3H] t-DPPO as substrate are shown in parentheses.
2. MATERIALS AND METHODS
2.1 Materials
Methanol, acetonitrile, and ethyl acetate were purchased from Fisher Scientific (Pittsburgh, PA). Acetic acid, polyethylene glycol (average molecular weight: 400, PEG400) and LPS (Escherichia coli serotype 0111:B4) were purchased from Sigma-Aldrich (St. Louis, NJ). EDTA(K3) was purchased from Tyco Health Group LP (Mansfield, MA). Water (>18.0 MΩ) was purified by a NANO pure system (Barnstead, Newton, MA). All the sEHIs used in this study were synthesized in this laboratory, and their structures and purity were confirmed by chromatographic and spectral analysis (TLC, MS, NMR, and LC-MS). Mice were purchased from Charles River Laboratories and all the experiments were performed according to the protocols approved by the Animal Use and Care Committee of University of California-Davis.
2.2 Methods
2.2.1 Determination of in vitro IC50
The in vitro IC50 values of the inhibitors of human and mouse sEHs were determined using previously reported fluorescence method using cyano(2-methoxynaphthalen-6-yl)methyl(3-phenyloxiran-2-yl)methyl carbonate (CMNPC) as the substrate (Jones et al., 2005). Specifically, human and mouse sEHs were incubated with sEHIs for 5 min in 25 mM Bis-Tris/HCl buffer (200 μL; pH 7.0) at 30 °C before fluorescent substrate (CMNPC) introduction ([S] = 5 μM). In each case, the appropriate affinity purified recombinant enzyme was used (Jones et al., 2005; Morisseau et al., 1999). The rates of formation of the fluorescent product were linear for the duration of the assay. Relative IC50 values were also determined by using the radioactive substrate [3H]-1,3-diphenyl-trans-propene oxide (t-DPPO) (Borhan et al., 1995). Results were averages of three separate measurements each based on multiple concentrations both above and below the IC50. Standard deviations of enzyme activities among inhibitor concentration replicates were less than 10% of the average.
2.2.2 PK protocols
Male Swiss Webster mice (8-week old, 24-30 g) were used for PK studies. Inhibitors for oral administration were dissolved in oleic acid-rich triglyceride containing 20% PEG400 (v/v) to give a clear solution. Solutions were warmed to body temperature before administration. For i.v. injection, TPPU was dissolved in ethanol and then diluted with saline (ethanol/saline (v/v): 0.5%) to give a clear solution. Blood (10 μL) was collected from the tail vein using a pipette tip rinsed with 7.5% EDTA(K3) at 0, 0.5, 1, 1.5, 2, 4, 6, 8, 24 h after administration of the inhibitor. In addition to the above-mentioned time points, blood was collected in addition15 minutes after i.v. injection of sEHI. Each group contained 4 animals that were specified in Table 2. Each blood sample was immediately transferred to a tube containing 50 μL of water containing 0.1% EDTA. After being mixed strongly on a Vortex for 1 min, all samples were stored at -80 °C until analysis.
Table 2.
Pharmacokinetic parameters of sEH inhibitors after oral gavage with a non-compartmental analysis
| Inhibitors | Doses (mg/kg) | Cmaxa (nmol/L) | Tmax(h)a | AUCt (uM•h)a | MRT (h)a |
|---|---|---|---|---|---|
| CPPUb | 0.1 (0.32d) 0.3 (0.97d) 1.0 (3.23d) 3.0 (9.68d) |
140±35 420±85 2600±1680 11980±5590 |
6.7±2.3 6.7±1.2 4.7±1.2 1.8±0.3 |
2.3±0.4 6.1±1.7 31.7±18.4 140±93 |
13.1±13.5 16.4±6.3 17.2±7.3 17.1±1.3 |
| TPPUb | 0.1 (0.28d) 0.3 (0.83d) 1.0 (2.78d) 3.0 (8.35d) |
445±200 1565±325 5370±730 7100±1750 |
2±0 2±0 2.7±1.2 3.7±1.8 |
26.0±16.0 76.9±26.4 220±21 344±84 |
56.9±5.4 69.5±2.2 26.8±2.2 24.0±0.2 |
| TCPUb | 0.1 (0.27d) 0.3 (0.81d) 1.0 (2.69d) 3.0 (8.08d) |
270±120 1680±1170 2560±95 5160±265 |
5.3±1.2 4.7±1.2 3.2±2.2 3.9±2.5 |
2.2±1.1 16.6±8.8 43.8±5.1 94.3±8.0 |
18.9±6.6 16.9±5.4 24.0±1.8 32.1±5.6 |
| TUPSb | 0.1 (0.26d) 0.3 (0.79d) 1.0 (2.62d) 3.0 (7.86d) |
UQe 370±90 1650±375 2865±1170 |
- 3.3±1.2 6.4±3.2 4.5±1.9 |
- 5.3±1.3 24.2±7.0 48.5±19.2 |
- 21.5±1.5 17.4±4.6 22.7±13.3 |
| t-TUCBb | 0.1 (0.23d) 0.3 (0.68d) 1.0 (2.28d) 3.0 (6.84d) |
UQe 45±30 410±245 2115±1170 |
- 6.0±0 5.9±2.4 2.6±2.3 |
- 0.4±0.2 4.5±2.8 16.1±8.1 |
- 12.6±7.3 12.6±5.2 8.0±2.0 |
|
t-AUCBb,c APAUb,c |
1.0 (2.43d) 1.0 (3.12d) |
150±23 53±28 |
0.5±0 0.5±0 |
1.4±0.3 0.35±0.15 |
20±4.2 22.2±4.3 |
Tmax, the time of maximum concentration; Cmax, the maximum blood concentration; MRT, the mean residence time; and AUCt, area under the concentration–time curve to terminal time. Additional PK parameters with non-compartmental model are presented in Table S3.
Data represent the mean ± s.d. of 4 mice. 10 uL of blood was collected from the tail vein of mice at 0, 0.5, 1, 1.5, 2, 4, 6, 8, 24 h after dosing with the inhibitors.
Data of t-AUCB and APAU are from (Liu et al., 2009).
The dose with the unit of μmol/kg.
UQ means under the limit of quantitation (LOQ) for the compound. The LOQ values are 0.4 and 0.2 nmol/L for TUPS and t-TUCB, respectively.
2.2.3 Preparation of blood samples for the PK study
The extraction of sEHIs from blood was performed by a slight modification of a previous method (Liu et al., 2009). Specifically, ethyl acetate (200 μL) was added after the addition of internal solution I [10 μL, 0.5 μM of 1-(4-chloro-3-trifluoromethanylphenyl-3-(1-cyclopropanecarboxylpiperidin-4-yl)urea in methanol] to each thawed blood sample instead of prior to the addition of internal solution I.
2.2.4 Analysis of sEH inhibitors in blood samples
The blood concentrations of sEHIs were determined using a HPLC-MS/MS method which was validated to assure acceptable accuracy and precision (accuracy more than 95% with RSD less than 10%). Specifically, chromatographic separation was performed on an Agilent 1200 SL liquid chromatography instrument (Agilent, Corporation, Palo Alto, CA) equipped with a 4.6 × 150 mm Inertsil ODS-4 3 μm column (GL Science Inc. Torrance, CA) held at 50 °C. The solvent system consisted of water/acetic acid (999/1 v/v, solvent A) and acetonitrile/acetic acid (999/1 v/v; solvent B). The gradient is presented in Table SI. The injection volume was 10 μL and the samples were kept at 4 °C in the auto sampler. Analytes were detected by negative mode electrospray ionizations tandem quadrupole trap mass spectrometry in multiple reaction-monitoring mode (MRM) on a Trap 4000 Mass Spectrometer (ABI, Milford, MA). The parameters of MS condition were the same as presented previously (Rose et al., 2010). The precursor and dominant product ions were used to set up the transition monitored in the MRM mode (See supplementary information, Table SII).
2.2.5 PK analysis
The PK parameters of individual mice were firstly calculated by fitting the time course curve of blood concentration data to a non-compartmental analysis with the WinNonlin software (Pharsight, Mountain View, CA). Furthermore, the PK parameters of individual mice were calculated with 1- or 2-compartmental analysis with WinNolin software. Parameters estimated include the elimination rate constant (λz), time of maximum concentration (Tmax), maximum concentration (Cmax), first order absorption half life (t1/2a), first order apparent half life (t1/2d), half-life of distribution phase (t1/2α), half-life of elimination phase (t1/2β), area under the concentration–time curve extrapolated to infinity (AUCi), area under the concentration–time curve to terminal time (AUCt), clearance (Cl); apparent volume distribution (Vd), volume distribution at steady state (Vdss), and the mean residence time (MRT). AUC was calculated by the linear/log trapezoidal rule.
2.2.6 Evaluation of the in vivo efficacy of TPPU
Male Swiss Webster mice (9-week old, 30-35 g) were used in all treatments. Animals were assigned at random to each group (n=6). Animals were housed in separate cages and were treated following the protocol in Table V. Food intake and body weight were monitored once a day for each animal. Mice were sacrificed 24 or 48 h after treatment. Blood was collected to separate plasma following the previously reported protocol (Liu et al., 2009). Tissues were removed and immediately frozen with liquid nitrogen. All samples were stored at -80 °C until analysis.
2.2.7 Metabolic profiling of plasma oxylipins
Plasma (250 μL) was prepared according to the previous protocol reported by Yang et al for oxylipin analysis by the previous LC/MS/MS method (Yang et al., 2009).
2.2.8 Measurement of plasma cytokines
Plasma cytokine levels were analyzed using a Cytometric Bead Array (CBA) mouse inflammation kit. Briefly, thawed plasma samples (30 μL each) were mixed for 2 hours at room temperature with florescence-labeled capture beads and the PE detection reagents to measure the concentrations of interleukin-6 (IL-6), monocyte chemoattractant protein-1 (MCP-1), tumor necrosis factor-α (TNF-α) and interferon-gamma (IFN-γ). Samples were then washed with washing buffer and analyzed on a FACScan flow cytometer (BD Immunocytometry Systems). Data were analyzed using BD CBA Analysis software (BD Immunocytometry Systems).
2.2.9 Statistical analysis
All results were expressed as mean ± s.d. unless other noted. The experimental results of the in vivo efficacy study were analyzed by one way ANOVA using the software SPSS 10.0 (SPSS Inc., Chicago, IL) with P < 0.05 as the significance level.
3 RESULTS
3.1 In vitro inhibitory potency of five inhibitors against human and murine sEHs
The structure and in vitro inhibitory activity of five urea-based sEH inhibitors containing substituted phenyl groups and two urea-based sEH inhibitors containing an adamantyl group are presented in Table 1. In regard to the in vitro potency against human sEH, substituted phenyl-containing compounds give lower IC50 values by the fluorescent assay than those by radioactive assay. Tsai et al cautioned earlier that for some potent compounds, particular piperidine derivatives, the fluorescent assay can overestimate the relative potency of sEH inhibition (Tsai et al., 2010).
3.2 PK profiles of five inhibitors following oral administration
Figure 1 illustrates the blood levels of five inhibitors following oral administration to mice throughout the whole time course tested (24 h). The blood levels increased along with the increase in doses for all the investigated inhibitors. The inhibitors CPPU, TPPU, and TPCU provided the blood levels above their in vitro IC50 values throughout the sampling time, even at the lowest dose of 0.1 mg/kg, whereas the blood concentration of inhibitors TPUS and t-TUCB were under the respective detection limit at the oral dose of 0.1 mg/kg. In the case of compounds containing a substituted phenyl group, the inhibitors containing a piperidyl group (CPPU, Figure 1A; TPPU, Figure 1B; TPCU, Figure 1C; TUPS, Figure 1D) resulted in higher blood concentration than the one containing a cyclohexyloxy-benzoic acid ( t-TUCB, Figure 1E). However, in respect to the compounds containing a cyclohexyloxy-benzoic acid group, the replacement of an adamantyl (t-AUCB) by a substituted phenyl (t-TUCB, Figure 1E) led to higher blood concentrations (Liu et al., 2009).
Fig. 1.

Blood concentration-time courses of six sEH inhibitors after oral administration to mice. (A) CPPU; (B) TPPU; (C) TPCU; (D) TPUS; (E) t-TUCB. Each point represents the mean ± s.d. of four mice plotted in a log/linear scale. Blood was collected from the tail vein of mice before (as 0) and at 0.5, 1, 1.5, 2, 4, 6, 8, 24 h after administration of the inhibitors, respectively. The dotted line represents the IC50 of the respective inhibitor against murine sEH. CPPU: 1-(4-Cholo-Phenyl)- 3-(1-Propionyl-piperidin-4-yl)-Urea; TPPU: 1-(4-Trifluoro-methoxy-Phenyl)-3-(1-Propionyl-piperidin-4-yl)-Urea; TPCU, 1-(4-Trifluoro-methoxy-Phenyl)-3- (1-Cyclopropanecarbonyl-piperidin-4-yl)-Urea; TPUS: 1-(1-methanesulfonyl-piperidin-4-yl)-3-(4-trifluoromethoxy-phenyl)-urea; t-TUCB: trans-4-[4-[3-(4-Trifluoromethoxy-phenyl)-Ureido]-cyclohexyloxy]-Benzoic acid.
The major PK parameters based on a non-compartmental analysis are summarized in Table 2. R2 was used to evaluate the correlation between observed and predicted values. Overall, blood levels and PK parameters from the investigated five inhibitors at the dose of 0.3 mg/kg are better than those from the earlier inhibitor t-AUCB or APAU at the dose of 1 mg/kg (Liu et al., 2009). Short Tmax and high Cmax roughly reflect a quick and strong absorption while high MRT generally reflects a slow elimination. Except for TUPS and t-TUCB at the dose of 0.1 mg/kg, the Cmaxs for the five compounds at tested doses were above their respective in vitro IC50 values. The Tmaxs for all the investigated compounds (3~8 h) were longer than those of earlier inhibitors such as t-AUCB and APAU (0.5 h) (Liu et al., 2009), suggesting a slower absorption rate for the compounds containing substituted phenyl groups when compared with ones containing an adamantyl group. The MRTs of investigated inhibitors are comparable to the earlier inhibitors t-AUCB and APAU.
3.3 PK profile of TPPU following i.v. injection
Figure 2 illustrates the blood levels of TPPU following i.v. administration to mice at the dose of 0.01 mg/kg throughout the complete investigation time (24 h). TPPU has two distinct phases of excretion- distribution (α) and elimination (β) phases, which was further supported by comparing the AIC values and the correlation between the observed and predicted values. Table 4 summarizes the PK parameters based on the 2-compartmental analysis. Specifically, the distribution phase had a sharp slope with t1/2α of 0.4 h while the elimination phase had a very flat slope with t1/2β more than 24 h. Vdss is a parameter to characterize the tissue distribution of drugs. TPPU has a Vdss of 4.8 L • kg-1, indicating a moderate peripheral tissue distribution of TPPU. The blood clearance of TPPU is 1.2 h, corresponding to the long elimination half life.
Fig. 2.
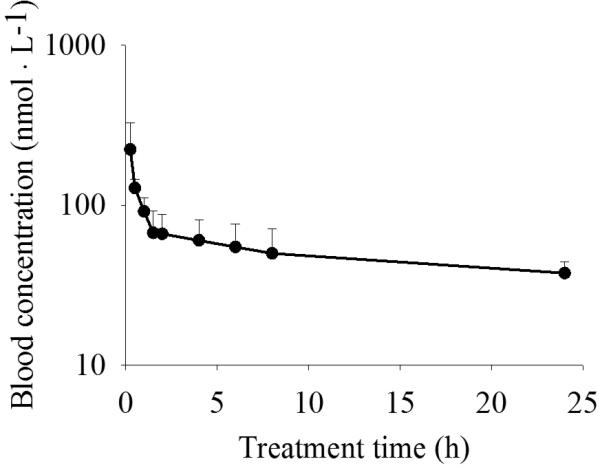
Blood concentration-time course of TPPU after i.v. injection to mice at a dose of 0.01 mg/kg plotted in a log/linear scale. Each point represents the mean ± s.d. of four mice. Blood was collected from the tail vein of mice before (as 0) and at 0.25, 0.5, 1, 1.5, 2, 4, 6, 8, 24 h after administration of the inhibitors, respectively.
Table 4.
TPPU inhibited LPS-induced increased release of inflammatory cytokines in plasma (pg·mL-1)
| Group | N | Treatment (mg/kg) |
Terminated time (h) | TNF-α | INF-γ | MCP-1 | IL-10 | IL-6 | ||
|---|---|---|---|---|---|---|---|---|---|---|
| LPS | TPPU | t-AUCB | ||||||||
| 1 | 6 | - | - | - | 48 | 4.5 ± 1.3 | 1.5 ± 0.4 | 25 ± 14 | 8 ± 0.3 | 2.0 ± 0.8 |
| 2 | 6 | 3 | - | - | 24 | 21 ± 3* | 6.0 ± 1.6* | 1310±560* | 9.1 ± 0.5* | 52 ± 16* |
| 3 | 6 | 3 | - | - | 48 | 18 ± 7* | 1.7 ± 0.4 | 380 ± 130* | 8.2 ± 0.5 | 50 ± 19* |
| 4 | 6 | 3 | 3 | - | 24 | 28 ± 14* | 9.7 ± 3.0* | 1970 ± 900* | 8.7 ± 0.4 | 118 ± 65* |
| 5 | 6 | 3 | 3 | - | 48 | 11 ± 1†,* | 2.0 ± 0.5 | 260 ± 50* | 7.7 ± 0.5 | 9 ± 0.5†,* |
| 6 | 6 | 3 | - | 3 | 24 | 26 ± 5* | 7.7 ± 4.2* | 1870 ± 580* | 8.7 ± 0.6 | 74 ± 27* |
| 7 | 6 | 3 | - | 3×2a | 48 | 11 ± 3* | 2.2 ± 0.5 | 355 ± 150* | 8.0 ± 0.2 | 15 ± 13† |
The mice in group 7 were administered with t-AUCB twice. One was administered immediately after LPS injection, and another was administered at 24 h after LPS injection.
Significantly different (P < 0.01) from group 1
significantly different (P < 0.05) from group 3 were determined by ANOVA followed with Tukey's or Games-Howell's test.
3.4 Oral Bioavailability of TPPU
Based on the AUC values from Table 3 and 4, the oral bioavailability of TPPU were calculated as 43 ± 25%, 36 ± 5%, 31 ± 2%, and 18 ± 3% for the doses of 0.1, 0.3, 1.0 and 3.0 mg/kg, respectively.
Table 3.
Pharmacokinetic parameters of two sEH inhibitors after i.v. injection with a 2-compartmental analysis
| PK parameters | Units | Valuesa |
|
|---|---|---|---|
| TPPU | t-AUCBc | ||
| T1/2αb | h | 0.4 ± 0.1 | 1.2 ± 0.5 |
| T1/2βb | h | >24 | 10 ± 2 |
| AUCtb | umol •L-1•h | 3.5 ± 0.4 | 0.4 ± 0.1 |
| Clb | L •h-1•kg-1 | 1.2 ± 0.1 | 0.7 ± 0.1 |
| Vdssb | L •kg-1 | 4.8 ± 1.8 | 17 ± 7 |
Data represent average ± s.d of 4 mice. The dose treated was 0.01 mg/kg (0.024 μmol/kg). 10 uL of blood was collected from the tail vein of mice at 0, 0.25, 0.5, 1, 1.5, 2, 4, 6, 8, 24 h after dosing with the inhibitors.
AUCi, area under the concentration-time curve to terminal time; t1/2α, half life of distribution phase; t1/2β, half life of elimination phase; Cl, clearance; Vdss, volume distribution at steady state; The PK parameters with non-compartmental model are presented in SI Table 7
Data of t-AUCB are from (Liu et al., 2009).
3.5 TPPU attenuates the LPS-challenged inflammation in a murine model
LPS challenge results in severe inflammation characterization by a reduction in food consumption and body weight loss (Faggioni et al., 1997). After LPS-challenge, the mice ate nothing during the 1st day. Oral administration of TPPU or t-AUCB did not improve the animals’ appetite in 1st day post LPS challenge (data not shown). However, administration of TPPU significantly improved the animals’ appetite during the 2nd day while t-AUCB did not (Fig. S1). In addition, the animals lost body weight dramatically after LPS-challenge and administration of sEH inhibitors was not observed to be beneficial to retaining body weight on either 1st or 2nd day post LPS challenge (data not shown).
Plasma levels of (TNF-α, INF-γ, IL-10, and IL-6) and chemokine (MCP-1) were then measured to characterize the inflammatory progression (Table 4). LPS-challenge dramatically increased the plasma levels of all cytokines and the chemokine tested one day post treatment. The plasma levels of TNF-α, MCP-1, and IL-6 were still significantly higher than normal levels while plasma levels of INF-γ and IL-10 recovered to normal levels two days after LPS-challenge. Neither the administration of TPPU nor the t-AUCB treatment demonstrated a beneficial effect in reduction of cytokine or chemokine release one day after treatment. However, administration of both TPPU and t-AUCB significantly inhibited the LPS-induced increased plasma levels of TNF-α and IL-6 two days post treatment. In addition, the data indicate that TPPU is likely more potent than t-AUCB in modulation of cytokine profile towards the resolution of inflammation.
3.6 In vivo efficacy of TPPU on shifting the metabolic profile of oxylipin as a sEHI in a murine model of inflammation
Epoxides of free fatty acids, such as EpOMEs and EETs, can be metabolized to the corresponding vicinal diols in presence of sEH. Therefore, pharmacological inhibition of sEH by administration of sEH inhibitors inhibits the production of diols and/or increases the stability of epoxides, which can result in an increase in the ratio of epoxides to diols. These alterations are indicators of the efficacy of sEH inhibitors. The ratio of epoxides to diols has been regarded to be a biomarker for sEH action and target engagement of sEH inhibitors.
Fig. 3 shows the alterations in total EpOMEs, total EETs, total DHOMEs, total DHETs, and the ratio of epoxides to diols in response to the LPS-challenge and sEH inhibitor administration. When compared to the normal control, LPS-challenge significantly decreased plasma levels of total EETs 1- and 2- day after treatment while it did not significantly change the plasma level of total DHETs, resulting in a significant decrease in the plasma ratio of EETs to DHETs in both days after treatment. In regarding to EpOMEs and DHOMEs, LPS-challenge did not change their plasma levels significantly. However, the ratio of EpOMEs to DHOMEs decreased significantly1-day post LPS-challenge. Administration of TPPU significantly reversed the shifts resulting from the LPS-challenge. Specifically, TPPU administration significantly increased the plasma levels of both EETs and EpOMEs 1- and 2-day post treatment, while it significantly decreased the plasma levels of both DHOMEs and DHETs 2-day post LPS treatment. These alterations resulted in a significant increase in the plasma ratio of epoxides to diols (both EETs/DHETs and EpOMEs/DHOMEs) at 1- and 2-day after treatment. Administration of an older sEH inhibitor t-AUCB also significantly increased the plasma levels of EETs 1- and 2-day after LPS treatment, resulting in a significant increase in the plasma ratio of EETs to DHETs 1- and 2- day after LPS treatment. However, administration of t-AUCB did not result in significant changes in the plasma levels of EpOMEs, DHOMEs, or the corresponding ratio. In addition, a significantly larger plasma ratio of epoxides to diols at 2-day post treatments was observed from TPPU administration than that from t-AUCB administration, which indicates that TPPU is more potent than t-AUCB in sEH inhibition.
Fig. 3.

TPPU shifts the oxylipin profile as a potent sEHI. LPS challenge led to decrease in plasma levels of both EpOMEs (A) and EETs (D), resulting in the decrease in plasma ratio of epoxides to diols (C and F). The administration of sEH inhibitors TPPU and t-AUCB led to the increase in plasma levels of EpOMEs (A) and EETs (D) and/or decrease in plasma levels of DHOMEs (B) and DHETs (E), resulting in the increase in the plasma ratio of epoxides to diols (C and F). The plasma ratio of epoxides to diols is a biomarker of sEH action. The inhibitory activity of sEH from TPPU administration is more potent than that from t-AUCB administration based on the analysis of epoxides to diols ratio. The data represent mean ± sd of 6 mice. The animal treatment is as same as those in Table V. Different letters designate significant difference (P < 0.05) among groups determined by one way ANOVA followed by Tukey's or Games-Howell's test. Full oxylipin profile data are present in Table S4.
4 DISCUSSION
The adamantane group was used in some previous studies from this laboratory because of its ease of detection on positive mode LC/MS/MS. This high sensitivity allowed rapid PK screening of analogs to optimize another side of the molecules for potency. However, adamantane group is rapidly hydroxylated in the presence of some cytochrome P450 enzymes. Previous PK studies in murine and canine models showed that TPAU, a substituted phenyl group-containing sEHI, is more metabolically stable than APAU, an adamantyl-containing sEHI (Liu et al., 2009; Tsai et al., 2010). Therefore we hypothesize that substituted phenyl group-containing sEHIs may be generally more metabolically stable than adamantyl group-containing compounds. Inspection of the structures of the five sEHIs tested in Table 1, four compounds (TPPU, TCPU, TUPS and t-TUCB) contain p-trifluoromethoxyphenyl group and the CPPU contains p-chlorophenyl group. In addition, t-TUCB has the cyclohexyloxy-benzoic acid as does the previous sEHI t-AUCB, and other four compounds contain the piperidin-1-yl-one as found in APAU. The modification of the structure of these five inhibitors did not result in a large change in the in vitro potency against either the human or murine recombinant sEH (Table 1). Therefore, the PK profiles of these five inhibitors were tested by oral administration to mice as previously done for t-AUCB and APAU (Liu et al., 2009).
Four doses, including 0.1, 0.3, 1.0 and 3.0 mg/kg were used for each inhibitor. Three inhibitors (CPPU, TPPU and TCPU) resulted in detectable blood levels even at the lowest dose of 0.1 mg/kg while other two inhibitors (TUPS and t-TUCB) resulted in the blood levels under their respective quantitation limit at the lowest dose of 0.1 mg/kg (Fig. 1, Tables 2 and S1). As a general rule, the Cmax and AUCt increased along with the increase in dose. However, the increase in Cmax or AUCt is not simply proportional to the doses used. Specifically, at the dose of 3 mg/kg, the Cmaxs from the oral administration of CPPU ranked highest among the Cmaxs from all five inhibitors. However, at the dose of 1 mg/kg, administration of TPPU resulted in the highest Cmax among five inhibitors. In addition, oral administration of piperidine-containing inhibitors (CPPU, TPPU, TCPU and TUPS) resulted in higher Cmax, longer MRT and larger AUCt than those from the inhibitor containing cyclohexyloxy-benzoic acid (t-TUCB). This indicates that metabolic stability of piperidine-containing urea compounds are improved more dramatically than that of cyclohexyloxy-benzoic acid containing urea compounds. It was earlier noted that even minor changes in the amide component of piperidine compounds could lead to higher potency as a sEH inhibitor, dramatically decreased the in vivo blood levels of these sEH inhibitors in dogs (Tsai et al., 2010). This is not the case with trifluoromethoxyphenyl substituted piperidines. Interestingly, all the five compounds led to larger AUCts than the previous inhibitors APAU and t-AUCB at the same doses. This suggests that p-trifluoromethoxyphenyl and p-chlorophenyl are superior to admantanyl in improving AUCs. In addition, when compared with the previous sEHIs t-AUCB and APAU at the dose of 1 mg/kg, oral administration all the five new inhibitors resulted in longer Tmaxs (3~7 h vs 0.5 h) (Liu et al., 2009). This observation is supported by the longer t1/2as from 1-compartmental analyses. . These data assure us of the in vivo use of substituted phenyl-containing urea inhibitors.
The pharmacological potency of sEH inhibition is a combined function of the drug potency and the effective amount of drug at the target site. Therefore, the ratio of AUC to IC50 was used to estimate the pharmacological potency because it correlates the PK profile and drug potency. All the five substituted phenyl-containing inhibitors tested in this study are better than the previous adamantyl-containing APAU and t-AUCB in regarding to the AUC/IC50 ratio, and TPPU is the most promising one. These data reiterate that substituted phenyl groups are more favorable than the adamantyl group in improving the PK properties of urea-based sEHIs and in regard to this issue the p-trifluoromethoxyphenyl is better than p-chlorophenyl.
The PK properties of TPPU were then investigated by using i.v. injection. Like for the previous inhibitor t-AUCB, a 2-compartment model gives the best fit for TPPU with i.v injection. A short t1/2α (0.4 h) and a long t1/2β (>24 h) account for the long t1/2d from the oral administration, which was also supported by the long blood clearance Cl (1.2 h). TPPU had a moderate peripheral tissue distribution indicated by the Vdss (4.8 L • kg-1), which is supported by its water solubility (Rose et al., 2010). When compared with the previous inhibitor t-AUCB (Liu et al., 2009) administered with i.v. injection, TPPU showed a shorter t1/2α (0.4 h vs. 1.2 h) and a longer t1/2β (>24 h vs 10 h) and a larger AUCt (3.5 vs 0.4 umol • L-1 • h). This demonstrated that TPPU is more metabolically stable in vivo than t-AUCB. Similar results were also observed in rodent and non-human primate models, which demonstrated our hypothesis that substituted phenyls are more metabolically stable than adamantyl in urea-based sEH inhibitors. One assumes that the trifluoromethoxyl group blocks metabolism at the 4-position of the phenyl and that its electron withdrawing properties generally deactivate the phenyl toward P450 based aromatic hydroxylation. The oral bioavailability of TPPU decreased as the dose increased however the doses under 1 mg/kg resulted in similar oral bioavailabilities. This is supported by the observed relationship between AUCs and doses used (Fig S2). Specifically, the oral administration of TPPU under the dose of 1 mg/kg resulted in a linear increase in AUCs while oral administration of TPPU at 3 mg/kg led to an AUC less than the theoretical value expected from the linear trend. This may be mainly due to a decrease in the absorption rates with the increased dose. This hypothesis is supported by the facts that oral administration of the highest dose (3 mg/kg) resulted in the largest first order absorption half life while all the four doses tested resulted in the similar first order apparent half life. This is also supported by the observation that the larger dose resulted in a longer Tmax. To support high dose study, it would be useful to have i.v. PK data of the dose of 3 mg/kg to calculate the bioavailability of TPPU. However this would result in the precipitation of TPPU from the blood after i.v. injection because of its limited water solubility. This is also the reason that we used a dose of 0.01 mg/kg for the i.v. study of. Therefore, the oral bioavailability of TPPU at the dose of 3 mg/kg reported here is not based on ideal data because of the limitation in water solubility.
LPS-challenge results in acute systemic inflammation, together with the loss of appetite and body weight that are the hallmarks of acute and chronic diseases (PlataSalaman, 1996). Anti-inflammatory treatments are effective in improving the appetite in some animal models (Johnson et al., 2002). Therefore, the daily food-intake was used in this study as a phenotypic marker for the anti-inflammatory effect of sEH inhibitors. LPS-challenge also dramatically increases the release of inflammatory-related cytokines (e. g. TNF-α and IL-6), and arachidonic acid from cell membranes, as well as the induction of COX-2 and 5-LOX (Rose et al., 2010; Schmelzer et al., 2006; Schmelzer et al., 2005). Pro- or anti-inflammatory eicosanoids play a pivotal role in the resulting pain and inflammation. Generally, increased EETs levels following the administration of sEH inhibitors have a net positive effect on eicosanoids and cytokine levels leading towards the resolution of inflammation (Rose et al., 2010; Schmelzer et al., 2005). The dose of sEH inhibitors used in this study was suggested by a pilot study. In the pilot study, oral administration of TPPU at 3 mg·kg-1 improved animal's appetite at 2 days post treatment while no favorable effect was observed in the mice receiving TPPU treatment at 1 mg/kg. Previously sEHI t-AUCB has been demonstrated to be effective in anti-hypotension, anti-inflammation and cardio-protection in murine models (Li et al., 2009; Liu et al., 2009; Rose et al., 2010). However, in this study t-AUCB failed to improve the animal's appetite during observed period although it significantly inhibited the IL-6 release 2-day post treatment. This may be due to the fact that the food intake is one of the end phenotypes of disease and the regulation starting from sEH inhibition may require longer process and a more complicated program to take effect. In contrast, TPPU significantly improves the animal appetite on the 2nd day post treatment. This suggests that TPPU is more potent than t-AUCB in modulating the appetite-related system leading towards the resolution of inflammation. This concept is also supported by the levels of lipid epoxides and the ratios of epoxides to their respective diols. As shown in Fig. 3, a single dose of TPPU is more effective than two doses of t-AUCB in increasing epoxide levels, epoxide/diol ratios and decreasing diol levels, which supports the observations regarding food intake and cytokine levels. This efficacy is likely due to the better pharmacokinetic properties of TPPU. In comparing these data with previous studies from this laboratory using the murine sepsis model, please not that we are using a lower and more realistic dose of LPS in current study.
The treatment with TPPU resulted in a significant decrease in plasma levels of inflammatory cytokines which are significantly elevated at 2-day post LPS treatment. In addition, data from oxylipin analyses demonstrated a striking parallel of the increase in the plasma ratio of epoxides to diols to the decrease of inflammatory cytokines in this model with and without TPPU treatment. Specifically, there was a significant increase in the plasma levels of TNF-α and IL-6 2-days after LPS-challenge and treatment with TPPU resulted in the normalization of these cytokines. The higher efficiency of suppression of inflammatory cytokines by TPPU compared to t-AUCB may be attributed to higher potency of sEH inhibition from TPPU treatment compared to t-AUCB treatment. The fact that significant increase in plasma epoxide to diol ratios was observed 1 day after sEHIs treatment while slight changes in inflammatory cytokines was observed at the same time indicates that the changes in inflammatory cytokines is a downstream response to the sEH inhibition. This was further supported by the favorable observations on plasma epoxide to diol ratios and inflammatory cytokine levels two days post treatment.
5 CONCLUSIONS
In summary, this study shows that the substituted phenyl group-containing sEH inhibitor TPPU is better than the adamantane-containing t-AUCB in terms of PK properties and in vivo potency. This statement is supported by the improvement in the efficacy of TPPU over t-AUCB in attenuation of the LPS-challenged inflammation and the reverse in the shifts of epoxides, diols and epoxide/diol ratios as well as the suppression of the inflammation-associated cytokines. TPPU appears to be a better pharmacological tool than t-AUCB to test the biological role of sEH and the pharmacological function of sEH inhibitors in multiple animal models such as inflammation, particularly for long term animal studies where high potency and long half lives that will reduce the amount of compound needed for studies.
Supplementary Material
ACKNOWLEDGEMENTS
This work was supported in part by the National Institute of Environmental Health Sciences (NIEHS) ES02710, and NIEHS Superfund P42 ES04699 to BDH. The work is also supported in part by NIH/NHLBI (R01 HL075274 and HL085844) and the VA Merit Review Grant to NC. BDH is a George and Judy Marcus Senior Fellow of the American Asthma Foundation. H. Q. was supported by American Heart Association Western Affiliates postdoctoral fellowship award.
Abbreviations
- AEPU
1-adamantanyl-3-{5-[2-(2-ethoxyethoxy)ethoxy]pentyl}urea
- ADU
N-adamantyl-N′-dodecylurea
- AIC
Akaike information criterion
- t-AUCB
trans-4-[4-(3-adamantan-1-yl-ureido)-cyclohexyloxy]-benzoic acid
- APAU
1-(1-acetypiperidin-4-yl)-3-adamantanylurea
- AUDA
12-(3-adamantan-1-yl-ureido)-dodecanoic acid
- AUDA-BE
12-(3-adamantan-1-yl-ureido)-dodecanoic acid butyl ester
- BPAU
1-(5-butoxypentyl)-3-adamantylurea
- CDU
1-cyclohexyl-3-dodecyl urea
- CMNPC
cyano(2-methoxynaphthalen-6-yl)methyl(3-phenyloxiran-2-yl)methyl carbonate
- CPPU
1-chlorophenyl-3-(1-propionylpiperidin-4-yl)urea
- DCU
N,N′-dicyclohexylurea
- EET
epoxyeicosatrienoic acid
- DHET
dihydroxyeicosatrieneoic acid
- DHOME
dihydroxy octadecamonoeneoic acid
- EpOME
epoxyoctadecamonoeneoic acid
- HETE
hydroxyeicosatetraenoic acid
- NF-κB
nuclear factor kappa B
- LPS
lipopolysaccharide
- PEG400
polyethylene glycol (average molecular weight: 400)
- PG
prostaglandin
- PK
pharmacokinetics
- sEH
soluble epoxide hydrolase
- sEHI
sEH inhibitor
- TCPU
1-(4-trifluoro-methoxy-phenyl)-3-(1-cyclopropanecarboxylpiperidin-4-yl)urea
- TPAU
1-(4-trifluoro-methoxy-phenyl)-3-(1-acetylpiperidin-4-yl) urea
- TPPU
1-(4-trifluoro-methoxy-phenyl)-3-(1-propionylpiperidin-4-yl)urea
- t-TUCB
trans-1-(4-trifluoro-methoxy-phenyl)-3-((1-yl-ureido)-cyclohexyloxy)-benzoic acid
- TUPS
1-(1-methanesulfonyl-piperidin-4-yl)-3-(4-trifluoromethoxy-phenyl)-urea
Footnotes
Publisher's Disclaimer: This is a PDF file of an unedited manuscript that has been accepted for publication. As a service to our customers we are providing this early version of the manuscript. The manuscript will undergo copyediting, typesetting, and review of the resulting proof before it is published in its final citable form. Please note that during the production process errors may be discovered which could affect the content, and all legal disclaimers that apply to the journal pertain.
Appendix A. Supplementary data
REFERENCES
- Ai D, Pang W, Li N, Xu M, Jones PD, Yang J, Zhang Y, Chiamvimonvat N, Shyy JYJ, Hammock BD, Zhu Y. Soluble epoxide hydrolase plays an essential role in angiotensin II-induced cardiac hypertrophy. P Natl Acad Sci USA. 2009;106:564–569. doi: 10.1073/pnas.0811022106. [DOI] [PMC free article] [PubMed] [Google Scholar]
- Borhan B, Jones AD, Pinot F, Grant DF, Kurth MJ, Hammock BD. Mechanism of Soluble Epoxide Hydrolase - Formation of an Alpha-Hydroxy Ester-Enzyme Intermediate through Asp-333. J Biol Chem. 1995;270:26923–26930. doi: 10.1074/jbc.270.45.26923. [DOI] [PubMed] [Google Scholar]
- Chacos N, Capdevila J, Falck JR, Manna S, Martin-Wixtrom C, Gill SS, Hammock BD, Estabrook RW. The reaction of arachidonic acid epoxides (epoxyeicosatrienoic acids) with a cytosolic epoxide hydrolase. Archives of biochemistry and biophysics. 1983;223:639–648. doi: 10.1016/0003-9861(83)90628-8. [DOI] [PubMed] [Google Scholar]
- Chaudhary KR, Abukhashim M, Hwang SH, Hammock BD, Seubert JM. Inhibition of Soluble Epoxide Hydrolase by trans-4-[4-(3-adamantan-1-yl-ureido)-cyclohexyloxy]-benzoic acid Is Protective Against Ischemia-Reperfusion Injury. J Cardiovasc Pharm. 2010;55:67–73. doi: 10.1097/FJC.0b013e3181c37d69. [DOI] [PMC free article] [PubMed] [Google Scholar]
- Davis BB, Thompson DA, Howard LL, Morisseau C, Hammock BD, Weiss RH. Inhibitors of soluble epoxide hydrolase attenuate vascular smooth muscle cell proliferation. P Natl Acad Sci USA. 2002;99:2222–2227. doi: 10.1073/pnas.261710799. [DOI] [PMC free article] [PubMed] [Google Scholar]
- Dorrance AM, Rupp N, Pollock DM, Newman JW, Hammock BD, Imig JD. An epoxide hydrolase inhibitor, 12-(3-adamantan-1-yl-ureido)dodecanoic acid (AUDA), reduces ischemic cerebral infarct size in stroke-prone spontaneously hypertensive rats. J Cardiovasc Pharm. 2005;46:842–848. doi: 10.1097/01.fjc.0000189600.74157.6d. [DOI] [PMC free article] [PubMed] [Google Scholar]
- Faggioni R, Fuller J, Moser A, Feingold KR, Grunfeld C. LPS-induced anorexia in leptin-deficient (ob/ob) and leptin receptor-deficient (db/db) mice. Am J Physiol-Reg I. 1997;42:R181–R186. doi: 10.1152/ajpregu.1997.273.1.R181. [DOI] [PubMed] [Google Scholar]
- Hammock BD, Ratcliff M, Schooley DA. Hydration of an 18O epoxide by a cytosolic epoxide hydrolase from mouse liver. Life sciences. 1980;27:1635–1641. doi: 10.1016/0024-3205(80)90636-0. [DOI] [PubMed] [Google Scholar]
- Huang H, Morisseau C, Wang JF, Yang TX, Falck JR, Hammock BD, Wang MH. Increasing or stabilizing renal epoxyeicosatrienoic acid production attenuates abnormal renal function and hypertension in obese rats. Am J Physiol-Renal. 2007;293:F342–F349. doi: 10.1152/ajprenal.00004.2007. [DOI] [PubMed] [Google Scholar]
- Hwang SH, Tsai HJ, Liu JY, Morisseau C, Hammock BD. Orally bioavailable potent soluble epoxide hydrolase inhibitors. J Med Chem. 2007;50:3825–3840. doi: 10.1021/jm070270t. [DOI] [PMC free article] [PubMed] [Google Scholar]
- Imig JD, Zhao XY, Capdevila JH, Morisseau C, Hammock BD. Soluble epoxide hydrolase inhibition lowers arterial blood pressure in angiotensin II hypertension. Hypertension. 2002;39:690–694. doi: 10.1161/hy0202.103788. [DOI] [PubMed] [Google Scholar]
- Imig JD, Zhao XY, Zaharis CZ, Olearczyk JJ, Pollock DM, Newman JW, Kim IH, Watanabe T, Hammock BD. An orally active epoxide hydrolase inhibitor lowers blood pressure and provides renal protection in salt-sensitive hypertension. Hypertension. 2005;46:975–981. doi: 10.1161/01.HYP.0000176237.74820.75. [DOI] [PMC free article] [PubMed] [Google Scholar]
- Inceoglu B, Jinks SL, Schmelzer KR, Waite T, Kim IH, Hammock BD. Inhibition of soluble epoxide hydrolase reduces LPS-induced thermal hyperalgesia and mechanical allodynia in a rat model of inflammatory pain. Life Sci. 2006;79:2311–2319. doi: 10.1016/j.lfs.2006.07.031. [DOI] [PMC free article] [PubMed] [Google Scholar]
- Ingraham RH, Gless RD, Lo HY. Soluble Epoxide Hydrolase Inhibitors and their Potential for Treatment of Multiple Pathologic Conditions. Curr Med Chem. 2011;18:587–603. doi: 10.2174/092986711794480212. [DOI] [PubMed] [Google Scholar]
- Johnson PM, Vogt SK, Burney MW, Muglia LJ. COX-2 inhibition attenuates anorexia during systemic inflammation without impairing cytokine production. Am J Physiol-Endoc M. 2002;282:E650–E656. doi: 10.1152/ajpendo.00388.2001. [DOI] [PubMed] [Google Scholar]
- Jones PD, Tsai HJ, Do ZN, Morisseau C, Hammock BD. Synthesis and SAR of conformationally restricted inhibitors of soluble epoxide hydrolase. Bioorg Med Chem Lett. 2006;16:5212–5216. doi: 10.1016/j.bmcl.2006.07.009. [DOI] [PMC free article] [PubMed] [Google Scholar]
- Jones PD, Wolf NM, Morisseau C, Whetstone P, Hock B, Hammock BD. Fluorescent substrates for soluble epoxide hydrolase and application to inhibition studies. Anal Biochem. 2005;343:66–75. doi: 10.1016/j.ab.2005.03.041. [DOI] [PMC free article] [PubMed] [Google Scholar]
- Kim IH, Morisseau C, Watanabe T, Hammock BD. Design, synthesis, and biological activity of 1,3-Disubstituted ureas as potent inhibitors of the soluble epoxide hydrolase of increased water solubility. J Med Chem. 2004;47:2110–2122. doi: 10.1021/jm030514j. [DOI] [PubMed] [Google Scholar]
- Lamoureux G, Artavia G. Use of the Adamantane Structure in Medicinal Chemistry. Curr Med Chem. 2010;17:2967–2978. doi: 10.2174/092986710792065027. [DOI] [PubMed] [Google Scholar]
- Li N, Liu JY, Timofeyev V, Qiu H, Hwang SH, Tuteja D, Lu L, Yang J, Mochida H, Low R, Hammock BD, Chiamvimonvat N. Beneficial effects of soluble epoxide hydrolase inhibitors in myocardial infarction model: Insight gained using metabolomic approaches. J Mol Cell Cardiol. 2009;47:835–845. doi: 10.1016/j.yjmcc.2009.08.017. [DOI] [PMC free article] [PubMed] [Google Scholar]
- Liu JY, Tsai HJ, Hwang SH, Jones PD, Morisseau C, Hammock BD. Pharmacokinetic optimization of four soluble epoxide hydrolase inhibitors for use in a murine model of inflammation. Brit J Pharmacol. 2009;156:284–296. doi: 10.1111/j.1476-5381.2008.00009.x. [DOI] [PMC free article] [PubMed] [Google Scholar]
- Loch D, Hoey A, Morisseau C, Hammock BO, Brown L. Prevention of hypertension in DOCA-salt rats by an inhibitor of soluble epoxide hydrolase. Cell Biochem Biophys. 2007;47:87–97. doi: 10.1385/cbb:47:1:87. [DOI] [PMC free article] [PubMed] [Google Scholar]
- Manhiani M, Quigley JE, Knight SF, Tasoobshirazi S, Moore T, Brands MW, Hammock BD, Imig JD. Soluble epoxide hydrolase gene deletion attenuates renal injury and inflammation with DOCA-salt hypertension. Am J Physiol-Renal. 2009;297:F740–F748. doi: 10.1152/ajprenal.00098.2009. [DOI] [PMC free article] [PubMed] [Google Scholar]
- Morisseau C, Goodrow MH, Dowdy D, Zheng J, Greene JF, Sanborn JR, Hammock BD. Potent urea and carbamate inhibitors of soluble epoxide hydrolases. P Natl Acad Sci USA. 1999;96:8849–8854. doi: 10.1073/pnas.96.16.8849. [DOI] [PMC free article] [PubMed] [Google Scholar]
- Morisseau C, Goodrow MH, Newman JW, Wheelock CE, Dowdy DL, Hammock BD. Structural refinement of inhibitors of urea-based soluble epoxide hydrolases. Biochem Pharmacol. 2002;63:1599–1608. doi: 10.1016/s0006-2952(02)00952-8. [DOI] [PubMed] [Google Scholar]
- Morisseau C, Hammock BD. Epoxide hydrolases: mechanisms, inhibitor designs, and biological roles. Annual review of pharmacology and toxicology. 2005;45:311–333. doi: 10.1146/annurev.pharmtox.45.120403.095920. [DOI] [PubMed] [Google Scholar]
- Newman JW, Morisseau C, Hammock BD. Epoxide hydrolases: their roles and interactions with lipid metabolism. Progress in lipid research. 2005;44:1–51. doi: 10.1016/j.plipres.2004.10.001. [DOI] [PubMed] [Google Scholar]
- Parrish AR, Chen G, Burghardt RC, Watanabe T, Morisseau C, Hammock BD. Attenuation of cisplatin nephrotoxicity by inhibition of soluble epoxide hydrolase. Cell Biol Toxicol. 2009;25:217–225. doi: 10.1007/s10565-008-9071-0. [DOI] [PMC free article] [PubMed] [Google Scholar]
- PlataSalaman CR. Anorexia during acute and chronic disease. Nutrition. 1996;12:69–78. doi: 10.1016/s0899-9007(96)90702-9. [DOI] [PubMed] [Google Scholar]
- Qiu H, Li N, Liu JY, Harris TR, Hammock BD, Chiamvimonvat N. Soluble Epoxide Hydrolase Inhibitors and Heart Failure. Cardiovasc Ther. 2011;29:99–111. doi: 10.1111/j.1755-5922.2010.00150.x. [DOI] [PMC free article] [PubMed] [Google Scholar]
- Revermann M, Barbosa-Sicard E, Dony E, Schermuly RT, Morisseau C, Geisslinger G, Fleming I, Hammock BD, Brandes RP. Inhibition of the soluble epoxide hydrolase attenuates monocrotaline-induced pulmonary hypertension in rats. J Hypertens. 2009;27:322–331. doi: 10.1097/hjh.0b013e32831aedfa. [DOI] [PMC free article] [PubMed] [Google Scholar]
- Rose TE, Morisseau C, Liu JY, Inceoglu B, Jones PD, Sanborn JR, Hammock BD. 1-Aryl-3-(1-acylpiperidin-4-yl)urea Inhibitors of Human and Murine Soluble Epoxide Hydrolase: Structure-Activity Relationships, Pharmacokinetics, and Reduction of Inflammatory Pain. J Med Chem. 2010;53:7067–7075. doi: 10.1021/jm100691c. [DOI] [PMC free article] [PubMed] [Google Scholar]
- Schmelzer KR, Inceoglu B, Kubala L, Kim IH, Jinks SL, Eiserich JP, Hammock BD. Enhancement of antinociception by coadministration of nonsteroidal anti-inflammatory drugs and soluble epoxide hydrolase inhibitors. P Natl Acad Sci USA. 2006;103:13646–13651. doi: 10.1073/pnas.0605908103. [DOI] [PMC free article] [PubMed] [Google Scholar]
- Schmelzer KR, Kubala L, Newman JW, Kim IH, Eiserich JP, Hammock BD. Soluble epoxide hydrolase is a therapeutic target for acute inflammation. P Natl Acad Sci USA. 2005;102:9772–9777. doi: 10.1073/pnas.0503279102. [DOI] [PMC free article] [PubMed] [Google Scholar]
- Smith KR, Pinkerton KE, Watanabe T, Pedersen TL, Ma SJ, Hammock BD. Attenuation of tobacco smoke-induced lung inflammation by treatment with a soluble epoxide hydrolase inhibitor. P Natl Acad Sci USA. 2005;102:2186–2191. doi: 10.1073/pnas.0409591102. [DOI] [PMC free article] [PubMed] [Google Scholar]
- Tsai HJ, Hwang SH, Morisseau C, Yang J, Jones PD, Kasagami T, Kim IH, Hammock BD. Pharmacokinetic screening of soluble epoxide hydrolase inhibitors in dogs. Eur J Pharm Sci. 2010;40:222–238. doi: 10.1016/j.ejps.2010.03.018. [DOI] [PMC free article] [PubMed] [Google Scholar]
- Xu D, Li N, He Y, Timofeyev V, Lu L, Tsai HJ, Kim IH, Tuteja D, Mateo RKP, Singapuri A, Davis BB, Low R, Hammock BD, Chiamvimonvat N. Prevention and reversal of cardiac hypertrophy by soluble epoxide hydrolase inhibitors. P Natl Acad Sci USA. 2006;103:18733–18738. doi: 10.1073/pnas.0609158103. [DOI] [PMC free article] [PubMed] [Google Scholar]
- Yang J, Schmelzer K, Georgi K, Hammock BD. Quantitative Profiling Method for Oxylipin Metabolome by Liquid Chromatography Electrospray Ionization Tandem Mass Spectrometry. Anal Chem. 2009;81:8085–8093. doi: 10.1021/ac901282n. [DOI] [PMC free article] [PubMed] [Google Scholar]
- Yu ZG, Xu FY, Huse LM, Morisseau C, Draper AJ, Newman JW, Parker C, Graham L, Engler MM, Hammock BD, Zeldin DC, Kroetz DL. Soluble epoxide hydrolase regulates hydrolysis of vasoactive epoxyeicosatrienoic acids. Circ Res. 2000;87:992–998. doi: 10.1161/01.res.87.11.992. [DOI] [PubMed] [Google Scholar]
- Zhao XY, Yamamoto T, Newman JW, Kim IH, Watanabe T, Hammock BD, Stewart J, Pollock JS, Pollock DM, Imig JD. Soluble epoxide hydrolase inhibition protects the kidney from hypertension-induced damage. J Am Soc Nephrol. 2004;15:1244–1253. [PubMed] [Google Scholar]
Associated Data
This section collects any data citations, data availability statements, or supplementary materials included in this article.