Abstract
Development of insect resistance to Bacillus thuringiensis (Bt) toxins threatens the sustained successful application of Bt-based biological control tactics. Multi-mechanisms of resistance have been proposed, such as alteration of toxin-binding proteins, changes of proteases in midgut and so on. The other responses of the Cry1Ac-selected insects might also contribute to the evolution of resistance. Here, the Cry1Ac-selected Trichoplusia ni TnH5 cells with high resistance were subjected to analysis of proteome and the differentially expressed proteins were identified using mass spectrometry. The differential proteins included transporter, molecular chaperon, structural molecules and many other molecules involved in protein metabolism, signal transduction, nucleotide binding, lipid biosynthesis, carbohydrates metabolism and energy production, suggesting that a complex mechanisms involved in the development of insect resistance to Bt Cry1Ac toxins at cellular levels. The decrease of protein synthesis, changes of signal transduction, more rapid energy production, the enhanced lipid synthesis and the decline of possible Cry1Ac-binding proteins in cytoplasm and other events might contribute to the development of resistance in the selected cells. Our results provide some new cues for understanding the mechanism of Bt resistance.
Keywords: Differential proteome, Selection of resistance, Trichoplusia ni, Bacillus thuringiensis, Resistance to Cry1Ac
Introduction
Insecticidal crystal toxins produced by Bacillus thuringiensis (Bt) or some transgenic crops exhibit high activities against insect species of different orders—Lepidoptera (butterflies and moths), Coleoptera (beetles and weevils), Diptera (flies and mosquitoes) and other invertebrates such as nematodes, and kill insects through inserting toxins into the target midgut cell membrane, forming pores (Wei et al. 2003;Schnepf et al. 1998). These toxins are highly specific to their target pests and innocuous to humans, other vertebrates and plants (Wei et al. 2003). Currently, many crops have been transgenetically engineered by inserting crystal toxin genes into their genomes to produce corresponding pesticide toxins, which resulted in the great decrease of the use of chemical insecticide (Wu et al. 2008). However, a few of insect species are found to develop potentially high resistance to Bt strain or toxins produced by transgenic crops. Several agricultural insect species including Plodia interpunctella, Plutella xylostella,Trichoplusia ni,Helicoverpa zea, Spodoptera frugiperda, Busseola fusca and Pectinophora gossypiella (Tabashnik et al. 2008; Bagla 2010) have evolved resistance to Bt toxins in open fields with application of formulated Bt products, and this threatens the sustained successful application of Bt—based biological control (Gahan et al. 2001).
Mechanisms of Bt resistance in insects are complex and diverse. Disruption of Bt toxin binding to midgut receptors is the most accepted resistance mechanism. The best studied Crystal toxin receptors are aminopeptidase N (Gill et al. 1995), cadherin N (Gahan et al. 2001), glycolipids (Griffitts et al. 2005), alkaline phosphatase (ALP) (Jurat-Fuentes and Adang 2004) and ABC transporter (Gahan et al. 2010). The mutations of these receptors lead to reduction of toxin binding to midgut (Gahan et al. 2010; Tiewsiri and Wang 2011). Some other mechanisms have also been proposed for Bt resistance. Midgut proteases could not activate pro-toxin efficiently because of low activity or detoxificate toxin by over-high enzyme activities after alteration (Oppert et al. 1997). Modification of binding sites for crystal toxins resulted in the loss of binding of receptors to cell membrane in the midgut (Ferré et al. 1991). The increased recovery of impaired epithelial cells could repair the midgut cells damaged by toxin (Martinez-Ramirez et al. 1999).
Insect cell lines should contribute greatly to studies on the mechanism for insect resistance to Bt toxin. However, no appropriate midgut cell lines are available for the research until today. BTI-TN-5B1-4 (TnH5) cell line originated from embryos of Trichonplusiani has been found to be susceptible to the activated Cry1Ac toxin (Liu et al. 2004). We have succeeded in selection for resistance of B. thuringiensis Cry1Ac in TnH5 cells and primarily elucidated the characterization of the selected insect cells (Liu et al. 2004).
Proteomic analysis has been widely used to elucidate molecular mechanism of many responses in cultured cells (Wei et al. 2011; Saheki et al. 2008). In the present study, to explore some unknown mechanisms of insect resistance to Bt toxin-Cry1Ac, the profiles of differential protein between the non-selected and the Cry1Ac-resistant TnH5 cell line continuously selected with trypsin-activated Cry1Ac were compared using a proteomic approach. Most of the differential proteins have been identified using MALDI-TOF/TOF mass.
Materials and methods
Chemicals and reagents
Grace’s medium and fetal bovine serum (FBS) were purchased from Invitrogen (Grand Island, NY, USA). Chemicals including CHAPS, DTT, urea, thiourea, PMSF and Iodoacetamid were purchased from Sigma-Aldrich (Shanghai, China). ACN was purchased from Fisher (Fair Lawn, NJ, USA), TFA, α-cyano-4-hydroxycinnamic acid (CHCA) and NH4HCO3 were obtained from Fluka (Buch SG, Switzerland). IPG gel strip and ampholyte (3/10) were obtained from Bio-Rad (Hercules, CA, USA). MS grade trypsin was obtained from Promega (Madison, WI, USA). The activated Cry1Ac toxin was prepared as described in the previous report (Liu et al. 2004) .
Cell culture and selection for CrylAc resistance
BTI-TN-5B1-4 (TnH5) cell line was a gift from Dr. Granados at Cornell University, NY, USA and maintained in Grace’s medium supplemented with 10 % fetal bovine serum and antibiotics (100 μg/ml streptomycin, 100 units/ml penicillin) at 28 °C in 25 cm2 culture flask. When TnH5 cells reached 80 % confluence, medium was replaced by the solution containing the activated Cry1Ac toxin diluted with Puck’s buffer (8 g/L NaCl, 0.4 g/L KCl, 0.35 g/L NaHCO3, 1 g/L glucose, pH 6.8) at appropriate concentration. After 80 % cells were killed by the Cry1Ac, the surviving cells were washed twice gently with medium and fresh culture medium was added into the flask. The same procedure was repeated when the selected TnH5 cells reached 80 % confluence. The cells have been selected for 10 years and were called R140 cells because of 140 times of selection. The protocols have described in details in a previous paper (Liu et al. 2004).
Resistance measurement
The resistance measurement was reported in the previous paper, and briefly described as follow (Liu et al. 2004). The CrylAc-susceptible (TnH5) and the Cry1Ac-selected (R140) cells were seeded in 96-well plates at a density of 2 × 10⁴ cells per well, respectively, and cultured over night. Then the medium was removed and washed gently with Puck’s buffer. The activated Cry1Ac toxin diluted in Puck’s buffer at different concentrations was added into each well. After 1 h of incubation at 28 °C, the cells were washed gently with Puck’s buffer, 100 μL MTT solution (0.5 mg/ml) was added into each well and incubated at 28 °C for 4 h. After removing the MTT solution from each well, formazan crystals formed by mitochondria in the cells were dissolved using 100 μL of solubilization solution (acid-isopropyl alcohol, which was prepared with 0.4 ml chlorhydric acid (36 %) mixed with 100 ml isopropyl alcohol) and shaken for 15 min prior to measuring absorbance at 570 nm using a microplate reader. Experiments were performed in triplicate. The median lethal concentrations of the activated Cry1Ac toxin on both the susceptible and the selected cells were calculated according to the method of MTT, which was the concentration of the activated toxin leading to the death of 50 % of the test population (cells in each well of cell culture plate) over a given period (1 hr). The resistance ratio was calculated by LC50 of the toxin to susceptible cells (TnH5) divided by that to the selected cells (R140).
Protein extraction
The TnH5 and R140 cells were harvested by centrifugation at 1,000×g for 5 min at 4 °C and washed three times with ice cold PBS buffer. Cell pellets were resuspended in 300 μL lysis buffer [8 M urea, 2 M thiourea, 0.5 % CHAPS, 2 % IPG buffer pH 3-10, 1 mM DTT, 1 mM PMSF, complete ULTRA Tablets (Roche, catalog# 05 892 970 001)]. After the cell lysate was homogenized on ice by supersonic waves, soluble proteins were prepared by centrifugation at 13,200×g for 30 min at 20 °C. Protein concentration was determined by Bradford method. Protein samples were kept at −80 °C. Three samples were harvested at different times for both non-selected and the selected cells, respectively.
Two-dimensional gel electrophoresis
The Multiphor II Isoelectric focusing System (Amersham) and pH 3-10 IPG strips (17 cm, Bio-Rad) were used for isoelectric focusing. IPG strips were rehydrated with rehydration buffer (8 M urea, 2 M thiourea, 0.5 %CHAPS, 0.5 % ampholyte (pH 3–10), 0.02 % bromophenol blue and 1 % DTT) overnight and 1 mg protein sample was freshly solubilized in 170 μL rehydration buffer and loaded with anodic cup. IEF was performed at room temperature under the following conditions: 0–500 V, 500 V·h; 500 V, 2,500 V·h; 500–3,500 V, 10,000 V·h; 3,500 V, 50,000 V·h; 3,500–500 V, 8,000 V·h. Before SDS-PAGE, the IPG strips were equilibrated for 15 min in equilibration buffer (50 mM Tris–HCl (pH 6.8), 6 M urea, 2 % (w/v) SDS, 30 % glycerol (v/v), 2 % (w/v) DTT and 0.02 % bromophenol blue). The procedure was repeated with a modified equilibration buffer for an additional 15 min, in which DTT was replaced with 2.5 % (w/v) iodoacetamide.
The second dimension SDS polyacrylamide gel electrophoresis (12 %) was performed using a Protean II Xi cell apparatus (Bio-Rad). The electrophoresis was carried out at 20 °C and 15 mA/gel for 15 min and at a voltage limit of 250 V until the bromophenol blue reached the bottom of the gel.
Gel staining and image analysis
Gels were stained with Coomassie brilliant blue G250 and scanned using PowerLook 2100XL (UMAX). A total of 6 gels from the six independent samples were analyzed using PDquest Software (version 8.01, Bio-Rad) according to the instruction manual. When the automated quantitative analysis had been finished, manual correction and analysis of variance (ANOVA) was applied to matched spot. Those spots showing more than two-fold increase or decrease (p ≤ 0.05) were considered as differentially expressed protein.
In-gel digestion and protein identification
Differentially expressed protein spots were excised from the gels at a volume of 1 mm3 and washed three times with distilled water, then destained with 25 mM NH4HCO3 and 50 % (ACN) for 15 min. This step was repeated until the dye faded completely. These gel pieces were washed with distilled water and dehydrated in 30 μl 100 % ACN, then gel pieces were dried under vacuum at room temperature and the dried gel pieces were digested in 8 μL of trypsin gold (0.1 mg/ml, Promega) containing 25 mM NH4HCO3 overnight at 37 °C.
The digested extract was mixed with matrix (4 mg/ml CHCA in 35 % ACN and 1 % TFA), 0.3:0.3 μL, and spotted on the stainless steel sample plate. After air dry at room temperature, peptide masses in the samples were detected by a 4700 MALDI-TOF/TOF proteomics analyzer (Applied Biosystems) and 4,000 Series Software was used. The system was externally calibrated using the Calibration Mixture for the 4700 (Applied Biosystems) and trypsin autolysis products were used as internal standards. MALDI-TOF Spectra were acquired in the positive ion reflector mode and 700–4,000 m/z mass range was used with 3,900 laser shots per spectrum, and the MS peak was detected with a limitation of S/N ratio ≥10. In another mode, spectra were 4300 shots per spectrum and energy of 10 kV was used for collision-induced dissociation (CID), 4300 shots per spectrum were accumulated, and the filtered precursor ions were set as S/N ratio ≥10.
Database searching
The raw mass spectra data were analyzed using the GPS ExplorerTM software v3.5 (Applied Biosystems). Search was achieved using MASCOT search engine v2.3 (Matrix Science, Boston, MA, USA) against NCBInr database (http://www.ncbi.nlm.nih.gov), Swiss-prot database (http://www.expasy.ch/sprot) and an EST (expressed sequence tag) database-Spodobase (http://bioweb.ensam.inra.fr/spodobase/) in which the EST data were translated to amino acids sequences. Search parameters were set as: precursor ion mass tolerance, 0.2 Da; MS/MS fragment ion mass tolerance, 0.5 Da, trypsin as enzyme, one missed cleavage site allowed, cysteine carbamidomethylation, methioninemethionine oxidation. The contaminant peaks originating from matrix or autoproteolytic trypsin fragments and human keratin were removed. In database search, protein score was determined for each protein (peptide) matched from the MS (MS/MS) peak lists. These proteins with protein scores (MS) or ion scores (MS/MS) above the 95 % confidence interval (C.I.) are considered to be confident identifications.
Western blotting
In addition, TnH5 and R140 cells were observed under an inverted microscopy, and the morpholoical change of R140 cells was detected. It is well known that cytoskeleton is related to the morphology of cells. In order to confirm the results of tubulin provided by MS and microscopy, western blotting assay was performed, and a procedure is briefly described below. The protein was extracted from TnH5 and R140 cells, respectively, and separated by SDS-PAGE. The proteins were transferred onto nitrocellulose membrane after the determination of protein concentration according to the method of BCA. β-tubulin was identified by western blotting using an β-tubulin-specific mouse serum (Sigma-Aldrich, Shanghai, China), and an internal control of β-actin was also identified by western blotting using an β-actin-specific mouse serum (Sigma-Aldrich, Shanghai, China).
Results
Proteomic analysis of TnH5 and R140 cells
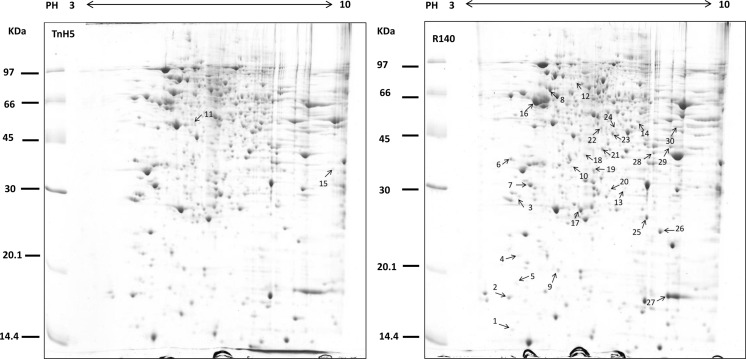
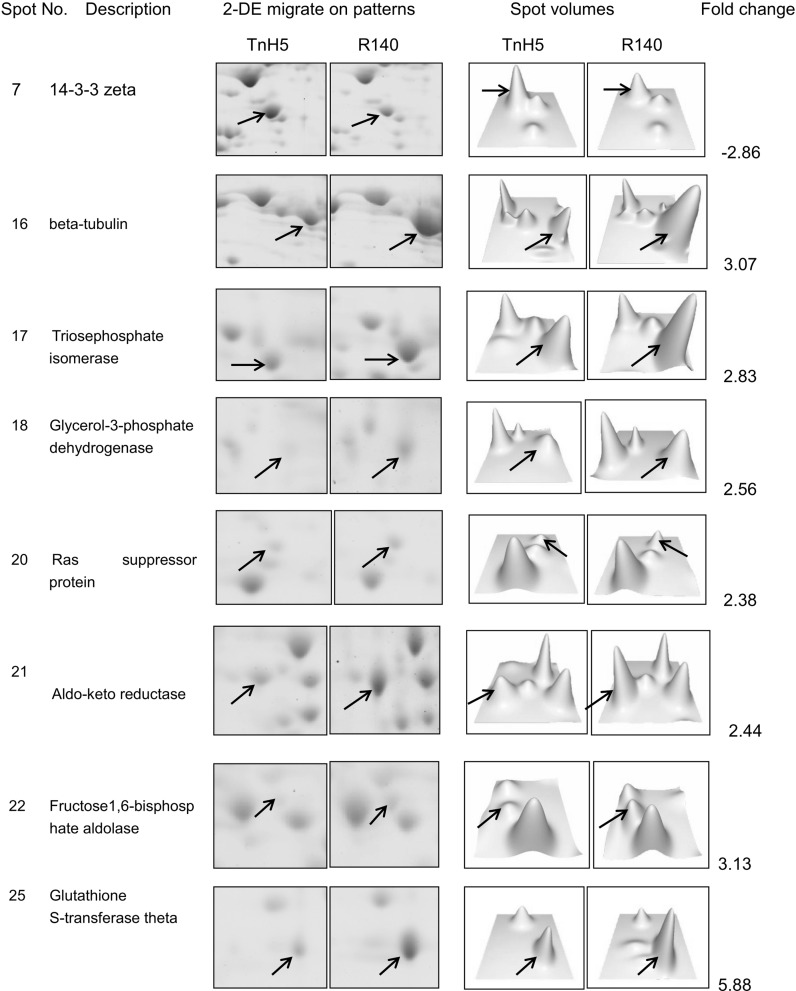
The comparative proteomic approach was used to elucidate the mechanisms of resistance in the Cry1Ac-selected Trichoplusia ni cells. Experiments were performed in triplicate, approximately 700 stained spots were detected on each gel using PDQuest 8.0.1 software and representative gels are shown in Fig. 1. According to the quantitative analysis, a total of 47 spots were found to show >2-fold changes (p < 0.05) between susceptible and resistant cells, which were marked in Fig. 1a, b. Among these 47 spots, 26 spots were found to be down-regulated and 21 were found to be up-regulated in R140 cells. Expression levels of the representatively differential spots were confirmed visually with the enlarged gel images and 3-D views of corresponding spots. Some representatively differential protein spots are shown in Fig. 2.
Fig. 1.
Differential protein analysis between TnH5 and R140 cells. Total protein lysate from TnH5 and R140 was separated by 2-D gel electrophoresis and stained with colloidal Coomassie Blue G250. Numbered spots were identified using MALDI-TOF/TOF MS analysis and the results of detailed identification are shown in Table 1. The figure shows representative gels of three independent experiments
Fig. 2.
Relative spot volumes of representative differential spots. Selected areas of 2D gels and corresponding 3D profiles for TnH5 and R140 cells. Images pairing relative spot volumes were analyzed with PDQuest software version 8.01 (Bio-Rad)
Identification of the differentially expressed proteins
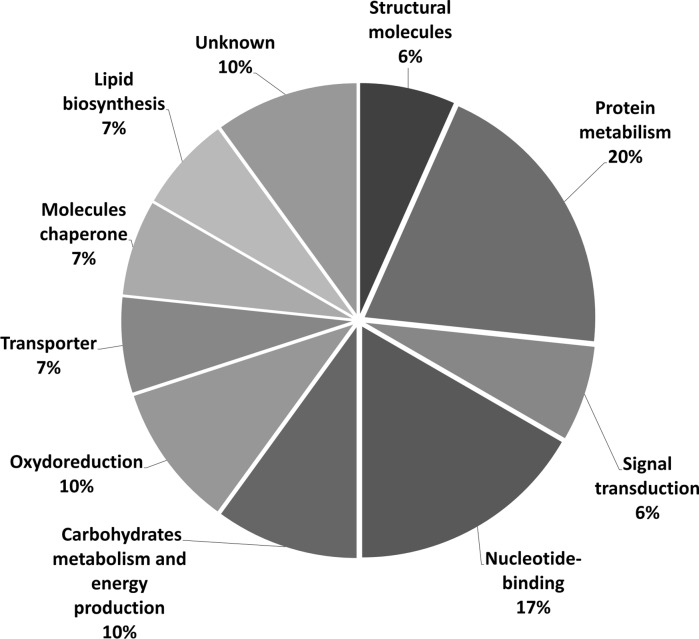
To identify these differential proteins between TnH5 and R140 cells, a total of 47 differentially expressed spots were subjected to in-gel digestion with trypsin and analysed with MALDI-TOF/TOF MS. After database search with MASCOT, 30 spots were successfully identified and are listed in Table 1. Among the 30 identified differential proteins, 15 spots (50 %) were up-regulated and 15 spots (50 %) were down-regulated in the Cry1Ac-selected R140 cells. The identified proteins were classified into 10 groups according to their potential biological function using the UniProt and the PANTHER Classification System (Fig. 3). Most identified proteins are involved in membrane lipids and protein metabolism, nucleotide binding, energy metabolism, etc. (Fig. 3).
Table 1.
Differential proteins between TnH5 and R140 cells
| Spot no.a | Protein description | Accession numberb | Total Ion C.I. % (Protein score C.I. %)c |
Fold change | MS source | Species | Coverage (%) | UniPepd | Peptide sequence |
|---|---|---|---|---|---|---|---|---|---|
| Down-regulation in R140 | |||||||||
| 1 | Dedicator of cytokinesis protein 6 | sp:Q96HP0 | 96.48 | −3.57 | MS/MS | Homo sapiens | 1 | 1 | INSLTFKK |
| 2 | 60S acidic ribosomal protein | gi:49532906 | 99.998 | −4.76 | MS/MS | Plutella xylostella | 11 | 1 | SVGIEAGEK |
| 3 | Myosin light polypeptide 9 isoform B | gi:288856281 | 99.999 | −3.85 | MS/MS | Bombyx mori | 17 | 3 | EAFNMIDQNR DGLFDYVEFTR NAFGCFDEENQGVINEER |
| 4 | Eukaryotic translation initiation factor 6 | gi:82880642 | 100 | −7.69 | MS/MS | Spodoptera frugiperda | 26 | 4 | VQFENNNEVGVFSK QTVAGNVLVGSYAALSNR DTEEILADTLDVEVFR NGLLVPSSTTDTELQHR |
| 5 | Cytochrome c oxidase subunit Va | gi:164448662 | 99.044 | −4.17 | MS/MS | Bombyx mori | 4 | 1 | DIDGWEIR |
| 6 | Nascent polypeptide associated complex protein alpha subunit | gi:114051461 | 100 | −3.57 | MS/MS | Bombyx mori | 21 | 4 | LGLKPVQGVNR NILFVINSPDVYK NPHSDTYIVFGEAK IEDLSQQATMAAAR |
| 7 | 14-3-3 zeta | gi:237636932 | 100 | −2.86 | MS/MS | Heliothis virescens | 14 | 3 | AYQDAFEISK YLAEVATGETR EVTETGVELSNEER |
| 8 | Heat shock protein 60 | gi:253993196 | 99.18 | −4.00 | MS/MS | Chilo suppressalis | 25 | 4 | ISNVQTIIPALELANQQR KISNVQTIIPALELANQQR KPLVIVAEDVDGEALSTLVVNR LVQNVANNTNEEAGDGTTTATVLR |
| 9 | Tubulin-specific chaperone A | gi:307213547 | 99.536 | −2.63 | MS/MS | Harpegnathos saltator | 8 | 2 | VVYEKEAEQQK LKDEGQDEHNIR |
| 10 | Polyprotein | gi:74179426 | 99.75 | −2.78 | PMF | Human coxsackievirus | 48 | ||
| 11 | Transcriptional regulator | gi:254933343 | 96.13 | e | PMF | Listeria monocytogenes | 50 | ||
| 12 | Asparaginyl-tRNA synthetase | gi:307178011 | 97.74 | −8.33 | PMF | Camponotus floridanus | 43 | ||
| 13 | Proteasome subunit beta 7 | gi:114053073 | 99.998 | −2.38 | MS/MS | Bombyx mori | 19 | 3 | NTGPAQYLR TTIVGIIYADGVILGADTR DAIAAGIFNDLGSGSNVDLCVIR |
| 14 | GTPase | gi:334855397 | 100 | −4.17 | MS/MS | Helicoverpa armigera | 14 | 3 | LKPEYDALTR VPAFLNVVDIAGLVR GAAEGQGLGNAFLSHIK |
| 15 | ribosomal protein L7A | gi:161015755 | 99.99 | e | PMF | Spodoptera exigua | 35 | ||
| Up-regulation in R140 | |||||||||
| 16 | Beta-tubulin | gi:112983503 | 99.997 | 3.07 | MS/MS | Bombyx mori | 8 | 2 | YLTVAAIFR FPGQLNADLR |
| 17 | Triosephosphate isomerase | gi:154707830 | 100 | 2.38 | MS/MS | Helicoverpa armigera | 20 | 4 | FVVGGNWK EAGKTEEVVFR GAFTGEISPAMIK TXTPQQAQDVHASLR |
| 18 | Glycerol-3-phosphate dehydrogenase-2 | gi:51555848 | 100 | 2.56 | MS/MS | Bombyx mori | 23 | 4 | FVDVFYPGSK DADLLIFVVPHQFVR NIVAVGAGFVDGLGFGDNK GFDIAEGGGIDLISHIITR |
| 19 | Isopentenyl diphosphate isomerase | gi:146424704 | 97.09 | 3.23 | MS/MS | Bombyx mori | 4 | 2 | YASICQSQR IVPIVEPEVLPDGEHDLR |
| 20 | Ras suppressor protein 1 | gi:307214257 | 100 | 2.38 | PMF | Harpegnathos saltator | 37 | ||
| 21 | Aldo–keto reductase | gi:328670873 | 99.99 | 2.44 | MS/MS | Helicoverpa armigera | 9 | 2 | ALEPLVGEGLVR HIDCAFVYGNEK |
| 22 | Fructose 1,6-bisphosphate aldolase | gi:45330818 | 98.832 | 8.33 | MS/MS | Antheraea yamamai | 10 | 2 | YASICQSQR IVPIVEPEVLPDGEHDDR |
| 23 | Hypothetical protein | gi:148240020 | 95.05 | 3.03 | PMF | Synechococcus sp. WH 7803 | 55 | ||
| 24 | Fructose 1,6-bisphosphate aldolase | gi:45330818 | 99.942 | 3.13 | MS/MS | Antheraea yamamai | 17 | 3 | YASICQSQR FTPSYQAIMENANVLARIVPIVEPEVLPDGEHDL |
| 25 | Glutathione S-transferase theta | gi:170779021 | 99.662 | 5.88 | MS/MS | Antheraea pernyi | 3 | 1 | LYFDIGTLYQR |
| 26 | Inositol-1,4,5-trisphosphate 5-phosphatase 3 | sp|Q12271 | 98.83 | 3.22 | MS/MS | Saccharomyces cerevisiae | 1 | 1 | MSLAGALSDATKSVSR |
| 27 | Cyclophilin-like protein | gi:60592747 | 99.997 | 2.38 | MS/MS | Bombyx mori | 10 | 2 | TSWLDGR HVVFGTVVEGMDVVK |
| 28 | ChiA12 | gi:337748118 | 99.761 | 2.78 | MS/MS | Paenibacillus mucilaginosus | 6 | 1 | AGNSAPSLXVLAQQR |
| 29 | Leucine carboxyl methyltransferase 2 | sp|Q9P3K9 | 98.27 | 3.13 | MS/MS | Neurospora crassa | 1 | 1 | VRLENAEDFAR |
| 30 | 35 kDa GTP-binding protein, putative | gi:157107339 | 97.00 | 6.25 | PMF | Aedes aegypti | 34 | ||
aSpot numbers are related to Fig. 1
bProteins in the NCBI or Swiss-prot/TrEMBL database for which significant peptide mass matching or sequence similarity was observed
c“Total ion C.I. %” refers to those spots whose mass source is MS/MS and “Protein Score C.I. %” refers to those spots whose mass source is PMF
dNumber of unique peptides identified by MS/MS
e Spots that cannot be detected in R140
Fig. 3.
Functional classification of the identified proteins. Biological functions were determined by the Uniprot database (http://www.ebi.ac.uk/uniprot/index.html) and the PANTHER database (http://www.pantherdb.org/)
Differential display of β-tublin protein between TnH5 and R140 cells by western-blotting
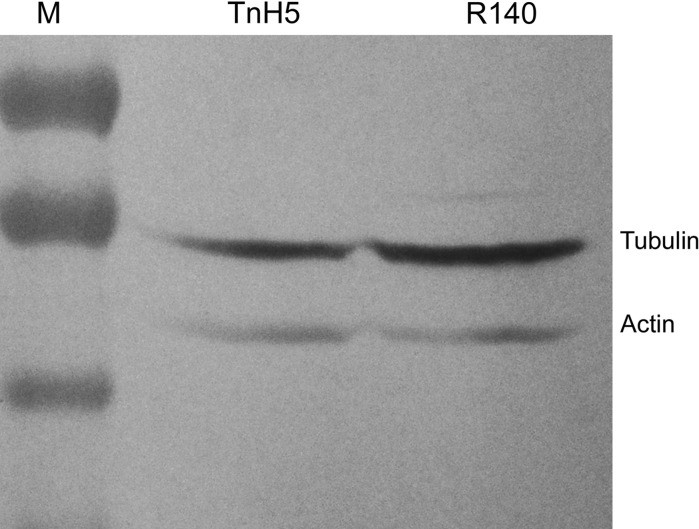
Most TnH5 cells showed polygonal shape (Fig. 4a, arrow), but most R140 cells had extended long fibroblast-like structures (Fig. 4b, arrow), when the cell monolayers were less than 80 % confluent. It is well known that microtubules are involved in determining cellular shape. In order to further confirm whether the abundance of microtubulin changed, β-tubulin was detected via western blot assay. The result has shown that β-tubulin increased in R140 cells, compared with that in non-selected TnH5 cells (Fig. 5). The result was consistent with that of 2-DE. The change of shapes between TnH5 and R140 cells possibly was correlated with the differential abundance of β-tubulin between the two cell strains.
Fig. 4.
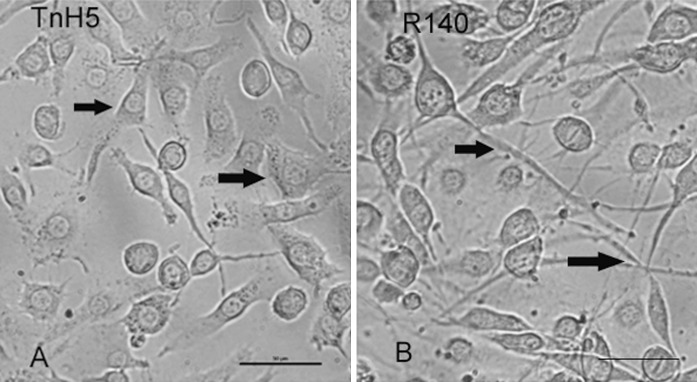
Morphology of TnH5 and R140 cells. A, TnH5 cells; Arrows point to TnH5 cells showing polygonal shape. B, R140 cells; Arrows point to R140 cells having extended long fibroblast-like structures. Bar 50 μm
Fig. 5.
Differential display of β-tublin protein between TnH5 and R140 cells by Western-blot. M protein molecular weight markers; TnH5TnH5 cell protein; R140R140 cell protein
Discussion
As environmental friendly alternative and good substitute for chemical insecticides, Bt-based bio-pesticides have been widely employed for the control of numerous species of insect pests. Understanding the mechanisms of Bt resistance will contribute to the sustained and successful application of Bt-based biological control. For this purpose, we firstly selected the resistant cells with the widely used Bt toxin-Cry1Ac toxin, and then performed a comparative proteomic analysis using the traditional 2-DE to investigate the changes of protein expression. The identification of differential proteins between the sensitive and the resistant cells was performed using MALDI-TOF/TOF MS and database searching. With this approach, a total of 30 differentially expressed proteins were identified successfully. A few of the differential proteins (3/30) were found to have been previously reported in the research on insect resistance to Bt, which were GSH transferase, cytochrome c oxidase subunit and heat shock protein (Candas et al. 2003; Chen et al. 2010). Other proteins (27/30) were newly identified, which might also be correlated with the development of resistance to Cry1Ac toxin.
In the present study, we detected that five proteins involving in protein synthesis were down-regulated in the Cry1Ac-resistant cells, which are 60S acidic ribosomal protein, eukaryotic translation initiation factor, nascent polypeptide associated complex protein alpha subunit, asparaginyl-tRNA synthetase and ribosomal protein L7A, respectively. A possible explanation is that down-regulation of protein synthesis would result in bio-energetic savings (Hand and Hardewig 1996) and contribute to the resistance to the activated Cry1Ac.
Among the proteins associated with energy metabolism, fructose 1,6 biphosphate aldolase (Fbpa) was the highest up-regulated protein in R140 cells, which catalyzes a reversible reaction indispensable for both glycolysis and gluconeogenesis. Triosephosphate isomerase (Tpi)—another important enzyme of glycolytic pathway also was up-regulated in R140 cells. The up-regulation of energy production may be important to provide extra energy for various biological processes in response to the stress of Cry1Ac.
Protein spot 16 identified as tubulin was found to be up-regulated in R140 cells. Microtubule is one of main component of the cytoskeleton. Similar to actin, tubulin is known to have various functions, but little information is available on the relationship between tubulin and Cry1Ac resistance. The increase of tubulin can improve the assembly of microtubules and strengthen cells against toxin action.
In conclusion, proteomic techniques have contributed much in helping to understand the mechanisms of insect resistance to Bt. In the present experiments, our results have shown that the development of insect resistance to Bt toxins appears to involve a complex mechanism at cellular levels. The decrease of protein synthesis, changes of signal transduction, more rapid energy metabolism, the enhanced lipid synthesis and other events might contribute to the development of resistance in TnH5 cells selected with the trypsin-activated Cry1Ac.
Acknowledgments
We express our gratitude to Sun M, Zhang J, Hua G, Adang MJ and Campbell PM for generously providing laboratory materials. This work was supported by grants from the National Natural Science Foundation of China (NSFC) (30571249 and 31071739).
Contributor Information
Kaiyu Liu, Email: liukaiyu@mail.ccnu.edu.cn.
Huazhu Hong, Email: hzhong@mail.ccnu.edu.cn.
References
- Bagla P. Hardy cotton-munching pests are latest blow to GM crops. Science. 2010;327:1439. doi: 10.1126/science.327.5972.1439. [DOI] [PubMed] [Google Scholar]
- Candas M, Loseva O, Oppert B, Kosaraju P, Bulla LA., Jr Insect resistance to Bacillus thuringiensis: alteration in indianmeal moth larval gut proteome. Mol Cell Proteomics. 2003;2:19–28. doi: 10.1074/mcp.M200069-MCP200. [DOI] [PubMed] [Google Scholar]
- Chen LZ, Liang GM, Zhang J, Wu KM, Guo YY, Rector BG. Proteomic analysis of novel Cry1Ac binding proteins in Helicoverpa armigera (Hübner) Arch Insect Biochem. 2010;73:61–73. doi: 10.1002/arch.20340. [DOI] [PubMed] [Google Scholar]
- Ferré J, Real MD, Van Rie J, Jansens S, Peferoen M. Resistance to the Bacillus thuringiensis bioinsecticide in a field population of Plutella xylostella is due to a change in a midgut membrane receptor. Proc Natl Acad Sci USA. 1991;88:5119–5123. doi: 10.1073/pnas.88.12.5119. [DOI] [PMC free article] [PubMed] [Google Scholar]
- Gahan LJ, Gould F, Heckel DG. Identification of a gene associated with Bt resistance in Heliothis virescens. Science. 2001;293:857–860. doi: 10.1126/science.1060949. [DOI] [PubMed] [Google Scholar]
- Gahan LJ, Pauchet Y, Vogel H, Heckel DG. An ABC transporter mutation is correlated with insect resistance to Bacillus thuringiensis Cry1Ac toxin. PLoS Genet. 2010;6:e1001248. doi: 10.1371/journal.pgen.1001248. [DOI] [PMC free article] [PubMed] [Google Scholar]
- Gill SS, Cowles EA, Francis V. Identification, isolation, and cloning of a Bacillus thuringiensis Cry1Ac toxin-binding protein from the midgut of the lepidopteran insect Heliothis virescens. J Biol Chem. 1995;270:27277–27282. doi: 10.1074/jbc.270.45.27277. [DOI] [PubMed] [Google Scholar]
- Griffitts JS, Haslam SM, Yang T, Garczynski SF, Mulloy B, Morris H, Cremer PS, Dell A, Adang MJ, Aroian RV. Glycolipids as receptors for Bacillus thuringiensis crystal toxin. Science. 2005;307:922–925. doi: 10.1126/science.1104444. [DOI] [PubMed] [Google Scholar]
- Hand SC, Hardewig I. Downregulation of cellular metabolism during environmental stress: mechanisms and implications. Annu Rev Physiol. 1996;58:539–563. doi: 10.1146/annurev.ph.58.030196.002543. [DOI] [PubMed] [Google Scholar]
- Jurat-Fuentes JL, Adang MJ. Characterization of a Cry1Ac receptor alkaline phosphatase in susceptible and resistant Heliothis virescens larvae. Eur J Biochem. 2004;271:3127–3135. doi: 10.1111/j.1432-1033.2004.04238.x. [DOI] [PubMed] [Google Scholar]
- Liu K, Zheng B, Hong H, Jiang C, Peng R, Peng J, Yu Z, Zheng J, Yang H. Characterization of cultured insect cells selected by Bacillus thuringiensis crystal toxin. In Vitro Cell Dev Anim. 2004;40:312–317. doi: 10.1290/0404032.1. [DOI] [PubMed] [Google Scholar]
- Martinez-Ramirez AC, Gould F, Ferré J. Histopathological effects and growth reduction in a susceptible and a resistant strain of Heliothis virescens (Lepidoptera: Noctuidae) caused by sublethal doses of pure Cry1A crystal proteins from Bacillus thuringiensis. Biocontrol Sci Techn. 1999;9:239–246. doi: 10.1080/09583159929811. [DOI] [Google Scholar]
- Oppert B, Kramer KJ, Beeman RW, Johnson D, McGaughey WH. Proteinase-mediated insect resistance to Bacillus thuringiensis toxins. J Biol Chem. 1997;272:23473–23476. doi: 10.1074/jbc.272.38.23473. [DOI] [PubMed] [Google Scholar]
- Saheki T, Ito H, Sekiguchi A, Nishina A, Sugiyama T, Izumi T, Kojima I. Proteomic analysis identifies proteins that continue to grow hepatic stem-like cells without differentiation. Cytotechnology. 2008;57:137–143. doi: 10.1007/s10616-008-9122-7. [DOI] [PMC free article] [PubMed] [Google Scholar]
- Schnepf E, Crickmore N, Van Rie J, Lereclus D, Baum J, Feitelson J, Zeigler DR, Dean DH. Bacillus thuringiensis and its pesticidal crystal proteins. Microbiol Mol Biol Rev. 1998;62:775–806. doi: 10.1128/mmbr.62.3.775-806.1998. [DOI] [PMC free article] [PubMed] [Google Scholar]
- Tabashnik BE, Gassman AJ, Crowdwer DW, Carriere Y. Insect resistance to Bt crops: evidence versus theory. Nature Biotechnol. 2008;26:199–202. doi: 10.1038/nbt1382. [DOI] [PubMed] [Google Scholar]
- Tiewsiri K, Wang P. Differential alteration of two aminopeptidases N associated with resistance to Bacillus thuringiensis toxin Cry1Ac in cabbage looper. Proc Natl Acad Sci USA. 2011;108:14037–14042. doi: 10.1073/pnas.1102555108. [DOI] [PMC free article] [PubMed] [Google Scholar]
- Wei JZ, Hale K, Carta L, Platzer E, Wong C, Fang SC, Aroian RV. Bacillus thuringiensis crystal proteins that target nematodes. Proc Natl Acad Sci USA. 2003;100:2760–2765. doi: 10.1073/pnas.0538072100. [DOI] [PMC free article] [PubMed] [Google Scholar]
- Wei YC, Naderi S, Meshram M, Budman H, Scharer JM, Ingalls BP, McConkey BJ. Proteomics analysis of chinese hamster ovary cells undergoing apoptosis during prolonged cultivation. Cytotechnology. 2011;63:663–677. doi: 10.1007/s10616-011-9385-2. [DOI] [PMC free article] [PubMed] [Google Scholar]
- Wu K, Lu Y, Feng H, Jiang Y, Zhao J. Suppression of cotton bollworm in multiple crops in China in areas with Bt toxin-containing cotton. Science. 2008;321:1676–1678. doi: 10.1126/science.1160550. [DOI] [PubMed] [Google Scholar]


