

Abstract
MIF, a multi-potent protein that exhibits both cytokine and chemotactic properties, is expressed by many cell types, including hepatocytes and non-parenchymal cells. We hypothesized that MIF is a key contributor to liver injury after ethanol exposure. Female C57BL/6 or MIF−/− mice were fed an ethanol-containing liquid diet or pair-fed control diet for 4 (11% total kcal; early response) or 25 (32% kcal; chronic response) days. Expression of MIF mRNA was induced at both 4d and 25d of ethanol feeding. After chronic ethanol, hepatic triglycerides and plasma ALT and AST were increased in wild-type, but not MIF−/−, mice. In order to understand the role of MIF in chronic ethanol-induced liver injury, we investigated the early response of wild-type and MIF−/− to ethanol. Ethanol feeding for 4d increased apoptosis of hepatic macrophages and activated complement in both wild-type and MIF−/− mice. However, TNFα expression was increased only in wild-type mice. This attenuation of TNF-α expression was associated with fewer F4/80+ macrophages in liver of MIF−/− mice. After 25d of ethanol feeding, chemokine expression was increased in wild-type mice, but not MIF−/− mice. Again, this protection was associated with decreased F4/80+ cells in MIF−/− mice after ethanol feeding. Chronic ethanol feeding also sensitized wild-type, but not MIF−/−, mice to lipopolysaccharide, increasing chemokine expression and monocyte recruitment into the liver.
Conclusion
Taken together, these data indicate that MIF is an important mediator in the regulation of chemokine production and immune cell infiltration in the liver during ethanol feeding and promotes ethanol-induced steatosis and hepatocyte damage.
Keywords: Alcoholic liver disease, TNFα, Kupffer cells, macrophage recruitment, chemokines
Long-term excessive alcohol consumption can lead to alcoholic liver disease (ALD).(1) ALD is one of the leading causes of preventable death and accounts for approximately 4% of global mortality. In the United States, ALD is responsible for more liver-related mortalities than hepatitis C viral (HCV) infection.(2) Clinical presentation of ALD is variable. Most chronic alcohol abusers accumulate fat in their liver, which can lead to further progression to varying degrees of hepatic inflammation, cell death and fibrosis in some individuals.
The liver is an important innate and adaptive immune organ with a broad range of actions involving both cellular and soluble factors. This complex, dynamic organ houses a large population of natural killer, natural killer T cells and Kupffer cells and is the principal site of production of complement proteins, as well as other molecules important for orchestrating an immune response.(3) The essential role of Kupffer cell activation and sensitization in ALD has been well characterized.(4)
In addition to the contribution of cellular components of the innate immune system to ALD, soluble innate immune factors were first identified as key factors in the progression of ALD when Yin et al. found that tumor necrosis factor receptor-1 −/− mice are protected from injury associated with long-term ethanol feeding.(5) Chronic excessive alcohol consumption also leads to increased endotoxin load in the liver, which induces TLR4-TRIF-dependent responses in Kupffer cells.(6) The role of the complement system in the progression of ethanol-induced liver injury has also been investigated. Ethanol exposure increases activation of complement, indicated by increased C3a in the serum and C3b/iC3b/C3c deposition in liver.(7) Mice deficient in C3 or C5 are protected from ethanol-induced liver injury.(7, 8)
While these insights into the role of innate immune mediators are critical for understanding the progression of ALD, emerging evidence indicates chemokines also play a critical role in disease pathogenesis. Mandrekar et al. reported that monocyte chemotactic protein-1 (MCP-1) is essential for macrophage activation, production of inflammatory mediators and hepatic steatosis after ethanol feeding in mice.(9) In addition to the strong correlation between ALD and increases in pro-inflammatory mediators, these data bring forth the possibility that additional chemokines may play a major role in disease progression.
Here we have investigated the role of one such chemokine, macrophage migration inhibitory factor (MIF), in the development of ethanol-induced liver injury. MIF is a multi-potent protein that exhibits cytokine, chemokine and hormonal characteristics. It is constitutively expressed and stored in pre-formed intracellular pools which are rapidly released upon stimulation. MIF binds to CD74, which forms heterodimeric complexes with CD44 and CXCR2/CXCR4.(10) MIF released from liver stimulates peritoneal macrophages to release TNFα and IL1β.(11) MIF also stimulates release of MCP-1 from endothelial cells and recruits monocytes via CCR2 signaling.(12) MIF is an important contributor to many diseases including various cancers, sepsis and a number of liver pathologies.(13) Patients with liver cirrhosis and hepatocellular carcinoma have increased serum levels of MIF. Additionally, there is a positive correlation between MIF expression and necro-inflammation in liver of patients with hepatitis B viral infection.(14) Akyildiz et al. provided evidence that increased MIF expression in the liver is due to infiltrating monocytes in patients with non-alcoholic steatohepatitis.(15) Importantly, serum concentration of MIF is increased in ALD patients and positively correlates with concentration of serum transaminases.(16, 17)
Since MIF is a multi-potent regulator of innate immune responses, we hypothesized MIF is a critical mediator of ALD pathogenesis. If MIF functions as a chemoattractant during ethanol exposure, recruiting monocytes to the liver and regulating pro-inflammatory responses, then MIF−/− mice should be protected from chronic ethanol-induced liver injury. Indeed, ethanol feeding to wild-type mice increased MIF expression in liver and concentration in the plasma, as well as enhanced the recruitment of peripheral monocytes to the liver. In contrast, ethanol feeding to MIF−/− mice decreased F4/80+ cells and did not elicit recruitment of peripheral monocytes. This change in monocyte population in the liver was associated with protection of MIF−/− mice from chronic ethanol-induced hepatic steatosis, pro-inflammatory cytokine production and sensitization to LPS.
Experimental Procedures
Materials
Eight to 10 week old female mice were used to perform the following studies. C57BL/6 or 129/Sv-C57BL/6 mice were purchased from The Jackson Laboratory (Bar Harbor, Maine). MIF−/− mice on a C57BL/6 background were obtained from Dr. R. Bucala (Yale University, New Haven, Connecticut)(18) and a breeding colony was established at CCF. CYP2E1−/− mice on a 129/Sv-C57BL/6N mixed background were obtained from Dr. A. Cederbaum (Mount Sinai School of Medicine, New York, New York) and used to establish a breeding colony at CCF.
Ethanol Feeding
All procedures involving animals were approved by the Cleveland Clinic Institutional Animal Care and Use Committee. Mice were housed in plastic cages with microisolator lids. Animals were fed 5.5% (total kcal) ethanol for 2 days, 11% for 2 days (4d), 22% for 1 week (11d), 27% for 1 week (18d), and finally 32% for 1 week (25d). Control mice were pair-fed an identical liquid diet except the diet is iso-calorically substituted with maltose dextrans in place of ethanol.(8, 19) See supplemental materials for additional details.
Plasma MIF
Blood was drawn from mice via the vena cava and placed on ice. Plasma was collected by centrifugation for 2.5 min at 10,000 × g. Samples were denatured in Laemmli buffer for Western blot analysis and then stored at − 20 °C. Plasma (2 μl) samples were loaded onto 4% – 12% reducing SDS-polyacrylamide gradient gels. MIF antibody (Torrey Pines Biolabs, Inc, Secaucus, NJ) was used at 1:500 in 1% bovine serum albumin to detect immunoreactive protein using enhanced chemiluminescence, images were collected, and signal intensities were quantified using Eastman Kodak Co. Image Station 4000R.
RNA Isolation and Quantitative Real-Time PCR
RNA was isolated from liver, reverse transcribed and analyzed via quantitative real-time PCR (qRT-PCR). Data were collected using a Stratagene Mx3000P thermal cycler (Agilent Technologies, Santa Clara, CA). Relative mRNA expression was determined by comparing expression levels of target mRNA to 18S rRNA. Statistical analyses were performed on the ΔCt values (mean Ct from gene of interest - mean Ct from 18S).(20)
Immunohistochemistry
Immunohistochemical analysis of F4/80, C3b/iC3b/C3c and Ly6c was performed using optimal cutting temperature (OCT) frozen liver sections. Staining for immunoreactive MIF and 4-hydroxynonenol adducts was performed in paraffin-embedded liver sections. Terminal deoxynucleotidyl transferase-mediated dUTP nick end labeling (TUNEL) positive staining in liver was analyzed using ApopTag plus In Situ Apoptosis Detection Kit (S7111, Millipore, Billerica, MA).
Inflammatory Score
Hematoxylin and Eosin stained liver sections were examined and assigned an inflammatory score by a liver pathologist Xiuli Liu, MD (Anatomic Pathology, Cleveland Clinic, Cleveland, OH). Total inflammatory scoring included both the degree of lobular inflammation in clusters and mononuclear cell infiltration with a diffuse distribution.
Flow Cytometry
Liver non-parenchymal cells (NPCs) were isolated from wild-type and MIF−/− mice, stained with fluorochrome-conjugated CD45, CD11c and Ly6C. See supplemental for additional details.
Statistical Analysis
Values are reported as means ± standard error of the mean (SEM). Multiple feeding trials were performed and combined for final data analysis. Data were analyzed by ANOVA using general linear models procedure (SAS, Carey, IN). If data were not normally distributed, data were log transformed. Multiple comparisons were analyzed using least square means.
Results
Chronic ethanol feeding induces expression of MIF in the liver and causes liver steatosis and liver injury in mice
MIF is produced in the liver and multiple cell types in the liver can respond to MIF via interaction with its receptor CD74. Ethanol feeding to wild-type mice increased the expression of MIF mRNA in liver at 4d, 11% (kcal) ethanol compared to pair-fed mice; this increase was maintained over 25d, 32% (kcal) ethanol (Figure 1A/B). In contrast, ethanol feeding had no effect on hepatic expression of CD74 mRNA. Content of MIF in the plasma was also increased after 25d, 32% ethanol feeding in wild-type mice (Figure 1C), consistent with previous reports that ethanol feeding to rats increases circulating MIF.(21) MIF was localized to both parenchymal and non-parenchymal cells in the liver indicated by diffuse immunohistochemical staining in both control and ethanol-fed mice (Figure 1D). MIF and CD74 were detected by Western blot in both parenchymal and non-parenchymal cell populations isolated from liver of control and ethanol-fed mice (Figure 1E).
Figure 1.

Ethanol feeding increased MIF expression in liver and plasma. C57BL/6 mice were allowed free access to an ethanol-containing liquid diet or pair-fed control diet. (A/B) Expression of MIF and CD74 mRNA was measured in liver by qRT-PCR at two time points of ethanol feeding, 4d, 11% and 25d, 32%, or in pair-fed control mice. Expression of the genes of interest was normalized to 18S (n=4 pair-fed and n=6 for ethanol-fed mice). (C) The relative concentration of MIF in plasma was assessed by Western blot. n=3 pair-fed and n=6 for ethanol-fed mice. Immunoreactive MIF was assessed via (D) immunohistochemistry in liver and (E) Western blot in isolated hepatocytes (H) and non-parenchymal cells (N). (E) Relative CD74 was measured by Western blot in hepatocytes and NPCs isolated from pair-fed (P) and 25d, 32% ethanol-fed mice (E). (D) IHC images represent 2 images per liver and were acquired using 20x objective (n=5 pair-fed and n=9 ethanol-fed mice). Values represent means ± SEM. Asterisks represent statistical significance between pair-fed and ethanol-fed groups (P < 0.05).
If MIF contributes to the pathophysiological effects of ethanol, then mice deficient in MIF should be protected from ethanol-induced liver injury. Wild-type and MIF−/− mice were allowed free access to the Lieber-DeCarli ethanol diet for 25d, 32% or pair-fed control diets. Ethanol increased hepatic triglycerides, as well as activity of plasma ALT and AST, in wild-type mice compared to pair-fed controls; this response was reduced in MIF−/− mice (Figure 2A). Chronic ethanol feeding also increased the number of TUNEL positive hepatocyte nuclei in liver of wild-type mice, but not MIF−/− mice (Figure 2B), indicating that MIF was required for chronic ethanol-induced apoptosis of hepatocytes.
Figure 2.

MIF−/− mice were protected from chronic ethanol-induced liver injury. C57BL/6 and MIF−/− mice were allowed free access to ethanol containing diets or pair-fed control diets. Liver injury was characterized at 25d, 32% ethanol feeding compared to pair-fed controls. (A) Hepatic triglycerides were measured by biochemical assay and plasma ALT and AST were quantified enzymatically. (B) TUNEL positive nuclei were visualized and semi-quantified in paraffin-embedded liver sections. (C) Induction of CYP2E1 protein was measured by immunoblot and quantified via densitometry. (D) Immunoreactive 4HNE adducts were visualized by immunohistochemistry and semi-quantified in paraffin-embedded liver sections. Images were acquired using 10x (4HNE) or 20x (TUNEL) objective. Figures represent 2 images per liver (n=9 pair-fed and n=11 ethanol-fed mice). Values represent means ± SEM, n=4 pair-fed and n=6 for ethanol-fed mice. Values with different superscripts are significantly different from each other (P < 0.05).
Protection from chronic ethanol-induced liver injury in MIF−/− mice is independent of ethanol intake or metabolism
Protection from chronic ethanol-induced liver injury in MIF−/− mice was not due to differences in ethanol intake or metabolism. Wild-type and MIF−/− mice had similar intakes of ethanol-containing diet (data not shown). Plasma ethanol concentrations were similar between wild-type and MIF−/− mice when measured 90 minute after an oral gavage of ethanol to mice never before exposed to ethanol, as well as 2 hours into the dark cycle on 23d, 32% ethanol feeding (Supplemental Figure 1). Induction of CYP2E1 in the liver was similar after chronic ethanol feeding in both wild-type and MIF−/− mice (Figure 2C). Consistent with the equivalent increase in CYP2E1 expression between genotypes, accumulation of 4HNE adducts in the liver, an indicator of oxidant stress, during ethanol feeding was independent of genotype (Figure 2D).
Maintenance of Kupffer cells and TNFα production are MIF-dependent during early ethanol feeding
To understand the mechanisms by which MIF contributes to chronic ethanol-induced liver injury, early inflammatory responses were evaluated in wild-type and MIF−/− mice after 4d, 11% ethanol feeding. Ethanol feeding increased TUNEL positive nuclei in the liver of both wild-type and MIF−/− mice at 4d, 11% ethanol feeding (Figure 3A). In contrast to apoptosis of hepatocytes at 25d, 32% ethanol feeding, the distribution of TUNEL positive cells to the hepatic sinusoid indicated the apoptotic death of Kupffer cells at this early time point. This was confirmed by co-localization of TUNEL+ nuclei with F4/80+ cells (Supplemental Figure 3E). These data are similar to previous reports of Kupffer cell apoptosis, rather than hepatocytes, early in the response to ethanol. Complement activation, assessed by the accumulation of immunoreactive C3b/iC3b/C3c in the liver, was also detected after 4d, 11% ethanol in both wild-type and MIF−/− mice (Figure 3B). However, while 4d, 11% ethanol feeding increased TNFα production in wild-type mice, MIF−/− mice were protected (Figure 3C). These results suggest that while apoptosis of Kupffer cells and the activation of complement induced by early ethanol feeding is independent of MIF, increased expression of TNFα by early ethanol feeding resulted from a MIF-dependent mechanism.(19)
Figure 3.

Early immune responses in liver after 4d, 11% ethanol feeding. C57BL/6 and MIF−/−mice were allowed free access to ethanol containing diets or pair-fed control diets. (A) TUNEL positive nuclei, immunoreactive (B) C3b/iC3b/C3c and (C) TNFα were visualized in paraffin-embedded or OCT-frozen liver sections. Values indicate percentage of TUNEL+ nuclei/Dapi (A), total number of positive punctae for C3c/iC3b/C3c (B) and F4/80 (D), and mean fluorescence intensity for TNFα (C). Black arrows indicate zoom of white boxes to represent sinusoidal TUNEL+ nuclei (A) or deposition of C3b/iC3b/C3c (B). (D) F4/80 mRNA expression was measured via qRT-PCR and (E) immunoreactive F4/80 was visualized in OCT-frozen liver sections. F4/80 mRNA expression was normalized to 18S. Images were acquired using 10x (TNFα) or 20x (TUNEL, C3b/iC3b/C3c, F4/80) objective. Figures represent 2 images per liver. Values represent means ± SEM, n=4 pair-fed and n=6 ethanol-fed. Values with different superscripts are significantly different from each other (P < 0.05).
MIF mediates early and chronic ethanol-induced macrophage/monocyte replenishment and recruitment
Because of MIF’s potent chemokine activity, we hypothesized that decreased TNFα expression in the MIF−/− mice after 4d, 11% ethanol feeding could be due to a failure to repopulate the liver with macrophages after the ethanol-induced apoptosis of resident Kupffer cells. To test this hypothesis, expression of F4/80, a macrophage marker, was measured in wild-type and MIF−/− mice. Quantity of F4/80 mRNA and protein expression was not affected by genotype in pair-fed controls (Figure 3D/E). However, the response to ethanol feeding differed by genotype. In wild-type mice, ethanol feeding for 4d, 11% had no affect on F4/80 mRNA; however, F4/80 mRNA was reduced after ethanol feeding in MIF−/− mice (Figure 3D). Similarly, the number of F4/80+ cells in the liver was not affected by ethanol feeding in wild-type mice, but was reduced in MIF−/− mice (Figure 3E). These data suggest that MIF was required to maintain macrophage populations in the liver during the early response to ethanol.
If MIF is required to replenish Kupffer cells after ethanol feeding, MIF−/− mice should exhibit sustained depletion of macrophages during chronic ethanol feeding. Similar to 4d, 11% ethanol feeding, both expression of F4/80 mRNA and the number of F4/80+ cells was sustained in wild-type mice after 25d, 32% ethanol feeding. However, MIF−/− mice expressed less F4/80 mRNA and had fewer F4/80+ cells after 25d, 32% ethanol feeding (Figure 4A and 4B).
Figure 4.

Leukocyte recruitment after chronic ethanol feeding in wild-type and MIF−/− mice. Leukocyte phenotype in liver of C57BL/6 and MIF−/− mice was analyzed after 25d, 32% ethanol feeding. (A) Immunoreactive F4/80 was visualized and semi-quantified in liver sections frozen in OCT. Figures represent 2 images per liver. (B) F4/80 mRNA expression in liver was measured via qRT-PCR. Images were acquired using 10x objective. F4/80 mRNA expression was normalized to 18S. n=4 pair-fed and n=6 ethanol-fed. (C) Total CD45+ leukocytes and monocyte cell markers, CD11c and Ly6C, were quantified in isolated liver non-parenchymal cells via flow cytometry. CD11c and Ly6c graphs represent fold change compared to wild-type pair-fed mice. (D) Ly6c was assessed by immunohistochemistry and semi-quantified in liver sections frozen in OCT. Black arrows indicate zoom of white boxes to represent clusters of Ly6c staining. Values represent means ± SEM, n=10 pair-fed and n=10 ethanol-fed. Values with different superscripts are significantly different from each other (P < 0.05).
In order to better characterize the effect of chronic ethanol feeding on monocyte populations in the liver, non-parenchymal cells were analyzed via flow cytometry. The number of CD45+ cells (total leukocytes) was increased in wild-type mice after chronic ethanol feeding, but no increase was seen in MIF−/− mice (Figure 4C). This CD45+ population included large proportions of CD11c+ and Ly6C+ cells after 25d, 32% ethanol feeding in wild-type mice; however, the number of CD11c+ and Ly6C+ cells in MIF−/− mice was not affected by ethanol feeding (Figure 4C/D). To determine the cellular origin of the Ly6C+ cells, NIMP14, a marker of neutrophils, was examined to distinguish infiltrating mononuclear and polymorphonuclear cells. The number of NIMP14 + cells was not influenced by diet or genotype either after 25d, 32% ethanol feeding (Supplemental Figure 4A) or in response to 4hr LPS challenge (Supplemental Figure 4B). These data therefore suggest that infiltrating Ly6C+ cells are likely of mononuclear cell origin.
Production of pro-inflammatory mediators and chemokines was increased in liver after ethanol feeding in a MIF-dependent manner
Increased monocyte infiltration was associated with increased expression of pro-inflammatory mediators and chemokines after ethanol feeding. TLR4 and TNFα gene expression was elevated in wild-type mice, but not in MIF−/− mice (Figure 5A). MCP-1, a potent chemoattractant of macrophages and dendritic cells, CXCL10, which attracts monocytes, T cells and NK cells, and MIP-2, a chemoattractant produced by monocytes, were investigated as potential contributors to monocyte infiltration. MCP-1, CXCL10 and MIP2 mRNA expression was increased in wild-type mice after chronic ethanol feeding (Figure 5B). MIF−/− mice were protected from ethanol-induced expression of these chemokines.
Figure 5.

MIF−/− mice were protected from increased expression of pro-inflammatory mediators after chronic ethanol feeding. Expression of (A) TLR4, TNFα, (B) MCP-1, CXCL10 and MIP2 mRNA was quantified in liver via qRT-PCR. Expression of the genes of interest was normalized to 18S. Values represent means ± SEM, n=4 pair-fed and n=6 ethanol-fed. Values with different superscripts are significantly different from each other (P < 0.05).
MIF mediates sensitization to LPS challenge in mice after chronic ethanol feeding
To determine if MIF contributes to more severe, acute inflammation, similar to that observed in alcoholic steatohepatitis, wild-type and MIF−/− mice were challenged with LPS 4 hours prior to euthanasia after chronic ethanol feeding. After LPS challenge, pair-fed wild-type mice exhibited some total liver inflammation, as measured by mononuclear cell infiltration and lobular inflammation (Figure 6B); chronic ethanol-feeding exacerbated this response (Figure 6A, black arrows). In contrast, MIF−/− mice were less prone to liver inflammation both in pair- and ethanol-fed mice (Figure 6B). Increased liver inflammation in wild-type mice was coupled with enhanced chemotactic activity in LPS-challenged mice. MCP-1, Intercellular Adhesion Molecule 1 and E-selectin (CD62E) mRNA expression was exacerbated after chronic ethanol and LPS; however, MIF−/− mice were not sensitized to challenge with LPS after chronic ethanol feeding (Figure 6C).
Figure 6.

MIF−/− mice were protected from ethanol-sensitized LPS-induced inflammation. C57BL/6 and MIF−/− mice were allowed free access to ethanol containing diets or pair-fed control diets. After 25d, 32% ethanol feeding, mice were challenged with LPS via intraperitoneal injection 4hr prior to euthanasia. (A) Hematoxylin and eosin stained liver sections were examined and (B) assigned an inflammatory score by a pathologist. Inflammatory score was based on mononuclear cell and lobular inflammation. Arrows indicate foci of infiltrating cells (inset represent zoom of lower black arrow). (C) Expression of MCP-1, ICAM-1 and CD62E mRNA was quantified in liver by qRT-PCR. Expression of the genes of interest was normalized to 18S. Images were acquired using 10x objective. Figures represent 2 images per liver. Values represent means ± SEM, n= 4 pair-fed and n=6 ethanol-fed. Values with different superscripts are significantly different from each other (P < 0.05).
Discussion
MIF was originally described as a T cell derived factor that inhibited macrophage movement.(22) Since its original discovery, it has become clear that MIF is a multi-potent cytokine/chemokine that contributes to many pro-inflammatory responses in various pathogenic states including sepsis, colitis, metabolic disorders, and multiple types of arthritis.(23) Here we provide the first evidence that MIF plays a major role in the progression of ethanol-induced liver injury. Ethanol exposure increased the expression of MIF mRNA in the liver, as well as the concentration of MIF in the circulation. MIF was involved in both the early and chronic innate immune responses in the liver after ethanol feeding (summarized in Figure 7).
Figure 7.
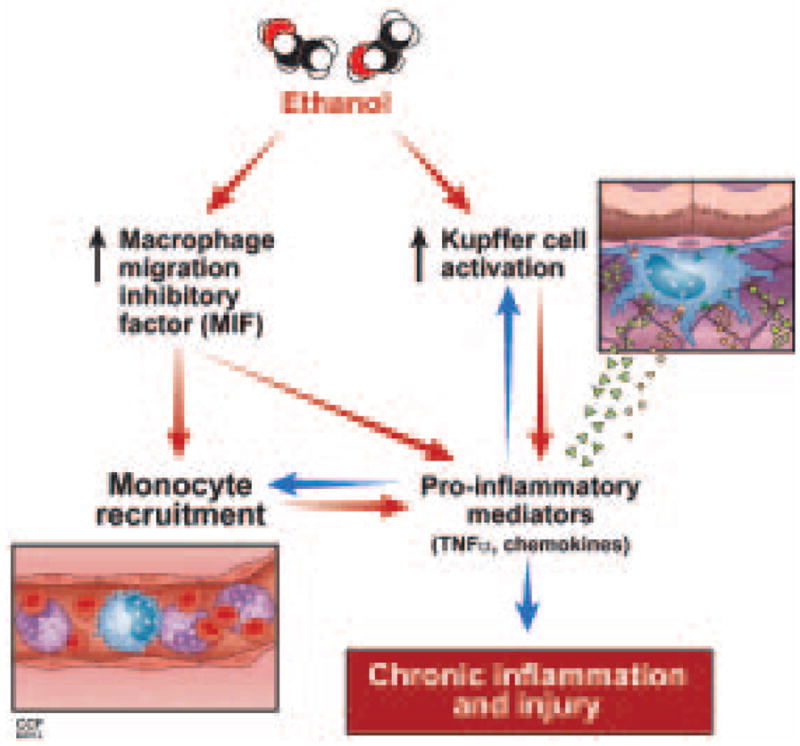
Proposed interaction between ethanol, MIF and innate immune responses. Ethanol feeding in mice results in activation of Kupffer cells and increased MIF production. These two phenomena initiate a complex positive feedback loop involving monocyte infiltration, increased production of pro-inflammatory mediators and chemokines, ultimately leading to chronic inflammation and injury.
The mechanisms for the progression of ethanol-induced liver injury are complex and dynamically regulated over time and hepatocellular location. Very early in the innate immune response to ethanol, there is an increase in apoptosis of Kupffer cells in the liver.(19) This increase in Kupffer cell apoptosis elicits activation of the classical complement pathway and an increase in inflammatory cytokine production.(8) One important activity of MIF is to decrease activation-induced apoptosis of Kupffer cells via p53 inhibition.(18) However, since TUNEL+ nuclei were equivalent between wild-type and MIF−/− mice, it is unlikely that MIF plays a role in this early ethanol-induced apoptosis of Kupffer cells.
During chronic ethanol feeding, MIF was required to elicit the infiltration of non-Kupffer cell monocyte populations and to maintain Kupffer cell numbers in the liver. MIF was critical for infiltration of CD11c+ and Ly6C+ monocytes in wild-type mice after chronic ethanol feeding. Ethanol feeding decreases splenic dendritic cells, without decreasing numbers of dendritic cell precursors, differentiation or turnover in mice(24), suggesting that dendritic cells migrate from the spleen, a major reserve of monocytes(25), to the liver during ethanol feeding. In mouse models of non-alcoholic steatohepatitis, increased MCP-1 production leads to recruitment of bone marrow-derived Ly6C+ monocytes to the liver.(26) In ethanol-induced liver injury, expression of MCP-1 mRNA was increased in wild-type mice; this response was lost in MIF−/−mice. These data indicate MIF directly, and/or indirectly via MCP-1, recruits monocytes from peripheral immune reservoirs. While we cannot rule out the possibility of Kupffer cell proliferation, it is unlikely the maintenance of the Kupffer cell population was due to proliferation, as the data available suggest that proliferation occurs primarily in Th2 responses.(27)
MIF is produced by many cell types and may act in an endocrine and/or paracrine fashion. Ethanol feeding in mice increased expression of MIF mRNA in liver and protein content in plasma. MIF is expressed in both hepatocytes and infiltrating leukocytes in liver of patients with alcoholic hepatitis.(16) In the present study, MIF and CD74 protein was detected in both hepatocytes and non-parenchymal cells; however, the precise cellular origin of MIF protein in the plasma cannot be determined. Neither MIF nor CD74 protein was increased by ethanol in isolated hepatocytes or nonparenchymal cells after 25d, 32% ethanol feeding, despite the increased mRNA expression of MIF in the liver. Because MIF is stored in pre-formed pools and rapidly released, it is likely that during chronic inflammation MIF is expressed and then released into the circulation.
The mechanisms by which ethanol increases the expression and release of MIF are likely complex. While regulation of MIF expression and secretion is not well understood, recent studies have provided insights into possible mechanisms of control. For example, microRNA-451 directly interacts with the 3′ UTR of MIF and regulates MIF expression.(28) Further, Golgi-Associated Protein p115 is essential for releasing MIF from cytoplasmic pools. When p115 was depleted in human monocytes, MIF release into the extracellular environment also decreased.(28) Additionally, cells stimulated with LPS in vitro secreted both MIF and p115 into their supernatant.(29) CYP2E1−/− mice did not induce the expression of MIF mRNA after chronic ethanol feeding compared to wild-type mice (Supplemental Figure 2), suggesting that MIF induction is due, at least in part, to the metabolism of ethanol via CYP2E1. Another contributor to induction of MIF during ethanol exposure may be related to localized hypoxia in the liver during ethanol metabolism.(30, 31) Ischemia-reperfusion, which results in hypoxia, is associated with increased serum MIF, as well as increased expression of MIF mRNA and protein.(11) Further, MIF enhances its own expression under hypoxic conditions.(30) Taken together, it is likely that ethanol metabolism via CYP2E1, in conjunction with localized ethanol-induced hypoxia in the liver, contribute to increased MIF expression during chronic ethanol feeding.
MIF contributes to the progression of ethanol-induced liver injury in mice at multiple stages of injury. MIF−/− mice were protected from steatosis and inflammation, as well as hepatocyte injury and hepatocyte apoptosis after chronic ethanol feeding. Interestingly, MIF is the second protein, along with MCP-1 (9), with chemotactic activity to be associated with regulation of hepatic triglyceride accumulation after ethanol feeding. Here, the effect of MIF in decreasing ethanol-induced triglyceride accumulation may be a direct effect of MIF and/or indirect effect via regulation of the expression of MCP-1. These data are consistent with the growing body of evidence indicating a clear and critical link between innate immune function and the regulation of metabolic activity.(32, 33)
Here we used multiple models of ethanol exposure to investigate specific aspects of the pathophysiology of ALD. The mouse model of chronic ethanol feeding (25d, 32% kcal) results in hepatic steatosis and modest inflammation, but does not model more severe ethanol-induced liver injury. One important clinical presentation of ALD is acute severe alcoholic hepatitis, which is presented clinically as steatosis, hepatocyte ballooning/injury and acute, severe infiltration of mono/polymorphonuclear cells.(34) Thus, in order to interrogate the role of MIF in more severe inflammation, a model of LPS challenge after chronic ethanol feeding was used to better model severe alcoholic steatohepatitis. Ethanol feeding exacerbated chemokine expression, as well as expression of molecules regulating leukocyte trafficking, in response to challenge with LPS in wild-type mice. However, these responses were attenuated in MIF−/− mice did, suggesting that MIF is required to recruit leukocytes to the liver in response to a stimulus with LPS. Enhanced expression of chemokines and cell adhesion molecules after chronic ethanol feeding and LPS challenge was associated with increased mononuclear cell infiltration in a diffuse distribution and lobular inflammation in clusters in wild-type mice. These responses were decreased, but not completely ameliorated, in MIF−/− mice. These data parallel a previous report that demonstrated leukocyte rolling and adhesion to TNFα-stimulated endothelial cells is decreased in the absence of MIF.(35)
Here, we provide evidence that MIF is essential for ethanol-induced liver injury progression; MIF contributes to hepatic injury in response to ethanol consumption at multiple stages in the pathophysiology of ALD and ASH. The primary role of MIF is associated with maintenance of resident hepatic macrophages, regulation of expression of pro-inflammatory and chemotactic mediators and recruitment of peripheral monocytes. In summary, these results indicate that MIF contributes to the pathophysiology of ethanol-induced liver injury in mice and suggest that inhibition of MIF activity with small molecule inhibitors of MIF, such as ISO-1(36), may be an important therapeutic approach to the treatment of ALD. Importantly, polymorphisms in the promoter of the MIF gene, notably −173 G/C and the numbers of CAAT repeats, are associated with increased expression of MIF and are associated with increased risk for numerous inflammatory conditions, including arthritis and ulcerative colitis.(37) MIF is known to be induced by glucocorticoids, as well as act as a negative regulator to glucocorticoid mediated responses, working to maintain normal immune function despite increases in anti-inflammatory signals. Therefore, it will also be important to consider whether polymorphisms in the MIF promoter constitute a genetic susceptibility to the development of ALD and/or resistance to glucocorticoid therapies in severe, acute alcoholic steatohepatitis.
Supplementary Material
Supplemental Figure 1: Wild-type and MIF−/− mice have similar blood ethanol concentrations. C57BL/6 and MIF−/− mice were allowed free access to ethanol containing diets or pair-fed control diets, or given an oral gavage of 25% ethanol diluted in 0.9% saline. Blood ethanol was measured after (A) 90 minute oral gavage or (B) 23 days, 32% ethanol feeding. Values represent means ± SEM, n=4 pair-fed and n=4 ethanol-fed (A) and n =7 wild-type and n=3 MIF−/− (B).
Supplemental Figure 2: MIF expression is decreased in liver of CYP2E1−/− mice. 129/Sv-C57BL/6N and CYP2E1−/− mice were allowed free access to an ethanol-containing liquid diet or pair-fed control diets. (A) Expression of MIF mRNA was measured in liver by qRT-PCR after 25d, 32% ethanol feeding. Expression of the genes of interest was normalized to 18S (n=4 pair-fed and n=6 for ethanol-fed mice). Values represent means ± SEM. Values with different superscripts are significantly different from each other (P < 0.05).
Supplemental Figure 3: Quantification of C3b, TUNEL and F4/80 IHC after 4d, 11% ethanol feeding. C57BL/6 and MIF−/− mice were allowed free access to an ethanol-containing liquid diet or pair-fed control diets. Immunoreactive (A) TUNEL positive nuclei, (B) C3b/iC3b/C3c, (C) TNFα and (D) F4/80 were semi-quantified in wild-type and MIF−/− mice after 4d, 11% ethanol feeding. (E) TUNEL positive nuclei co-localized with F4/80+ cells in liver of wild-type mice after 4 days, 11% ethanol feeding. White box insets represent nuclear TUNEL staining of sinusoidal Kupffer cells. Values represent means ± SEM. Values with different superscripts are significantly different from each other (P < 0.05).
Supplemental Figure 4: Neutrophil trafficking to the liver involves MIF-independent processes. C57BL/6 and MIF−/− mice were allowed free access to ethanol containing diets or pair-fed control diets. After 25d, 32% ethanol feeding, mice were challenged with LPS via intraperitoneal injection 4hr prior to euthanasia. (A) Neutrophil infiltration was examined by immunoreactive NIMP14 in liver of pair- and 25d, 32% ethanol-fed wild-type and MIF−/− mice. (B) Black arrows indicate positive NIMP14 staining, suggesting the presence of neutrophils after 4hr LPS challenge. Inset represent zoom of positive NIMP14 staining in liver of 25d, 32% ethanol-fed mice. Images were acquired using 20x objective. Figures represent 2 images per liver and 4 mice per experimental condition. Values represent means ± SEM, n= 4 pair-fed and n=6 ethanol-fed.
Acknowledgments
Financial Support: NIH grants P20 AA017837, 5R01 AA016399, 5U01 AA020821 and R37 AA011876 (LEN). This work was supported in part by the Case Western Reserve University/Cleveland Clinic CTSA UL1RR024989.
We are thankful to Richard Bucala, MD, PhD (Yale University, New Haven, Connecticut) and Arthur Cederbaum (Mount Sinai School of Medicine, New York, New York) for providing the MIF−/− and CYP2E1−/− mice, respectively. We would also like to thank Dave Schumick (Center for Medical Art and Photography, Cleveland Clinic, Cleveland, Ohio) for his contribution of original artwork (Figure 7), Dr Prakash Ramachandran (University of Edinburgh, Edinburgh, UK) for providing a protocol for isolating non-parenchymal cells and Denise Hatala (Imaging Core, Lerner Research Institute, Cleveland Clinic, Cleveland, Ohio) for assisting with frozen liver (OCT) F4/80 staining.
Abbreviations
- ALD
Alcoholic Liver Disease
- MIF
Macrophage migration inhibitory factor
- ALT
Alanine Aminotransferase
- AST
Aspartate Aminotransferase
- 4HNE
4-hydroxynonenol
- TUNEL
Terminal deoxynucleotidyl transferase mediated dUTP nick end labeling
- SEM
Standard error of the mean
- CYP2E1
Cytochrome P450 2E1
References
- 1.Tome S, Lucey MR. Review article: current management of alcoholic liver disease. Aliment Pharmacol Ther. 2004;19:707–714. doi: 10.1111/j.1365-2036.2004.01881.x. [DOI] [PubMed] [Google Scholar]
- 2.Paula H, Asrani SK, Boetticher NC, Pedersen R, Shah VH, Kim WR. Alcoholic Liver Disease-Related Mortality in the United States: 1980–2003. Am J Gastroenterol. 2010;105:1782–1787. doi: 10.1038/ajg.2010.46. [DOI] [PMC free article] [PubMed] [Google Scholar]
- 3.Gao B, Jeong W-I, Tian Z. Liver: An organ with predominant innate immunity. Hepatology. 2008;47:729–736. doi: 10.1002/hep.22034. [DOI] [PubMed] [Google Scholar]
- 4.Altamirano J, Bataller R. Alcoholic liver disease: pathogenesis and new targets for therapy. Nat Rev Gastroenterol Hepatol. 2011;8:491–501. doi: 10.1038/nrgastro.2011.134. [DOI] [PubMed] [Google Scholar]
- 5.Yin M, Wheeler MD, Kono H, Bradford BU, Gallucci RM, Luster MI, Thurman RG. Essential role of tumor necrosis factor α in alcohol-induced liver injury in mice. Gastroenterology. 1999;117:942–952. doi: 10.1016/s0016-5085(99)70354-9. [DOI] [PubMed] [Google Scholar]
- 6.Gao B, Seki E, Brenner DA, Friedman S, Cohen JI, Nagy L, Szabo G, et al. Innate immunity in alcoholic liver disease. American Journal of Physiology -Gastrointestinal and Liver Physiology. 2011;300:G516–G525. doi: 10.1152/ajpgi.00537.2010. [DOI] [PMC free article] [PubMed] [Google Scholar]
- 7.Pritchard MT, McMullen MR, Stavitsky AB, Cohen JI, Lin F, Medof ME, Nagy LE. Differential Contributions of C3, C5, and Decay-Accelerating Factor to Ethanol-Induced Fatty Liver in Mice. Gastroenterology. 2007;132:1117–1126. doi: 10.1053/j.gastro.2007.01.053. [DOI] [PMC free article] [PubMed] [Google Scholar]
- 8.Roychowdhury S, McMullen MR, Pritchard MT, Hise AG, van Rooijen N, Medof ME, Stavitsky AB, et al. An early complement-dependent and TLR-4 independent phase in the pathogenesis of ethanol-induced liver injury in mice. Hepatology. 2009;49:1326–1334. doi: 10.1002/hep.22776. [DOI] [PMC free article] [PubMed] [Google Scholar]
- 9.Mandrekar P, Ambade A, Lim A, Szabo G, Catalano D. An essential role for monocyte chemoattractant protein-1 in alcoholic liver injury: Regulation of proinflammatory cytokines and hepatic steatosis in mice. Hepatology. 2011;54:2185–2197. doi: 10.1002/hep.24599. [DOI] [PMC free article] [PubMed] [Google Scholar]
- 10.Schwartz V, Lue H, Kraemer S, Korbiel J, Krohn R, Ohl K, Bucala R, et al. A functional heteromeric MIF receptor formed by CD74 and CXCR4. FEBS Letters. 2009;583:2749–2757. doi: 10.1016/j.febslet.2009.07.058. [DOI] [PMC free article] [PubMed] [Google Scholar]
- 11.Liu A, Fang H, Dirsch O, Jin H, Dahmen U. Early release of macrophage migration inhibitory factor after liver ischemia and reperfusion injury in rats. Cytokine. 2012;57:150–157. doi: 10.1016/j.cyto.2011.11.009. [DOI] [PubMed] [Google Scholar]
- 12.Gregory JL, Morand EF, McKeown SJ, Ralph JA, Hall P, Yang YH, McColl SR, et al. Macrophage Migration Inhibitory Factor Induces Macrophage Recruitment via CC Chemokine Ligand 2. The Journal of Immunology. 2006;177:8072–8079. doi: 10.4049/jimmunol.177.11.8072. [DOI] [PubMed] [Google Scholar]
- 13.Grieb G, Merk M, Bernhagen J, Bucala R. Macrophage migration inhibitory factor (MIF): a promising biomarker. Drug News Perspect. 2010;23:257–264. doi: 10.1358/dnp.2010.23.4.1453629. [DOI] [PMC free article] [PubMed] [Google Scholar]
- 14.Akbar SMF, Abe M, Murakami H, Tanimoto K, Kumagi T, Yamashita Y, Michitaka K, et al. Macrophage migration inhibitory factor in hepatocellular carcinoma and liver cirrhosis; relevance to pathogenesis. Cancer Letters. 2001;171:125–132. doi: 10.1016/s0304-3835(01)00606-1. [DOI] [PubMed] [Google Scholar]
- 15.Akyildiz M, Gunsar F, Nart D, Sahin O, Yilmaz F, Akay S, Ersoz G, et al. Macrophage migration inhibitory factor expression and MIF gene −173 G/C polymorphism in nonalcoholic fatty liver disease. European Journal of Gastroenterology & Hepatology. 2010;22:192–198. doi: 10.1097/MEG.0b013e328331a596. 110.1097/MEG.1090b1013e328331a328596. [DOI] [PubMed] [Google Scholar]
- 16.Kumagi T, Akbar F, Horiike N, Onji M. Increased serum levels of macrophage migration inhibitory factor in alcoholic liver diseases and their expression in liver tissues. Clinical Biochemistry. 2001;34:189–193. doi: 10.1016/s0009-9120(01)00214-4. [DOI] [PubMed] [Google Scholar]
- 17.Zhang H-Y, Nanji AA, Luk JM, Huang X-R, Lo C-M, Chen YX, Yuen S-T, et al. Macrophage migration inhibitory factor expression correlates with inflammatory changes in human chronic hepatitis B infection. Liver International. 2005;25:571–579. doi: 10.1111/j.1478-3231.2005.01047.x. [DOI] [PubMed] [Google Scholar]
- 18.Mitchell RA, Liao H, Chesney J, Fingerle-Rowson G, Baugh J, David J, Bucala R. Macrophage migration inhibitory factor (MIF) sustains macrophage proinflammatory function by inhibiting p53: Regulatory role in the innate immune response. Proceedings of the National Academy of Sciences. 2002;99:345–350. doi: 10.1073/pnas.012511599. [DOI] [PMC free article] [PubMed] [Google Scholar]
- 19.Cohen JI, Roychowdhury S, McMullen MR, Stavitsky AB, Nagy LE. Complement and Alcoholic Liver Disease: Role of C1q in the Pathogenesis of Ethanol-Induced Liver Injury in Mice. Gastroenterology. 2010;139:664–674.e661. doi: 10.1053/j.gastro.2010.04.041. [DOI] [PMC free article] [PubMed] [Google Scholar]
- 20.Pritchard MT, Cohen JI, Roychowdhury S, Pratt BT, Nagy LE. Early growth response-1 attenuates liver injury and promotes hepatoprotection after carbon tetrachloride exposure in mice. Journal of Hepatology. 2010;53:655–662. doi: 10.1016/j.jhep.2010.04.017. [DOI] [PMC free article] [PubMed] [Google Scholar]
- 21.Nanji AA, Lau GK, Tipoe GL, Yuen ST, Chen YX, Thomas P, Lan HY. Macrophage migration inhibitory factor expression in male and female ethanol-fed rats. J Interferon Cytokine Res. 2001;21:1055–1062. doi: 10.1089/107999001317205187. [DOI] [PubMed] [Google Scholar]
- 22.Bloom BR, Bennett B. Mechanism of a Reaction in Vitro Associated with Delayed-Type Hypersensitivity. Science. 1966;153:80–82. doi: 10.1126/science.153.3731.80. [DOI] [PubMed] [Google Scholar]
- 23.Calandra T, Roger T. Macrophage migration inhibitory factor: aregulator of innate immunity. Nat Rev Immunol. 2003;3:791–800. doi: 10.1038/nri1200. [DOI] [PMC free article] [PubMed] [Google Scholar]
- 24.Edsen-Moore MR, Fan J, Ness KJ, Marietta JR, Cook RT, Schlueter AJ. Effects of Chronic Ethanol Feeding on Murine Dendritic Cell Numbers, Turnover Rate, and Dendropoiesis. Alcoholism: Clinical and Experimental Research. 2008;32:1309–1320. doi: 10.1111/j.1530-0277.2008.00699.x. [DOI] [PMC free article] [PubMed] [Google Scholar]
- 25.Thomson AW, Knolle PA. Antigen-presenting cell function in the tolerogenic liver environment. Nat Rev Immunol. 2010;10:753–766. doi: 10.1038/nri2858. [DOI] [PubMed] [Google Scholar]
- 26.Miura K, Yang L, van Rooijen N, Ohnishi H, Seki E. Hepatic recruitment of macrophages promotes non-alcoholic steatohepatitis through CCR2. American Journal of Physiology -Gastrointestinal and Liver Physiology. 2012 doi: 10.1152/ajpgi.00365.2011. [DOI] [PMC free article] [PubMed] [Google Scholar]
- 27.Jenkins SJ, Ruckerl D, Cook PC, Jones LH, Finkelman FD, van Rooijen N, MacDonald AS, et al. Local Macrophage Proliferation, Rather than Recruitment from the Blood, Is a Signature of TH2 Inflammation. Science. 2011;332:1284–1288. doi: 10.1126/science.1204351. [DOI] [PMC free article] [PubMed] [Google Scholar]
- 28.Bandres E, Bitarte N, Arias F, Agorreta J, Fortes P, Agirre X, Zarate R, et al. microRNA-451 Regulates Macrophage Migration Inhibitory Factor Production and Proliferation of Gastrointestinal Cancer Cells. Clinical Cancer Research. 2009;15:2281–2290. doi: 10.1158/1078-0432.CCR-08-1818. [DOI] [PubMed] [Google Scholar]
- 29.Merk M, Baugh J, Zierow S, Leng L, Pal U, Lee SJ, Ebert AD, et al. The Golgi-Associated Protein p115 Mediates the Secretion of Macrophage Migration Inhibitory Factor. The Journal of Immunology. 2009;182:6896–6906. doi: 10.4049/jimmunol.0803710. [DOI] [PMC free article] [PubMed] [Google Scholar]
- 30.Zhang Y, Talwar A, Tsang D, Bruchfeld A, Sadoughi A, Hu M, Omonuwa K, et al. Macrophage migration inhibitory factor mediates hypoxia-induced pulmonary hypertension. Molecular medicine (Cambridge, Mass) 2012;18:215–223. doi: 10.2119/molmed.2011.00094. [DOI] [PMC free article] [PubMed] [Google Scholar]
- 31.Arteel GE, Iimuro Y, Yin M, Raleigh JA, Thurman RG. Chronic enteral ethanol treatment causes hypoxia in rat liver tissue in vivo. Hepatology. 1997;25:920–926. doi: 10.1002/hep.510250422. [DOI] [PubMed] [Google Scholar]
- 32.Im S-S, Yousef L, Blaschitz C, Liu Janet Z, Edwards Robert A, Young Stephen G, Raffatellu M, et al. Linking Lipid Metabolism to the Innate Immune Response in Macrophages through Sterol Regulatory Element Binding Protein-1a. Cell metabolism. 2011;13:540–549. doi: 10.1016/j.cmet.2011.04.001. [DOI] [PMC free article] [PubMed] [Google Scholar]
- 33.Shi H, Kokoeva MV, Inouye K, Tzameli I, Yin H, Flier JS. TLR4 links innate immunity and fatty acid induced insulin resistance. The Journal of Clinical Investigation. 2006;116:3015–3025. doi: 10.1172/JCI28898. [DOI] [PMC free article] [PubMed] [Google Scholar]
- 34.Spahr L, Rubbia-Brandt L, Genevay M, Hadengue A, Giostra E. Early liver biopsy, intraparenchymal cholestasis, and prognosis in patients with alcoholic steatohepatitis. BMC Gastroenterology. 2011;11:115. doi: 10.1186/1471-230X-11-115. [DOI] [PMC free article] [PubMed] [Google Scholar]
- 35.Cheng Q, Mc Keown SJ, Santos L, Santiago FS, Khachigian LM, Morand EF, Hickey MJ. Macrophage Migration Inhibitory Factor Increases Leukocyte Endothelial Interactions in Human Endothelial Cells via Promotion of Expression of Adhesion Molecules. The Journal of Immunology. 2010;185:1238–1247. doi: 10.4049/jimmunol.0904104. [DOI] [PubMed] [Google Scholar]
- 36.Al-Abed Y, Dabideen D, Aljabari B, Valster A, Messmer D, Ochani M, Tanovic M, et al. ISO-1 Binding to the Tautomerase Active Site of MIF Inhibits Its Pro-inflammatory Activity and Increases Survival in Severe Sepsis. Journal of Biological Chemistry. 2005;280:36541–36544. doi: 10.1074/jbc.C500243200. [DOI] [PubMed] [Google Scholar]
- 37.Renner P, Roger T, Calandra T. Macrophage Migration Inhibitory Factor: Gene Polymorphisms and Susceptibility to Inflammatory Diseases. Clinical Infectious Diseases. 2005;41:S513–S519. doi: 10.1086/432009. [DOI] [PubMed] [Google Scholar]
Associated Data
This section collects any data citations, data availability statements, or supplementary materials included in this article.
Supplementary Materials
Supplemental Figure 1: Wild-type and MIF−/− mice have similar blood ethanol concentrations. C57BL/6 and MIF−/− mice were allowed free access to ethanol containing diets or pair-fed control diets, or given an oral gavage of 25% ethanol diluted in 0.9% saline. Blood ethanol was measured after (A) 90 minute oral gavage or (B) 23 days, 32% ethanol feeding. Values represent means ± SEM, n=4 pair-fed and n=4 ethanol-fed (A) and n =7 wild-type and n=3 MIF−/− (B).
Supplemental Figure 2: MIF expression is decreased in liver of CYP2E1−/− mice. 129/Sv-C57BL/6N and CYP2E1−/− mice were allowed free access to an ethanol-containing liquid diet or pair-fed control diets. (A) Expression of MIF mRNA was measured in liver by qRT-PCR after 25d, 32% ethanol feeding. Expression of the genes of interest was normalized to 18S (n=4 pair-fed and n=6 for ethanol-fed mice). Values represent means ± SEM. Values with different superscripts are significantly different from each other (P < 0.05).
Supplemental Figure 3: Quantification of C3b, TUNEL and F4/80 IHC after 4d, 11% ethanol feeding. C57BL/6 and MIF−/− mice were allowed free access to an ethanol-containing liquid diet or pair-fed control diets. Immunoreactive (A) TUNEL positive nuclei, (B) C3b/iC3b/C3c, (C) TNFα and (D) F4/80 were semi-quantified in wild-type and MIF−/− mice after 4d, 11% ethanol feeding. (E) TUNEL positive nuclei co-localized with F4/80+ cells in liver of wild-type mice after 4 days, 11% ethanol feeding. White box insets represent nuclear TUNEL staining of sinusoidal Kupffer cells. Values represent means ± SEM. Values with different superscripts are significantly different from each other (P < 0.05).
Supplemental Figure 4: Neutrophil trafficking to the liver involves MIF-independent processes. C57BL/6 and MIF−/− mice were allowed free access to ethanol containing diets or pair-fed control diets. After 25d, 32% ethanol feeding, mice were challenged with LPS via intraperitoneal injection 4hr prior to euthanasia. (A) Neutrophil infiltration was examined by immunoreactive NIMP14 in liver of pair- and 25d, 32% ethanol-fed wild-type and MIF−/− mice. (B) Black arrows indicate positive NIMP14 staining, suggesting the presence of neutrophils after 4hr LPS challenge. Inset represent zoom of positive NIMP14 staining in liver of 25d, 32% ethanol-fed mice. Images were acquired using 20x objective. Figures represent 2 images per liver and 4 mice per experimental condition. Values represent means ± SEM, n= 4 pair-fed and n=6 ethanol-fed.