Abstract
Purpose: To quantify the concentration of soft-tissue components of water, fat, and calcium through the decomposition of the x-ray spectral signatures in multi-energy CT images.
Methods: Decomposition of dual-energy and multi-energy x-ray data into basis materials can be performed in the projection domain, image domain, or during image reconstruction. In this work, the authors present methodology for the decomposition of multi-energy x-ray data in the image domain for the application of soft-tissue characterization. To demonstrate proof-of-principle, the authors apply several previously proposed methods and a novel content-aware method to multi-energy images acquired with a prototype photon counting CT system. Data from phantom and ex vivo specimens are evaluated.
Results: The number and type of materials in a region can be limited based on a priori knowledge or classification strategies. The proposed difference classifier successfully classified the image into air only, water+fat, water+fat+iodine, and water+calcium regions. Then, the content-aware material decomposition based on weighted least-square optimization generated quantitative maps of concentration. Bias in the estimation of the concentration of water and oil components in a phantom study was <0.10 ± 0.15 g/cc on average. Decomposition of ex vivo carotid endarterectomy specimens suggests the presence of water, lipid, and calcium deposits in the plaque walls.
Conclusions: Initial application of the proposed methodology suggests that it can decompose multi-energy CT images into quantitative maps of water, adipose, iodine, and calcium concentrations.
Keywords: material decomposition, photon counting detector, multi-energy CT, plaque imaging
INTRODUCTION
Several multi-energy CT systems have been proposed and constructed for use in small animal imaging,1 whole-body clinical systems,2 and breast CT.3 These systems are based on CdTe or CdZnTe detectors, which offer high energy resolution and the potential to discriminate multiple energy bands during a single acquisition.
Our current work is motivated by the need to assess the tissue composition of atherosclerotic plaque. The detection and quantification of vulnerable plaque is widely accepted as one of the leading challenges in diagnostics. Clinical in vivo imaging of atherosclerosis primarily focuses on assessment of lumen diameter, which is a poor measure of risk and plaque vulnerability.4 As such, the conventional imaging modalities of CT, angiography, and ultrasound have a limited role in detailed plaque characterization. An ideal plaque imaging device would (a) have high spatial resolution to measure plaque morphology, (b) offer multiple tissue classification (lipid, loose fibrous matrix, calcium, dense fibrous tissue) to investigate plaque composition,5 and (c) be safe for serial studies. While conventional dual-energy CT can provide high resolution, it is not able to provide soft tissue classification6 and requires relatively high dose levels limiting its use for serial evaluation.
Multi-energy CT offers the potential to decompose spectral information for tissue classification and quantification. Multi-energy CT has been applied to plaque imaging in the context of quantifying the concentration of contrast agents.7 In particular, gadolinium and gold contrast agents have been quantified in phantom and mouse studies.8, 9 Little effort to date has been applied to quantifying soft tissue components in plaques in the absence of contrast agents, based on the prevailing assumption that soft-tissue components, such as lipid versus water, do not have sufficient differences in their mass attenuation coefficients to enable discrimination. This work presents methodology for the classification and quantification of the soft tissue components of water, lipid, and calcium.
METHODS
Separation of materials
We evaluated the theoretical and measured ability to separate two solutions. Using a method proposed by Wang et al.,10 we determined the angle of separation of two materials. With the vector of linear attenuation coefficients defined as for each energy bin, e, of a total of E bins, the angle of separation between material, m, 1 and 2 is
Vectors were theoretically determined from known material properties11 and concentrations in the oil phantom discussed below. These vectors were based on an estimate of the spectra in each energy window using a simulated spectrum for a 120 kVp, fixed tungsten anode source with 0.5 mm Be inherent filtration.12 The vectors from the measured data were determined from reconstructed images of linear attenuation at each energy bin using the prototype multi-energy system discussed below. This method provides a measure of the separability of two materials, not a method for performing the separation; The section below describes methods for performing the actual separation and quantification of materials.
Image decomposition
The linear attenuation at each location in the image, , can be represented as a linear combination of the mass attenuation coefficients of each component material, fm(e), as . The goal of decomposition is to estimate the concentration of materials at each location, .
For the purposes of comparison, we evaluated the performance of four image-based decomposition methods. For the first method, it has been demonstrated that the linear attenuation of biologic materials can be represented as a linear combination of photo-electric and Compton cross-sections.13 When a sample also contains a K-edge discontinuity, the representation needs to be extended to include a third component.14 Therefore, the linear attenuation at each location in the image, , for each energy, e, can be represented as
with contributions, α, from basis functions defined as the energy dependent photo-electric, fph, Compton, fC, and K-edge, fk, component (from materials such as iodine or gadolinium) attenuation. Multi-energy data can be decomposed directly into these basis images by finding the optimal α’s. In this work, we performed weighted least-squares estimation of the basis materials contributions as
where is an estimate of the linear attenuation coefficient at energy bin e from the reconstructed multi-energy images. In this work, we employ B = 3 physical basis functions and have E = 5 energy bands. The weights, We, account for variable confidence in information from each energy bin, based on the number of photons in each energy band. These coefficients can be used to estimate at any energy, which can then be decomposed into concentrations of materials of interest as discussed below. This basis decomposition is denoted as “Method A: Basis.”
Alternatively, the multi-energy data could be decomposed directly into the materials of interest, bypassing the need to form basis images first. This offers the potential benefit of avoiding any information loss from the non-orthogonality of the basis functions. The multi-energy images can be directly decomposed into material images according to
This approach, without a weighting component, was proposed previously.15 It is essentially the same as the basis material decomposition, except mass attenuation coefficients of materials of interest are used instead of physical basis functions. This method allows for the selection of materials that are known to fully constitute our objects of interest. Therefore, with appropriate selection of materials, this method offers the favorable property of being able to enforce non-negativity of the concentration estimates (negative contributions from constituent materials is not physically meaningful). This method is denoted as “Method B: Material.”
Prior work by Le and Molloi, and our initial application of these basis and material methods, found that direct decomposition of multiple, closely related materials from multi-energy data is generally not successful.15 They proposed a decoupled strategy where the images are first segmented into regions containing a single material and then least-squares estimation is used to determine the material concentration. In their work, each location in the image can only be a single material. We propose a variant of this in which the images are first segmented into classes, which can contain a few materials (for example 1–3 materials). Then the weighted least-squares estimation can determine the concentration in this limited set of possible materials. This approach benefits from content-aware, dimensionality reduction in which each estimated concentration is derived from a limited set of possible bases. For example, instead of estimating 4–5 unknown concentrations from 4 to 5 energy bands, this approach can estimate two unknown concentrations from 4 to 5 energy bands at each location and the particular materials vary by location in the image based on a priori knowledge or an initial automatic classification.
Specifically, we propose two modifications of Method A and B, both based on reducing the number of estimated materials. The image is first segmented into classes, in which each location contains only a limited set of materials. “Method C: Class+Basis” performs basis material decomposition (identical to Method A:Basis), followed by content-aware material estimation from the basis maps. That is, each location in the image contains only a limited set of materials. The second modification “Method D: Class+Material” performs material decomposition directly from the multi-energy images, identical to Method B, except that the materials are limited at each location to only those present in its class. These four methods are applied and evaluated on measured data from a prototype multi-energy CT system.
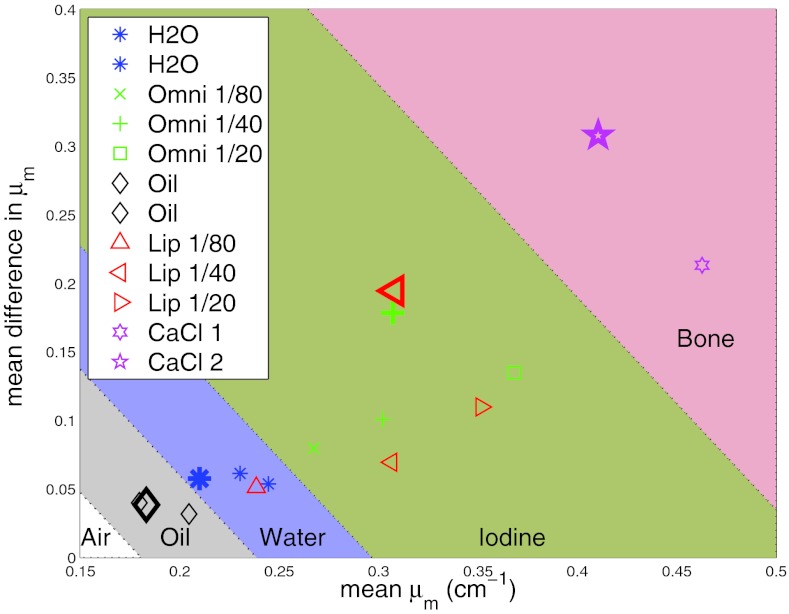
Several methods could be used to perform the initial classification of each region in the images. In this work, we propose a simple automatic classifier based on the differences in measured linear attenuation coefficients at each energy band as presented in Fig. 1. For each voxel, the mean difference in attenuation between all energy bands, as defined by
is plotted versus the weighted mean of the linear attenuation defined by . This is a simple method to reduce multidimensional data, in our case 5D data, into a two-dimensional space. This new 2D space attempts to delineate materials based on unique change in μ and the absolute value of μ at different energies. In this space, as Fig. 1 demonstrates, materials are unique in both dimensions and can be easily categorized into bands with negative slopes. Based on this classification scheme, each voxel in the image was segmented into one of four classes: air, adipose+water, adipose+water+iodine, or calcium+water. Specifically, voxels which mapped to the oil or water region were classified as “Adipose+Water”, iodine region as “Adipose+Water+Iodine”, and bone region as “Calcium+Water.” These material classes were chosen based on our desired application to carotid plaques; Alternate classes could be used for other applications.
Figure 1.
Proposed simple difference classifier shown with measured linear attenuation coefficients from oil phantom. The mean of the relative difference in μ between all energy bins is plotted versus the mean of the μ. Materials lie within bands with negative slopes. The values from the 12 regions of the measured oil phantom are plotted in small markers. The values from theoretical μ for materials with same average concentration of components are plotted in large markers.
Description of CT system
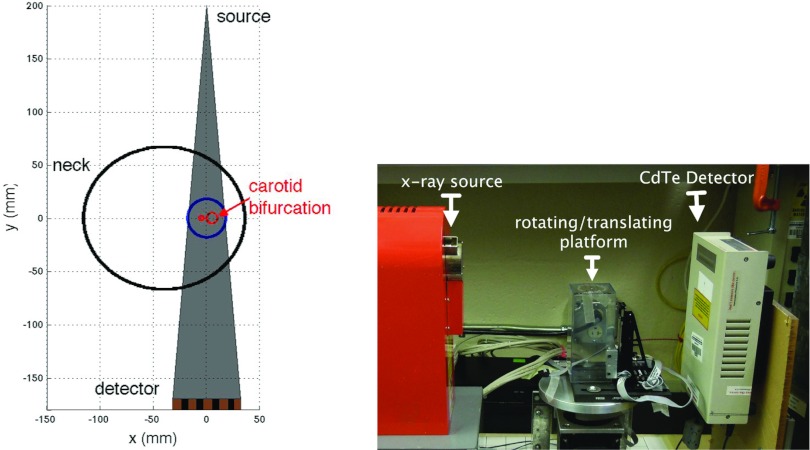
We built a prototype photon-counting CT system for the interrogation of single carotid arteries. The geometry of the system and prototype device are presented in Fig. 2. The prototype system uses a CdTe detector (C10413, Hamamatsu Photonics, Hamamatsu City, Japan) with a 64 mm linear array of 64 pixels of 0.8 mm width (0.5 mm depth, 1 mm height) with pitch of 1 mm.16 The detector electronics support simultaneous acquisition of five energy thresholds. The microfocus x-ray source (L8121-03, Hamamatsu Photonics) was operated at 120 kVp with a 20 μm focal spot. The central platform rotates and translates (1 mm steps) to support step-and-shoot acquisition of multiple slices.
Figure 2.
Diagram and photograph of prototype carotid CT system.
Acquisitions
All objects in this study were scanned with 120 kVp and 7 μA in a tomographic mode with 64 radial bins and 160 azimuthal angles per 360°. The low tube current was selected to minimize the effects of pulse-pileup, deadtime, and energy response distortion.2 The ability to scan with low current and thus reduced radiation dose is one of the potential benefits of carotid-specific imaging. Counts of x-rays above five energy thresholds were subtracted to acquire the energy windows: 30–45, 45–60, 60–80, 80–100, and >100 keV. All images were reconstructed with a fan-beam FBP method with the ramp filter.
Iodine phantom
A phantom with four vials (12 mm diameter each) containing water, 1/80, 1/40, 1/20 dilutions of intravenous iodine contrast agent (Omnipaque®, GE Healthcare) was scanned to assess the quantitative accuracy of each energy window.
Oil phantom
For the evaluation of quantitative estimates of material composition, we imaged a phantom containing 12 cylindrical plastic vials (3.3 mm outer, 2.1 mm inner diameter each) with 10 different solutions. The solutions were: three increasing dilutions of iodine based contrast in saline [(1/80, 1/40, 1/20) of Omnipaque contrast agent, leading to iodine concentrations of (0.018, 0.035, 0.070) g/cc]; three dilutions of iodine based contrast in poppyseed oil [(1/80, 1/40, 1/20) of Lipiodol®, Guerbet leading to iodine concentrations of (0.016, 0.032, 0.064) g/cc]; two water vials ; two poppyseed oil-only vials; and two different CaCl2 (with Calcium concentrations of 0.26 and 0.51 g/cc) solutions. The phantom is summarized in Table 1.
Table 1.
Total density of each region in oil phantom.
| Region | Density (g/cc) |
|---|---|
| Water | 1.000 |
| Omnipaque: 1/80, 1/40, 1/20 | 1.005, 1.010, 1.020 |
| Oil | 0.925 |
| Lipiodol: 1/80, 1/40, 1/20 | 0.929, 0.934, 0.943 |
| CaCl2 | 1.117, 1.234 |
Carotid plaque specimens
Two plaque specimens obtained from carotid endarterectomy surgery were scanned to determine the ability to provide tissue discrimination. Each slice was acquired for 35 s; multiple slices were acquired with 1 mm spacing (total acquisition time was 27 min).
RESULTS
Iodine phantom
The theoretical linear attenuation coefficient for the different energy bands for each dilution was calculated and compared with the measured linear attenuation coefficient from the prototype system (sample images shown in Fig. 3). The bias (100%*(measured-theoretical)/theoretical) is presented in Table 2. On average, the absolute bias is less than 10%, suggesting that the energy response is fairly accurate, particularly for the middle energy windows.
Figure 3.
Transaxial reconstructed images of linear attenuation (1/cm) of the iodine phantom at four of the five energy windows.
Table 2.
Average percent bias in measurements of linear attenuation compared to theoretical linear attenuation in iodine phantom.
| Window | 1/80 | Average | ||
|---|---|---|---|---|
| (keV) | Contrast | 1/40 | 1/20 | absolute bias |
| 30–45 | −16 ± 0.88 | −22 ± 0.77 | −30 ± 0.73 | 23 ± 5.8 |
| 45–60 | −4.7 ± 0.8 | −5.2 ± 0.7 | −4.5 ± 0.81 | 4.8 ± 2.4 |
| 60–80 | −3 ± 1.3 | −0.26 ± 1.1 | −1.8 ± 1 | 3.9 ± 5 |
| 80–100 | −0.51 ± 1.8 | 3.1 ± 1.3 | 5.1 ± 1.6 | 6.6 ± 8.3 |
| >100 | 2.8 ± 2.5 | 14 ± 2.4 | 14 ± 2.4 | 14 ± 14 |
Separation of materials
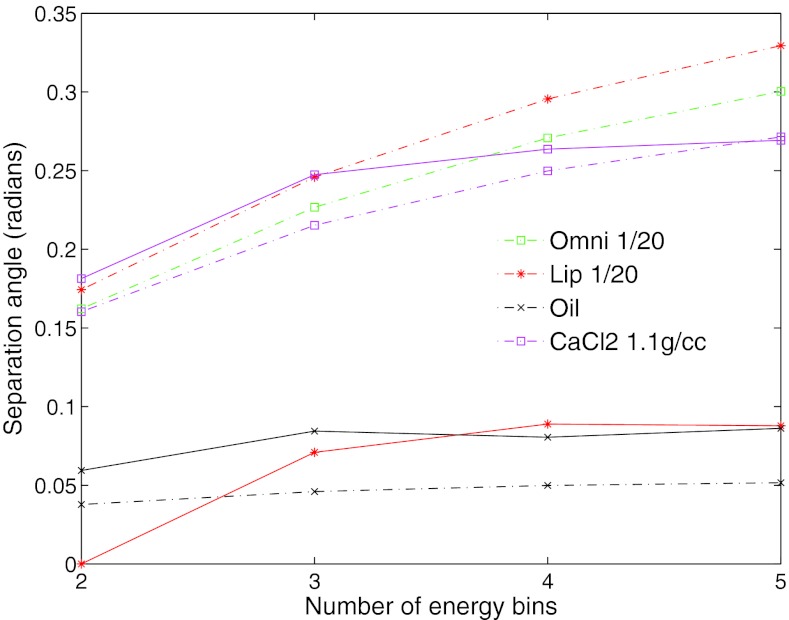
The angle of separation between water and each region in the iodine phantom are presented in Fig. 4. This plot contains the theoretical and measured separation angle based on the five energy bands used during acquisition and the assumption of a non-overlapping energy response. Of particular importance, is that water and oil can be separated both in theory and with the measurements. As anticipated, the iodine based regions of Omnipaque and Lipiodol result in theoretical attenuation vectors that are very unique from water (angle of separation >0.1 rad). However, the separation using linear attenuation coefficients derived from the measured images was not as large as anticipated. For the Lipiodol region, this is can be explained partially by the fact that these vials are at the edge of the imaging field of view and contain erroneous values from truncation errors. The dependence of separability on the number of energy bins is presented in Fig. 5. This plot demonstrates that as information from the higher energy bands is removed from the vectors the separability decreases slightly. Analysis such as this could be used for the selection of optimal energy bands for the discrimination of particular materials.
Figure 4.

Separation angle between water basis material and each solution in the iodine phantom. The measured separation angle is plotted in blue and the theoretical separation angle, based on theoretical mass attenuation coefficients for approximate spectra, is plotted in red. The solutions include water+Omnipaque (IV contrast) and oil+Lipiodol (oil-based contrast) in different dilutions. Two concentrations of CaCl2 are included.
Figure 5.
Separation angle between water basis material and four materials versus the number of energy bins. As the number of energy bins decreases, the separability between the materials decreases. The measured separation is plotted in solid lines, the theoretical separation is plotted in dashed lines.
Decomposition
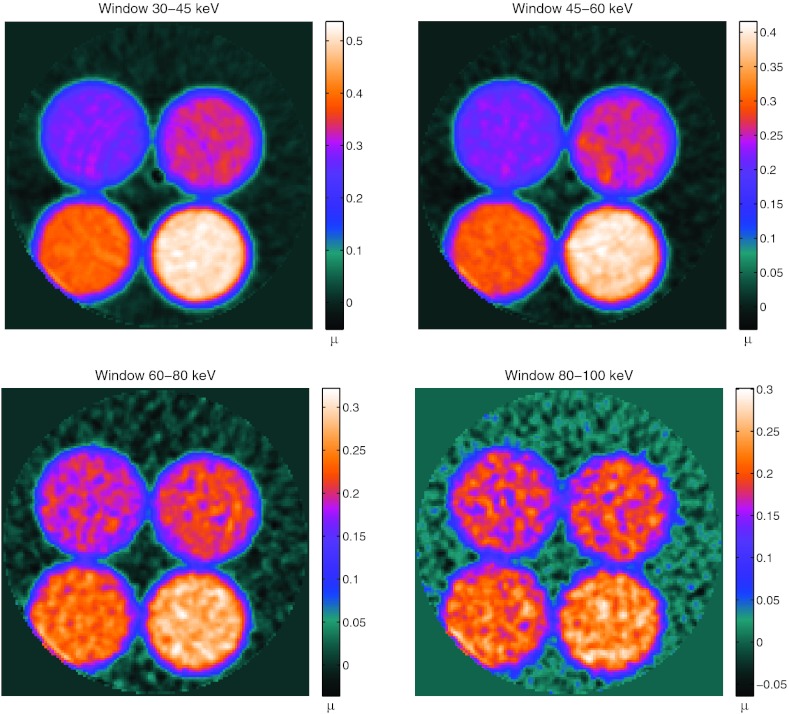
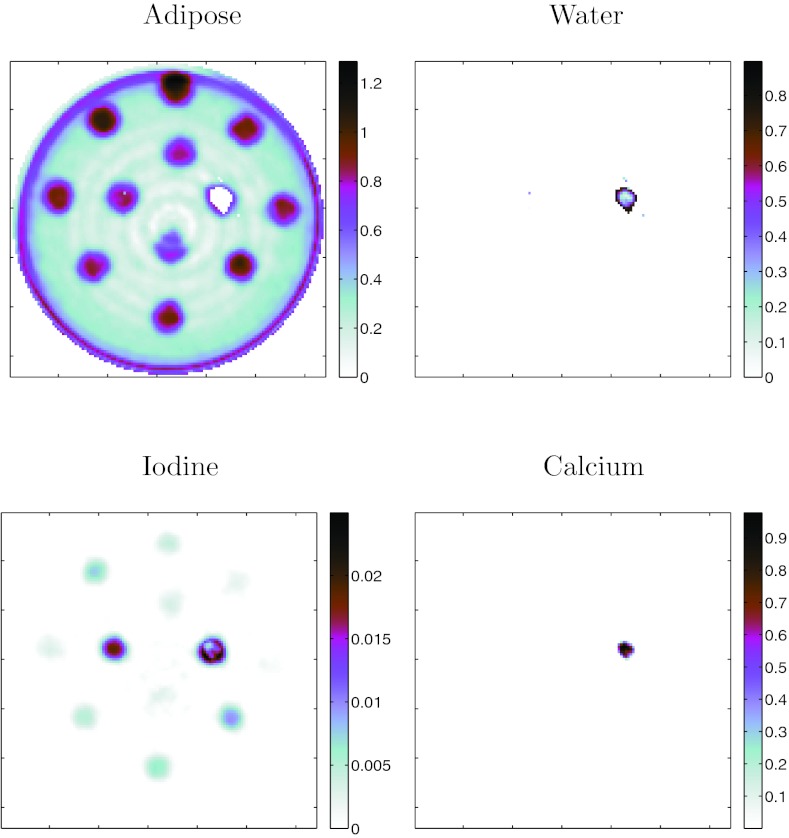
The measured multi-energy images of the oil phantom are presented in Fig. 6. These images are quantitative maps of linear attenuation coefficients at each energy level and the mean bias compared to theoretical across all materials and energies is 3% ± 4%. Table 3 presents a summary of the absolute error in material concentration estimation for each decomposition method measured with 1 mm2 circular regions of interest centered on each feature. Representative material images from Method A: Basis are shown in Fig. 7; This method (and Method B, not shown) fails to recover estimates of material concentration particularly for the adipose and water materials providing motivation for the development of the classification-type methods C and D. The quantitation in the class-based material maps outperformed the non-class methods, as listed in Table 3.
Figure 6.

Transaxial slices of oil phantom study at each energy level showing quantitative maps of linear attenuation coefficients in units of 1/cm.
Table 3.
Average absolute error in concentration measurements in each region of oil phantom.
| Region |
|||||
|---|---|---|---|---|---|
| Method | Water (g/cc) | Oil (g/cc) | Iodine (g/cc) | CaCl (g/cc) | Total (g/cc) |
| A: Basis | 0.46 ± 0.50 | 0.04 ± 0.09 | 0.26 ± 0.41 | 0.33 ± 0.35 | 0.27 ± 0.48 |
| B: Material | 0.28 ± 0.31 | 0.02 ± 0.05 | 0.31 ± 0.44 | 0.26 ± 0.29 | 0.25 ± 0.44 |
| C: Basis+Class | 0.03 ± 0.05 | 0.09 ± 0.17 | 0.20 ± 0.26 | 0.32 ± 0.36 | 0.17 ± 0.31 |
| D: Material+Class | 0.06 ± 0.09 | 0.08 ± 0.14 | 0.18 ± 0.25 | 0.32 ± 0.35 | 0.17 ± 0.30 |
Figure 7.
Method A: Basis decomposition of oil phantom. Material images are quantitative estimates of material concentration in units of g/ml. This method fails for all materials especially water and adipose.
Images from Method D: Class+Material are presented in Fig. 8. As demonstrated in Table 3, Method C: Class+Basis performed equally well as Method D. To save space, images from only one of these are presented. The class image in this figure demonstrates that the simple difference classifier (Fig. 1) was able to classify the materials accurately for all regions inside the vials, except for one vial containing Lipiodol (at 2 o'clock in the phantom). This failure for the Lipiodol region could be due to the truncation artifacts in the image since this vial is close to the edge of the field of view. There are also classification and quantitation errors at the boundary of the vials partially due to: (a) the plastic wall of the vials (vial wall was 0.6 mm thick, representing 60% of the area of each feature) and (b) partial volume errors due to the limited resolution of the system. The water material was correctly represented in all vials except the Lipiodol vials. Of particular note is that the oil-only vials were accurately discriminated and quantified (within the limits of the system resolution) compared with the water-only vials.
Figure 8.

Method D: Class+Material decomposition of oil phantom. Classification image on left derived from proposed difference classifier. Material images are quantitative estimates of material concentration in units of g/cc.
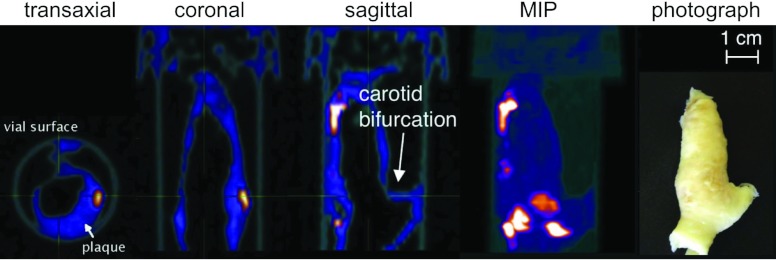
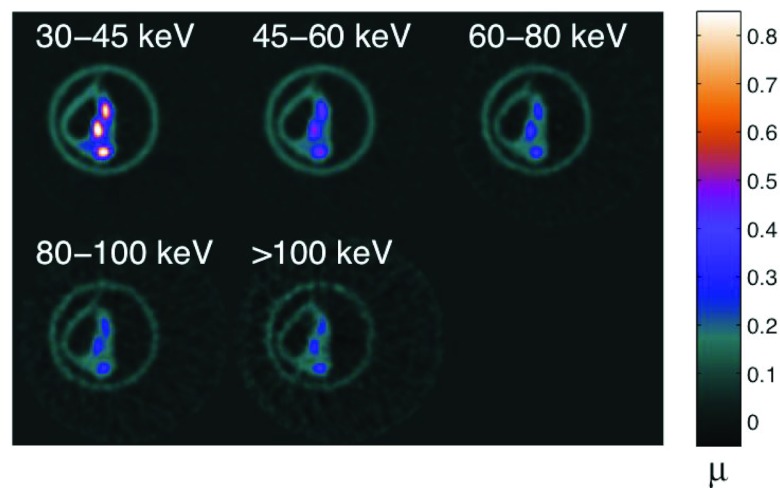
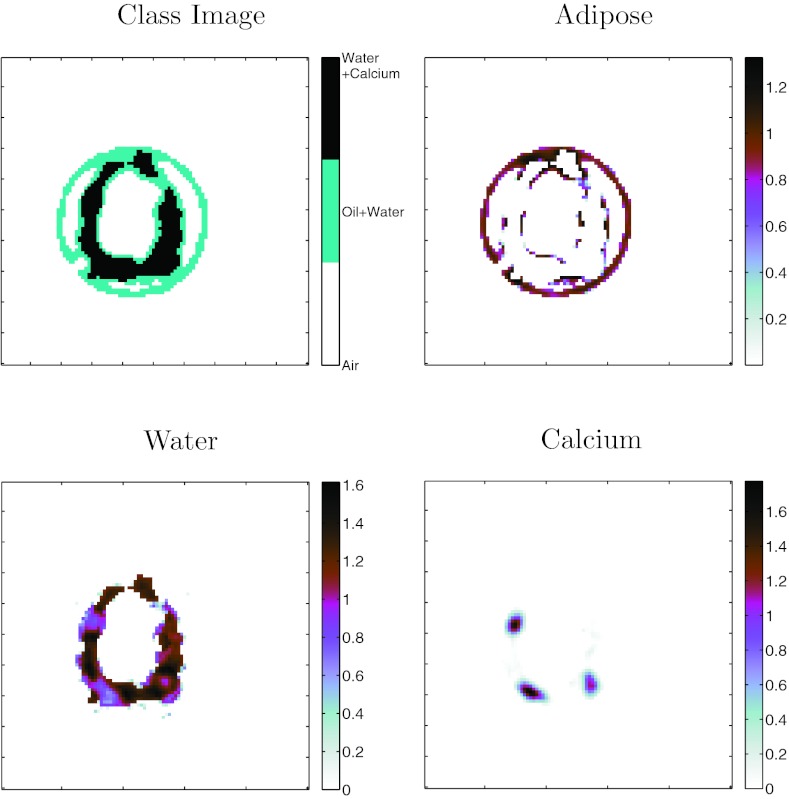
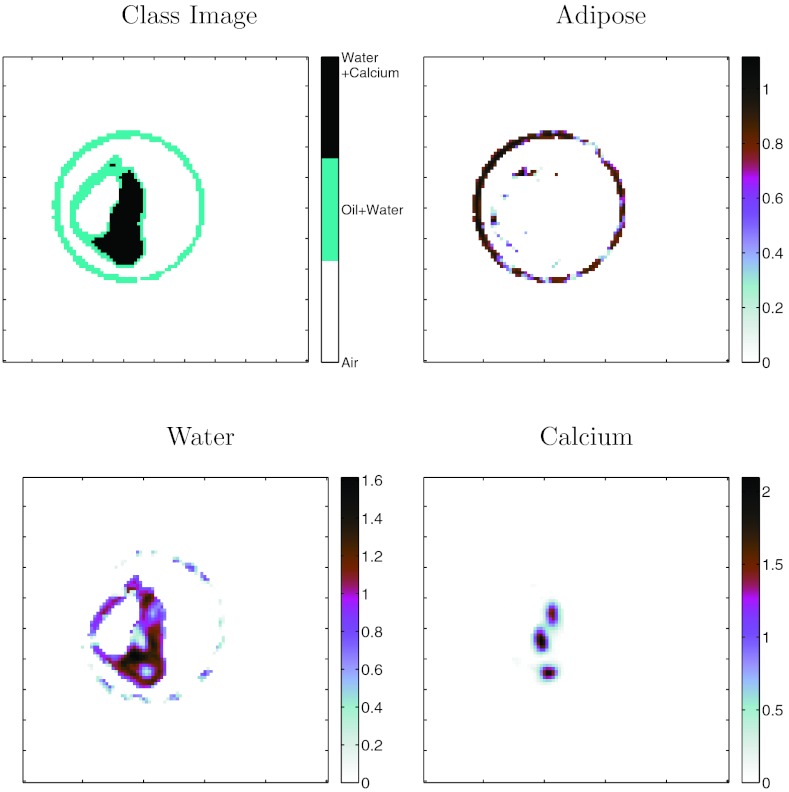
Images from the plaque specimens are presented in Figs. 910. Considering Class+Basis and Class+Material methods provided basically identical results, we applied one of these methods (Method D: Class+Material) to the multi-energy images of the specimens to generate the classified and decomposed image in Figs. 1112. We did not have a concentration reference standard for the plaque specimens. We can see that calcium-rich regions (as seen in the hyper-attenuated attenuation maps) were classified as calcium and assigned material concentrations with reasonable values (0.8–1.2 g/cc). The method quantified some adipose components in the vessel wall. Further evaluation with complete specimen histology is required to quantify the accuracy of this approach. At present, the results demonstrate some discrimination of adipose, water, and calcium.
Figure 9.
Multiple views of volumetric reconstruction of carotid plaque specimen A from the 30 to 45keV energy window. Photograph (right) presented in same orientation as sagittal view.
Figure 10.
Transaxial view of plaque specimen B at five energy levels acquired simultaneously on prototype system.
Figure 11.
Method D:Class+Material decomposition of plaque specimen A. Classification image on left derived from proposed difference classifier. Material images are quantitative estimates of material concentration in units of g/ml.
Figure 12.
Method D:Class+Material decomposition of plaque specimen B. Classification image on left derived from proposed difference classifier. Material images are quantitative estimates of material concentration in units of g/ml.
DISCUSSION AND CONCLUSION
We presented methodology for image-based decomposition of multi-energy CT data into maps of material concentrations. We proposed a decomposition method based on first classifying each voxel into a limited set of material functions and then concentration estimation based on weighted least-squares optimization. We compared these class-based methods to direct multibasis and material decomposition. These methods were applied to preliminary data measured on a prototype multi-energy CT system to demonstrate proof-of-principle and compare with previously proposed methods. We demonstrated with measured data that oil and water can be separated with our five energy band system.
In the initial application of these methods to material phantoms, the proposed quantification methods were partially successful. Compared to direct decomposition, the class-based methods provided superior performance leading to quantitative estimates of concentration with absolute errors less than 17%. The oil-only regions (in the absence of iodine) were separated from water and quantified. The regions of the phantom containing both iodine + oil (Lipiodol) were not distinguished from iodine + water regions. However, the Lipiodol solutions were at the edge of the imaging FOV where data truncation caused artifacts, thus restricting our ability to fully evaluate this material component with the acquired data. The phantom experiments were limited in that they did not evaluate an object that contains both oil and water to determine if these two components can be accurately quantified in the presence of the other. The separation angle analysis, as presented in Fig. 4, suggests that oil and water have unique information, but further work is required to demonstrate efficacy of the proposed quantification methods for these objects. We imaged two carotid endarterectomy specimens and showed the ability to resolve regions of adipose tissue (oil/fat), water, and calcium, although further work is needed to compare these images with histology.
As discussed in the methods, the proposed approach is similar to prior work from Le and Molloi.15 They proposed first segmenting the object into single materials and then performing quantification. Their work forces each location in the image to be only one material. For our application of imaging small features in plaques, each location in the object is usually a combination of constituent materials. Our method, which allows for 2–3 materials at each location, allows for a better representation and quantitation of these constituent components.
There are several potential improvements to our work. This method would benefit from extension to a more desirable application in the projection domain or during image reconstruction.17, 18 Image-based decomposition is less desirable because accurate linear attenuation coefficient maps are difficult to generate with polyenergetic beams due to beam hardening. In our case, we used fairly narrow spectral bands and small phantoms, so beam-hardening was arguably less of a detriment. It should be stressed that narrow energy windows often come at the expense of decreased count statistics per window leading to increased noise and decreased precision. Future extensions to the projection domain (pre-reconstruction) could perform an initial classification in the image-domain and these classes could be forward projected into the projection domain for limited material decomposition, although this may be challenging considering the overlapping information content. In addition, we used coarse energy bands with a relatively high kVp. Soft-tissue discrimination would benefit from increased sampling of the low-energy response of the object where there is more distinction between materials. Finally, this work would benefit from employing distortion correction methods to reduce artifacts19 and noise-reduction strategies20 specifically designed for photon-counting systems.
ACKNOWLEDGMENTS
This work is supported by the National Heart, Lung, And Blood Institute of the National Institutes of Health under Grant Nos. K25HL086713 and R01HL109327. The content is solely the responsibility of the authors and does not necessarily represent the official views of the National Institutes of Health. The Authors are grateful to Roshan Patel and Hamamatsu Photonics for the x-ray source and detector components. We thank Chun Yuan, Marina Ferguson, and Thomas Hatsukami for access to carotid endarterectomy samples and Jeffrey Fessler for access to simulated x-ray spectra.
References
- Schlomka J. P., Roessl E., Dorscheid R., Dill S., Martens G., Istel T., Baumer C., Herrmann C., Steadman R., Zeitler G., Livne A., and Proksa R., “Experimental feasibility of multi-energy photon-counting k-edge imaging in pre-clinical computed tomography,” Phys. Med. Biol. 53, 4031–4047 (2008). 10.1088/0031-9155/53/15/002 [DOI] [PubMed] [Google Scholar]
- Taguchi K., Zhang M., Frey E. C., Wang X., Iwanczyk J. S., Nygard E., Hartsough N. E., Tsui B. M. W., and Barber W. C., “Modeling the performance of a photon counting x-ray detector for CT: Energy response and pulse pileup effects,” Med. Phys. 38, 1089–1102 (2011). 10.1118/1.3539602 [DOI] [PMC free article] [PubMed] [Google Scholar]
- Le H. Q. and Molloi S., “Segmentation and quantification of materials with energy discriminating computed tomography: A phantom study,” Med. Phys. 38, 228–237 (2011). 10.1118/1.3525835 [DOI] [PMC free article] [PubMed] [Google Scholar]
- Falk E., Shah P. K., and Fuster V., “Coronary plaque disruption,” Circulation 92, 657–671 (1995). 10.1161/01.CIR.92.3.657 [DOI] [PubMed] [Google Scholar]
- Narula J., “Who gets the heart attack: Noninvasive imaging markers of plaque instability,” J. Nucl. Cardiol. 16, 860–868 (2009). 10.1007/s12350-009-9141-6 [DOI] [PubMed] [Google Scholar]
- Barreto M., Schoenhagen P., Nair A., Amatangelo S., Milite M., Obuchowski N. A., Lieber M. L., and Halliburton S. S., “Potential of dual-energy computed tomography to characterize atherosclerotic plaque: Ex vivo assessment of human coronary arteries in comparison to histology,” J. Cardiovasc. Comput. Tomogr. 2, 234–242 (2008). 10.1016/j.jcct.2008.05.146 [DOI] [PubMed] [Google Scholar]
- Bulte J. W., “Science to practice: Can CT be performed for multicolor molecular imaging?,” Radiology 256, 675–676 (2010). 10.1148/radiol.101127 [DOI] [PubMed] [Google Scholar]
- Feuerlein S., Roessl E., Proksa R., Martens G., Klass O., Jeltsch M., Rasche V., Brambs H. J., Hoffmann M. H., and Schlomka J. P., “Multi-energy photon-counting k-edge imaging: Potential for improved luminal depiction in vascular imaging,” Radiology 249, 1010–1016 (2008). 10.1148/radiol.2492080560 [DOI] [PubMed] [Google Scholar]
- Roessl E., Cormode D., Brendel B., Engel K. J., Martens G., Thran A., Fayad Z., and Proksa R., “Preclinical spectral computed tomography of gold nano-particles,” Nucl. Instrum. Methods Phys. Res. A 648(1), S259–S264 (2011). 10.1016/j.nima.2010.11.072 [DOI] [Google Scholar]
- Wang X., Meier D., Taguchi K., Wagenaar D. J., Patt B. E., and Frey E. C., “Material separation in x-ray CT with energy resolved photon-counting detectors,” Med. Phys. 38, 1534–1546 (2011). 10.1118/1.3553401 [DOI] [PMC free article] [PubMed] [Google Scholar]
- Seltzer S. M., “Calculation of photon mass energy-transfer and mass energy-absorption coefficients,” Radiat. Res. 136, 147–170 (1993). 10.2307/3578607 [DOI] [PubMed] [Google Scholar]
- Wilderman S. J., Hames S. M., Flynn M. J., and Martin W. R., “Monte Carlo calculation of x-ray spectra emitted by various anode materials at low voltages,” IEEE Nucl. Sci. Symp. Med. Imaging Conf. 4, 1537–1541 (1994). [Google Scholar]
- Alvarez R. E. and Macovski A., “Energy-selective reconstructions in x-ray computerized tomography,” Phys. Med. Biol. 21, 733–744 (1976). 10.1088/0031-9155/21/5/002 [DOI] [PubMed] [Google Scholar]
- Roessl E. and Proksa R., “K-edge imaging in x-ray computed tomography using multibin photon counting detectors,” Phys. Med. Biol. 52, 4679–4696 (2007). 10.1088/0031-9155/52/15/020 [DOI] [PubMed] [Google Scholar]
- Le H. Q. and Molloi S., “Least squares parameter estimation methods for material decomposition with energy discriminating detectors,” Med. Phys. 38, 245–255 (2011). 10.1118/1.3525840 [DOI] [PMC free article] [PubMed] [Google Scholar]
- Tomita Y., Shirayanagi Y., Matsui S., Misawa M., Takahashi H., Aoki T., and Hatanaka Y., “X-ray color scanner with multiple energy differentiate capability,” IEEE Nucl. Sci. Symp. Conf. Rec. 6, 3733–3737 (2004). 10.1109/NSSMIC.2004.1466692 [DOI] [Google Scholar]
- Engler P. and Friedman W. D., “Review of dual-energy computed-tomography techniques,” Mater. Eval. 48, 623–629 (1990). [Google Scholar]
- Sukovic P. and Clinthorne N. H., “Penalized weighted least-squares image reconstruction for dual energy x-ray transmission tomography,” IEEE Trans. Med. Imaging 19, 1075–1081 (2000). 10.1109/42.896783 [DOI] [PubMed] [Google Scholar]
- Ding H. and Molloi S., “Image-based spectral distortion correction for photon-counting x-ray detectors,” Med. Phys. 39, 1864–1876 (2012). 10.1118/1.3693056 [DOI] [PMC free article] [PubMed] [Google Scholar]
- Leng S., Yu L., Wang J., Fletcher J. G., Mistretta C. A., and McCollough C. H., “Noise reduction in spectral CT: Reducing dose and breaking the trade-off between image noise and energy bin selection,” Med. Phys. 38, 4946–4957 (2011). 10.1118/1.3609097 [DOI] [PubMed] [Google Scholar]


