Abstract
Systems level approaches to analyzing complex emergent behavior require quantitative characterization of alterations of behavior on both the microscale and macroscale. Here we consider the problem of cellular organization and describe a statistical methodology for quantitative comparison of the internal organization between different populations of similar physical objects, such as cells. This comparison is achieved with several steps of analysis. Starting with three-dimensional or two-dimensional images of cells, images are segmented to identify individual cells. Locations of internal points of interest, such as organelles or proteins, are recorded. To define the configuration of internal points in each cell, the individual cells are subjected to bounded Voronoi tessellation: subdividing the bounded volume or area of the cell into subvolumes determined by the locations of the internal points of interest. A statistical methodology is applied to yield a metric for similarity in degree of organization between populations. We applied this methodology to test whether centrioles play a role in global cellular organization, using mutants of the green alga Chlamydomonas reinhardtii with known alterations in centriole number, structure, and position as a model system. Comparing mutant populations and wild-type populations revealed a dramatic difference in the degree of organization in the mutant strains. These computational and experimental results provide statistical support for prior observational studies and support the idea that centrioles play a role in generating or maintaining global cellular organization. Our results confirm that this method can be used to sensitively compare the extent and type of organization within cells.
Keywords: cell shape, image analysis, microscopy, cytoskeleton
A major outstanding problem in basic biology is how cells generate and regulate their 3D geometry on the molecular level (1). In addition to being an interesting fundamental science question, there are clinical implications involved. In development, differentiation of stem cells into distinct functional cell types is accompanied by characteristic changes in cellular organization (2). The disruption of cellular organization (dysplasia) is a major hallmark of cancer and the basis of cytopathology (3). The biochemistry canon presupposes cell organization is mechanistically generated from molecular networks and molecular self-assembly (4). Although entire genomes have been sequenced and genome-wide molecular-interaction maps exist for model organisms (5), it remains unclear which molecules regulate the intracellular organization or how they do it (1, 6, 7).
Traditionally, cell organization has been investigated visually by identifying mutants or perturbations that cause gross changes in cell appearance. However, such an approach will only identify the most dramatic phenotypes, and it is likely that many mutations may exist that play more subtle roles in cell organization and that are only distinguishable statistically by considering large numbers of cells. Furthermore, hundreds or thousands of genes may directly or indirectly affect the active organization of many subcellular structures. Thus, connecting the vast amount of molecular data with the complex phenomena of cell organization requires a rapid, statistically robust, and scalable approach to discriminating between different types and levels of organization (7, 8). Further, many structures within cells are thought to arise through self-organization, but detecting self-organization first requires the ability to quantify organization so that we can ask if it is increasing during a given process. Here, we describe a general method for quantifying the degree of organization in cells.
Cell Organization
Cell organization is defined as the characteristic positioning of organelles within the cell body (6). Historically, cell organization has been approached qualitatively from two different directions: cell polarization (6) and cell patterning (7). Polarization generally refers to asymmetries generated between two different sides of a cell; for example, the presence of cilia and microvilli on the apical surface of epithelial cells in a monolayer. On the other hand, cell patterning concerns the localization of organelles to specific subcellular locations. Although both of these concepts about organization have revealed processes that are responsible for intracellular organization, they are products of a mostly qualitative framework for understanding organization and do not allow us to compare the relative degree of organization between cell types. A framework that allows us to compare the relative degree of organization between cell types is critical for asking questions, such as whether or not a particular mutation, or alterations in a particular organelle, leads to more or less order in the cell, with a reduction in order corresponding to the cytopathology concept of dysplasia. As more and more genetic studies identify mutations that appear to affect cell geometry (e.g., refs. 8, 9), we will want to know how broadly each affects cell organization; hence, there will be an increasing need for methods to quantify the effects that any particular mutation may have on the level of organization. Although a small number of quantitative studies have been conducted within both of these conceptual spaces (8, 10), the use of cell-specific polarity markers to determine orientation and organization have made these studies nongeneral by their very nature.
Measuring Organization
Current methods for analyzing organization in cell biology typically assume some frame of reference, the direction of cell migration for example, or a landmark, such as the nucleus, and analyze the position of a particular cellular structure relative to that landmark or reference frame. Such ad hoc approaches for testing organization are highly cell type-specific and hard to generalize, such that a new landmark or reference frame needs to be found for any structure one wishes to analyze. One approach to circumvent this problem is to impose a user-specified reference frame onto the cell by growing it on a micropatterned substrate (11), but this approach requires customized patterns for different cell types and is only applicable to cells that can grow on such surfaces. An alternative approach would be to develop a metric for organization that is independent of any existing landmarks. Condensed matter physics has long addressed physical order in bulk by defining order parameters, such as the magnetization vector to measure degree of organization. In several fields, organization is approached in a mathematical and systematic way as a generalization of the concept of entropy (disorder) from statistical thermodynamics (12). For example, in the fields of computer science, cryptography, and even genetics, it is possible to construct a metric of how organized a sequence of symbols is (13, 14).
We are specifically concerned with the order and disorder in the packing of cellular components within the interior of the cell. Techniques of information theory have been applied to the hard-sphere packing problem (13). The hard-sphere packing problem is concerned with understanding the configurations a set of spheres can be packed into. A series of recent papers have explored how to measure the relative organization of configurations of distributions of spheres (15–17). The methods used to measure the packing of hard spheres are fundamentally based on the conceptual framework of Edwards entropy (18). Subsequent work on the hard-sphere packing problem showed that the local volume in Edwards entropy can be taken as equivalent to the volumes defined by the Voronoi tessellation of the spheres (15).
Voronoi tessellation is the subdivision of space on the basis of the location of a set of points (17). A Voronoi tessellation is assembled in three dimensions by intersecting planes normal to, and through the midpoint of, line segments defined between local points via Delaunay triangulation (15). These planes intersect with one another to create closed Voronoi volumes for surrounded points, or infinite Voronoi volumes for boundary points. If the points are contained within the boundaries of a closed cell, the Voronoi tessellation can simply be bounded at the surface of the cell, leaving no infinite volumes. This has the effect of subdividing the volume of the cell on the basis of how evenly spaced the points are within the volume. Applying these statistical and geometric approaches to cell organization is a logical step toward a general “order” parameter: a parameter quantitatively measuring the level of organization in cells.
Role of Centrioles in Cell Organization
For illustrative purposes, the experimental work described below will focus on centrioles as one cellular structure involved in generating cell organization. Centrioles are cylindrical arrays of nine microtubule triplets that form the core of the centrosome, the primary microtubule nucleating center in most eukaryotic cells (19). The position of centrioles and centrosomes is cell type-specific, being located in the center of many cells but at polarized positions in other cell types (20). Because the position of the centrioles and centrosomes determines the polarity of the microtubule-based cytoskeleton, and because other cellular structures are, in turn, organized by the microtubules (21–23), one can speculate that the centriole positioning system plays a functional role in determining cellular organization. Experimental confirmation for this idea has come from genetic experiments in the unicellular green alga Chlamydomonas reinhardtii. In Chlamydomonas cells, a pair of centrioles is located at one pole of the cell and these centrioles organize a set of four microtubule rootlets that run from the anterior pole of the cell around the cell cortex. These rootlets are known to be important for localization of cellular structures, such as the eyespot (24). Using a combination of genetic screening and image analysis, we have previously identified mutants in which centrioles lose their consistent polarized location in Chlamydomonas (8, 25). These mutants seem to arise from defects in the connections between the centrioles (25), but the most obvious aspect of the phenotype is that centrioles are present in random numbers, between zero and six, rather than in normal cells, where the copy number is always two. In addition, the centrioles appear to have random locations on the cell cortex. In the course of our previous analysis of these mutants, we noted visually that overall cell geometry was abnormal; for example, in some cases, the chloroplast, which is normally confined to the posterior hemisphere of the cell, was seen to extend over a larger region of the cell volume. In this report, we analyze cellular organization in these mutant cells compared with WT as a test case for the efficacy of our method for quantifying organization.
Theory
Theoretical Framework for Measuring Cell Organization.
To begin to examine organization in a broad manner, an appropriate definition of organization must be used. In this case, we are interested in organization at the level of organelle positioning (i.e., how a set of organelles is placed in the body of a cell). In a randomly organized cell, any organelle is as likely to occupy any one spot in the cell as any other spot, and we therefore seek a definition of organization that quantifies deviation from this minimally organized state. An organized state can therefore be defined as a spatial bias to the placement of organelles within the body of the cell. Thus, when we talk about organization, what we want to understand fundamentally is how nonrandom a cell’s organization is. Statistically speaking, this is equivalent to determining a statistical distance between the distribution of a test statistic in our null model (a cell with a uniform random spatial distribution of organelles) and the distribution of that test statistic in a clonal population of actual cells. Extending this concept, differences in the degree of organization between WT and mutant cells could be measured with the statistical distance between the test statistic in each population.
To conduct a statistical analysis of intracellular organization with this conceptual framework, a relevant parameter, or test statistic, must be used to determine the organizational state of a cell. In this case, a logical parameter is how nonuniformly the organelles are distributed within the volume of a cell in the statistical limit (18). We propose that one useful mathematical implementation of such a parameter is the variance of the areas found by Voronoi tessellation of the locations of the organelles (Fig. 1).
Fig. 1.
Statistical method for quantifying cell organization. (A) Voronoi tessellation of a single cell is computed and used to calculate the variance of the Voronoi facets within the cell. (B) Monte Carlo simulation is used calculate the distribution of variances for the null model in a given cell. (C) P values for each cell in the null model are calculated using the variance of the real cells and the distribution of variances found by Monte Carlo simulation.
Using the assumption that the variability of the size of the organelles can be ignored in the statistical limit, we can approximate the organelles as points located at their centroid. Using 2D or 3D data describing the locations of organelles and the cell boundary, cells can be mathematically divided up into subareas (or volumes) with Voronoi tessellation. The variance of these areas (or volumes) within a single cell is
Unfortunately, this value changes dramatically with the size of the cell, making it an unlikely test statistic. However, the null model is a uniform random distribution in space; thus, it is scale-invariant. The P value (the probability of getting a value at least as extreme as the value obtained) of a given variance (and thus organelle configuration) in the null model is also scale-invariant and directly related to how extreme the organizational state is. This makes the P value of the variance of areas (or volumes in three dimensions) for a given organelle configuration a reasonable choice for a test statistic.
Measuring Organization and Statistical Distance Between Populations.
Empirical results indicate that the variances of Voronoi areas in the unbounded case are well described with a two-function gamma distribution (26–28):
 |
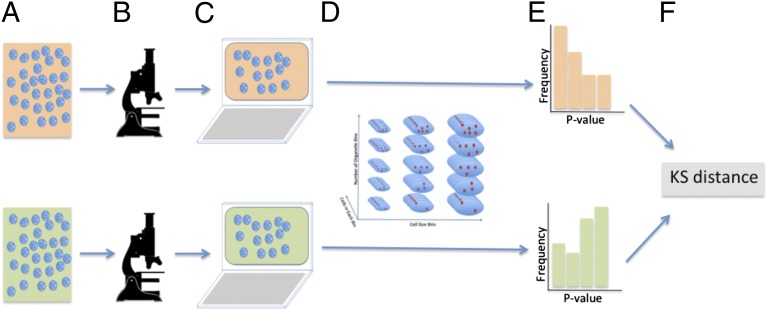
Extending this to the bounded case, the parameters of the gamma distribution for any given cell boundary and number of organelles can be found to arbitrary precision through Monte Carlo simulation and fitting the resulting distribution to a gamma distribution (Fig. S1). Given the subcellular locations of organelles and the location of the cell boundaries for a population of real cells, we can calculate the set of Voronoi areas for each real cell in a population (Fig. 1). Then, for this particular set of areas, we calculate the sample variance as a simple measure of nonuniformity (Fig. 1A). We then perform a Monte Carlo simulation of the distribution of variances within that particular cell under the assumption of spatially uniformly distributed points (Fig. 1B). We then can use the results of the Monte Carlo simulation to determine a P value for any particular observed variance in a given actual cell (Fig. 1C). Once the P value of the variance of each individual cell configuration is calculated for each cell in a population, the Kolmogorov–Smirnov (KS) two-sample test can be used to calculate a measure of the statistical distance between two populations of cells (Fig. 2). One complicating factor in this analysis is that cell size and shape affect the expected distribution of Voronoi cell variances under the null hypothesis. Sampling both populations such that the number of cells with a particular size or organelle number is equal in both samples allows for direct comparison between the populations (Fig. 2D and Table 1). The KS statistic is interpreted as a measurement of the difference in organizational distribution between these different populations. Because only a subset of values is sampled for each bin, resampling of the dataset 1,000 times allows a bootstrap mean and variance to be estimated. Further, examining the distance “spectra” of the value of the statistical distance vs. cell size and organelle number could provide insight into the type of organization observed. This approach can be directly applied to either 3D or 2D image data, with the only difference being whether Voronoi volumes or areas are used to calculate the variance in each cell.
Fig. 2.
Diagram of the methodology used to compare the organization between two populations of cells. (A) Each separate population of cells is fixed, stained, and placed on a slide. (B) Each separate slide is imaged using standard fluorescence microscopy at 20× magnification. (C) Software is used to segment each cell in each population. (D) Consensus binning scheme based on volume and organelle number is determined for the populations to be compared; an equal number of cells from each bin are randomly selected from each population. (E) P values of each the selected cells are calculated as is done in Fig. 1. (F) KG statistical distance between the P values of the populations is calculated. D, E, and F are iterated to bootstrap the variance and mean of the statistical distance.
Table 1.
Number of cells in each 2D area and organelle number bin for each cell type for the distance calculations in Figs. 6, 8, and 9
| Bin cell area | No. of organelles in bin | No. of cc124 cells in bin | No. of cc125 cells in bin | No. of asq2 cells in bin | No. of bld10 cells in bin |
| 0–500 px | 2 | 14 | 14 | 14 | 14 |
| 0–500 px | 3 | 7 | 7 | 7 | 7 |
| 0–500 px | 4 | 9 | 9 | 9 | 9 |
| 0–500 px | 5 | 1 | 1 | 1 | 1 |
| 0–500 px | 6 | 2 | 2 | 2 | 2 |
| 0–500 px | 7 | 0 | 0 | 0 | 0 |
| 0–500 px | 8 | 0 | 0 | 0 | 0 |
| 500–1,000 px | 2 | 38 | 38 | 38 | 38 |
| 500–1,000 px | 3 | 30 | 30 | 30 | 30 |
| 500–1,000 px | 4 | 22 | 22 | 22 | 22 |
| 500–1,000 px | 5 | 19 | 19 | 19 | 19 |
| 500–1,000 px | 6 | 15 | 15 | 15 | 15 |
| 500–1,000 px | 7 | 17 | 17 | 17 | 17 |
| 500–1,000 px | 8 | 2 | 2 | 2 | 2 |
| 1,000–1,500 px | 2 | 53 | 53 | 53 | 53 |
| 1,000–1,500 px | 3 | 50 | 50 | 50 | 50 |
| 1,000–1,500 px | 4 | 48 | 48 | 48 | 48 |
| 1,000–1,500 px | 5 | 29 | 29 | 29 | 29 |
| 1,000–1,500 px | 6 | 40 | 40 | 40 | 40 |
| 1,000–1,500 px | 7 | 39 | 39 | 39 | 39 |
| 1,000–1,500 px | 8 | 25 | 25 | 25 | 25 |
Note that each cell type has an equal contribution of cells as all others for each bin. px, total number of pixels occupied by cell area.
Results
Monte Carlo Simulation of Intracellular Organization.
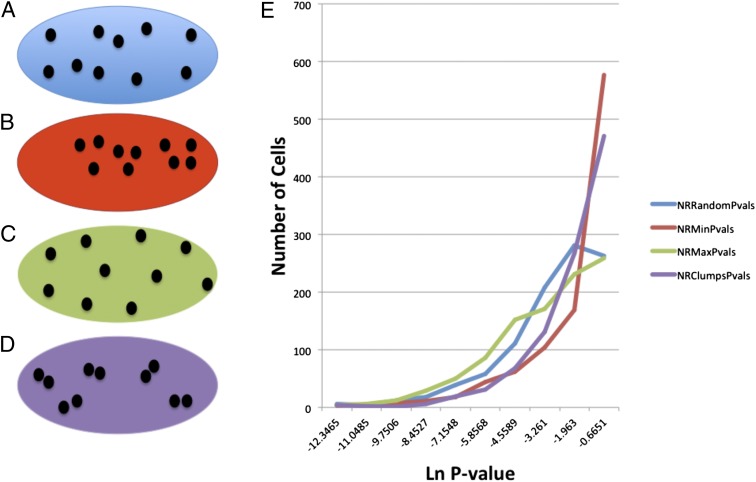
As discussed above, we are defining cell organization here as a nonrandom spatial bias to the placement of organelles within the body of a cell. To validate this strategy, we first simulated several possible modes of cellular organization (Fig. 3) to ask whether our method could distinguish them. First, we simulated the completely random case, where organelles are placed without any spatial bias (Fig. 3A). Following that, we created a spatial bias by making 1,000 random simulations and choosing the simulation that had the minimal average interorganelle distance to simulate organelle clustering (Fig. 3B). Then, we created a different spatial bias by making 1,000 random simulations and choosing the simulation that had the maximal average interorganelle distance to simulate active organelle dispersal (Fig. 3C). Finally, we created a different spatial bias by placing points in clusters of two points to simulate paired organelles (Fig. 3D). Simulations indicated that these different types of nonrandom organization achieved differently shaped curves, leading to nonzero KS distances (Fig. 3E).
Fig. 3.
Examples of different kinds of organization and the distribution of P values that each type of organization creates with repeated simulations in a single example cell. (A) Uniform distribution of points within the cell. The cell with the minimum interorganelle distance from among 1,000 random cells (B), the cell with the maximum interorganelle distance from among 1,000 random cells (C), and the cell in which points are placed in pairs, with the position of the pairs being uniformly distributed (D), are illustrated. (E) Frequency vs. Ln (P value) curves for each type of simulation. Ln, natural logarithm; NRClumpsPvals, distribution of cells placed in a nonrandom clumped pattern; NRMaxPvals, distribution of cells placed in a nonrandom distance maximized pattern; NRMinPVals, distribution of cells placed in a nonrandom distance minimized pattern; NRRandomPvals, distribution of cells placed in a random pattern.
Comparison of 2D and 3D Analysis.
The results illustrated in Fig. 3 were based on simulated 2D images. However, the variance of Voronoi compartments is defined for a set in n dimensions; hence, the basic metric that we use can be equally well applied to 3D or 2D images. However, given that this method is intended for use with high-throughput light microscopy of cells, the 3D analysis technique has several drawbacks in data collection and analysis. First, it is extremely difficult to get an accurate volume measurement of cells in three dimensions because the location of the top and bottom of the cell cannot be accurately determined experimentally due to poor axial resolution of the light microscope. The volume and size of each cell cannot be determined accurately; thus, they must be estimated in three dimensions, as well as in two dimensions, eliminating much of the advantage of collecting data in three dimensions. Second, from a high-throughput imaging perspective, 3D imaging of cells is much slower then 2D imaging, meaning that getting the images of hundreds of cells simultaneously would be much more time-consuming, making large-scale application of the method to large collections of mutants effectively impossible.
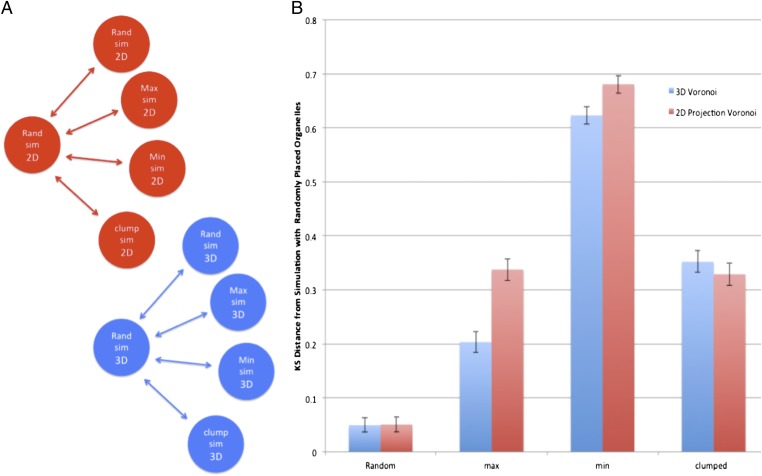
The drawbacks of collecting data in three dimensions can be eliminated by collecting 2D data, and we can still apply the variance of Voronoi compartment sizes to such images. As long as the orientation of cells within a population is random when they are imaged, the locations of the organelles in a 2D image can be regarded as a random 2D projection of the original distribution. Intuitively, that means that over large populations, two different populations of cells with different spatial distributions in three dimensions will be projected as two different spatial distributions in two dimensions. We verified the utility of 2D data in our method by simulating different organizational types in three dimensions and the projection of the simulated data in two dimensions (Fig. 4). Although the absolute distances between organizational types are not identical, the different organizational types are still differentiated and clustered appropriately in both the 2D and 3D cases. A screening assay based on this method would thus be expected to identify the same populations of cells whether 2D or 3D data were used.
Fig. 4.
Simulated results demonstrate applicability of the method in both two and three dimensions. (A) Network diagram of the distance measurements in B. (B) Comparison of distances obtained using different organizational parameters of cells with full 3D simulations and those obtained using the 2D projections of the same 3D data. max, maximum; min, minimum; rand, random; sim, simulation.
It is important to note that imaging organelles in two dimensions introduces the possibility of missing organelles hidden behind other organelles; thus, the total number of organelles can be miscounted. However, these types of misclassifications are equally likely in all populations; thus, the effect should not have an impact on our ability to recognize a population with an altered degree of order.
Demonstration of Method Using Mutant Cells.
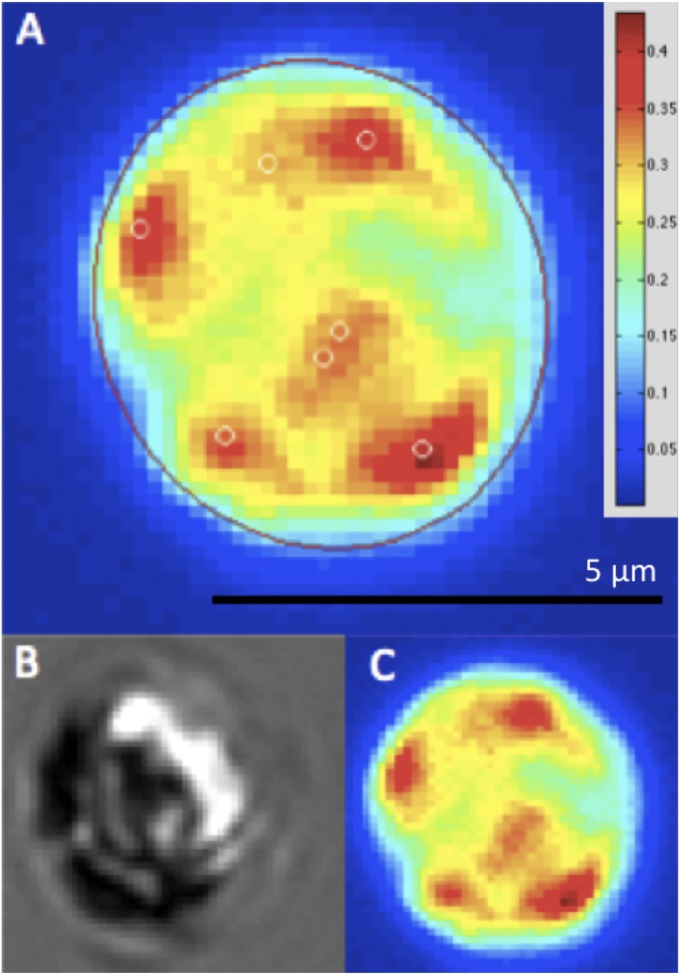
To test whether the above measure of difference in degree of organization can discriminate cell types with biologically significant organization, we performed statistical analysis on the organization of chloroplast and mitochondrial nucleoids in C. reinhardtii (Fig. 5). Chlamydomonas is a unicellular green alga whose cells have a highly stereotyped polarized morphology with characteristic positioning of organelles. In a typical Chlamydomonas cell, the pair of centrioles is docked at the cell surface at one end (referred to as the anterior end of the cell) and the chloroplast consists of a single large cup-shaped structure filling up the posterior half of the cell (29). The chloroplast nucleoids are being used as a proxy for the distribution of the chloroplast itself throughout the cell interior. We applied our analysis to four Chlamydomonas strains: two WT strains (cc124 and cc125), which are of opposite mating types and have slight differences in cell size but are otherwise thought to be virtually identical in terms of cellular structure; asq2 mutants (8), which are defective in the protein Tbccd1 (30), in which the mother-daughter centriole linkage is abrogated, daughter centrioles move to random positions on the cell cortex, and the total number of centrioles is variable from cell to cell; and bld10 mutants (31), which are defective in the protein Cep135/Bld10p that localizes in the cartwheel of the centriole (32), in which centrioles are reduced to small precursors lacking defined microtubule blades and move to a more central position in the cell, near to the cell nucleus away from the cell surface (8). Visual observations of the two mutants strains have revealed that cellular structures other than centrioles are misplaced in these mutants (8), making them likely candidates for mutations that might decrease the level of organization, although this was not possible to determine without a quantitative measure of organization. We therefore asked whether our measure of organization would show a significant increase in disorder in these mutant strains compared with the two WT strains, whose degrees of order we expected to be roughly similar.
Fig. 5.
Cell imaging and segmentation. (A) Automatically segmented C. reinhardtii cell. The cell boundary is indicated in red, and the locations of the organelles, DNA-micronucleoids in this case, are indicated with white circles. (B) Transmitted light micrograph of the same cell. (C) Florescence in the DAPI channel, indicating the presence of DNA, in the same cell.
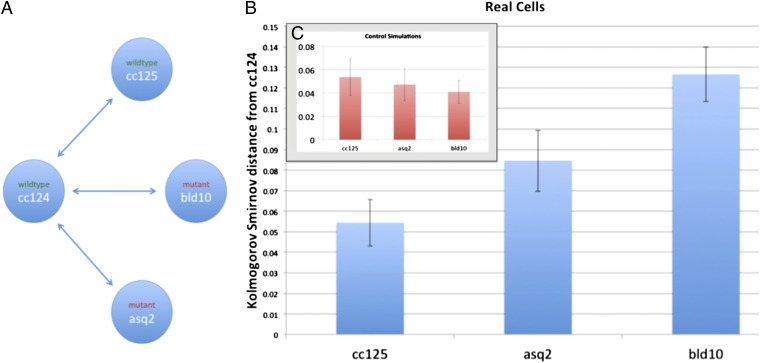
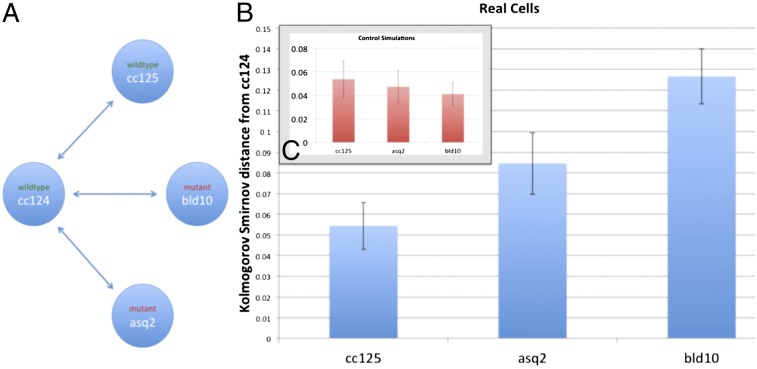
The KS distance tests, based on the distributions of P values for deviation in variance of Voronoi tessellation areas, did, in fact, find significant differences between WT populations and known mutants (Fig. 6). The difference between either mutant and the WT cells was significantly larger than the difference between the two WT strains.
Fig. 6.
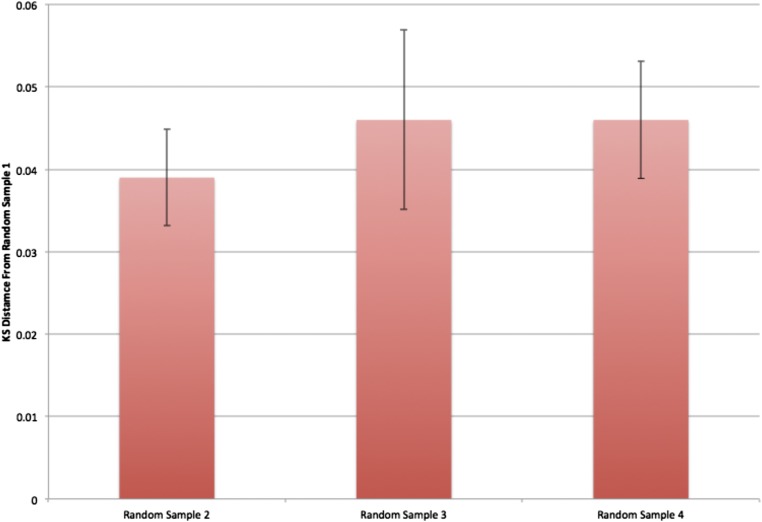
Analysis of organization in mutants with defects in centrioles. (A) Network diagram illustrates the comparisons shown in B and C. (B) KS statistical distance from populations of cc125 (WT), asq2 (mutant), and bld10 (mutant) cells to a population of cc124 cells (in blue). Identically sized samples were taken from several size and area bins for each cell line. (C) Same statistical distance measure is applied to simulated versions of the same four strains with randomly placed organelles. These simulated cells had the same parameters as the WT cells, but the locations of their organelles were drawn from a uniform random distribution within an ellipsoid. This result indicates that the real distance between the two WT populations, cc125 and cc124, is indistinguishable from that of statistically identical populations in the same cells. In contrast, it appears that both mutants, asq2 and bld10, are significantly distant from WT cc124, indicating a different underlying organizational distribution.
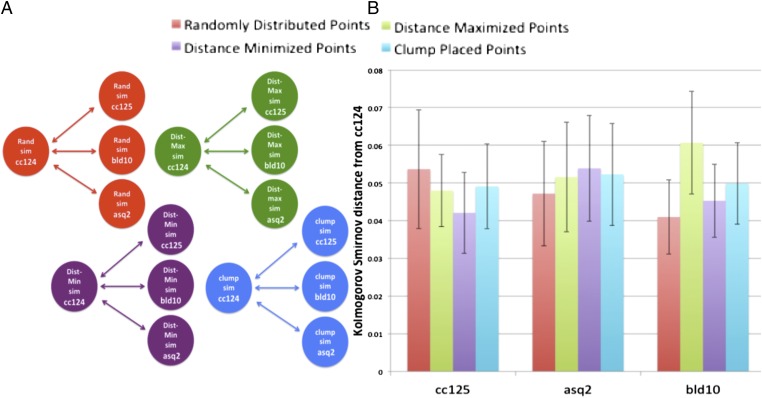
One of the major challenges to the development of an order parameter approach for cells is that every cell in a population is unique; for example, mutants can have different cell shapes than WT cells. Because our method employs actual measurements of cell shapes as the starting point for Monte Carlo simulations, we expect it to be less sensitive to such effects than would be a method based on assumptions regarding identical cell shapes. To rule out the possibility that systematic differences in cell shape or organelle number between mutant and WT cells might be responsible for the apparent difference in organization, we conducted Monte Carlo simulations using WT and mutant cells to provide the bounding volume shape, size, and number of organelles, but with organelles randomly placed according to the null model (Fig. 7), and compared the results for these null model simulations for mutants vs. WT cells with each other (Fig. 8). We also used the same observed cell shapes and organelle numbers to repeat simulations using three different models for organizational bias (as had been done previously for purely theoretical shapes in Fig. 3). We found that regardless of the organizational bias model, there was no significant difference between results obtained in mutant cells and results obtained in WT cells.
Fig. 7.
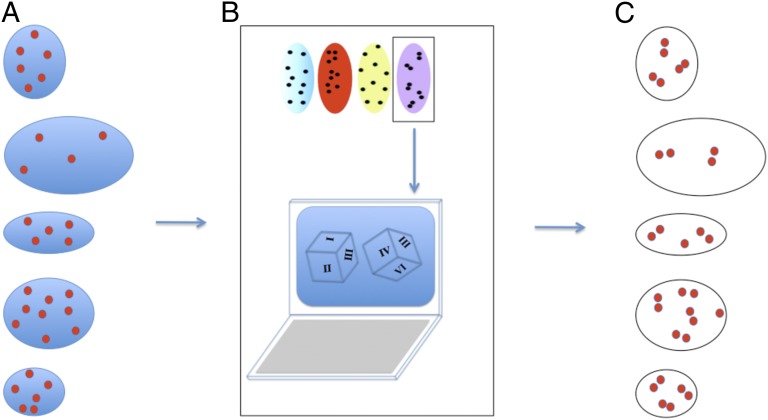
Schematic description of simulations that test the effect of differences in real cell size and shape on outcomes of organizational difference tests. (A) Segmented data from real cells defining the number of organelles and the boundary of the cell are the starting point for creating the real cell simulations. (B) For each cell, the number of organelle points in the real cell is replaced based on the type of organizational distribution desired. (C) Each real cell in the dataset is replaced with a simulated cell, with the only difference being that the placement of the organelles is now in the simulated pattern (placed in pairs in the case of this example).
Fig. 8.
Cell size and shape differences between mutant and WT cells do not create the observed organizational differences. (A) Network diagram illustrates the comparisons used in generating the graph to the right. Each simulation is conducted using cell size, shape, and nucleoid numbers drawn from real cells but with the placement of the organelles simulated according to the four hypothetical organization schemes from Fig. 3. (B) Cell shape and organelle differences do not cause significant differences in the apparent degree of organization between mutant and WT cells. The ellipse configuration and number of organelles from real cells were used to generate synthetic datasets (corresponding directly to each real population) using the nonbiased and biased simulation methods of Fig. 3. The distance between each of the different synthetic datasets (for cc125, asq2, and bld10) was measured against the synthetic dataset generated using cell shape and organelle number from WT strain cc124 simulated with the same spatial model (random and three different bias models). Results show that when comparing these populations with similar underlying distributions using different cell populations for cell shape and organelle number, the resulting KS distance is not statistically significant for all simulations. Dist, distance; Max, maximum; Min, minimum; Rand, random; Sim, simulation.
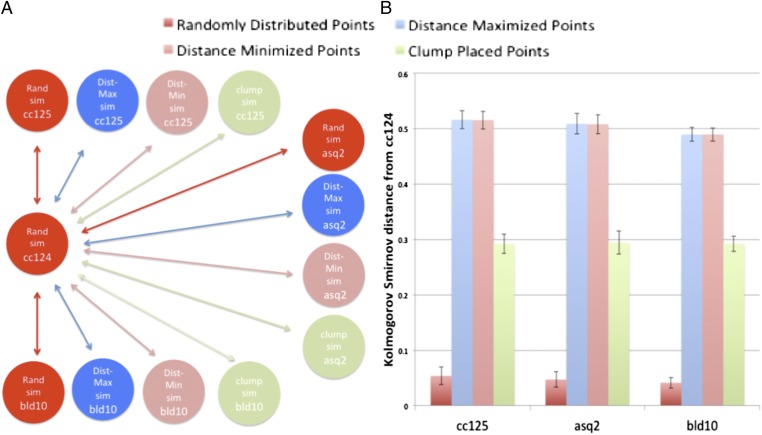
An opposite concern was that difference in cell shape or size might cause enough random variation in a population so that actual differences in organizational degree could become hard to detect. To rule out such an effect, we compared the results of Monte Carlo simulations with biased organization models using cells from the WT and mutant populations, with a reference simulation of uniformly distributed points in the WT cc124 cell populations (Fig. 9). In all cases, there was a significant distance between different organizational models compared with the uniform random model. When results from different simulations were merged and randomly resampled, these differences disappeared (Fig. 10). The results show that the biased organization is clearly detectable, even when comparing cell shapes drawn from two different mutant or WT backgrounds. We also used this approach to test whether the measured difference in organization between the two WT strains (Fig. 6B) could simply be a result of difference in cell size or shape. As plotted in Fig. 6C, simulations using cell outlines drawn from the two WT populations, and using the simplest null model of uniformly distributed point locations, give distances that are comparable to the measured results from the two WT populations, suggesting that the small observed distance could be a simple consequence of differences in cell shape between cc124 and cc125 WT strains.
Fig. 9.
Organizational differences can be detected despite differences in cell size and shape between different populations. (A) Network diagram of the comparisons used in generating the graph to the right. Every simulation is compared with the “Rand sim” point placement in cc124. (B) Spatial bias can be detected despite variation in cell size, shape, and organelle number between mutant and WT strains. Statistically significant differences are seen between all compared groups, with the exception of the random-to-random comparisons, which are not statistically significant. The ellipse configuration and number of organelles from each of the real cells were used to generate synthetic datasets (corresponding directly to each real population) using the nonbiased and biased simulation methods of Fig. 3. The distance between the synthetic cc124 dataset generated with a random distribution of points and each of the synthetic datasets was calculated. Simulations of uniform point distribution in both population pairs (dark red) contrast strongly with simulations using uniform distribution in one population and biased distribution in the other, revealing sensitivity to changes in organizational type despite variation in cell size, shape, or organelle number. Dist, distance; Max, maximum; Min, minimum; Rand, random; Sim, simulation.
Fig. 10.
Data from the different organizational simulations in Fig. 9 were grouped and then randomly resampled into four datasets. The statistical distance was calculated between these datasets; as expected, the resulting distances are consistent with the data being drawn from the same distribution.
We conclude that systematic differences in cell size, shape, or organelle number are not significant contributors to the organizational differences observed between mutant cells and WT cells nor can they prevent our detection of at least large differences in order, indicating that our use of actual cell shapes for Monte Carlo simulation combined with binning normalization (Fig. 2D) is effectively removing the effects of cell size and shape in the comparison.
Discussion
Segmentation Methodology.
This study uses a very simple image segmentation strategy. The segmentation strategy used naively utilizes intensity peaks as markers for organelles. Because inaccurate classification of organelles introduces variation into the data, better segmentation strategies could potentially reduce the statistical variation, and thereby increase the sensitivity of the method for future studies. Because the variation introduced by such algorithms is consistent across different populations, it is vital to use the same segmentation algorithm on all populations.
Comparison with Other Quantitative Analyses of Cell Structure.
Past methods that have quantitatively scored cell structure on a set of multidimensional image parameters have managed to score cells as normal or abnormal (33). Methods have also been described for quantifying cell shape and comparing the shapes of different cells (34). However, these past methods were geared toward identifying cell populations that had distinct cell morphologies and were not necessarily intended for the specific purpose of measuring order vs. disorder. In this study, we have shown a relative way to quantify the level and type of order in cells, which is a necessary first step toward treating cells as a branch of condensed matter physics.
Experimental Validation.
Overall, the statistical distance tests provide good correspondence with what has been noted from observational studies. Visual examination of bld10 mutants conveys the qualitative impression that these cells are much less organized then all three of the other strains (32) and, similarly, that asq2 is intermediately organized in comparison (8). The fact that our prior visual impression has now been recapitulated in the measurement of the cell organization over very large populations of cells supports the idea that the method is discriminating a real phenomenon (Fig. 5). When a mutation affecting an organelle leads to other defects (in this case, decreased organization of the whole cell), it is formally possible that the second defect is an independent side effect of the mutation and not due to the alteration of the organelle in question. However, we note that the two mutations analyzed, bld10 and asq2, act in very different ways at the molecular level. BLD10 protein is involved in assembly of the basic centriole structure, whereas ASQ2 protein is involved in linking together the older and newer centrioles into a linked pair (25). The fact that these two distinct mutations, acting in quite different pathways, both have strong effects on the level of cellular organization confirms that centrioles themselves are playing a role in organizing the cell.
Sample Range.
Samples can be used from a large range of cells and samples, and the size of the cells is immaterial. Generally, punctate and easily imaged organelles are easiest to use for this method. Both populations being compared need to have a similar volume, size, and number of organelles. Because this is a primarily statistical method, samples in which there are hundreds to thousands of cells will have the most power. The 3D cell data can be used but have the limitation of slower data collection. The 2D sample data can be used as long as the whole cell can be imaged simultaneously. Potential sample types compatible with the same imaging methodology include thin tissue sections, cell smears, mammalian cells, and bacterial cells. Mammalian cells in culture generally flatten out on microscope slides, and can thus be imaged in two dimensions without significant loss of information.
Potential Applications.
There are a number of potential applications of this method. For instance, this method could be used to measure degree of dysplasia in cancer cells for clinical and diagnostic purposes as well as a research tool. All current cytopathology is done in two dimensions with thin smears or thin sections, and thus could be simply approached with this method in a high-throughput manner. In addition, this tool could rapidly identify gene functions or drug targets that play a role in cellular organization in a high-throughput fashion. Many fundamental questions about cell organization over the cell cycle remain, and this tool could give insight into time-dependent organizational changes in populations. Furthermore, differences in protein localization could be examined quantitatively in superresolution microscopy techniques, such as photoactivated localization microscopy (PALM) or stochastic optical reconstruction microscopy (STORM). A completely different class of applications arises in attempting to test and refine theoretical or computational models for cellular organization and polarity. In general, the big problem with attempting to compare real cells with simulated cells is that one has to decide which aspects of the real-world cells to consider. This method solves that issue to some degree by providing a means to benchmark theoretical models using experimental data.
Materials and Methods
Cell Culture.
Four strains of C. reinhardtii cells, cc124, cc125, asq10, and bld10, were obtained from the Chlamydomous Genetics Center (www.chlamy.org). Each strain was grown and maintained in Tris acetate phosphate (TAP) media (35).
Microscopy.
Cells were fixed with 1% (wt/vol) glutaraldehyde and stained with DAPI and FITC-conjugated Concanavalin-A (FITC-ConA). After fixing, the cells were suspended in TAP media, and 10 μL of cell media solution was mounted on a microscope slide between a standard 22-mm square coverslip and sealed with Vaseline. Slides were imaged using a 20× air lens on a Deltavision deconvolution microscope (Applied Precision). Automated 2D imaging in both the FITC and DAPI channels across large areas of the slide was achieved with Softworx imaging software (Applied Precision, Inc.) and an automated microscope stage.
Image Segmentation.
Image segmentation was used with the images generated from the FITC channel of the FITC-ConA–stained cells to find the cell outlines with custom software written for the MATLAB (MathWorks) Image Processing Toolbox (http://marshalllab.ucsf.edu/apte/cellorganization.html). Each microscope image was broken into subregions to isolate each cell (Fig. 5). Image segmentation of DNA spots in the DAPI channel was achieved using custom software written for the MATLAB Image Processing Toolbox (http://marshalllab.ucsf.edu/apte/cellorganization.html). First, a threshold was for each image was set using the Ridler–Calvard algorithm. Then, intensity peaks in the image were identified using the peaks of connected pixel regions 1.5-fold above the threshold (Fig. 5).
Bounded Voronoi Tessellation of a Cell.
In two dimensions, the boundary of the cell is represented by an ellipse and each organelle in the cell is approximated by a point. Voronoi tessellation of each point within the cell with the multiparametric toolbox (MPT) in MATLAB and in python (http://marshalllab.ucsf.edu/apte/cellorganization.html) (36) defines the region of the plane closest to each point in the set of points. The intersection of this region with the area inside of the ellipse defines the area within the cell that is closest to each organelle. The variance of the areas defined by the intersection of the Voronoi facets and the ellipse is then calculated (Fig. 1A).
Null Model of Organization in a Particular Cell.
A null model of the organization of each cell was constructed using Monte Carlo simulation. The same number of points as were segmented in the real cell was randomly placed within the cell boundary. Iterating the Monte Carlo simulation 1,000 times and calculating the variance of the bounded Voronoi tessellation of each generated the null model distribution of variances (Fig. 1B). This distribution was then approximated with a two-variable gamma distribution. This was implemented in python (http://marshalllab.ucsf.edu/apte/cellorganization.html) and run on the University of California, San Francisco/California Institute for Quantitative Biosciences (UCSF/QB3) supercomputing cluster.
P Value of a Cell’s Organization in the Null Model.
Calculating the P value of a particular cell is achieved in two parts. First, the variance of the Voronoi areas of the real cell is calculated (as above). Then, the distribution of the variances of the Voronoi areas is calculated (as above). The cumulative distribution function of the two-variable gamma function can be directly used to calculate the P value (Fig. 1C). In this research, the P values found were below the floating-point precision of normal computer architecture, such the natural logarithm of the P values was directly calculated instead, allowing the computer to handle subsequent calculations. This was also implemented in python (http://marshalllab.ucsf.edu/apte/cellorganization.html) and run on the UCSF/QB3 supercomputing cluster.
Binning, KS Distance, and Bootstrapping Methodology.
To compare two different populations of cells directly, it is extremely important to control for bias that is introduced by comparing sets of cells with different area distributions or different numbers of organelles. To control this, each population is binned into sets of P values in two dimensions: the total area of each cell and the number of organelles in each cell (Fig. 2D). In this work, the volumes were separated into four equally sized bins and the number of organelles within cells was binned from three to eight. Corresponding numbers of cells were randomly drawn from each bin from each population to create sets for each population. The KS two-function test is then used to calculate a statistical distance between the P value sets from each population. Because a random subset of the values in each bin is being used to generate comparison sets, this random selection can be iterated to generate numerous bootstrapped KS distances. This set of bootstrapped KS distances is then used to calculate the mean KS distance between the populations as well as the SD of that distance. The mean KS distance obtained with 1,000 is used as our ultimate measure of difference in degree of organization. This was implemented in MATLAB (http://marshalllab.ucsf.edu/apte/cellorganization.html).
Control Simulations.
Simulations were conducted to test if the comparison between two populations of cells is biased by the size of the cell or the number of organelles in the cell. For each cell in both real populations, the parameters (size, shape, and number of organelles) were taken. Each set of cell parameters was used to place organelles randomly within the cells. These sets of simulated cells with real parameters are compared using the methods discussed above. The statistical distance of the results of the comparison of these simulated populations can be then used to set a baseline for the size of the statistical distance between any two populations.
Nonrandom Cell Generation.
To compare simulations more closely with the real experiments randomly, Monte Carlo simulation was used to generate random and nonrandom datasets using the same parameters, (shape, size, and number of organelles) as the populations of real cells (Fig. 7). The nonrandom datasets were created by randomly placing points into an ellipsoid rotated from the ellipse representing each cell. The nonrandom simulations were generated similarly; each cell in the “Min” simulation represents the selection of the cell with the minimum average interorganelle distance from a set of 1,000 randomly simulated cells (Fig. 3B). Each cell in the “Max” simulation represents the selection of the cell with the maximum average interorganelle distance from a set of 1,000 randomly simulated cells (Fig. 3C). The organelles within the Point Clumps simulation are placed in close point pairs at random locations within the cell (Fig. 3D). These simulations were then analyzed in exactly the same manner as the real cells, comparing each simulation with a simulation of the same type with the parameters of the cc124 cells. However, the comparison of different types of simulations (Fig. 9) was calculated by measuring the distance from each nonrandom simulation type to the synthetic cc124 dataset.
Comparison of Distances Found in 2D Projections with Their Full-3D Simulations of Cells.
To compare the distances achieved between 2D projections of 3D cell simulations with the distances found using full 3D analysis, similar methods of simulation were used as above. The only differences were that the simulated cells were of fixed size, all had five organelles, and the MPT (36) was used to obtain the Voronoi volumes of the points within the 3D cells. After the volumes were obtained, the variances of the volumes were calculated in the same way (Eq. 1) and the rest of the distance calculation was as described above. No binning was used because all the simulated cells were of the same size and organelle number.
Supplementary Material
Acknowledgments
We thank Susanne Rafelski, William Ludington, Aram Avila-Herrera, Peter Cimermančič, and Michael Apte for their helpful editing of this manuscript. This work was supported by Grant GM077004 from the National Institutes of Health.
Footnotes
The authors declare no conflict of interest.
This article is a PNAS Direct Submission.
See Author Summary on page 4172 (volume 110, number 11).
This article contains supporting information online at www.pnas.org/lookup/suppl/doi:10.1073/pnas.1212277109/-/DCSupplemental.
References
- 1.Rafelski SM, Marshall WF. Building the cell: Design principles of cellular architecture. Nat Rev Mol Cell Biol. 2008;9(8):593–602. doi: 10.1038/nrm2460. [DOI] [PubMed] [Google Scholar]
- 2.Théry M, et al. The extracellular matrix guides the orientation of the cell division axis. Nat Cell Biol. 2005;7(10):947–953. doi: 10.1038/ncb1307. [DOI] [PubMed] [Google Scholar]
- 3.Pfau P, Chak A. Detection of preinvasive cancer cells: Early-warning changes in precancerous epithelial cells can now be spotted in situ and endoscopic detection of dysplasia in patients with Barrett’s esophagus using light-scattered spectroscopy. Gastrointest Endosc. 2001;54(3):414–416. [PubMed] [Google Scholar]
- 4.Alberts B, et al. Molecular Biology of the Cell. 5th ed. New York: Garland; 2007. [Google Scholar]
- 5.Boone C, Bussey H, Andrews BJ. Exploring genetic interactions and networks with yeast. Nat Rev Genet. 2007;8(6):437–449. doi: 10.1038/nrg2085. [DOI] [PubMed] [Google Scholar]
- 6.Shulman JM, St Johnston D. Pattern formation in single cells. Trends Cell Biol. 1999;9(12):M60–M64. [PubMed] [Google Scholar]
- 7.Kirschner M, Gerhart J, Mitchison T. Molecular “vitalism”. Cell. 2000;100(1):79–88. doi: 10.1016/s0092-8674(00)81685-2. [DOI] [PubMed] [Google Scholar]
- 8.Feldman JL, Geimer S, Marshall WF. The mother centriole plays an instructive role in defining cell geometry. PLoS Biol. 2007;5(6):e149. doi: 10.1371/journal.pbio.0050149. [DOI] [PMC free article] [PubMed] [Google Scholar]
- 9.Yang Y, et al. CLUMPED CHLOROPLASTS 1 is required for plastid separation in Arabidopsis. Proc Natl Acad Sci USA. 2011;108(45):18530–18535. doi: 10.1073/pnas.1106706108. [DOI] [PMC free article] [PubMed] [Google Scholar]
- 10.Minc N, Burgess D, Chang F. Influence of cell geometry on division-plane positioning. Cell. 2011;144(3):414–426. doi: 10.1016/j.cell.2011.01.016. [DOI] [PMC free article] [PubMed] [Google Scholar]
- 11.Théry M. Micropatterning as a tool to decipher cell morphogenesis and functions. J Cell Sci. 2010;123(Pt 24):4201–4213. doi: 10.1242/jcs.075150. [DOI] [PubMed] [Google Scholar]
- 12.Boltzmann L. Vorlesungen über Gastheorie [Lectures on Gas Theory] Leipzig, Germany: J. A. Barth; 1896. German. [Google Scholar]
- 13.Shannon E. A mathematical theory of communication. Bell System Technical Journal. 1948;27:379–423. [Google Scholar]
- 14.Gatenby RA, Frieden BR. Information theory in living systems, methods, applications, and challenges. Bull Math Biol. 2007;69(2):635–657. doi: 10.1007/s11538-006-9141-5. [DOI] [PubMed] [Google Scholar]
- 15.Song C, et al. Theory of random packings. arXiv. 2010 1001.5468v1. [Google Scholar]
- 16.Briscoe C, et al. Jamming III: Characterizing randomness via the entropy of jammed matter. Physica A. 2010;389(19):3978–3999. [Google Scholar]
- 17. Miller EG (2003) A new class of entropy estimators for multi-dimensional densities. International Conference on Acoustics, Speech, and Signal Processing (Wiley-IEEE Press, Hoboken, NJ), pp 1–4.
- 18.Edwards S, Oakeshott R. Theory of powders. Physica A. 1989;157(3):1080–1090. [Google Scholar]
- 19.Azimzadeh J, Marshall WF. Building the centriole. Curr Biol. 2010;20(18):R816–R825. doi: 10.1016/j.cub.2010.08.010. [DOI] [PMC free article] [PubMed] [Google Scholar]
- 20.Bornens M. The centrosome in cells and organisms. Science. 2012;335(6067):422–426. doi: 10.1126/science.1209037. [DOI] [PubMed] [Google Scholar]
- 21.Yaffe MP, et al. Microtubules mediate mitochondrial distribution in fission yeast. Proc Natl Acad Sci USA. 1996;93(21):11664–11668. doi: 10.1073/pnas.93.21.11664. [DOI] [PMC free article] [PubMed] [Google Scholar]
- 22.Waterman-Storer CM, Salmon ED. Endoplasmic reticulum membrane tubules are distributed by microtubules in living cells using three distinct mechanisms. Curr Biol. 1998;8(14):798–806. doi: 10.1016/s0960-9822(98)70321-5. [DOI] [PubMed] [Google Scholar]
- 23.Sato Y, Wada M, Kadota A. Choice of tracks, microtubules and/or actin filaments for chloroplast photo-movement is differentially controlled by phytochrome and a blue light receptor. J Cell Sci. 2001;114(Pt 2):269–279. doi: 10.1242/jcs.114.2.269. [DOI] [PubMed] [Google Scholar]
- 24.Boyd JS, Gray MM, Thompson MD, Horst CJ, Dieckmann CL. The daughter four-membered microtubule rootlet determines anterior-posterior positioning of the eyespot in Chlamydomonas reinhardtii. Cytoskeleton (Hoboken) 2011;68(8):459–469. doi: 10.1002/cm.20524. [DOI] [PMC free article] [PubMed] [Google Scholar]
- 25.Silflow CD, Iyadurai KB. The Chlamydomonas VFL3 gene product is required for correct positioning of the basal bodies. Mol Biol Cell. 2002;13:326a. [Google Scholar]
- 26.Kumar S, et al. Properties of a three-dimensional Poisson-Voronoi tesselation: A Monte Carlo study. J Stat Phys. 1992;67(3):523–551. [Google Scholar]
- 27.Hinde AL, Miles RE. Monte Carlo estimates of the distributions of the random polygons of the Voronoi tessellation with respect to a Poisson process. J Statist Comput Simulation. 1980;10:205–223. [Google Scholar]
- 28.Tanemura M. Statistical distributions of Poisson Voronoi cells in two and three dimensions. FORMA-TOKYO. 2003;18(4):221–247. [Google Scholar]
- 29.Ehler LL, Holmes JA, Dutcher SK. Loss of spatial control of the mitotic spindle apparatus in a Chlamydomonas reinhardtii mutant strain lacking basal bodies. Genetics. 1995;141(3):945–960. doi: 10.1093/genetics/141.3.945. [DOI] [PMC free article] [PubMed] [Google Scholar]
- 30.Feldman JL, Marshall WF. ASQ2 encodes a TBCC-like protein required for mother-daughter centriole linkage and mitotic spindle orientation. Curr Biol. 2009;19(14):1238–1243. doi: 10.1016/j.cub.2009.05.071. [DOI] [PMC free article] [PubMed] [Google Scholar]
- 31.Matsuura K, Lefebvre PA, Kamiya R, Hirono M. Bld10p, a novel protein essential for basal body assembly in Chlamydomonas: Localization to the cartwheel, the first ninefold symmetrical structure appearing during assembly. J Cell Biol. 2004;165(5):663–671. doi: 10.1083/jcb.200402022. [DOI] [PMC free article] [PubMed] [Google Scholar]
- 32.Hiraki M, Nakazawa Y, Kamiya R, Hirono M. Bld10p constitutes the cartwheel-spoke tip and stabilizes the 9-fold symmetry of the centriole. Curr Biol. 2007;17(20):1778–1783. doi: 10.1016/j.cub.2007.09.021. [DOI] [PubMed] [Google Scholar]
- 33.D’Ambrosio MV, Vale RD. A whole genome RNAi screen of Drosophila S2 cell spreading performed using automated computational image analysis. J Cell Biol. 2010;191(3):471–478. doi: 10.1083/jcb.201003135. [DOI] [PMC free article] [PubMed] [Google Scholar]
- 34.Keren K, et al. Mechanism of shape determination in motile cells. Nature. 2008;453(7194):475–480. doi: 10.1038/nature06952. [DOI] [PMC free article] [PubMed] [Google Scholar]
- 35.Harris EH. The Chlamydomonas Sourcebook: A Comprehensive Guide to Biology and Laboratory Use. San Diego: Academic; 1989. [DOI] [PubMed] [Google Scholar]
- 36.Kvasnica M, Grieder P, Baoti M. 2004. Multi-parametric toolbox (MPT). Available at http://control.ee.ethz.ch/~mpt/. Accessed February 11, 2012.


