

Abstract
Large-scale integrated cancer genome characterization efforts including the cancer genome atlas and the cancer cell line encyclopedia have created unprecedented opportunities to study cancer biology in the context of knowing the entire catalog of genetic alterations. A clinically important challenge is to discover cancer subtypes and their molecular drivers in a comprehensive genetic context. Curtis et al. [Nature (2012) 486(7403):346–352] has recently shown that integrative clustering of copy number and gene expression in 2,000 breast tumors reveals novel subgroups beyond the classic expression subtypes that show distinct clinical outcomes. To extend the scope of integrative analysis for the inclusion of somatic mutation data by massively parallel sequencing, we propose a framework for joint modeling of discrete and continuous variables that arise from integrated genomic, epigenomic, and transcriptomic profiling. The core idea is motivated by the hypothesis that diverse molecular phenotypes can be predicted by a set of orthogonal latent variables that represent distinct molecular drivers, and thus can reveal tumor subgroups of biological and clinical importance. Using the cancer cell line encyclopedia dataset, we demonstrate our method can accurately group cell lines by their cell-of-origin for several cancer types, and precisely pinpoint their known and potential cancer driver genes. Our integrative analysis also demonstrates the power for revealing subgroups that are not lineage-dependent, but consist of different cancer types driven by a common genetic alteration. Application of the cancer genome atlas colorectal cancer data reveals distinct integrated tumor subtypes, suggesting different genetic pathways in colon cancer progression.
Keywords: multivariate generalized linear model, multidimensional data, penalized regression
A major goal of many cancer genome projects is to characterize key genetic alterations in cancer and discover therapeutic targets through comprehensive genomic profiling of the cancer genome. The Cancer Genome Atlas (TCGA) studies have unveiled the genetic landscape of several cancer types by whole-genome and whole-exome sequencing, DNA copy number profiling, promoter methylation profiling, and mRNA expression profiling in a large number of tumors (1–5). Complementary to the tumor project, the Cancer Cell Line Encyclopedia (CCLE) (6) and the Sanger cell line project (7) has cataloged a compilation of genetic and molecular data in almost 1,000 human cancer cell lines, coupled with pharmacological profiles for a large panel of anticancer drugs. These large-scale integrative genomic efforts have been geared toward comprehensively cataloging individual genomic alterations, analogous to a reverse-engineering process where thousands of individual cancer genomes are taken apart to shed light on common biological principles. Unfortunately, cancer genomes exhibit considerable heterogeneity with abnormalities occurring in different genes among different individuals, posing a great challenge to identify those genes with functional importance and therapeutic implications. Thus, there is a corresponding need for a forward-engineering process that synthesizes and integrates the information to extract biological principles from the massive amount of data to provide useful insights for advancing diagnostic, prognostic, and therapeutic strategies.
In a previous publication (8), we proposed an integrative clustering framework called iCluster. The method was recently used in a landmark study to predict novel breast cancer subtypes with distinct clinical outcomes (9), and it was found that the joint clustering of copy number and gene expression profiles resolved the considerable heterogeneity of the expression-only subgroups. Other approaches on data integration that have emerged in recent years include generalized data decomposition methods (10, 11) and nonparametric Bayesian models (12). However, two major challenges have not yet been fully addressed. First, the existing methods are not designed to include both discrete (e.g., somatic mutation) and continuous variables, thus limiting the ability to harness the full potential of large-scale integrated genomic datasets. In fact, most of the previous methods have focused on integrating only copy number and gene expression. A second challenge that has not been fully addressed lies in systematically distinguishing cancer genes that are reliable and constant features of a subtype from those that are less reliable.
To address these challenges, we present a significant enhancement of the iCluster method, which we call iCluster+. The enhanced method can perform pattern discovery that integrates diverse data types: binary (somatic mutation), categorical (copy number gain, normal, loss), and continuous (gene expression) values. In this paper, we demonstrate the power of this method for integrating the full spectrum of cancer genomic data using the CCLE and TCGA colorectal cancer datasets. A key aspect of the method is to use generalized linear regression for the formulation of a joint model, with respect to a common set of latent variables that we propose represents distinct driving factors (molecular etiology and genetic pathways). Geometrically, these latent variables form a set of “principal” coordinates that span a lower dimensional integrated subspace, and collectively capture the major biological variations observed across cancer genomes. As a result, the latent variable approach enables rigorous analysis of the integrated genomic data, as we show in this report can reveal common themes that sort the tumors into distinct subgroups of biological and clinical importance. To identify genomic features that contribute most to the biological variation and thus have direct relevance for characterizing the molecular subgroups, we apply a penalized likelihood approach (13) with lasso penalty terms (14, 15) to induce sparsity. The lasso regression allows us to pinpoint the subset of genomic features that have significant weights on the latent variables, which leads to enhanced interpretability and a more stable estimation of the latent variables.
Results
iCluster+ Framework.
iCluster+ integrates a diverse range of data types (Fig. 1). First, we introduce some notations. Let xijt denote the genomic variable associated with the jth ( ) genomic feature in the ith (
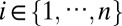 ) sample of the tth (
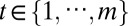 ) data type. A genomic feature can be either a protein-coding gene or non–gene-centric elements of interest (genomic region, CpG sites, microRNA, etc.), depending on the data type. Let
 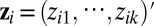 be a column vector consisting of k unobserved latent variables.
Fig. 1.

Integration of diverse data types by a latent variable approach. A simplified illustration of the TCGA CRC subtype discovery using iCluster+, revealing tumor subtypes characterized by TP53 mutation, somatic hypermutation, CIN, CIMP, and chr8q amplification. A gene-centric analysis of the chr8q region highlights MYC amplification and overexpression. Details of the TCGA CRC subtypes are discussed in Results and in Fig. 4.
The core idea is the following. We use a set of latent variables to represent k distinct driving factors (molecular drivers), which predict the values of the original  genomic variables, and collectively capture the major biological variations observed across cancer genomes. We assume zi are continuous valued variables that represent continuous spectrums of driver activation (hence aggressiveness of the tumor) and follow a standard multivariate normal distribution N(0, Ik). The mean zero and identity covariance matrix Ik are necessary identifiability constraints in the joint model we will introduce shortly. The identity covariance matrix also has a biological motivation to allow for discovery of orthogonal driving factors, i.e., Ik defines latent factors zk and
  , where
  represent orthogonal oncogenic processes; this is appealing because there is increasing evidence that molecular drivers tend to be altered in mutually exclusive sets of patients, representing distinct oncogenic mechanisms (16–18).
The genomic variables xijt
 are connected to the latent process via a parametric joint model in which different genomic variables are correlated through zi. Consider a simple example of the oncogene ERBB2 activated in a subgroup of breast tumors (the ERBB2 subtype), where it is activated through DNA amplification and mRNA overexpression. In this single driver gene example, zi induces correlation between the copy number and the expression changes for ERBB2. The values of zi can then be used to sort tumors by the degree of ERBB2 activation jointly estimated from both genomic measures. Applying the concept to a genome-wide multivariate analysis without prior knowledge of the molecular drivers, the latent variable approach facilitates the identification of common associations to provide insights into the underlying driving factors responsible for the phenotypic diversity of the tumor.
We now describe our modeling approach to this problem. In our model, if xijt is a binary variable (e.g., mutation status), we consider the following logistic regression:
 |
where and  is the probability of gene j mutated in patient i given the value of the latent factor zi; αjt is an intercept term; and βjt is a length-k row vector of coefficients that determine the weights genomic variable j contributes to the latent variables.
If xijt is a multicategory variable (e.g., copy number states: loss/normal/gain), we consider the following multilogit regression:
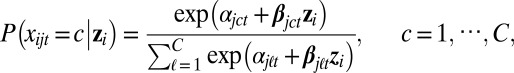 |
where  denote the probability of the states of the categorical variable (e.g., copy number loss, normal, gain) given the value of zi; αjct is the intercept term; βjct is a length-k row vector of regression coefficients for category c; and C is the total number of categories. This parametrization is not estimable without constraints. The L1 regularization we will introduce shortly deals with this parameter ambiguity in a natural way (13).
If xijt is a continuous variable, we assume it follows a normal distribution and consider the standard linear regression
where the error terms are uncorrelated, and  is the residual variance not accounted for by the common associations represented by zis. Finally, if xijt is a count variable (sequencing data), we consider the following Poisson regression:
where  is the conditional mean of the count given zi.
To identify the genomic variables (e.g., ERBB2 amplification and overexpression) that make important contributions to the latent process, a sparse coefficient vector consisting of mostly zero coefficients is particularly useful. To obtain a sparse model, we apply the lasso (L1-norm) penalty (14) and consider the following penalized likelihood estimation:
 |
where  is the L1-norm penalty and λts are nonnegative tuning parameters that balance the model complexity and fit. Notice the sparsity-inducing parameter λt (hence the degree of sparsity) is allowed to take different values for different data types. The values are determined by a model selection process using a Bayesian information criterion (BIC). The joint log-likelihood, however, cannot be evaluated in closed form and has an integral with dimension equal to the length of the latent variable zi. We derived a modified Monte Carlo Newton–Raphson algorithm (13, 19). Details are described in SI Methods. The software to implement the method is available at www.mskcc.org/research/epibio/iClusterPlus.
Cancer Cell Line Encyclopedia Data Application.
We first applied our method to the CCLE dataset (6) integrating chromosomal copy number, gene expression, and mutation by massively parallel sequencing in 729 human cancer cell lines representing more than 30 tumor types. A 12-cluster solution (Fig. 2) was selected from an extensive model-tuning process as described in SI Methods. Briefly, the number of clusters was determined by a deviance ratio metric that can be interpreted as the percentage of total variation explained by the current model. The percent explained variation typically increases as we introduce more clusters. The optimal k was thus chosen at a transition point beyond which the additional divisions no longer provide significant improvement (Fig. S1). We repeated the same run for k = 1 to 20 five times and Fig. S2 suggested that the variation is small. Cluster assignment can be found in Dataset S1 and Fig. S3 shows the silhouette plot for the 12 clusters. We used lasso penalized regression to induce sparsity and balance the complexity and fit of the model. The corresponding penalty parameters were chosen by minimizing a BIC over an m-dimensional search domain. As a result, a set of 233 mutated genes, 7,567 copy number regions, and 3,987 differentially expressed genes were found to have significant weights on the latent variables, and collectively explain the majority of the observed variation.
Fig. 2.

Integrated clustering of 729 cancer cell lines using iCluster+ reveals 12 cell line clusters characterized by distinct mutational, copy number, and gene expression profiles. (A) Heat map display of lasso-selected cluster-discriminant features. Rows are features and columns are cell line samples sorted by cluster assignment. Within each cluster, samples are further sorted by tissue type. (Top) Genes that are mutated (black) or not mutated (white) in each cluster. (Middle) Genomic regions amplified (red) or deleted (blue). (Bottom) Genes overexpressed (red) or underexpressed (blue) in each cluster. (B) Known and candidate cancer genes associated with each integrated cluster, determined by gene-wise Fisher’s combined probability test to identify genes with strongly concordant copy number and expression changes. The y axis is the  statistic in each cluster where Pcn, Pexp denote P values for cluster-specific copy number and expression alterations, respectively. The most significant genes that show concordant amplification/overexpression (red) or loss/underexpression (blue) in the corresponding cluster are highlighted. Genes with asterisks are annotated in the cancer gene consensus. The column of color pie charts indicates the histological composition in each integrated cluster. The most representative histologies are indicated on the right side of the pie chart.
There is great variation in patterns of mutation, copy number alteration, and gene expression changes across the 12 integrated clusters (Fig. 2A). The histological composition within each integrated cluster is shown in Fig. 2B. The mutational spectrum includes known driver genes in specific cancer types. Notably, most RB1 mutations fall exclusively in cluster 1, which consists of primarily small-cell lung cancer (SCLC) cell lines. BRAF mutations are tightly associated with the melanoma cell lines in cluster 10. A unique observation from the integrative clustering of mutation, copy number, and gene expression profiles is that several subgroups are not lineage-dependent. with strong correlation to a specific tissue of origin. Instead we observe different cancer types converge to the same integrated cluster because they are driven by a shared genetic alteration. For example, KRAS mutations are most prevalent in cluster 9, which includes both non–small-cell lung cancer (NSCLC) and pancreatic cancer cell lines. Additionally, cluster 6 (large intestine and endometrial) displays a hypermutated phenotype that has been well characterized in both colon and endometrial cancers with DNA repair deficiency. We also observe similar convergence of cancer cell lines of different cell of origins to the same integrated clusters driven by copy number and gene expression, indicating the potential of identifying common drivers cross cancer types in an integrated pan-cancer analysis.
We performed a gene-centric integration using Fisher’s combined probability test as a second-tier analysis (SI Methods) to highlight specific genes as potential drivers that provide the selective advantage of specific copy number alterations. Fig. 2B reveals known and candidate cancer genes associated with each integrated cluster emerged from the gene-centric integration. By Fisher’s combined probability test, the top-ranking genes in cluster 1 that show selective copy number loss and underexpression include two tumor suppressor genes, XPC and BAP1, which have been previously linked to lung cancer (20) and mesothelioma (21). The hematopoietic cell lines were divided into integrated clusters 2 and 3, which do not show distinguishable differences in gene expression profiles, but are distinctly different in somatic copy number alterations. The gene-centric integration revealed selective amplification and overexpression of MYB and PCM1 in cluster 2 (predominantly acute and chronic myeloid leukemia cell lines). Both genes have been previously implicated in a variety of hematological malignancies (22–24). Our analysis also revealed selective amplification and overexpression of MITF in cluster 10, previously identified as a lineage survival oncogene in melanoma (25). Similar results for MITF were observed from our integrated clustering analysis of the NCI60 dataset (Figs. S4 and S5). In addition to these findings, many known cancer drivers, including ERBB2 in breast cancer cell lines (cluster 4), EGFR and MET amplification and overexpression in lung adenocarcinoma (cluster 8), and MYCN amplification and overexpression in cluster 7, which is enriched for neural tumor cell lines, can be correctly identified (Fig. 2B).
Nevertheless, the full potential of our findings lies in those cluster-specific genes that show strong evidence of concordant alterations, and yet have not been linked to the particular cancer type based on the existing knowledge. For example, the gene-centric integration of SCLC-enriched cluster 1 identified concordant loss and underexpression of SHISA5 (Scotin), a p53-inducible ER stress protein (26), and concordant amplification and overexpression of gastrin-releasing peptide (GRP; Fisher’s combined probability test P = 10−65 and P = 10−87 respectively). Based on our results, we propose that these two genes are likely driver genes for SCLC. The full lists of known (27) and candidate cancer genes discovered by our method that characterize each cluster can be found in Dataset S2. Overall, the genome-wide gene-centric integration in Fig. 2B reveals that the impact of DNA copy number alterations on mRNA expression can be either focal, affecting a few genes (e.g., EGFR and MET on chr7 in cluster 8), or broad, affecting hundreds of genes (e.g., chr3, chr5, chr10 loss in cluster 1). Functional annotation analysis of the differentially expressed genes using DAVID (28) revealed tissue-specific biological processes, including lymphocyte differentiation in clusters 2 and 3, mammary gland development in cluster 4, and neuron differentiation in cluster 7.
We next investigated if the integrated cell lines’ clusters differed in the sensitivity to 24 different cancer drugs. We used the “activity area” under the dose–response curve that simultaneously captures the efficacy and potency of a drug (6). For several compounds, including the microtubule inhibitor paclitaxel, the HDAC inhibitor panobinostat, and the TOP2 inhibitor topotecan, higher sensitivity was observed for hematopoietic cell lines in integrated clusters 2 and 3 (Fig. 3 A–C). Most notably, cluster 2 (but not cluster 3) cell lines showed selective sensitivity to two MEK inhibitors, AZD6244 and PD-0325901 (Fig. 3 D and E), suggesting a potentially clinically important finding that a subgroup of hematological malignancies may respond better to MEK inhibitors. Clusters 6 and 10 also showed elevated sensitivity to the MEK inhibitors likely driven by the activating BRAF mutation in these cell lines (Fig. 2A). The complete response profiles to all of the 24 anticancer drugs are included in Fig. S6.
Fig. 3.

(A–E) Integrated clusters show differences in drug response. The integrated cluster ID is the same as those assigned in Fig. 2.
The Cancer Genome Atlas Colorectal Cancer Data Application.
In the most recent TCGA publication (3), genome-scale analyses of 276 colorectal carcinoma (CRC) samples were conducted, and included analysis of exome sequence, DNA copy number, promoter methylation, and mRNA expression. Based on the whole-exome sequencing data, 16% (n = 30) of CRCs were designated as hypermutated. Classification based on mutation rate was then manually compared with microsatellite instability (MSI) status, somatic copy number alterations, CpG island methylation phenotype (CIMP) classification, and gene expression profiles.
In this study, we performed an integrative classification using iCluster+ of a subset of 189 tumors that had all four data types available. A three-cluster solution emerged. A subsampling analysis was also conducted to assess the clustering stability (SI Methods). Fig. S7 shows cluster assignments of any random subsamples of the CRC dataset are on average 90% concordant. A set of 47 mutated genes, 1,666 copy number regions, 670 CpG sites, and 519 differentially expressed genes had nonzero weights on the latent variables. Fig. S8 reveals distinct patterns of alterations in each cluster. By finer-scale ordering, applying hierarchical clustering of the latent variables, cluster 2 tumors further separated into two subgroups, which we call 2a and 2b (Fig. 4; Fig. S9). Cluster assignment can be found in Dataset S3.
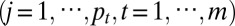
Fig. 4.

Integrated clustering of 189 TCGA colorectal cancer samples using iCluster+ reveals four distinct genomic subtypes (1, 2a, 2b, and 3). (Top) Sample annotations of MSI-H, CIMP-H, mutator phenotype associated with deficient DNA damage repair (hypermutated), and BRAF and TP53 mutation status. (Middle) Lasso-selected cluster-discriminant genes that have distinctly different mutational spectrums in each cluster (black, mutated; white, not mutated). (Bottom) Lasso-selected genomic regions with distinct patterns of amplification (red), normal (white), and deletion (blue).
The majority of subclass 2a tumors correspond to the hypermutated class previously described in ref. 3, which shows a substantially higher mutational burden. These tumors are associated with MSI, CpG island methylator phenotype (CIMP-high), as defined in ref. 3, and BRAF mutation. Furthermore, tumors in this class have distinctly few TP53 mutations (P = 10−8) and are chromosomally stable. Notably, among the hypermutation/MSI/CIMP-negative tumors, our method revealed three subgroups (2b, 1, and 3) that have not been previously observed in colorectal cancer. Specifically, cluster 2b has a low prevalence of TP53 mutation and displays a low degree of chromosomal instability (CIN-low) that is clearly different from the classic CIN phenotype as exemplified by clusters 1 and 3. To quantify the degree of somatic copy number alterations in each subtype, we calculated the fraction of the genome altered based on the number of alterations with a log2 ratio greater than 0.2 or below −0.2 (Fig. S10). Cluster 2a tumors (CIN-negative) have the lowest degree of alteration with an average of 3% of the genome altered. Cluster 2b tumors (CIN-low) show a moderate degree of alteration, averaging at 14% of the genome altered. Clusters 1 and 3 tumors (classic CIN) have the highest degree of alterations with an average of over 26% of the genome altered. The differences are highly significant (P < 10−15), and no significant differences in tumor purity as measured by the ABSOLUTE algorithm (29) were observed (P = 0.13). Association with clinical variables reveal that class 2b has the fewest high-stage tumors (P = 0.0001) of all of the colon cancer subtypes, which implicates 2b as a subtype that may not need aggressive treatment outside of surgery. Among the TP53-mutated/CIN-high group, patient samples were divided by chr8q amplification status. In particular, cluster 1 is clearly distinguished by chr8q amplification.
In the gene-centric integration using Fisher’s method to identity concordant copy number and gene expression events in cluster 1 tumors (PTDSS1, MYC, COX6C, EXT1, and RECQL4) associated with chr8q gain showed strong evidence of copy number-induced gene expression. A full list of genes with concordant events ranked by Fisher’s combined P values can be found in Dataset S4. Cluster 3 tumors, by contrast, are chr8q normal.
Discussion
The rapidly increasing size of integrated genomic datasets creates an unprecedented opportunity to study cancer biology and discover biomarkers and therapeutic targets in a novel way. In this paper, we presented a hypothesis-driven model-based approach for integrative clustering. A key aspect to our approach is the introduction of latent variables that we hypothesize to represent the spectrum of the underlying disease-driving factors, and that these latent variables facilitate the discovery of biological properties that lead to the phenotypic diversity observed with different cancer genomes. A great challenge of data integration that we directly addressed in this study was the disparate nature of the types of genomic variables involved. In the integrative context, it is unsuitable to interpret the variation of a binary variable (mutation status) in the same way as the variation of a continuous variable would be interpreted. Different modeling assumptions need to be considered. The methodological basis of iCluster+ thus combines a diverse range of generalized linear models to address this challenge. In our framework, mutations are modeled as a multivariate binomial process. Categorical observations are modeled as multivariate multinomial random variables. Count data are modeled as multivariate Poisson variables, and continuous measures such as gene expression are modeled as multivariate normal. Given the proper distributional assumptions for these diverse types of genomic variables, we fit simultaneous generalized linear regression of the diverse types of genomic variables with respect to a common set of latent variables representing distinct sets of molecular drivers.
Using two datasets, CCLE and TCGA CRC, we demonstrated that iCluster+ is a highly effective statistical framework to extract novel biological information from integrated cancer genomic data for tumor classification and cancer gene identification. In the pan-cancer analysis of 729 cancer cell lines representing 23 tumor types, our method provided a comprehensive view of genetic alterations that are specific to a cancer type, or shared by more than one cancer type. A gene-centric integration in each cluster accurately identified known drivers in several cancer types, including MITF in melanoma; ERBB2 in breast cancer; EGFR and MET in lung adenocarcinoma; and MYCN in brain tumors. Our findings also highlight many candidate biomarker or driver genes, including XPC, BAP1, and Scotin in small-cell lung cancer, and MYB and PCM1 in leukemia. Integrative clustering of the CCLE data also reveals subgroups of cell lines that are not lineage dependent, but rather converge to the same integrated cluster by a common genetic alteration. Associating the integrated clusters with the pharmacological profiles of 24 anticancer drug compounds revealed selective sensitivity to MEK inhibitors in a subset of hematopoietic cell lines, a potentially clinically important finding that a subgroup of hematological malignancies may benefit from MEK inhibitors. In the TCGA colorectal tumor data set, our method discovered two subtypes that have not been previously described. A notable observation is that in addition to the classic subtypes of chromosomally stable or unstable (CIN), we discovered an intermediate CIN phenotype. In contrast to the classic CIN (CIN-high) tumors, CIN-low tumors have distinctly few TP53 mutations. Purity analysis also revealed that the difference between the CIN-high and CIN-low phenotypes cannot be explained by tumor purity. Interestingly, this class appears to be the lowest grade of all types of colon cancer, and may warrant less-aggressive systemic treatment than other colon cancer subtypes. Furthermore, among the CIN-high tumors, our method clearly delineated two additional subtypes distinguished by chr8q amplified vs. normal. Further research will address the different tumor dependencies of these subgroups that can be the starting point for developing targeted therapeutics.
In summary, we have shown that our method can extract useful insights from the enormous volume of integrated cancer genomic data to fully exploit the “parts” catalog of the cancer genomes as generated by large-scale cancer genome projects. The outcome can provide useful insights for developing targeted therapeutics and informative biomarkers.
Methods
For model selection, we use a two-step approach. In the first step, given k (number of latent variables), we estimate the lasso penalty parameters  that minimize a BIC. However, to determine the optimal combination of the penalty parameter values, a very large search space needs to be covered. We used an efficient sampling method based on a uniform design (30). A theoretical advantage of the uniform design over an exhaustive grid search is the uniform space-filling property that avoids wasteful computation at nearby sampling points. In the next step, we choose the best k based on a deviance ratio
 |
where  are the combination of penalty parameter values that give the minimal BIC under k, ℓ 0 is the log-likelihood under the null (intercept) model, and ℓsat denotes the log-likelihood under the saturated model (a model with a latent variable per sample). The deviance ratio metric can be interpreted as the percentage of variation explained by the current model, and k is thus chosen to achieve an optimal value of the deviance ratio.
A limitation to the current method is that statistical inference (significance test and confidence intervals for the “final” model selected) is not straightforward due to the computational complexity and the use of penalized regression. Statistical inference after model selection (post–model-selection inference) is important yet very challenging even for simple linear regression. For a recent discussion on the topic, see refs. 31 and 32. In Berk et al. (32), an intuitive and practical strategy has been proposed, but it fails when the dimension of the variables is high. To our knowledge, there is no clear solution in statistics for post–model-selection inference problem for high-dimensional data; it is an interesting problem that may warrant future investigation.
Supplementary Material
Acknowledgments
This work was supported in part by Genome Data Analysis Center Type B Grant U24 CA143840, awarded as part of the National Cancer Institute/National Human Genome Research Institute-funded Cancer Genome Atlas project, and by a Starr Cancer Consortium grant.
Footnotes
The authors declare no conflict of interest.
This article is a PNAS Direct Submission.
This article contains supporting information online at www.pnas.org/lookup/suppl/doi:10.1073/pnas.1208949110/-/DCSupplemental.
References
- 1.Cancer Genome Atlas Research Network Comprehensive genomic characterization defines human glioblastoma genes and core pathways. Nature. 2008;455(7216):1061–1068. doi: 10.1038/nature07385. [DOI] [PMC free article] [PubMed] [Google Scholar]
- 2.Cancer Genome Atlas Research Network Integrated genomic analyses of ovarian carcinoma. Nature. 2011;474(7353):609–615. doi: 10.1038/nature10166. [DOI] [PMC free article] [PubMed] [Google Scholar]
- 3.Cancer Genome Atlas Network Comprehensive molecular characterization of human colon and rectal cancer. Nature. 2012;487(7407):330–337. doi: 10.1038/nature11252. [DOI] [PMC free article] [PubMed] [Google Scholar]
- 4.Cancer Genome Atlas Research Network Hammerman PS, et al. Comprehensive genomic characterization of squamous cell lung cancers. Nature. 2012;489:513–525. doi: 10.1038/nature11404. [DOI] [PMC free article] [PubMed] [Google Scholar]
- 5.Cancer Genome Atlas Network Comprehensive molecular portraits of human breast tumours. Nature. 2012;490(7418):61–70. doi: 10.1038/nature11412. [DOI] [PMC free article] [PubMed] [Google Scholar]
- 6.Barretina J, et al. The Cancer Cell Line Encyclopedia enables predictive modelling of anticancer drug sensitivity. Nature. 2012;483(7391):603–607. doi: 10.1038/nature11003. [DOI] [PMC free article] [PubMed] [Google Scholar]
- 7.Garnett MJ, et al. Systematic identification of genomic markers of drug sensitivity in cancer cells. Nature. 2012;483(7391):570–575. doi: 10.1038/nature11005. [DOI] [PMC free article] [PubMed] [Google Scholar]
- 8.Shen R, Olshen AB, Ladanyi M. Integrative clustering of multiple genomic data types using a joint latent variable model with application to breast and lung cancer subtype analysis. Bioinformatics. 2009;25(22):2906–2912. doi: 10.1093/bioinformatics/btp543. [DOI] [PMC free article] [PubMed] [Google Scholar]
- 9.Curtis C, et al. METABRIC Group The genomic and transcriptomic architecture of 2,000 breast tumours reveals novel subgroups. Nature. 2012;486(7403):346–352. doi: 10.1038/nature10983. [DOI] [PMC free article] [PubMed] [Google Scholar]
- 10.Alter O, Golub G. Integrative analysis of genome-scale data by using pseudoinverse projection predicts novel correlation between DNA replication and RNA transcription. Proc Natl Acad Sci USA. 2004;101(47):16577–16582. doi: 10.1073/pnas.0406767101. [DOI] [PMC free article] [PubMed] [Google Scholar]
- 11.Lock E, Hoadley KA, Marron J, Nobel A. 2011. Joint and individual variation explained (JIVE) for integrated analysis of multiple datatypes. arXiv:1102.4110.
- 12.Yuan Y, Savage RS, Markowetz F. Patient-specific data fusion defines prognostic cancer subtypes. PLOS Comput Biol. 2011;7(10):e1002227. doi: 10.1371/journal.pcbi.1002227. [DOI] [PMC free article] [PubMed] [Google Scholar]
- 13.Friedman J, Hastie T, Tibshirani R. Regularized paths for generalized linear models via coordinate descent. J Stat Softw. 2010;33(1):1–22. [PMC free article] [PubMed] [Google Scholar]
- 14.Tibshirani R. Regression shrinkage and selection via the lasso. J R Stat Soc Series B Stat Methodol. 1996;58(1):267–288. [Google Scholar]
- 15.Chen S, Donoho D, Saunders M. Atomic decomposition by basis pursuit. SIAM J Sci Comput. 1998;20(1):33–61. [Google Scholar]
- 16.Thomas RK, et al. High-throughput oncogene mutation profiling in human cancer. Nat Genet. 2007;39(3):347–351. doi: 10.1038/ng1975. [DOI] [PubMed] [Google Scholar]
- 17.Ciriello G, Cerami E, Sander C, Schultz N. Mutual exclusivity analysis identifies oncogenic network modules. Genome Res. 2012;22(2):398–406. doi: 10.1101/gr.125567.111. [DOI] [PMC free article] [PubMed] [Google Scholar]
- 18.Vandin F, Upfal E, Raphael BJ. De novo discovery of mutated driver pathways in cancer. Genome Res. 2012;22(2):375–385. doi: 10.1101/gr.120477.111. [DOI] [PMC free article] [PubMed] [Google Scholar]
- 19.McCulloch C. Maximum likelihood algorithms for generalized linear mixed models. J Am Stat Assoc. 1997;92(437):162–170. [Google Scholar]
- 20.Hollander M, et al. Deletion of XPC leads to lung tumors in mice and is associated with early events in human lung carcinogenesis. Proc Natl Acad Sci USA. 2005;102(37):13200–13205. doi: 10.1073/pnas.0503133102. [DOI] [PMC free article] [PubMed] [Google Scholar]
- 21.Bott M, et al. The nuclear deubiquitinase BAP1 is commonly inactivated by somatic mutations and 3p21.1 losses in malignant pleural mesothelioma. Nat Genet. 2011;43(7):668–672. doi: 10.1038/ng.855. [DOI] [PMC free article] [PubMed] [Google Scholar]
- 22.Slamon DJ, et al. Studies of the human c-myb gene and its product in human acute leukemias. Science. 1986;233(4761):347–351. doi: 10.1126/science.3014652. [DOI] [PubMed] [Google Scholar]
- 23.Barletta C, Pelicci PG, Kenyon LC, Smith SD, Dalla-Favera R. Relationship between the c-myb locus and the 6q-chromosomal aberration in leukemias and lymphomas. Science. 1987;235(4792):1064–1067. doi: 10.1126/science.3469751. [DOI] [PubMed] [Google Scholar]
- 24.Reiter A, et al. The t(8;9)(p22;p24) is a recurrent abnormality in chronic and acute leukemia that fuses PCM1 to JAK2. Cancer Res. 2005;65(7):2662–2667. doi: 10.1158/0008-5472.CAN-04-4263. [DOI] [PubMed] [Google Scholar]
- 25.Garraway LA, et al. Integrative genomic analyses identify MITF as a lineage survival oncogene amplified in malignant melanoma. Nature. 2005;436(7047):117–122. doi: 10.1038/nature03664. [DOI] [PubMed] [Google Scholar]
- 26.Terrinoni A, et al. p73-alpha is capable of inducing scotin and ER stress. Oncogene. 2004;23(20):3721–3725. doi: 10.1038/sj.onc.1207342. [DOI] [PubMed] [Google Scholar]
- 27.Futreal PA, et al. A census of human cancer genes. Nat Rev Cancer. 2004;4(3):177–183. doi: 10.1038/nrc1299. [DOI] [PMC free article] [PubMed] [Google Scholar]
- 28.Huang W, Sherman BT, Lempicki RA. Bioinformatics enrichment tools: Paths toward the comprehensive functional analysis of large gene lists. Nucleic Acids Res. 2009;37(1):1–13. doi: 10.1093/nar/gkn923. [DOI] [PMC free article] [PubMed] [Google Scholar]
- 29.Carter SL, et al. Absolute quantification of somatic DNA alterations in human cancer. Nat Biotechnol. 2012;30(5):413–421. doi: 10.1038/nbt.2203. [DOI] [PMC free article] [PubMed] [Google Scholar]
- 30.Fang K, Wang Y. Number Theoretic Methods in Statistics. London: Chapman & Hall; 1994. [Google Scholar]
- 31.Leeb H, Potscher BM. Can one estimate the conditional distribution of postmodel-selection estimators? Ann Stat. 2006;34(5):2554–2591. [Google Scholar]
- 32.Berk R, Brown L, Buja A, Zhang K, Zhao L. Valid post-selection inference. Ann Stat. 2012 in press. [Google Scholar]
Associated Data
This section collects any data citations, data availability statements, or supplementary materials included in this article.