Abstract
Assessing the safety of pharmacotherapies is a primary goal of clinical trials in drug development. The low frequency of relevant side effects, however, often poses a significant challenge for risk assessment. Methodologies allowing robust extrapolation of safety statistics based on preclinical data and information from clinical trials with limited numbers of patients are hence needed to further improve safety and efficacy in the drug development process. Here, we present a generic systems pharmacology approach integrating prior physiological and pharmacological knowledge, preclinical data, and clinical trial results, which allows predicting adverse event rates related to drug exposure. Possible fields of application involve high-risk populations, novel drug candidates, and different dosing scenarios. As an example, the approach is applied to simvastatin and pravastatin and the prediction of myopathy rates in a population with a genotype leading to a significantly increased myopathy risk.
Investments in pharmaceutical research and development have been on the rise continuously for decades. At the same time, the number of annual drug approvals shows a tendency to decrease to a level insufficient to ensure a sustainable economic basis for pharmaceutical innovator companies. Recent estimates for the total cumulated costs of a newly approved drug reach values in the order of US$2 billion.1 Today, the typical duration of the clinical development phase of a drug is 8 years and accounts for more than 50% of the total product costs on research and development.1 The key driver of development costs is project attrition due to insufficient clinical results. Although the lack of efficacy dominates the statistics of attrition causes, a stunning 20% of clinical drug failures result from safety issues2 and numerous approved drugs had to be withdrawn from the market due to safety issues arising after marketing authorization.3 The low frequency of relevant side effects, however, often poses a significant challenge for risk assessment. An improved understanding and predictability of the occurrence of adverse events would therefore enable significant improvements in drug development and patient safety.
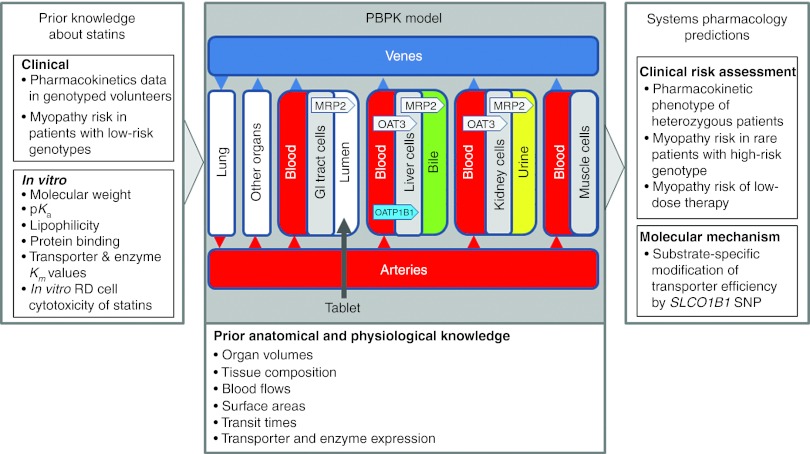
In this study, we present a generic approach to exploit drug safety–related information routinely generated during preclinical and clinical drug development in a quantitative way (Figure 1). Information used may also originate from classical in silico toxicology approaches such as quantitative structure–activity relationship, descriptor-, and rule-based models.4,5,6 The initial steps of our proceeding are state of the art in environmental toxicology modeling.7 In addition, our approach accounts for the existing knowledge on genetic risk factors of excess drug exposure or drug response as, for example, identified in association studies8 and clinical trial information. To identify and quantify potential safety issues in high-risk patient populations, we propose to integrate available knowledge and prior information together with experimental data originating from the drug development project in one unified computational model representation, the so-called physiology-based pharmacokinetic (PBPK) models (Supplementary Figure S1 online). From the establishment of the fundamental concepts,9 PBPK modeling has increasingly gained acceptance and is nowadays well established in environmental toxicology and risk assessment10,11,12 as well as in drug development.13,14,15,16,17,18 PBPK models integrate prior anatomical and physiological information ranging from the whole body level (e.g., organ volumes, blood flow rates, tissue composition)13,19,20 to relative tissue-specific gene expression data for relevant metabolic enzymes (e.g., cytochrome P450 3A4) and transporters (e.g., solute carrier organic anion transporter family member 1B1 (SLCO1B1)) at the cellular scale.21 Likewise, substance-specific absorption, distribution, metabolism, and excretion (ADME) properties such as molecular weight, lipophilicity, protein binding, or metabolic stability are considered for parameterization of the underlying generic distribution models.13,19,20
Figure 1.
Systems pharmacology. A generic systems pharmacology approach exploits drug safety–related information to predict adverse event rates. Physiology-based pharmacokinetic models are used to represent large amounts of prior physiological, anatomical, and pharmacological information and knowledge. The workflow additionally integrates preclinical data and clinical trial results routinely generated drug development. Together with the existing knowledge of genetic risk factors, the approach quantifies potential safety issues in high-risk patient populations. GI, gastro-intestinal; RD, embryonal rhabdomyosarcoma cells; SNP, single-nucleotide polymorphism.
The experimental data used in our case study range from the preclinical characterization of enzymes and transporter proteins metabolizing and transporting the drug to safety event rates in clinical trials (Figure 1). As PBPK models explicitly represent ADME genes, they are also capable of describing patient groups and individuals with specific genotypes and their corresponding pharmacokinetic phenotype. Another unique feature of PBPK models is the explicit representation of tissue, thereby, enabling prediction of concentration–time profiles based on plasma PK data. The systematic integration of prior (pre-)clinical knowledge and information enables as such a quantitative prediction of drug exposure in target tissue for the estimation of toxic effects and the mechanistic analysis of adverse drug reactions.22
Results
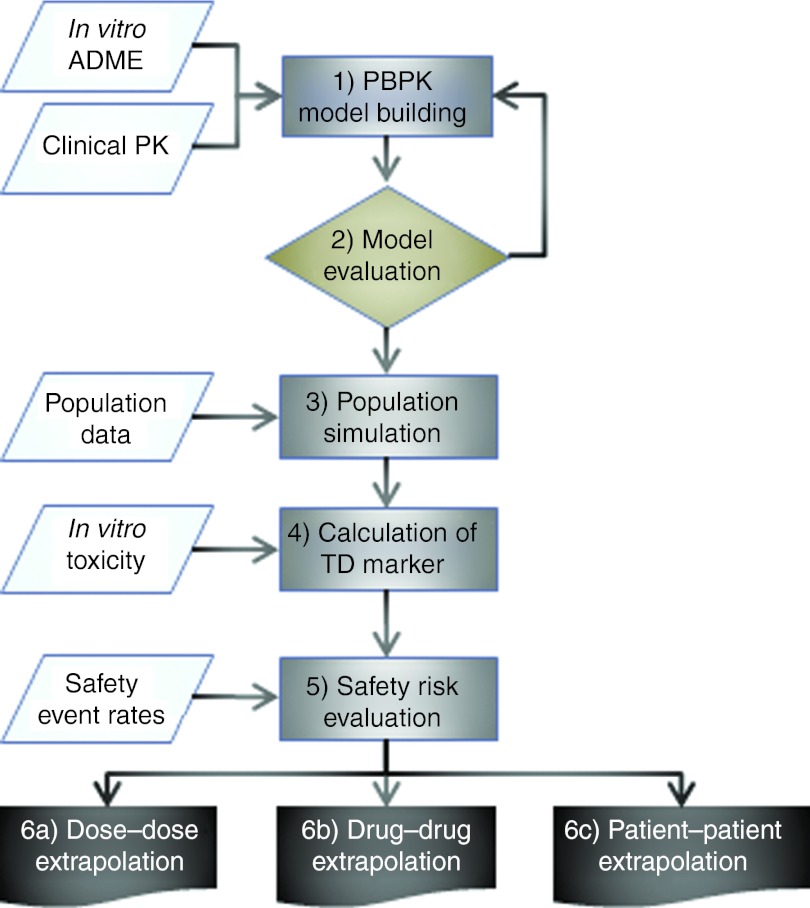
The proposed PBPK modeling-based workflow consists of six consecutive steps that allow the prediction of adverse event rates related to drug exposure (Figure 2, see Methods, Supplementary Table S1 online). To demonstrate the feasibility of our approach, the case of statin-induced myopathy is analyzed here. Statins are 3-hydroxy-3-methyl-glutaryl-CoA reductase inhibitors that are generally well tolerated and are used in the treatment of more than 30 million patients worldwide. Although mild cases of myopathy occur in around 1–5% of statin-treated patients, only 0.001% develop rhabdomyolysis, i.e., muscle symptoms with a more than 10-fold increase in creatinine kinase23 and with the potential for fatal consequences. Given the extent of statin use, a relevant group of hundreds of patients is therefore at risk for myopathy. In earlier studies, a single-nucleotide polymorphism (SNP; c.521T→C, p.Val174Ala) in the SLCO1B1 encoding for the organic anion transporting polypeptide OATP1B1 has been linked to an increased risk of myopathy after simvastatin treatment.8,24,25 For unknown reasons, the myopathy risk of smaller doses of simvastatin or of certain other statins such as pravastatin is significantly lower.24,26
Figure 2.
Workflow for model-based safety assessment. (1) Establishment of reference PBPK models; (2) model evaluation at relevant scales; (3) simulation of virtual populations and model evaluation; (4) calculation of TD markers; (5) evaluation of the safety risk; (6) prediction of the safety risk in high-risk patient groups or the risk for a novel drug candidate as a (a) dose to dose, (b) drug to drug, or (c) patient to patient extrapolation. ADME, absorption, distribution, metabolism, and excretion; PBPK, physiology-based pharmacokinetic; TD, toxicodynamic.
PBPK model establishment
In step 1, PBPK models for the clinical pharmacokinetics of simvastatin, our reference compound, and pravastatin, our assessment candidate, were established in volunteers with characterized SLCO1B1 genotypes27,28 (see Methods and Supplementary Materials and Methods online). Simvastatin is a lipophilic compound administered as an inactive lactone prodrug. The active acid metabolite is formed by esterase-mediated hydrolysis in the plasma and liver.29 Both the lactone prodrug and the active acid were explicitly represented in the simvastatin PBPK model. Pravastatin is considerably less lipophilic and is partially metabolized by sulfotransferases in the intestinal epithelium and liver.30 In addition to OATP1B1, which is represented in the simvastatin model, pravastatin is also transported by MRP2 in the intestine, liver and kidney, and by renal OAT3.31 Gene expression data were used as surrogates for tissue-specific transporter activity (i.e., relative Vmax values, see Methods).21 Due to the large amount of prior anatomical and physiological information provided in PBPK models, only a limited set of parameters had to be adjusted in both models for the reference genotype (c.521TT). Here, plasma concentration profiles for oral administration of simvastatin28 and for intravenous and oral administration of pravastatin27,32,33 were used. In addition, urinary excretion data were considered to close the mass balance for the compounds.34,35 Both statin PBPK models for the reference genotype (c.521TT) are compared with the experimental data (Figure 3a,b, Supplementary Figures S2–S5 online, Supplementary Tables S2–S6 online).
Figure 3.
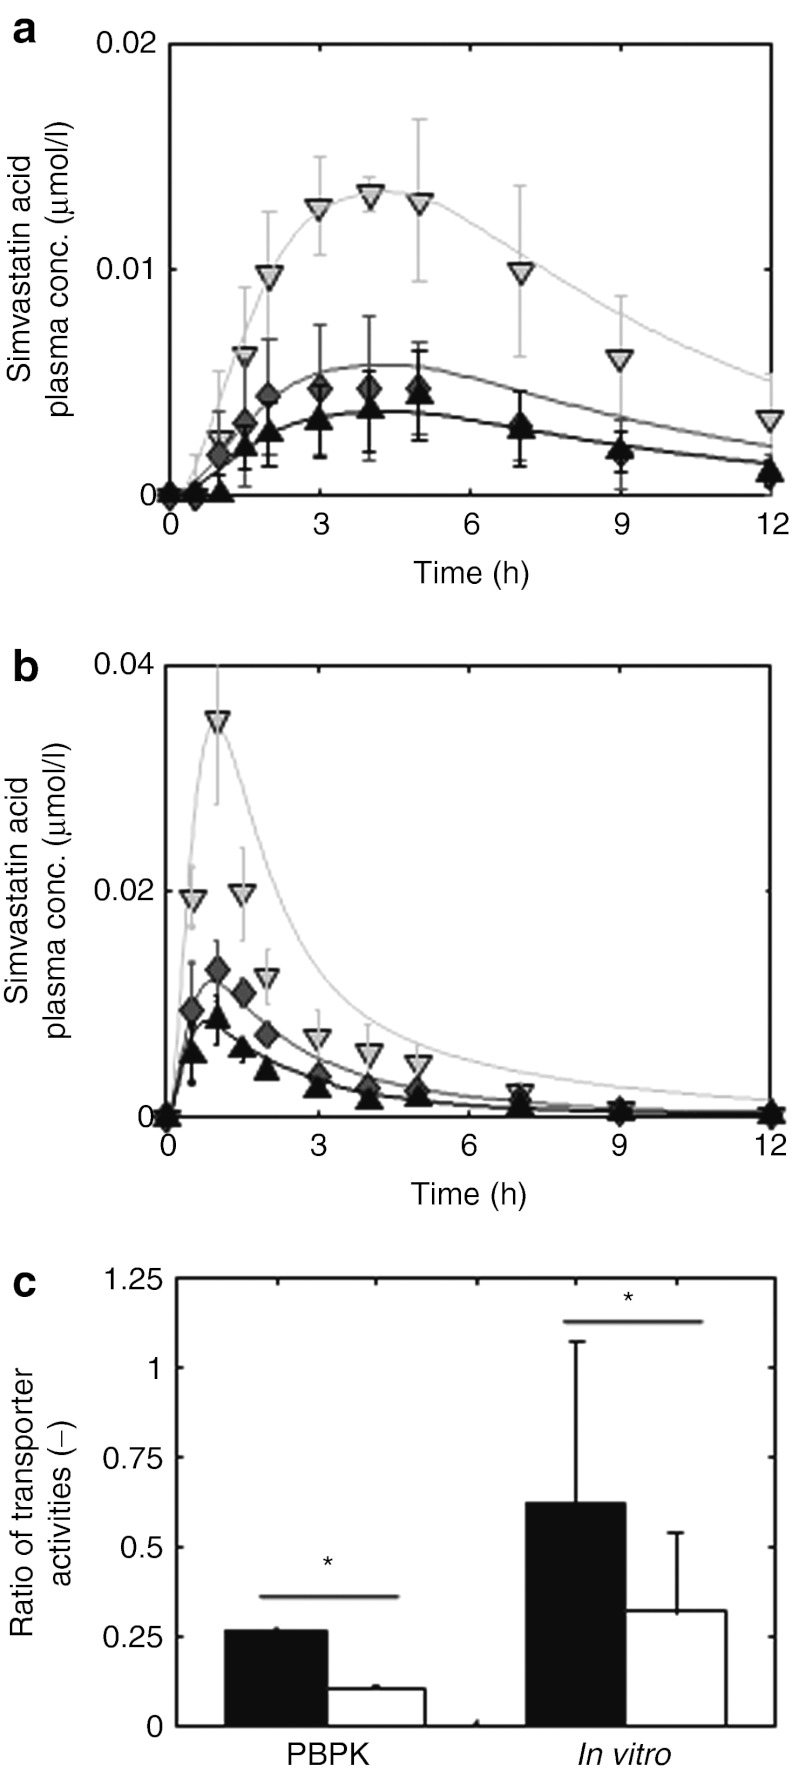
Validation of physiology-based pharmacokinetic (PBPK) models for simvastatin acid and pravastatin at the organism level and at the molecular scale. (a,b) Model-based prediction of pharmacokinetic phenotypes. After adjustment of model parameters with respect to the homozygous genotype TT (black; experiment: triangle (up)), the minor frequent homozygous genotype (CC, light gray; experiment: triangle (down)) was simulated by decreasing the transporter activity for (a) simvastatin acid28 and (b) pravastatin27(all simulations are indicated by a solid line). Taking the average of the transporter activity of both homozygous genotypes correctly predicts the plasma curves of the heterozygous genotype (TC, dark gray; triangle diamonds) for both drugs. (c) Model-based prediction of the effect of the solute carrier organic anion transporter family member 1B1 single-nucleotide polymorphism on the transporter activities at the molecular scale. The ratio of transporter activities  is different for simvastatin acid (black) and pravastatin (white). This PBPK model-based finding (left) could be verified with in vitro assays (right) using HEK 293 cells and [³H]-labeled pravastatin and simvastatin acid. *P < 1e-4, randomization test.
Subsequently, both models were adjusted to the increased plasma concentration levels for the homozygous genotype harboring the risk allele c.521C by means of a study in 31–32 healthy Caucasian volunteers with a characterized SLCO1B1 c.521T→C genotype.27,28 We assumed that decreasing OATP1B1 transporter activity alone should be sufficient to describe the pharmacokinetic difference between the TT and the CC group. The simvastatin and pravastatin models for the c.521CC genotype were therefore independently fitted based on the c.521TT models by adjusting OATP1B1 transporter activity only. The excellent representation of the clinical data obtained with this approach confirms the assumption of the dominating role of the transporter for the difference between the clinical phenotypes of the two homozygous volunteer groups (Figure 3a,b). Most notably, maximum plasma and muscle tissue concentrations and integral drug plasma exposure increase by a factor of 2–4 in volunteers with the CC genotype as compared with those with TT genotype for both statins.36
Model evaluation
Next, the predictive power of our models for pharmacokinetic phenotypes was evaluated. For this purpose, the PK of the heterozygous genotype was predicted by taking the arithmetic mean of transporter activities in both homozygous groups. The simulated plasma concentration curves of simvastatin and pravastatin were compared with the experimentally determined PK in the heterozygous genotype c.521TC (Figure 3a,b). Visual check indicates the accurate representation of the experimental data by the models and the predictive power of the computational model for pharmacokinetic phenotypes.
To also validate our model at the molecular scale, the effect of the c.521T→C SNP on kinetic transporter efficiency was investigated. To take into account the variability of model parameters, an ensemble modeling approach37 was performed based on which the ratio of the genotype-specific transporter activities  was found to be r = 0.265 (CI: (0.263; 0.267)) for simvastatin acid and r = 0.11 (CI: (0.105; 0.118)) for pravastatin (Figure 3c). Of note, the transporter protein abundance is canceled out when the ratios of the genotype-specific transporter activities for pravastatin and simvastatin are divided by each other. In this case, the resulting quotient of ratios is a mere function of the kinetic transport efficiencies (see Methods). The ratios for both statins are statistically significantly different (randomization test, P < 1.0 × 10⁻⁴) suggesting a substrate-specific effect of the transporter genotype on the kinetic transport efficiencies.
To validate this model-based finding experimentally, in vitro experiments with transfected HEK 293 cells and [³H]-labeled pravastatin and simvastatin acid were performed to measure the genotype-specific transport rate (see Methods). The experimental ratio of transport activities for simvastatin (0.62, CI: (0.17; 1.11)) is two times higher than for pravastatin (0.32, CI: (0.10; 0.51)) (Figure 3c, randomization test, P < 1 × 10⁻⁴; Supplementary Figure S6 online, Supplementary Table S8 online). The quotient of transport ratios is close to the quotient obtained from the modeling of clinical data and shows the excellent capability of the model to quantitatively relate in vivo to in vitro observations. This also shows that the c.521T→C SNP modifies the kinetic transport efficiency which, in turn, contributes to the difference between the clinical phenotypes. Both PBPK models were hence capable of predicting the pharmacokinetic phenotypes and the effect of the SLCO1B1 SNP at the molecular scale and were therefore considered as validated at the relevant biological scales.
Calculation of a toxicodynamic marker in virtual patient populations
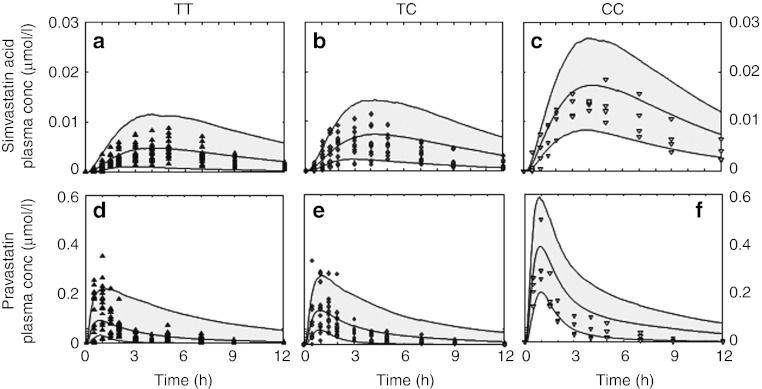
In step 3, Monte-Carlo simulations of genotype-specific virtual patient populations were performed of 1,000 individuals each by varying the anatomical and physiological parameters in the mean PBPK models according to prior statistical information38,39 (see Methods and Supplementary Table S7 online). The simulated PK of virtual populations for the three genotypes was compared with clinical data27,28 (Figure 4a–f).
Figure 4.
Population simulations. Population PK simulations (gray area) describe interindividual variability in clinical data for all three genotypes for (a,b,c) simvastatin acid and (d,e,f) pravastatin (TT, black triangle (up); TC, dark gray diamonds; CC, light gray triangle (down)).27,28
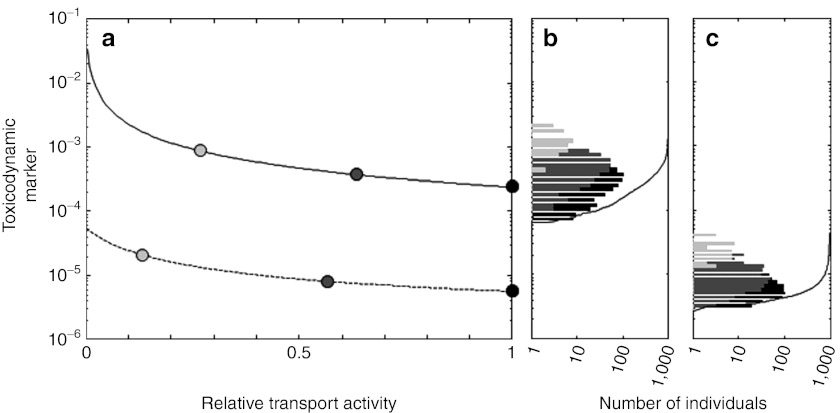
In step 4, systemic effects of the c.521T→C polymorphism on exposure in the target tissue were integrated with in vitro toxicity to derive a toxicodynamic (TD) marker. Simulations of the maximum concentrations for the CC genotype in muscle tissue (0.0035 and 0.1 µmol/l for simvastatin acid and pravastatin, respectively) show a 29-fold higher exposure for pravastatin as compared with simvastatin. By dividing these predicted tissue concentrations by half maximal inhibitory concentrations values determined with embryonal rhabdomyosarcoma cells (3.99 µmol/l and 4890 µmol/l for simvastatin acid and pravastatin, respectively),40 an in vivo marker for statin toxicity was calculated. Notably, this TD marker is considerably higher for simvastatin (8.8 × 10⁻⁴) than for pravastatin (2.1 × 10⁻⁵).
Prediction of myopathy incidence rates in different patient populations
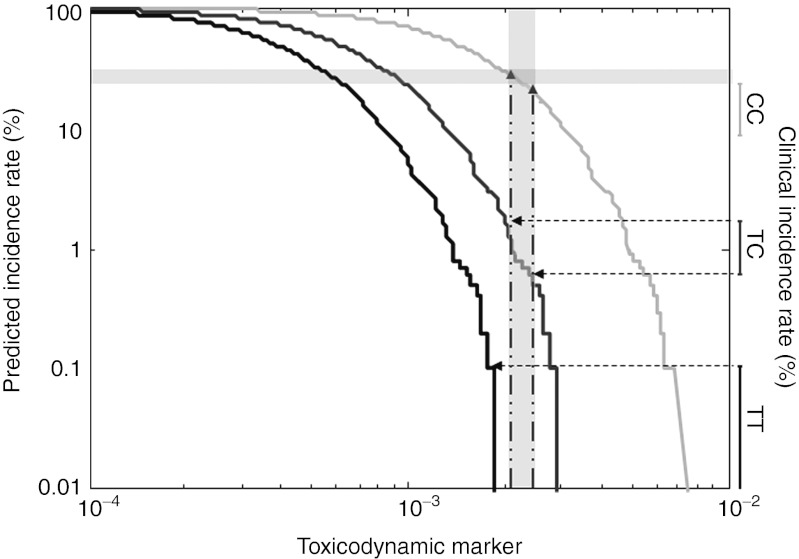
In step 5, cumulated distributions of the TD marker for both drugs (Figure 5a–c) were calculated based on the population simulations performed earlier (Figure 4a–f). The population simulations show a significantly higher risk after simvastatin treatment as compared with pravastatin (in agreement with clinical myopathy frequencies).24,26 Clinical risk data were used to consecutively predict safety event rates both of high-risk patient populations and of the assessment candidates simultaneously investigated in the workflow. To translate the TD marker to the myopathy incidence rates, a range of the TD marker was identified such that the fraction of patients having a larger value agrees simultaneously with the clinically observed first-year incidence rates of TT and TC patients receiving 80 mg simvastatin in the SEARCH study.8 By using the binomial confidence intervals for the clinical rates, a threshold corridor for our TD marker between 0.002 and 0.0024 was thereby derived (Figure 6). This corridor enables the drug–drug and patient–patient extrapolation, as predicted incidence rates correspond to the fraction of simulated patients having a TD marker exceeding the established threshold corridor.
Figure 5.
A toxicodynamic (TD) marker for statin toxicity. (a) The TD marker for pravastatin (dashed line) and simvastatin acid (solid line) is plotted as a function of transporter activity relative to the mean transport activity of the TT genotype. Mean activities for all genotypes are indicated by circles (TT: black, TC: dark gray, CC: light gray) and the extrapolated intermediate values are indicated by a solid line. (b,c) Genotype-specific distributions of the TD marker in population PK studies (TT: black bar, TC: dark gray bar, CC: light gray bar) for 1,000 virtual patients (cumulated distribution, black line) on treatment with (b) simvastatin acid and (c) pravastatin. The distributions are based on the population PK plots in Figure 4.
Figure 6.
Prediction of clinical incidence rates. Simulated cumulated distributions of the toxicodynamic (TD) marker are shown as solid lines (TT: black, TC: dark gray, CC: light gray). First-year myopathy incidence rates of TT and TC patients (vertical ranges, right y axis) receiving 80 mg simvastatin in the SEARCH study8 combined with the simulated cumulative distribution of the TD marker are used to determine a threshold corridor (vertical light gray bar) for the simulated cumulative distribution of the TD marker in different subgroups of patients (dashed horizontal lines). The corresponding intersections of the threshold corridor and the simulated cumulated distributions of the CC genotype are used to forecast the clinical incidence rate found in the SEARCH study8 (horizontal light gray bar).
In the final step, the safety risk during various scenarios of statin treatment was evaluated. First, the safety risk in a different, high-risk patient subgroup of CC patients was predicted. Taking the intersection of the threshold corridor with the simulated cumulative distribution of the TD marker for the CC genotype, the model predicts an incidence rate between 22.2 and 29.6% in the first treatment year. Of note, an incidence rate of 15.0% (CI: (8.8%; 23.1%)) was reported in the SEARCH study. We next simulated the myopathy incidence rate for 40 mg simvastatin in the Heart Protection Study41 (see Methods, Supplementary Figure S7 online). As the patient population of this study was not genotyped for the SLCO1B1 SNP, a weighted sum of incidence rates was calculated using empirical allele frequencies of the two SLCO1B1 variants.42 The predicted overall myopathy incidence rate between 0.04 and 0.11% also agrees well with 0.097% found in the study.41 Finally, the safety risk for the putative assessment candidate pravastatin was predicted (see Supplementary Figure S8 online). We found no intersection of the threshold corridor identified from clinical data of the SEARCH study8 with the simulated cumulative distribution of the TD marker for pravastatin and predict a vanishing genotype-associated risk for pravastatin.
Discussion
Here, we present a generic systems pharmacology framework approach using PBPK modeling and prior physiological and pharmacological knowledge that may be used to extrapolate from clinical incidence rates in dominant patient populations to rare frequency events, i.e. patient to patient, dose to dose, or drug to drug. In previous publications, it was already demonstrated that PBPK models are capable of accurately representing the pharmacokinetic phenotypes resulting from differences in polymorphic ADME genes linked to codeine toxicity.14,43 In these studies, however, the analysis was restricted to systemic exposure to the drug and its metabolites. The development of a generic workflow translating genotypes to clinical incident rates in a mechanistic and quantitative manner is a fundamental extension.
The use of our workflow is demonstrated by quantitative extrapolation of myopathy rates for the high-risk SLCO1B1 genotype under simvastatin treatment based on incidence rates in low-risk reference populations. Likewise, we predicted the preferable safety profile for a smaller dose of simvastatin. Extrapolations based on both the models are in general quantitative agreement (contained within CIs) with findings from the SEARCH study8 and the Heart Protection Study.41 With regard to drug to drug extrapolation, clinical simvastatin data were used to predict pravastatin myopathy rates. Here, a superior safety profile was estimated. Although this is a rather qualitative finding, it is again in line with clinical trial data for pravastatin that show no genotype-associated risk.24 Recent pharmacovigilance data of the FDA show 212 co-occurrences of pravastatin therapy and myopathy,44 however. A baseline myopathy risk resulting from other factors such as comedication or renal impairment may explain this apparent difference to our prediction, as the model used in this study does not account for risk factors other than the SLCO1B1 SNP. This is a conscious restriction of our study as the reported trial data do not document additional risk factors or the baseline myopathy risk in the general population. In principle, PBPK models are able to represent realistic combinations of differences in renal function, drug–drug interactions, and genotypes as shown earlier.43 The far lower incidence rate of such secondary factors is obviously masked by the dominant number of SCLO1B1-related events in the case of simvastatin. Notably, 2,278 cases are reported for simvastatin44 confirming the predicted superior safety of pravastatin in clinical practice, too. We conclude that our approach contributes significantly to a quantitative, mechanistic understanding of the dramatically different myopathy rates between simvastatin and pravastatin.
A key step of our workflow is the model validation in step 2, which secures validity of the consecutive toxicity-related predictions. Although a formal validation of PKPK models is ultimately not possible, the successful prediction of a sufficiently diverse set of experiments that has not been used for model establishment itself generates confidence in the quality of the models. In our study, targeted experimental data at the molecular and the organism scale were used to carefully verify the predictive accuracy of both models. In this regard, it is clearly desirable to use as much experimental information as possible to support model identification and to further strengthen the confidence in the models. It should be noted that our model predictions may be assumed to be robust as parameter uncertainty was explicitly taken into account by ensemble modeling37 during model establishment. In general, the availability of specific experimental data and knowledge is a minimal requirement for the applicability of our approach and also a potential limitation. The minimal set consists of ADME properties of a drug, plasma PK data, and knowledge about the existence, and the target tissue of a toxic effect.
Multiple in silico methodologies are established tools for the prediction of toxicological mechanisms and TD parameters, such as half maximal inhibitory concentrations, in drug development.4 As in the environmental toxicology applications of PKPB modeling,7,11,12 our study uses a detailed, mechanistic PBPK model to derive toxicity-related predictions. We use the PBPK model for a unified representation of knowledge generated during the drug development process that allows, for example, a model-based extrapolation of in vitro data to an in vivo context. In our study, this was done, for example, for the calculation of the TD marker from in vitro half maximal inhibitory concentrations values and the simulated drug exposure in the target tissue. Going beyond environmental applications, we systematize the steps required to integrate clinical information in the process of model establishment and validation and the application to predictions for specific populations.
Although investments into the development of novel drug candidates have continuously increased for decades, the number of annual drug approvals showed a tendency to decline. Even worse, adverse events that represent a considerable risk for patients at each stage of clinical development still contribute significantly to the overall clinical attrition rate. Model-based approaches that represent all available knowledge and information about a drug candidate and foster a mechanistic understanding of the pharmacological mechanisms promise to improve the success rates in clinical development by enabling rational patient stratification and individualized dose selection. Using the workflow presented here may help to identify and avoid potentially life-threatening side effects. The approach presented therefore provides a valuable tool for rational drug development. If applied consistently, it may help to significantly improve patient safety and support rational decision making at crucial stages of clinical development.
Methods
PBPK. PBPK models describe the mechanisms underlying the ADME of a substance within the body at in-depth levels of detail13,15,16,19,20,21,38,45,46 (Supplementary Figure S1 online). To support model building, PBPK models are based on a large degree of prior information regarding an organism's anatomy and physiology (see Supplementary Materials and Methods online). Such prior physiological information may range from the organism level (organ volumes, blood flow rate, etc.) to expression profiles of relevant enzymes and transporter proteins. Most notably, nearly all model parameters are either taken from large-scale collections of anatomical and physiological data or are calculated from a small set of drug-dependent properties.13,14,19,20,21,38,39 On the basis of substance-specific physicochemical surrogate parameters such as lipophilicity or plasma protein binding (see Supplementary Table S2 online), generic prediction models are simultaneously parameterized all over the body and can be used to describe drug-concentration profiles in various organs and tissues. The basic structure of the distribution models describe passive processes based on blood flow and diffusion. PBPK models can be extended by introducing additional mechanisms such as active transporters or enzyme-catalyzed clearance processes in various organs.
The PBPK models for simvastatin and pravastatin were built using the software platform consisting of PK-Sim Version 4.2, MoBi Version 2.2, and the MoBi Toolbox for Matlab Version 2.0 (see Supplementary Materials and Methods online). All three tools are available for noncommercial academic use free of charge (Bayer Technology Services GmbH, Leverkusen, Germany).13,19,38 PBPK models with PK-Sim were exported to and modified in the MoBi software (Bayer Technology Services GmbH, Leverkusen, Germany). All parameter optimizations and batch mode simulations were carried out using Matlab (version 7; MathWorks, Natick, MA) (see Supplementary Materials and Methods online). Both the PBPK models can be implemented by using the parameter values given in Supplementary Tables S2–S5 online, which provide the necessary information. The models are also provided in the Supplementary Materials and Methods online (MoBi-files).
General workflow. The proposed PBPK modeling-based workflow consists of six consecutive steps that allow predicting adverse event rates related to drug exposure (Figure 2, Supplementary Table S1 online). In the first step, PBPK models for a frequent reference PK phenotype (usually represented by the population mean PK of the most frequent patient group) are established for all drugs and drug candidates under investigation. In the second step, the PBPK models are evaluated to secure validity of the consecutive toxicity-related predictions. In the third step, the PK of the reference drug and further assessment candidates is simulated for a large virtual reference patient simulation and additional virtual patient populations of interest. For each simulated virtual individual, plasma PK and target tissue concentration–time profiles are calculated. In step 4, the latter are integrated with in vitro toxicity information to calculate TD markers for all individuals. In step 5, clinical risk data for the dominant reference population and the reference drug are introduced as the anchor point for the prediction of safety risks of high-risk populations and of the other drugs included in the workflow. The final step 6 predicts the safety risk in high-risk patient groups or the risk for a novel drug candidate as a patient to patient, dose to dose, or drug to drug extrapolation (Figure 2, Supplementary Table S1 online).
Ratio of transporter activities. The transport activity is the product of the kinetic transport efficiency kcat and the overall concentration of OATP1B1 (E0)
Both parameters are potentially specific for each allele. Dividing the ratios
for both pravastatin and simvastatin reveals that protein abundance cancels out and that the quotient of ratios is merely dependent on the kinetic transport efficiency kcat:
 |
Transport assay. Pravastatin and simvastatin lactone were purchased from Sigma-Aldrich (St. Louis, MO). Simvastatin lactone was converted into the acid using a method previously described.47 [³H]-labeled pravastatin and simvastatin acid were purchased from Hartmann Analytic (Braunschweig, Germany). After transfection for 48 h, the cells were washed with prewarmed phosphate-buffered saline and incubated in fetal calf serum (FCS)-free Dulbecco's modified Eagle's medium (DCEM). After 2 h, the culture medium was replaced with FCS-free DMEM supplemented each with pravastatin and activated simvastatin in a concentration of 20 and 10 µmol/l, respectively, each spiked with 0.5 µCi of the respective [³H]-labeled substrate. These concentrations are lower than those at which the half maximal uptakes occur.48 After 30-min incubation in 5% CO2 at 37 °C, the cells were washed with ice cold DMEM supplemented with 5% FCS twice and additionally three times with ice cold FCS-free DMEM. Subsequently, cells were lysed with 800 µl 0.2% sodium dodecyl sulfate in phosphate-buffered saline. Uptake of labeled substrate was measured by liquid scintillation counting. Each sample was measured at least in triplicates and normalized to total protein concentration (see Supplementary Materials and Methods online).
Calculation of confidence intervals. We have reported 95% confidence intervals that have been calculated by randomization. Calculation was performed by estimating the sampling distribution using permutation of inputs (cf. permutation tests). This gives the confidence intervals under the null hypothesis and that the parameters are independent of the outcome. The experimentally measured data are assumed to be normally distributed around the estimated mean with estimated SD. The confidence interval for the mean is derived using standard formulas. All statistics for derived quantities are calculated by generating uniformly distributed values from the respective confidence intervals and by evaluating the quantity. The lower and upper limits of the reported confidence intervals are the 2.5%-quantile and the 97.5%-quantile of this computationally generated probability distribution.
Prediction of clinical incidence rates (Heart Protection Study), 40 mg dose of simvastatin. The threshold on the TD marker identified for patients with TT and TC genotype in the SEARCH study was then applied to risk score data calculated in simvastatin PBPK models following 40 mg dosings of simvastatin. Here, an incidence rate is calculated per genotype, which was then weighted by the measured genotype frequency in the Heart Protection Study41 (Supplementary Figure S7 online).
Author Contributions
L.K., J.L., M.M., L.G., and J.H. wrote the manuscript. L.K., J.L., M.M., and H.-U.S. designed the research. L.K., J.L., M.B., O.V.K., M.M., H.-U.S., L.G., P.J.N., M.N., and J.H. performed the research. L.K., J.L., M.B., O.V.K., M.M., H.-U.S., L.G., P.J.N., M.N., and J.H. analyzed the data. M.B., C.S., T.B., B.L., S.S., P.J.N., M.N., and J.H. contributed new reagents/analytic tools.
Conflict of Interest
J.L., M.M., H.-U.S., L.G., and L.K. are employees of Bayer Technology Services GmbH, the company developing PK-Sim and MoBi.
Study Highlights
Acknowledgments
This study was supported by the German Ministry for Education and Research (BMBF) through the Systems Biology Networks “Virtual Liver” (grant no. 0315763), “QuantLiver” (grant no. 031 3853) and through “Services@MediGrid.”
Supplementary Material
References
- Paul S.M.et al. How to improve R&D productivity: the pharmaceutical industry's grand challenge Nat. Rev. Drug Discov 9203–214.2010 [DOI] [PubMed] [Google Scholar]
- Arrowsmith J. Trial watch: Phase II failures: 2008–2010. Nat. Rev. Drug Discov. 2011;10:328–329. doi: 10.1038/nrd3439. [DOI] [PubMed] [Google Scholar]
- Qureshi Z.P., Seoane-Vazquez E., Rodriguez-Monguio R., Stevenson K.B., &, Szeinbach S.L. Market withdrawal of new molecular entities approved in the United States from 1980 to 2009. Pharmacoepidemiol. Drug Saf. 2011;20:772–777. doi: 10.1002/pds.2155. [DOI] [PubMed] [Google Scholar]
- Valerio L.G., Jr In silico toxicology for the pharmaceutical sciences. Toxicol. Appl. Pharmacol. 2009;241:356–370. doi: 10.1016/j.taap.2009.08.022. [DOI] [PubMed] [Google Scholar]
- Jeliazkova N. Web tools for predictive toxicology model building. Expert Opin. Drug Metab. Toxicol. 2012;8:791–801. doi: 10.1517/17425255.2012.685158. [DOI] [PubMed] [Google Scholar]
- Mohan C.G. Impact of computational structure-based predictive toxicology in drug discovery. Comb. Chem. High Throughput Screen. 2011;14:417–426. doi: 10.2174/138620711795508395. [DOI] [PubMed] [Google Scholar]
- Yoon M., Campbell J.L., Andersen M.E., &, Clewell H.J. Quantitative in vitro to in vivo extrapolation of cell-based toxicity assay results. Crit. Rev. Toxicol. 2012;42:633–652. doi: 10.3109/10408444.2012.692115. [DOI] [PubMed] [Google Scholar]
- Link E.et al.. SLCO1B1 variants and statin-induced myopathy–a genomewide study N. Engl. J. Med 359789–799.2008 [DOI] [PubMed] [Google Scholar]
- Bischoff K.B., &, Dedrick R.L. Generalized solution to linear, to compartment, open model for drug distribution. J. Theor. Biol. 1970;29:63–68. doi: 10.1016/0022-5193(70)90119-0. [DOI] [PubMed] [Google Scholar]
- Woodruff T.J.et al. Meeting report: moving upstream-evaluating adverse upstream end points for improved risk assessment and decision-making Environ. Health Perspect 1161568–1575.2008 [DOI] [PMC free article] [PubMed] [Google Scholar]
- Bois F.Y., Jamei M., &, Clewell H.J. PBPK modelling of inter-individual variability in the pharmacokinetics of environmental chemicals. Toxicology. 2010;278:256–267. doi: 10.1016/j.tox.2010.06.007. [DOI] [PubMed] [Google Scholar]
- Loizou G.et al. Development of good modelling practice for physiologically based pharmacokinetic models for use in risk assessment: the first steps Regul. Toxicol. Pharmacol 50400–411.2008 [DOI] [PubMed] [Google Scholar]
- Willmann S., Lippert J., &, Schmitt W. From physicochemistry to absorption and distribution: predictive mechanistic modelling and computational tools. Expert Opin. Drug Metab. Toxicol. 2005;1:159–168. doi: 10.1517/17425255.1.1.159. [DOI] [PubMed] [Google Scholar]
- Willmann S., Edginton A.N., Coboeken K., Ahr G., &, Lippert J. Risk to the breast-fed neonate from codeine treatment to the mother: a quantitative mechanistic modeling study. Clin. Pharmacol. Ther. 2009;86:634–643. doi: 10.1038/clpt.2009.151. [DOI] [PubMed] [Google Scholar]
- Nestorov I. Whole-body physiologically based pharmacokinetic models. Expert Opin. Drug Metab. Toxicol. 2007;3:235–249. doi: 10.1517/17425255.3.2.235. [DOI] [PubMed] [Google Scholar]
- Poulin P., &, Theil F.P. Prediction of pharmacokinetics prior to in vivo studies. II. Generic physiologically based pharmacokinetic models of drug disposition. J. Pharm. Sci. 2002;91:1358–1370. doi: 10.1002/jps.10128. [DOI] [PubMed] [Google Scholar]
- Kawai R., Lemaire M., Steimer J.L., Bruelisauer A., Niederberger W., &, Rowland M. Physiologically based pharmacokinetic study on a cyclosporin derivative, SDZ IMM 125. J. Pharmacokinet. Biopharm. 1994;22:327–365. doi: 10.1007/BF02353860. [DOI] [PubMed] [Google Scholar]
- Charnick S.B., Kawai R., Nedelman J.R., Lemaire M., Niederberger W., &, Sato H. Perspectives in pharmacokinetics. Physiologically based pharmacokinetic modeling as a tool for drug development. J. Pharmacokinet. Biopharm. 1995;23:217–229. doi: 10.1007/BF02354273. [DOI] [PubMed] [Google Scholar]
- Willmann S.et al. PK-Sim: a physiologically based pharmacokinetic “whole-body” model Biosilico 1121–124.2003 [Google Scholar]
- Willmann S., Schmitt W., Keldenich J., Lippert J., &, Dressman J.B. A physiological model for the estimation of the fraction dose absorbed in humans. J. Med. Chem. 2004;47:4022–4031. doi: 10.1021/jm030999b. [DOI] [PubMed] [Google Scholar]
- Meyer M., Schneckener S., Ludewig B., Kuepfer L., &, Lippert J. Using expression data for quantification of active processes in physiologically based pharmacokinetic modeling. Drug Metab. Dispos. 2012;40:892–901. doi: 10.1124/dmd.111.043174. [DOI] [PubMed] [Google Scholar]
- Waters M.D., &, Fostel J.M. Toxicogenomics and systems toxicology: aims and prospects. Nat. Rev. Genet. 2004;5:936–948. doi: 10.1038/nrg1493. [DOI] [PubMed] [Google Scholar]
- Chatzizisis Y.S., Koskinas K.C., Misirli G., Vaklavas C., Hatzitolios A., &, Giannoglou G.D. Risk factors and drug interactions predisposing to statin-induced myopathy: implications for risk assessment, prevention and treatment. Drug Saf. 2010;33:171–187. doi: 10.2165/11319380-000000000-00000. [DOI] [PubMed] [Google Scholar]
- Voora D.et al. The SLCO1B1*5 genetic variant is associated with statin-induced side effects J. Am. Coll. Cardiol 541609–1616.2009 [DOI] [PMC free article] [PubMed] [Google Scholar]
- Niemi M., Pasanen M.K., &, Neuvonen P.J. Organic anion transporting polypeptide 1B1: a genetically polymorphic transporter of major importance for hepatic drug uptake. Pharmacol. Rev. 2011;63:157–181. doi: 10.1124/pr.110.002857. [DOI] [PubMed] [Google Scholar]
- Backes J.M., Howard P.A., Ruisinger J.F., &, Moriarty P.M. Does simvastatin cause more myotoxicity compared with other statins. Ann. Pharmacother. 2009;43:2012–2020. doi: 10.1345/aph.1M410. [DOI] [PubMed] [Google Scholar]
- Niemi M., Pasanen M.K., &, Neuvonen P.J. SLCO1B1 polymorphism and sex affect the pharmacokinetics of pravastatin but not fluvastatin. Clin. Pharmacol. Ther. 2006;80:356–366. doi: 10.1016/j.clpt.2006.06.010. [DOI] [PubMed] [Google Scholar]
- Pasanen M.K., Neuvonen M., Neuvonen P.J., &, Niemi M. SLCO1B1 polymorphism markedly affects the pharmacokinetics of simvastatin acid. Pharmacogenet. Genomics. 2006;16:873–879. doi: 10.1097/01.fpc.0000230416.82349.90. [DOI] [PubMed] [Google Scholar]
- García M.J., Reinoso R.F., Sánchez Navarro A., &, Prous J.R. Clinical pharmacokinetics of statins. Methods Find. Exp. Clin. Pharmacol. 2003;25:457–481. [PubMed] [Google Scholar]
- Hatanaka T. Clinical pharmacokinetics of pravastatin: mechanisms of pharmacokinetic events. Clin. Pharmacokinet. 2000;39:397–412. doi: 10.2165/00003088-200039060-00002. [DOI] [PubMed] [Google Scholar]
- Kivistö K.T., &, Niemi M. Influence of drug transporter polymorphisms on pravastatin pharmacokinetics in humans. Pharm. Res. 2007;24:239–247. doi: 10.1007/s11095-006-9159-2. [DOI] [PubMed] [Google Scholar]
- Mwinyi J., Johne A., Bauer S., Roots I., &, Gerloff T. Evidence for inverse effects of OATP-C (SLC21A6) 5 and 1b haplotypes on pravastatin kinetics. Clin. Pharmacol. Ther. 2004;75:415–421. doi: 10.1016/j.clpt.2003.12.016. [DOI] [PubMed] [Google Scholar]
- Singhvi S.M., Pan H.Y., Morrison R.A., &, Willard D.A. Disposition of pravastatin sodium, a tissue-selective HMG-CoA reductase inhibitor, in healthy subjects. Br. J. Clin. Pharmacol. 1990;29:239–243. doi: 10.1111/j.1365-2125.1990.tb03626.x. [DOI] [PMC free article] [PubMed] [Google Scholar]
- Everett D.W., Chando T.J., Didonato G.C., Singhvi S.M., Pan H.Y., &, Weinstein S.H. Biotransformation of pravastatin sodium in humans. Drug Metab. Dispos. 1991;19:740–748. [PubMed] [Google Scholar]
- Todd P.A., &, Goa K.L. Simvastatin. A review of its pharmacological properties and therapeutic potential in hypercholesterolaemia. Drugs. 1990;40:583–607. doi: 10.2165/00003495-199040040-00007. [DOI] [PubMed] [Google Scholar]
- Niemi M. Transporter pharmacogenetics and statin toxicity. Clin. Pharmacol. Ther. 2010;87:130–133. doi: 10.1038/clpt.2009.197. [DOI] [PubMed] [Google Scholar]
- Kuepfer L., Peter M., Sauer U., &, Stelling J. Ensemble modeling for analysis of cell signaling dynamics. Nat. Biotechnol. 2007;25:1001–1006. doi: 10.1038/nbt1330. [DOI] [PubMed] [Google Scholar]
- Eissing T.et al. A computational systems biology software platform for multiscale modeling and simulation: integrating whole-body physiology, disease biology, and molecular reaction networks Front. Physiol 24.2011 [DOI] [PMC free article] [PubMed] [Google Scholar]
- Willmann S.et al. Development of a physiology-based whole-body population model for assessing the influence of individual variability on the pharmacokinetics of drugs J. Pharmacokinet. Pharmacodyn 34401–431.2007 [DOI] [PubMed] [Google Scholar]
- Kobayashi M.et al. Association between risk of myopathy and cholesterol-lowering effect: a comparison of all statins Life Sci 82969–975.2008 [DOI] [PubMed] [Google Scholar]
- Heart Protection Study Collaborative Group. MRC/BHF Heart Protection Study of cholesterol lowering with simvastatin in 20,536 high-risk individuals: a randomised placebo-controlled trial Lancet 3607–22.2002. 12114036 [Google Scholar]
- Pasanen M.K., Backman J.T., Neuvonen P.J., &, Niemi M. Frequencies of single nucleotide polymorphisms and haplotypes of organic anion transporting polypeptide 1B1 SLCO1B1 gene in a Finnish population. Eur. J. Clin. Pharmacol. 2006;62:409–415. doi: 10.1007/s00228-006-0123-1. [DOI] [PubMed] [Google Scholar]
- Eissing T., Lippert J., &, Willmann S. Pharmacogenomics of codeine, morphine, and morphine-6-glucuronide: model-based analysis of the influence of CYP2D6 activity, UGT2B7 activity, renal impairment, and CYP3A4 inhibition. Mol. Diagn. Ther. 2012;16:43–53. doi: 10.2165/11597930-000000000-00000. [DOI] [PubMed] [Google Scholar]
- Sakaeda T., Kadoyama K., &, Okuno Y. Statin-associated muscular and renal adverse events: data mining of the public version of the FDA adverse event reporting system. PLoS ONE. 2011;6:e28124. doi: 10.1371/journal.pone.0028124. [DOI] [PMC free article] [PubMed] [Google Scholar]
- Poulin P., &, Theil F.P. Prediction of pharmacokinetics prior to in vivo studies. 1. Mechanism-based prediction of volume of distribution. J. Pharm. Sci. 2002;91:129–156. doi: 10.1002/jps.10005. [DOI] [PubMed] [Google Scholar]
- Rodgers T., Leahy D., &, Rowland M. Physiologically based pharmacokinetic modeling 1: predicting the tissue distribution of moderate-to-strong bases. J. Pharm. Sci. 2005;94:1259–1276. doi: 10.1002/jps.20322. [DOI] [PubMed] [Google Scholar]
- Sadeghi M.M., Collinge M., Pardi R., &, Bender J.R. Simvastatin modulates cytokine-mediated endothelial cell adhesion molecule induction: involvement of an inhibitory G protein. J. Immunol. 2000;165:2712–2718. doi: 10.4049/jimmunol.165.5.2712. [DOI] [PubMed] [Google Scholar]
- Kameyama Y., Yamashita K., Kobayashi K., Hosokawa M., &, Chiba K. Functional characterization of SLCO1B1 (OATP-C) variants, SLCO1B1*5, SLCO1B1*15 and SLCO1B1*15+C1007G, by using transient expression systems of HeLa and HEK293 cells. Pharmacogenet. Genomics. 2005;15:513–522. doi: 10.1097/01.fpc.0000170913.73780.5f. [DOI] [PubMed] [Google Scholar]
Associated Data
This section collects any data citations, data availability statements, or supplementary materials included in this article.


