Abstract
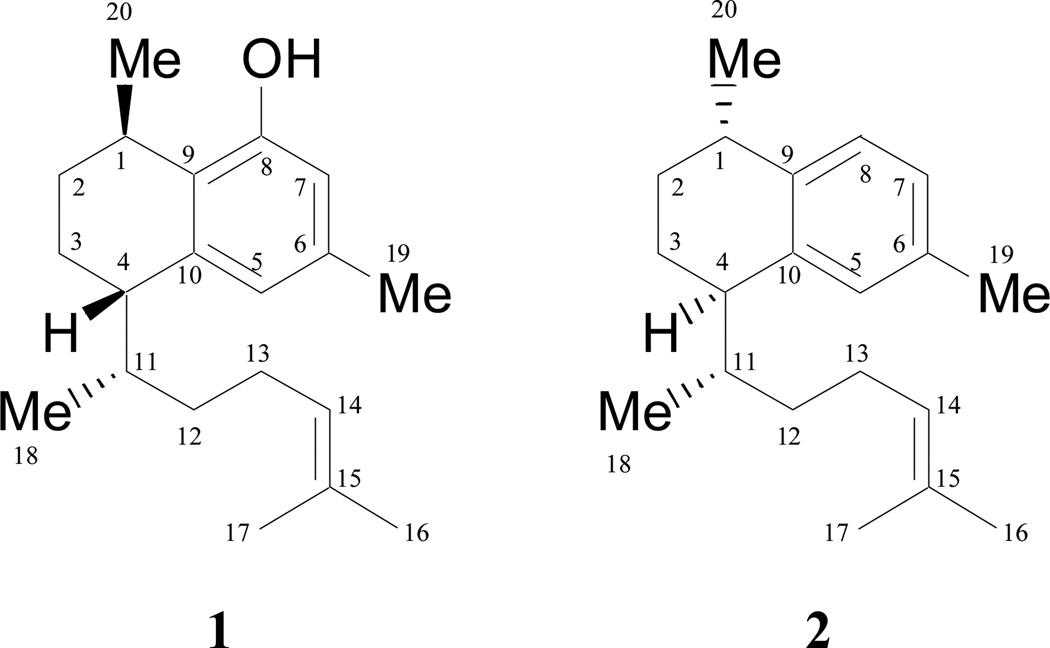
Bioactivity-guided fractionation of the methanolic root bark extract of Leucophyllum frutescens (Berl.) I.M. Johnst. led to the identification of leubethanol (1), a new serrulatane-type diterpene with activity against both multi drug-resistant and drug-sensitive strains of virulent Mycobacterium tuberculosis. Leubethanol (1) was identified by 1D/2D NMR data, as a serrulatane closely related to erogorgiane (2), and exhibited anti-TB activity with minimum inhibitory concentrations in the range 6.25–12.50 µg/mL. Stereochemical evidence for 1 was gleaned from 1D and 2D NOE experiments, 1H-NMR full spin analysis, as well as by comparison of the experimental vibrational circular dichroism (VCD) spectrum to density functional theory calculated VCD spectra of two diastereomers.
Keywords: Leucophyllum frutescens, Scrophulariaceae, diterpenes, structure elucidation, anti-tuberculosis activity, drug-resistant, full spin analysis, circular dichroism
Introduction
Infection with Mycobacterium tuberculosis affects about one third of the human population.1 In 2008, 11.1 million new cases and 1.8 million deaths from tuberculosis (TB) involving HIV-positive patients were reported.1 One of the major problems is the increase of multidrug and extensive resistant strains of M. tuberculosis,2 which leads to an urgent need of the synthesis of new anti-tuberculosis drugs3,4 or search from natural sources.5,6 Medicinal plants have attracted considerable attention as sources of novel natural products with intriguing novel structures and useful biological activities, including anti-TB activity.7
From the evaluation of the in vitro anti-TB activity of a panel of Mexican plant extracts, the MeOH extract obtained from the root bark of Leucophyllum frutescens (Berl.) I.M. Johnst. (Scrophulariaceae) was previously found to be the most active.8 Known as cenizo, L. frutescens is a medicinal plant of Mexican traditional medicine, which has long been used to treat lung complaints and specifically tuberculosis. A review of the literature revealed few phytochemical reports for the plant genus, with only one report each on the isolation of phytotoxic lignans from the species9 and on calmodulin inhibitors from the closely related L. ambiguum.10 Our work was aimed at the bioassay-guided isolation of the anti-TB active principles of L. frutescens and their detailed structure elucidation, including 13C INADEQUATE and 1H NMR full spin analysis, as well as by density functional theory (DFT) calculated vibrational circular dichroism (VCD) spectra of two diastereomers, which were compared in silico to the experimental VCD spectrum of 1.
Results and Discussion
The anti-TB active MeOH extract obtained from the root bark of L. frutescens was subjected to a bioassay-guided fractionation. After solvent partitioning, which concentrated the activity mainly in the n-hexane phase, this fraction was further purified by means of VLC and LPLC, to afford the active compound 1.
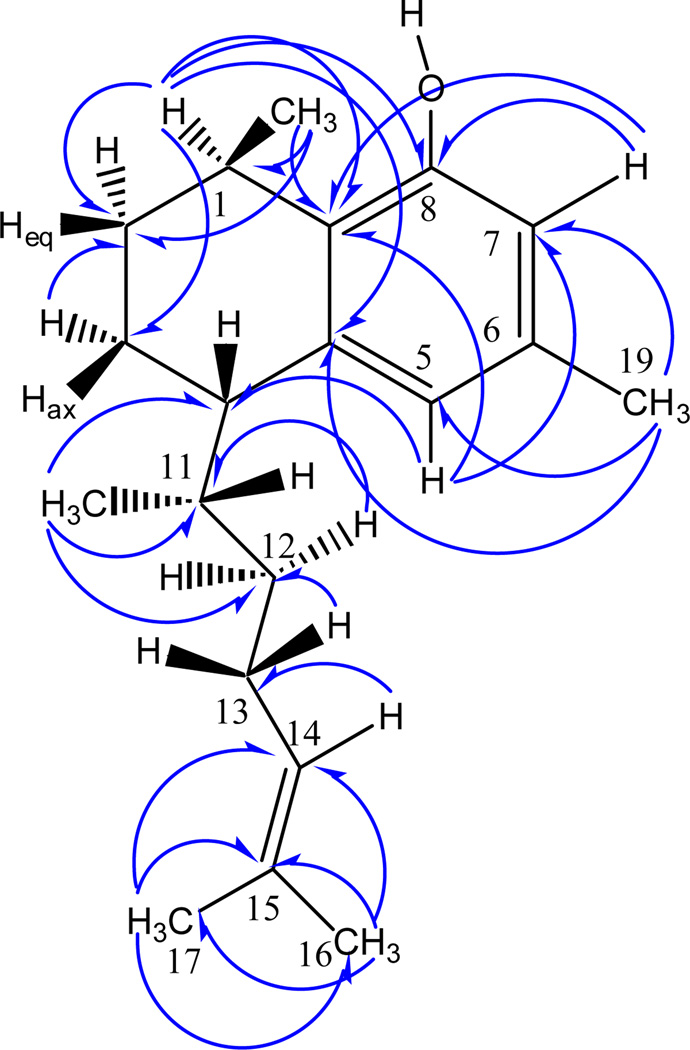
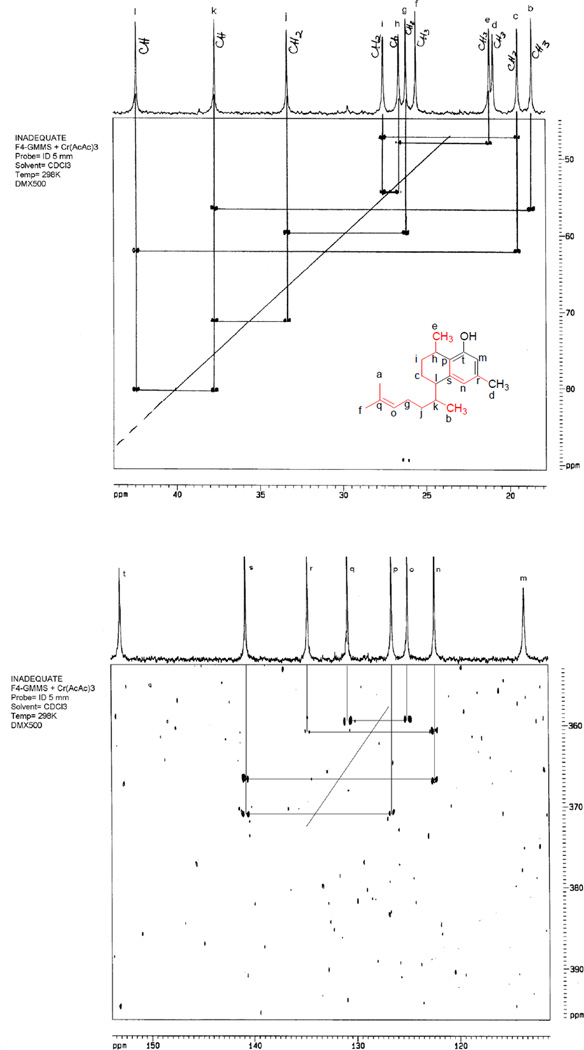
Compound 1 was obtained as colorless oil. HR-EIMS established a molecular formula of C20H30O. The UV maximum at 280 nm indicated the presence of an aromatic ring. The 1HNMR spectrum showed two meta-coupled protons at δ 6.448 and 6.615 indicating the presence of a 1,2,3,5-tetrasubsitituted benzene ring. Other 1H NMR features (Table 1) suggested that this compound was of terpenoid origin due to the presence of two methyl doublets at δ 0.984 and 1.224; a sharp three-proton singlet at δ 2.270 characteristic of an aromatic methyl; two broad methyl singlets at δ 1.582 and 1.683, characteristic of olefinic methyls, and two complex multiplets at δ 2.590 and 3.078, which suggested two benzylic hydrogens. The H,H-COSY and HMQC spectra indicated the presence of a single aliphatic spin system CH3-CH-(CH2)2-CH-CH-(CH3)-(CH2)2-CH=C(CH3)2. An olefinic proton at δ 5.018 exhibited cross peaks with both the olefinic methyls as well as one methylene group (δ 2.010 and 1.834, respectively). The latter methylene protons exhibited cross-peaks with a second methylene (δ 1.314 and 1.107) group, which in turn showed cross-peaks with a methine proton at δ 1.902; this methine proton showed correlations with the benzylic proton at δ 2.590 and a Me group at δ 0.984. The proton at δ 2.590 exhibited cross-peaks with the methylene protons at δ 1.870 and 1.740, which in turn showed cross-peaks with another methylene group at δ 1.967 and 1.520; the last methylene group showed cross-peaks with a methine proton at δ 3.078. Finally, coupling between this methine proton and a methyl group at δ 1.224 was observed. The 13CNMR spectrum exhibited 20 signals of a diterpenoid, including five methyl, four methylene, six methine and five quaternary carbons, as determined by a DEPT experiment. Their chemical shift values and multiplicity confirmed the presence of the tetrasubstituted aromatic ring. HMQC and HMBC experiments (Figure 1) were used to determine unambiguously the structure of the planar moiety and its attached aliphatic residues. Spectroscopic evidence was in agreement with compound 1 being a diterpene with a serrulatane-type skeleton, similar to erogorgiaene,11,12 bearing an OH substitution at C-7. A 13C-13C INADEQUATE experiment performed with 1 confirmed most of the C-C connectivity (Figure 2).
Table 1.
Results of the 1H NMR Full Spin Analysis of 1, Sorted by Chemical Shifts in Support of Figures 2 and 3.
| Hydrogen | δ in ppm | Multiplicity | J in Hz |
|---|---|---|---|
| CH3-18 | 0.984 | d | JH-11 = 6.84 |
| H-12b | 1.107 | dddd (ddt-like) | Jgem= −13.19, JH-11 = 10.02, JH-13b= 9.28, JH-13a= 4.86 |
| CH3-20 | 1.224 | d | JH-1 =6.97 |
| H-12a | 1.314 | dddd | Jgem= −13.19, JH-13a= 9.63, JH-13b= 6.94, JH-11= 2.96 |
| H-2eq | 1.520 | dddd (ddt-like) | Jgem= −13.35, JH-3ec = 5.20, JH-3ax= 3.52, JH-1 = 2.58 |
| CH3-17 | 1.582 | dd/brs [syn] | JH-14= 1.36, JH-13a= 0.89, JH-13b= 0 |
| CH3-16 | 1.683 | ddd (=pseudo q) [anti] | JH-14=1.38, JH-13a= 1.18, JH-13b= 1.14 |
| H-3eq | 1.740 | dddd | Jgem= −13.84, JH-2ec=5.00, JH-2ax=3.37, JH-4= 2.95 |
| H-13b | 1.834 | ddddq [broad] | Jgem= −14.37, JH-12b= 9.28, JH-14=7.60, JH-12a= 6.94, JCH3-16= 1.14, JCH3-17= 0 |
| H-3ax | 1.870 | dddd (tdd-like) | Jgem= −13.84, JH-2ax= 13.30, JH-4= 6.23, JH-2ec= 3.52 |
| H-11 | 1.902 | dddq [broad] | JH-12b= 10.02, JMe-18= 6.84, JH-4= 5.21, JH-12a= 2.96 |
| H-2ax | 1.967 | dddd (tdd-like) | Jgem= −13.25, JH-3ax = 13.25, JH-1 = 6.16, JH-3ec = 3.37 |
| H-13a | 2.010 | ddddqq [broad] | Jgem= −14.37, JH-12a= 9.63, JH-14=6.76, JH-12b= 4.86, 5JCH3-16 = 1.17, 5JCH3-17= 0.89 |
| CH3-19 | 2.270 | s | |
| H-4 | 2.590 | ddd | JH-3ax= 6.23, JH-11= 5.21, JH-3ec= 2.95 |
| H-1 | 3.078 | ddq | JCH3-20= 6.97, JH-2ax= 6.16, JH-2ec= 2.58 |
| H-14 | 5.018 | ddqq=ddquint | JH-13b= 7.60, JH-13a= 6.76, JCH3-16= 1.38, JCH3-17= 1.36 |
| H-7 | 6.448 | brd | JH-5= 1.64, JCH3-19=<0.20 |
| H-5 | 6.615 | dq [brd] | JH-7= 1.64, JH-4= 0.82, JCH3-19=<0.20 |
Figure 1.
HMBC correlations found for 1.
Figure 2.
13C-13C INADEQUATE experiment performed with 1 confirming most of the C-C connectivity.
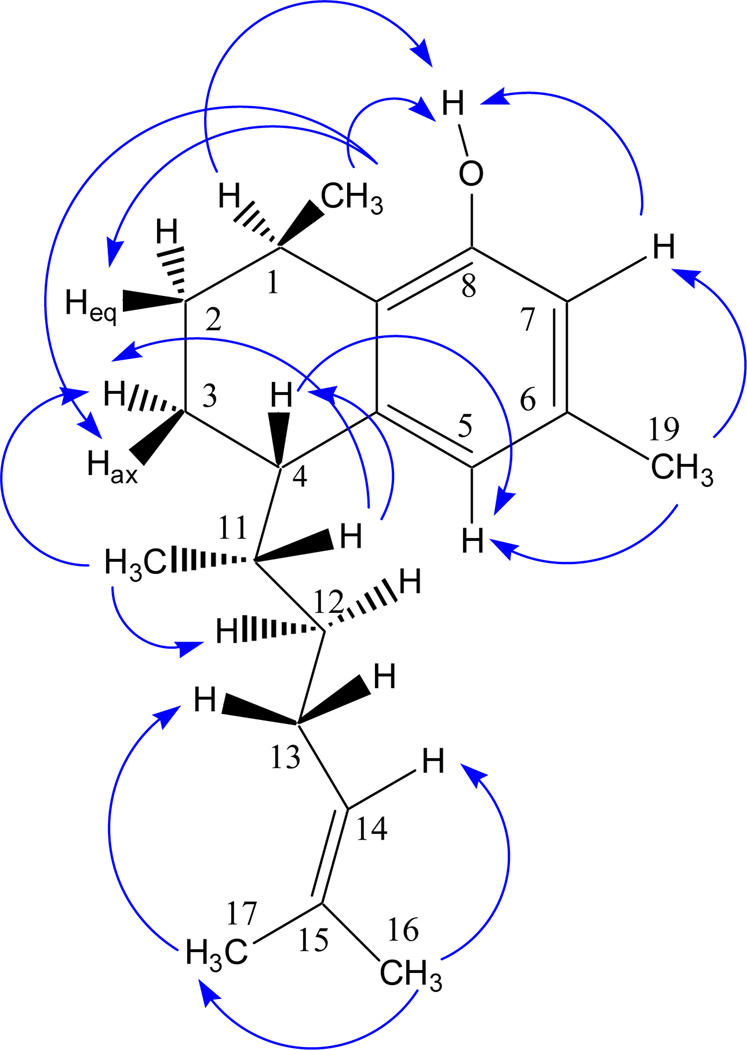
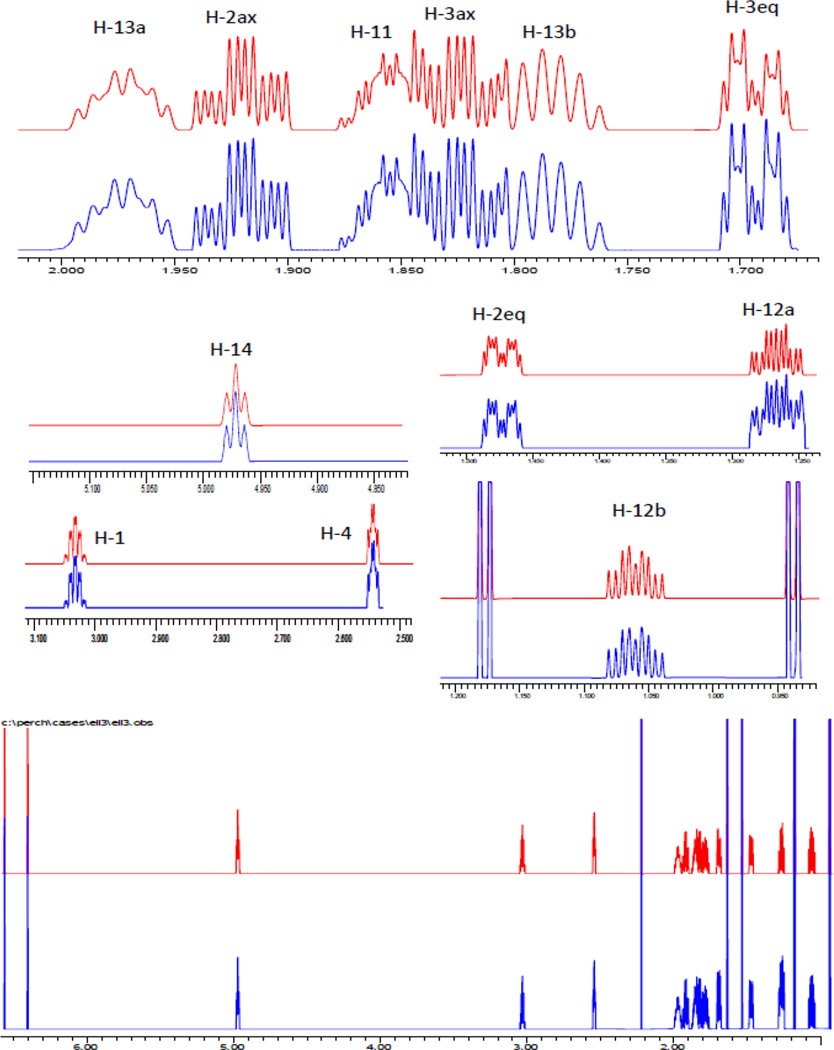
In order to establish the absolute configuration, a two-prong approach was taken: (a) NOE measurements (Figure 3) as well as a full spin analysis of the fingerprint characteristics of 1HNMR spectra resulting in full J coupling information provided evidence for the relative configuration (Figure 4); (b) VCD experiments led to the assignment of absolute configuration. For the former (a), taking into consideration the severe overlap in the upper field spectral range, high-resolution spectra were acquired at 900 MHz, and a full spin analysis was carried out by iteration of the 1H NMR spectra against the full δ/J parameter set using the PERCH tool which ultimately led to the determination of all spin-spin coupling constants (J). The methodology of full 1H NMR spin analysis has been pioneered by Laatikainen, Niemitz, and co-workers, and previously been documented for a few natural products including alkaloids and mono-, sesqui-, and diterpenes.13–17 The method involves iterated quantum-mechanical simulation of the entire spin system of the molecule until full congruence is achieved between the experimental and simulated spectrum.
Figure 3.
Observed NOE correlations for 1.
Figure 4.
Full 1H NMR spin analysis by PERCH iteration of 900 MHz data of compound 1 (simulated spectra in red; experimental spectra in blue).
The results of the 1H full spin analysis (900 MHz) of 1 are summarized in Table 1 and Figure 3. The coupling constants for proton pairs H-1/H-2ax and H-1/H-2eq were 6.16 and 2.58 Hz, respectively, and are consistent with the cyclohexene ring adopting a distorted chair conformation with H-1 being pseudo-equatorial. In an analogous way, as the couplings of H-4/H-3ax and H-4/H-3-eq were 6.23 and 2.95 Hz respectively, H-4 must be also pseudo-equatorial. Therefore, H-1 and H-4 are located on opposite faces of the molecule, consistent with 1S,4R or 1R,4S relative configuration. This was further supported by the NOE correlations of 1 (Figure 3): Irradiation of Me-20 (δ 1.224, d) reduced the intensity of signals at δ 1.520 (H-2eq) and 1.870 (H-3ax), confirming that they are co-facial.
Considering the negative specific rotation of 1, the configuration at C-1 and C-4 was assigned as 1R,4S, consistent with the rotation reported for (−)-erogorgiaene (syn. ent-erogorgiaene) isolated from the brown alga, Dictyota dichotoma.18 Due to the conformational flexibility of the aliphatic chain, it was problematic to determine the configuration at C-11 by means of NMR and molecular modeling. However, it was observed that the natural serrulatanes previously isolated from sea organisms exhibit an Me-18 signal in the 1HNMR spectrum at relative high fields (δ 0.64–0.79),11,12,18–20 while in serrulatanes isolated from terrestrial plants the analogous signals appear at lower field (δ 0.95–1.12 ppm).21–24 Harmat and co-workers25 assigned the stereochemistry at C-11 in different synthetic diastereomers of erogorgiane, taking into consideration the position of the signal from the C-18 methyl group. They concluded that the position of this signal was dependent of the spatial relationship between H-4 and Me-18 (syn vs. anti), which can be visualized when drawing the serrulatanes as presently shown for 1 and 2. In the syn compounds, Me-18 appears at higher fields, compared to lower field signals for the anti-series compounds. Therefore, considering that in 1 the Me-18 group appears at δ 0.984, H-4 and CH3-18 must be anti which suggests the S configuration at C-4. In order to test this hypothesis and confirm the NMR interpretation, a VCD analysis was performed, which eventually confirmed the 1R,4S,11S absolute configuration for compound 1.
Compound 1 is an interesting molecule for VCD studies as it contains the C8 chain frequently found in terpenoids, ranging from bisabolene sesquiterpenes like perezone,26 to sterols like desmosterol, which is the last biogenetic intermediate in the biosynthesis of cholesterol.27 Due to the high conformational mobility of the side chain, the C-11 configuration is difficult to determine, and therefore both C-11 diastereomers of 1 were considered. This, in turn, provides evidence for the sensitivity of the VCD method, since it rarely has been used to study epimers.28
Since rotational strength modes of VCD spectra depend on molecular conformation, initial searches for 1 and its 11R diastereomer were performed using a computational Monte Carlo MMFF94 molecular mechanics method, in a 10 kcal/mol gap using Spartan’04 (Wavefunction, Irvine CA, USA), which provided 199 and 193 conformers, respectively. All conformers were then submitted to DFT for single point calculations using the B3LYP functional and the DGDZVP basis set implemented in Gaussian 03 (Gaussian Inc., Pittsburg, PA, USA) which provided 54 and 40 conformers for 1 and its 11R epimer, respectively, in a 3 kcal/mol gap. These conformers were further optimized at 25 °C and 1 atmosphere by DFT//B3LYP/DGDZVP calculations to provide 13 and 23 conformers for 1 and its 11R epimer, respectively, in a 2 kcal/mol range. The number of conformers was further reduced by eliminating those contributing less than 2% to the overall distribution. Finally, frequency calculations were performed for 10 and 13 conformers whose free energy (ΔG = RT ln K) at 25 °C and population, for 1 and its C-11 epimer, are listed in Tables 2 and 3, while conformational freedom is shown in Figures 5 and 6, respectively.
Table 2.
Molecular Mechanics Relative Energy, Molecular Mechanics Population, DFT Thermochemical Parameters, and DFT Population for the 10 Minimum Energy Conformers of 1.
| conformer | ΔEMMFFa | pMMFFb | ΔE0c,d | ΔH298c,d,e | ΔG298c,d | pDFTf |
|---|---|---|---|---|---|---|
| 1a | 0.38 | 22.03 | 0.00 | 0.00 | 0.00 | 37.93 |
| 1b | 0.40 | 21.56 | 0.10 | 0.10 | 0.35 | 21.07 |
| 1c | 1.30 | 4.69 | 0.78 | 0.79 | 0.82 | 9.57 |
| 1d | 1.81 | 1.99 | 1.23 | 1.25 | 1.04 | 6.51 |
| 1e | 1.27 | 4.94 | 0.90 | 0.90 | 1.17 | 5.28 |
| 1f | 4.71 | 0.02 | 1.04 | 0.96 | 1.19 | 5.13 |
| 1g | 0.00 | 41.99 | 0.57 | 0.45 | 1.20 | 5.02 |
| 1h | 2.71 | 0.43 | 1.59 | 1.52 | 1.35 | 3.85 |
| 1i | 1.76 | 2.16 | 1.40 | 1.40 | 1.41 | 3.53 |
| 1j | 3.21 | 0.19 | 1.80 | 1.74 | 1.71 | 2.11 |
Molecular mechanics energy of conformers obtained from a systematic search, in kcal/mol relative to 1g with EMMFF = 43.842 kcal/mol.
Molecular mechanics population in %.
Sum of electronic and zero-point energies (ΔE0), thermal enthalpies (ΔH298) and thermal free energies (ΔG298) in kcal/mol relative to conformer 1a and calculated at 298 K and 1 atm.
For conformer 1a the absolute values are E0 = −855.044971 au, H298 = −855.020784 and G298 = −855.099078 au.
ΔE298 values equal to ΔH298 in all conformations.
DFT population in % calculated from ΔG298 values.
Table 3.
Molecular Mechanics Relative Energy, Molecular Mechanics Population, DFT Thermochemical Parameters, and DFT Population for the 13 Minimum Energy Conformers of the C-11 Diastereomer of 1.
| conformer | ΔEMMFFa | pMMFFb | ΔE0c,d | ΔH298e | ΔG298d | pDFTf |
|---|---|---|---|---|---|---|
| a | 1.20 | 7.35 | 0.00 | 0.00 | 0.00 | 18.23 |
| b | 1.13 | 8.26 | 0.19 | 0.18 | 0.04 | 16.92 |
| c | 1.19 | 7.47 | 0.10 | 0.08 | 0.26 | 11.79 |
| d | 2.17 | 1.41 | 0.75 | 0.80 | 0.36 | 9.97 |
| e | 1.06 | 9.33 | 0.48 | 0.41 | 0.46 | 8.32 |
| f | 2.53 | 0.78 | 1.41 | 1.47 | 0.69 | 5.67 |
| g | 2.63 | 0.67 | 1.11 | 1.18 | 0.80 | 4.69 |
| h | 2.62 | 0.66 | 1.11 | 1.17 | 0.85 | 4.31 |
| i | 2.24 | 1.27 | 1.33 | 1.38 | 0.86 | 4.29 |
| j | 3.32 | 0.20 | 1.30 | 1.29 | 0.88 | 4.16 |
| k | 0.00 | 55.45 | 0.63 | 0.52 | 0.89 | 4.07 |
| l | 2.05 | 1.74 | 1.18 | 1.18 | 0.91 | 3.90 |
| m | 1.38 | 5.41 | 1.04 | 0.96 | 0.95 | 3.68 |
Molecular mechanics energy of conformers obtained from a systematic search, in kcal/mol relative to 2k with EMMFF = 43.215 kcal/mol.
Molecular mechanics population in %.
Sum of electronic and zero-point energies (ΔE0), thermal enthalpies (ΔH298) and thermal free energies (ΔG298) in kcal/mol relative to conformer 2a and calculated at 298 K and 1 atm.
For conformer 2a the absolute values are E0 = −855.044838 au, H298 = −855.020732 and G298 = −855.098357 au.
ΔE298 values equal to ΔH298 in all conformations.
DFT population in % calculated from ΔG298 values.
Figure 5.
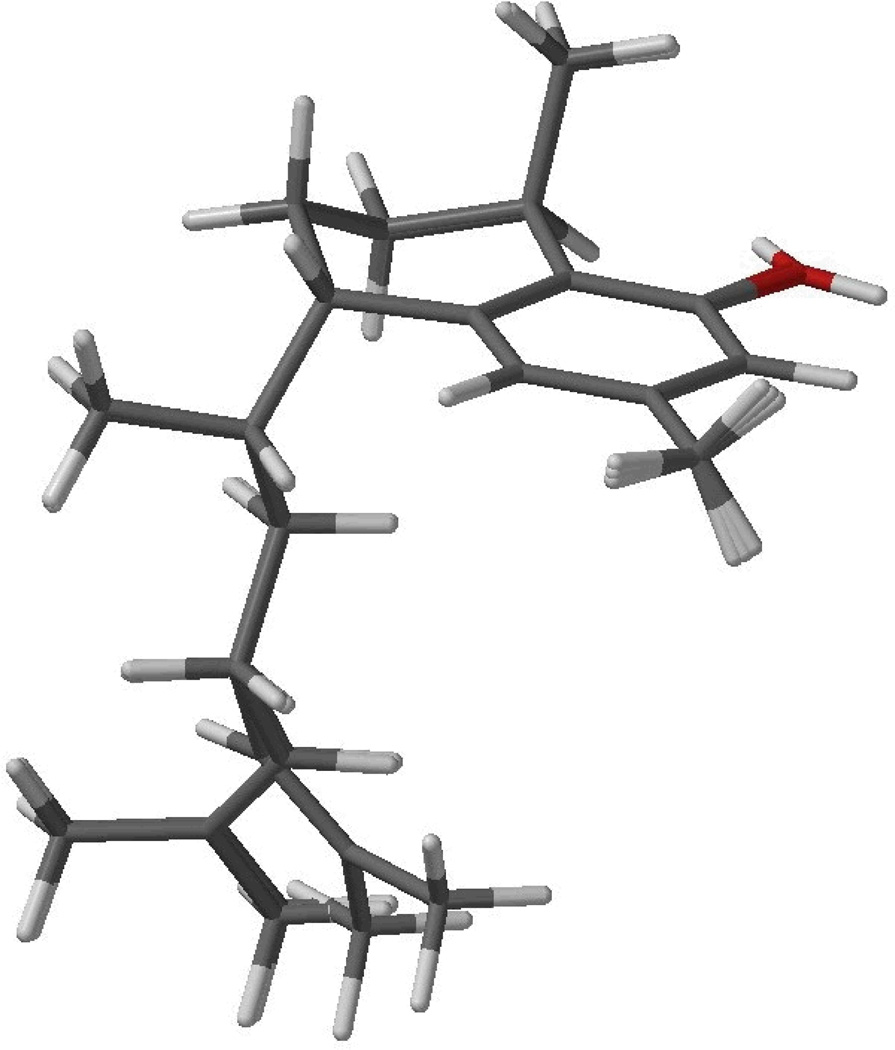
Superposition of the three low energy conformers of 1, calculated by DFT//B3LYP/DGDZVP, accounting for 68.6% of the conformational distribution according to Table 2.
Figure 6.
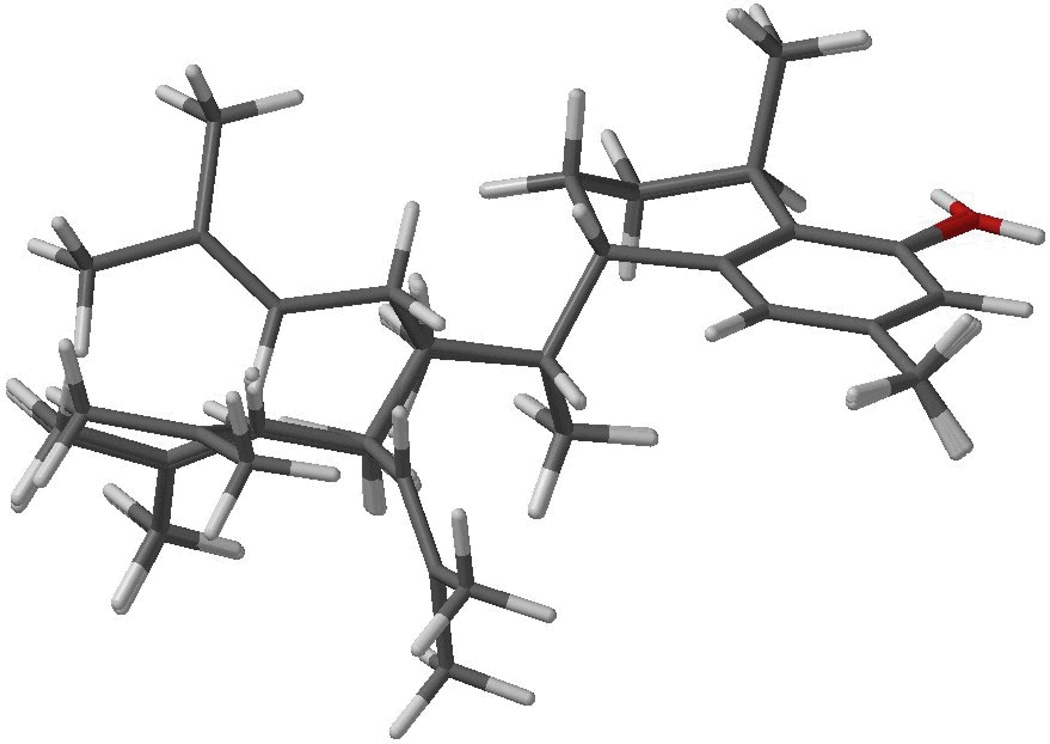
Superposition of the five low energy conformers of the 11R diastereomer of 1, calculated by DFT//B3LYP/DGDZVP, accounting for 65.2% of the conformational distribution according to Table 3.
Inspection of Tables 2 and 3 reveals that 1 has significantly reduced conformational mobility than its 11R counterpart, not only from the fact that the former shows 10 conformers compared to 13 for the latter, but also from the relative conformational freedom. In 1 three conformers account for two thirds of the conformational distribution, while for the 11R epimer five conformers are required for an equivalent conformational abundance. Inspection of Figures 5 and 6 reveals the steric interaction derived from the peri arrangement of the C-8 hydroxy group and and the C-1 secondary methyl group is responsible for the pseudo-axial nature of the secondary methyl group on a distorted chair conformation, in agreement with the 1H NMR observations.
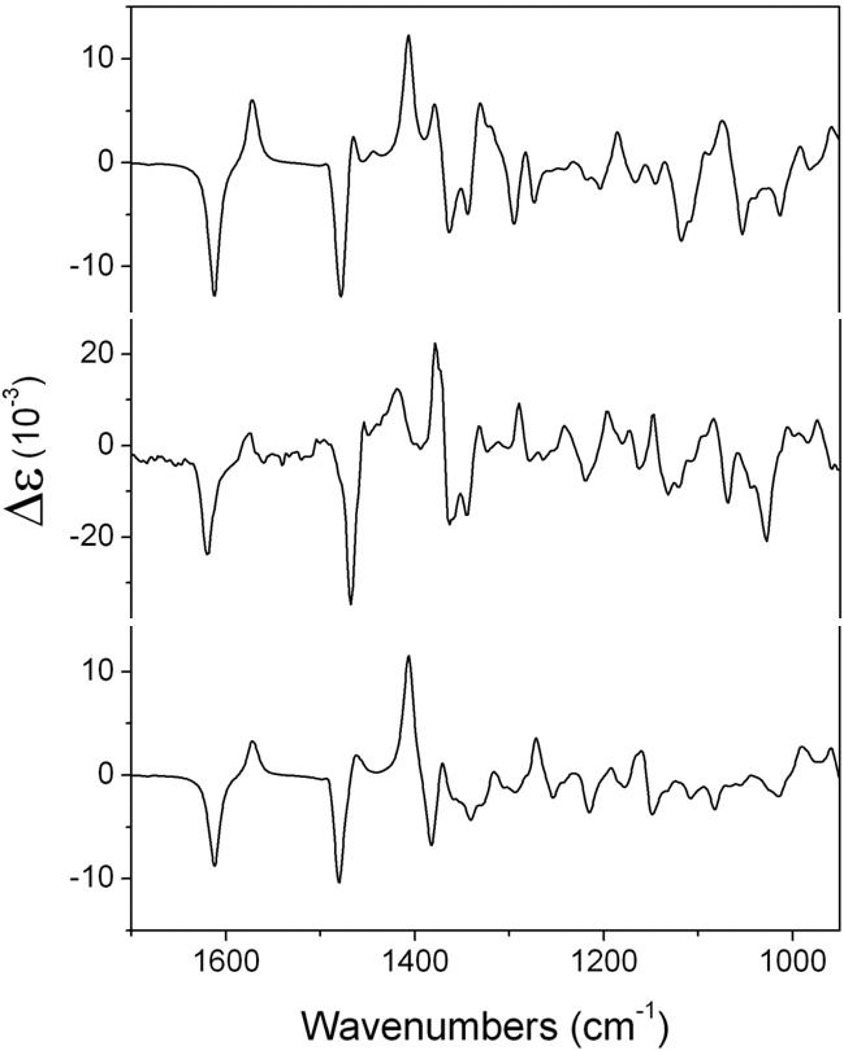
The IR and VCD calculated spectra were obtained from the dipole and rotational strengths using Lorentzian shapes, with a bandwidth of ν = 4 cm−1. The average data for 1 and its 11R diastereomer, calculated according to the abundances reported in Tables 2 and 3, were used for the spectral comparison shown in Figure 6, from which the 11S absolute configuration seems evident. However, a reliable band-to-band comparison of observed and calculated VCD spectra is crucial for configuration assignment since measured IR and VCD frequencies derive from an anharmonic force field while calculated frequencies derive from a harmonic force field. Thus, the latter data are normally scaled using an anharmonicity factor which was obtained using the commercial available confidence level algorithm software (BioTools Co., Jupiter, FL, 33458 USA) based on neighbourhood similarity29 that we recently applied for the study of 1R-(−)-myrtenal at several levels of theory.30 This algorithm uses a correlation function that describes the integrated overlap of the experimental and theoretical data as a function of a relative vibrational frequency shift, being the optimal shift known as the anharmonicity (anH) factor. Taking advantage of this methodology, the calculated spectra of both diastereomers were compared in silico to the experimental IR and VCD spectra of 1, the pertinent results being summarized in Table 4. Although the anH factor, a measure of band alignment of experimental and theoretical absorption signals, is similar, the IR spectral similarity (SIR) indicates the 11S configuration since for 1 it provides a value of 89.9 while for the 11R isomer no similarity is found. Further comparison data (Table 4) reveal that the VCD spectral similarity (SE) for 11S −1 is 70.6 and that of its enantiomer (S−E) is 13.6, while for the 11R alternative those values are 62.9 and 18.5, respectively, confirming the 11S absolute configuration. Finally, the calculated confidence level for 1 is 100%, in contrast to 42%, for the 11R epimer, a reasonable value for a comparison where the absolute configuration of two of three stereogenic centers are correct.
Table 4.
Confidence Level Data for the IR and VCD Spectra of 1 and its 11R-Diastereoisomer.
| Epimer | a anH | b SIR | c SE | d S−E | e ESI | f C |
|---|---|---|---|---|---|---|
| 1 | 0.968 | 89.9 | 70.6 | 13.6 | 57.0 | 100 |
| 11epi-1 | 0.974 | - | 62.0 | 18.5 | 43.5 | 76 |
Anharmonicity factor.
IR spectral similarity.
VCD spectral similarity for the correct enantiomer.
VCD spectral similarity for the incorrect enantiomer.
Enantiomer similarity index, calculated as the SE - S−E difference.
Confidence level for the stereochemical assignment.
Elisabethanol with the same planar structure as compound 1, is reported31 to have 1S,4R,11S configuration and, therefore, must be a different compound. Moreover, no information is available regarding the purification methodology or spectroscopic data obtained of elisabethanol, which essentially precludes structure dereplication. Taking these facts into consideration as well as the differences in stereochemistry, 1 must be considered a new natural product. Similar stereochemical considerations have been reported for synthetic congeners.36,37 In order to reflect the structural analogy with elisabethanol, the trivial name leubethanol is proposed for 1.
Of interest from a biological perspective, leubethanol exhibits significant activity against MDR resistant strains of M. tuberculosis such as CIBIN/UMF15:99, a clinical isolate that is resistant to all five first-line anti-TB drugs, streptomycin, isoniazid, rifampin, ethambutol, and pyrazinamide. Table 3 shows the MIC values of 1 against the clinical isolates of M. tuberculosis, compared with those of first-line anti-TB drugs. Another noteworthy feature of leubethanol is its increased activity against MDR strains compared to the drug-sensitive strain, H37Rv. Anti-TB activities with MIC values of around 10 µg/mL are in line with literature reports on serrulatanes: the structurally related 7-hydroxyerogorgiaene from the gorgonian octocoral, Pseudopterogorgia elisabethae, showed 77 % growth inhibition of M. tuberculosis H37Rv at 6.25 µg/mL.11 While MIC values in the 10 µg/mL range are considered moderate activities in TB drug discovery projects, the potency of leubethanol is still noteworthy as it is 16 times more potent against MDR M. tuberculosis than the first-line anti-TB drugs streptomycin and rifampin. Therefore, the serrulatane diterpenes such as 1 represent potential leads for the development of anti-TB treatment of drug-resistant TB infections.
Experimental Section
General Experimental Procedures
UV Vis spectra were measured on a Beckman DU 7500 spectrophotometer. Optical rotation and IR were determined with a Perkin Elmer 341 polarimeter and a Perkin Elmer FT-IR Spectrum-One spectrometer, respectively. 1H NMR spectra were measured at 400 and 900 MHz on a DPX 400 and Avance 900 MHz NMR spectrometers (Bruker, Zurich, Switzerland) in CDCl3 as the solvent and 13C NMR spectra were measured at 100 MHz on a DPX 400 NMR spectrometer (Bruker, Zurich, Switzerland) in CDCl3 as the solvent. Chemical shifts are expressed in ppm and were referenced to TMS using the signals from the solvent (δH 7.260, δC 77.000 relative to TMS) as internal standard. NMR data were processed with NUTS (Pro version for Microsoft Windows, Acorn NMR Co., USA). The ultra high-resolution 900 MHz 1H NMR spectra were acquired with 64 K data points and zero-filled to 256 K data points prior to applying window functions (LG, EM) and Fourier transformation. The resulting digital resolution (real data points) exceeded 0.0001 ppm. Considering the higher order spin systems, the magnitude of small J couplings, and the total RMS of the spectral iteration (0.21 Hz), chemical shifts are reported to 0.001 ppm precision. Carbon multiplicities were determined by means of DEPT-135 and DEPT-90 (Bruker Avance DPX 400, at 100.62 MHz). NOE experiments were carried out under the following conditions: 5 mg of dry compound 1, 0.5 mL of CDCl3 100 % d as solvent, degassing of the sample with Argon gas, relaxation time D1 = 1.5 s, decoupler power level for presaturation pL14 = 70 db, on a Bruker Avance DPX 400 spectrometer at 400.13 MHz. PERCH NMR software from Perch Solutions, Kuopio (Finland) was employed for the 1H NMR spin system analysis. The HR ESMS was obtained on a Waters-Micromass Q-TOF micro. Column chromatography was performed on Sigel for TLC or LiChroprep RP-18 Lobar columns (Merck, 240× 10 and 310 × 25). Analytical HPLC was carried out on a Waters 600 (DAD detector) with a C-18 symmetry column (150 × 3.9 mm, 5 µm); elution was accomplished with a gradient of MeOH-H2O. All the solvents used were analytical grade.
Plant Material
L. frutescens was collected in Monterrey N.L. in October 2003. A voucher number specimen has been deposited in the herbarium of the Faculty of Biology, UANL (024165). It was authenticated by Biol. Marco Antonio Guzmán and M.C. María del Consuelo González de la Rosa, Faculty of Biology. UANL.
Extraction, Fractionation, and Isolation of Compounds
Root bark (200 g) of L. frutescens was air-dried, pulverized and extracted with 3 × 600 mL of MeOH at room temperature. The pooled methanolic extracts were evaporated to dryness in vacuo to yield 15.8 g of viscous mass. Liquid-liquid partition was carried out with n-hexane, EtOAc and n-BuOH. The active n-hexane fraction (5.7 g) was evaporated under reduced pressure and subjected to silica gel VLC using n-hexane-EtOAc (100:0 to 1:1 v/v) to give nine fractions (FVLC-1 to FVLC-9 in order of increasing polarity). The more active fraction FVLC-2 (812 mg) was further fractionated by RP-LPC (cartridge 310 × 25) with mixtures of 300 mL MeOH:H2O of increasing polarity. Six fractions were obtained, with FLP-3 (65 mg) and FLP-4 (250 mg) being the most active. Purification of these fractions were done with RP-LPC (cartridge of 240 X 10 and flow of 2 mL/min) using 60 mL of a gradient of MeOH:H2O. One active compound 1 (216 mg) was isolated.
Compound 1: colorless oil; [α]D −32 (c 0.15, CHCl3); UV (MeOH) 283.5 nm and 276.0 nm; IR (ATR) ν max 3463, 2922, 1618, 1578, 1451, 838 cm −1; 1HNMR (CDCl3, 400 MHz) see Table 1; 13C NMR (CDCl3, 100 MHz): δ 17.49 (C-17, CH3), 18.64 (C-18, CH3), 19.43 (C-3, CH2), 20.96 (C-19, CH3), 21.13 (C-20, CH3), 25.59 (C-16, CH3), 26.16 (C-13, CH2), 26.56 (C-1, CH), 27.47 (C-2, CH2), 33.33 (C-12, CH2), 37.74 (C-11, CH), 42.37 (C-4, CH), 113.25 (C-7, CH), 122.30 (C-5, CH), 124.91 (C-14, CH), 126.38 (C-9, C), 130.95 (C-15, C), 134.83 (C-6, C), 140.81 (C-10, C), 153.01 (C-8, C); HR-ES-MS: m/z 287.2182 (2.56% BPI // 0.48 %TIC), 175 (100.00% BPI // 18.83 %TIC) m/z 287.2182 (M + H) (calcd. for C20H31O, 287.2376).
Anti-TB Bioassay
The anti-M. tuberculosis activity was assessed against M. tuberculosis H37Rv ATTC 27294 susceptible to all five first-line anti-TB drugs, streptomycin, isoniazid, rifampin, ethambutol, and pyrazinamide and CIBIN/UMF15:99, a clinical isolate resistant to the same drugs in a modified Microplate Assay Blue Alamar.32 The resistant M. tuberculosis strain (MDR) was isolated, identified, and characterized in the Mycobacteriology Laboratory of the Centro de Investigación Biomédica del Noreste, Instituto Mexicano del Seguro Social in Monterrey México, from a patient with advanced pulmonary TB. The organic extracts, fractions, and compounds for M. tuberculosis bioassays were prepared at a concentration of 2 mg/mL in 20% DMSO in Middlebrook 7H9 (Becton Dickinson and Co., Sparks MD, USA) broth. All solutions were sterilized by filtration using 13 mm diameter PTFE acrodiscs (0.22 µm pore size, Millipore Co., Bedford, MA, USA). The concentrations for organic extracts, fractions, and compounds used ranged from 100 µg/mL to 0.78 µg/mL. Results are reported as minimal inhibition concentration (MIC). All biological assays were developed at least in triplicate.
VCD Analysis and Calculations
A sample of 9.8 mg of 1 was dissolved in 150 µL of 100% CDCl3, placed in a BaF2 cell with a pathlength of 100 µm and data were acquired on a BioTools BOMEM ChiralIR FT-VCD spectrophotometer, equipped with dual photoelastic modulation, operated at a resolution of 4 cm−1 during 4 h. The sample stability was verified by 1H NMR measurement at 300 MHz on a Varian Mercury spectrometer using a 99.8% atom-D CDCl3 solution containing TMS as the internal standard immediately before and after VCD measurements. Geometry optimizations for both C-11 diastereomers were done using the MMFF94 force-field calculations as implemented in the Spartan’04 program. A Monte Carlo search protocol was carried out considering an energy cut-off of 10 kcal/mol providing 199 conformers for 1 and 193 for the 11R diastereoisomer. All conformers were optimized by single point DFT calculations at the B3LYP/ DGDZVP level of theory, and those found in the 3 kcal/mol gap (54 for 1, and 40 for its 11R epimer) were optimized using DFT//B3LYP/DGDZVP methodology33–35 implemented in the Gaussian 03W program. The 13 and 23 minimized structures found in the 2 kcal/mol window were further reduced by eliminating those conformers contributing less than 2% to the overall distribution to provide 10 and 13 conformers that were used to calculate the IR and VCD frequencies. The geometry optimization and vibrational calculations required between 12 and 20 h of computational time per conformer when using a desktop personal computer with 2 Gb RAM and operated with a 3 GHz processor.
Supplementary Material
Figure 7.
Comparison of the experimental (center) VCD spectrum of 1 and the theoretical VCD spectra of 1 (top) and its C-11 diastereomer (bottom) calculated by DFT/B3LYP/DGDZVP.
Chemical Chart.
Table 5.
Anti-M. tuberculosis Activity of 1 in Comparison with First Line Anti-TB Drugs.
| MIC (µg/mL) vs M. tuberculosis | ||
|---|---|---|
| H37Rv strain | MDR strain | |
| 1 | 12.5 | 6.3 |
| streptomycin | 0.50 | >100 |
| isoniazide | 0.06 | 3.1 |
| rifampin | 0.06 | >100 |
| ethambutol | 2.0 | 8.0 |
MIC: minimal inhibition concentration.
M. tuberculosis H37Rv strain is sensitive to all five fist-line anti-TB drugs and
CIBIN/UMF15:99 a MDR clinical isolated resistant to the above drugs.
Acknowledgement
The authors acknowledge financial support from CONACYT-México (grants 36544-N and 61122, and a doctoral fellowships for GMMS), IMSS (FOFOI: 2005/1/I/021), UANL (PAICYT), and CYTED (Project PIBATUB X.11). Ivonne Carrera is acknowledged for her technical assistance in the extraction procedures. Furthermore, GFP is indebted to Matthias Niemitz, Perch Solutions Ltd, and Reino Laatikainen, University of Kuopio and, both in Kuopio, Finland, for helpful discussions and PERCH support. The purchase of the 900 MHz NMR spectrometer and construction of the UIC Center for Structural Biology were funded by NIH Grant GM068944.
Footnotes
Supporting Information
NMR spectra of 1 are available free of charge via the Internet at http://pubs.acs.org.
References and Notes
- 1. [Accessed on December 8, 2010]; http://www.who.int/tb/publications/global_report/2009/en/index.html. [Google Scholar]
- 2. [Accessed on December 8, 2010]; http://www.who.int/tb/publications/global_report/2010/en/index.htm. [Google Scholar]
- 3.Palomino JC, Ramos DF, da Silva PA. Curr. Med. Chem. 2009;16:1898–1904. doi: 10.2174/092986709788186066. [DOI] [PubMed] [Google Scholar]
- 4.Rivers EC, Mancera RL. Drug. Discov. Today. 2008;13:1090–1098. doi: 10.1016/j.drudis.2008.09.004. [DOI] [PubMed] [Google Scholar]
- 5.Negi AS, Kumar JK, Lugman S, Saikia D, Khanuja SP. Med. Res. Rev. 2010;30:603–645. doi: 10.1002/med.20170. [DOI] [PubMed] [Google Scholar]
- 6.de Souza MV. Fitoterapia. 2009;80:453–460. doi: 10.1016/j.fitote.2009.07.010. [DOI] [PubMed] [Google Scholar]
- 7.Copp BR, Pearce AN. Nat. Prod. Rep. 2007;24:278–297. doi: 10.1039/b513520f. [DOI] [PubMed] [Google Scholar]
- 8.Molina-Salinas GM, Pérez-López A, Becerril-Montes P, Salazar-Aranda R, Said-Fernández S, Waksman de Torres N. J. Ethnopharmacol. 2007;109:435–441. doi: 10.1016/j.jep.2006.08.014. [DOI] [PubMed] [Google Scholar]
- 9.Rimando AM, Dayan FE, Mikell JR, Moraes RM. Natural Toxins. 1999;7:39–43. doi: 10.1002/(sici)1522-7189(199902)7:1<39::aid-nt38>3.0.co;2-2. [DOI] [PubMed] [Google Scholar]
- 10.Rojas S, Acevedo L, Macías M, Toscano RA, Bye R, Timmermann B, Mata R. J. Nat. Prod. 2003;66:221–224. doi: 10.1021/np020346i. [DOI] [PubMed] [Google Scholar]
- 11.Rodriguez AD, Ramirez C. J. Nat. Prod. 2001;64:100–102. doi: 10.1021/np000196g. [DOI] [PubMed] [Google Scholar]
- 12.Ata A, Kerr RG, Moya CE, Jacobs RS. Tetrahedron. 2003;59:4215–4222. [Google Scholar]
- 13.Niemitz M, Laatikainen R, Chen SN, Kleps R, Kozikowski AP, Pauli GF. Magn. Reson. Chem. 2007;45:878–882. doi: 10.1002/mrc.2061. [DOI] [PubMed] [Google Scholar]
- 14.Scher J, Schinkovitz A, Zapp J, Wang Y, Franzblau SG, Becker H, Lankin DC, Pauli GF. J. Nat. Prod. 2010;73:656–663. doi: 10.1021/np900806j. [DOI] [PubMed] [Google Scholar]
- 15.Kolehmainen E, Laihia K, Laatikainen R, Vepsalainen J, Niemitz M, Suontamo R. Magn. Reson. Chem. 1997;35:463–467. [Google Scholar]
- 16.Inui T, Wang Y, Nikolic D, Smith D, Franzblau S, Pauli GF. J. Nat. Prod. 2010;73:563–567. doi: 10.1021/np900674d. [DOI] [PubMed] [Google Scholar]
- 17.Kolesnikova S, Kaliniovsk A, Fedorov S, Shubina L, Stonik V. Phytochemistry. 2006;67:2115–2119. doi: 10.1016/j.phytochem.2006.05.041. [DOI] [PubMed] [Google Scholar]
- 18.Rodriguez II, Shi YP, García OJ, Rodriguez AD, Mayer AMS, Sánchez JA, Ortega-Barria E, González J. J. Nat. Prod. 2004;67:1672–1680. doi: 10.1021/np049802o. [DOI] [PubMed] [Google Scholar]
- 19.Yan-Ping S, Wei X, Rodríguez II, Rodríguez AD, Mayer AMS. Eur. J. Org. Chem. 2009;4:493–502. [Google Scholar]
- 20.Scher J, Schinkovitz A, Zapp J, Wang Y, Franzblau SG, Becker H, Lankin DC, Pauli GF. J. Nat. Prod. 2010;73:656–663. doi: 10.1021/np900806j. [DOI] [PubMed] [Google Scholar]
- 21.Liu Q, Harrington D, Kohen JL, Vermulpad S, Jamie JF. Phytochemistry. 2006;67:1256–1261. doi: 10.1016/j.phytochem.2006.04.014. [DOI] [PubMed] [Google Scholar]
- 22.Smith JE, Tucker D, Watson K, Jones GL. J. Ethnopharmacol. 2007;112:386–393. doi: 10.1016/j.jep.2007.03.031. [DOI] [PubMed] [Google Scholar]
- 23.Ndi CP, Semple SJ, Griesser HJ, Pyke SM, Barton MD. Phytochemistry. 2007;68:2684–2690. doi: 10.1016/j.phytochem.2007.05.039. [DOI] [PubMed] [Google Scholar]
- 24.Ndi CP, Semple SJ, Griesser HJ, Pyke SM, Barton MD. J. Nat. Prod. 2007;70:1439–1443. doi: 10.1021/np070180r. [DOI] [PubMed] [Google Scholar]
- 25.Harmata M, Hong X, Schreiner R. J. Org. Chem. 2008;73:1290–1296. doi: 10.1021/jo701935s. [DOI] [PubMed] [Google Scholar]
- 26.Burgueño-Tapia E, Castillo L, González-Coloma A, Joseph-Nathan P. J. Chem. Ecol. 2008;34:766–771. doi: 10.1007/s10886-008-9495-2. [DOI] [PubMed] [Google Scholar]
- 27.Joseph-Nathan P, Mejía G, Abramo-Bruno D. J. Am. Chem. Soc. 1979;101:1289–1291. [Google Scholar]
- 28.Muñoz MA, Chamy C, Carrasco A, J. Rovirosa JA, San Martín A, Joseph-Nathan P. Chirality. 2009;21:E208–E214. doi: 10.1002/chir.20801. [DOI] [PubMed] [Google Scholar]
- 29.Kuppens T, Vandyck K, Van der Eycken J, Herrebout W, Van der Vecken BJ, Bultinck P. J. Org. Chem. 2005;70:9103–9114. doi: 10.1021/jo050666h. [DOI] [PubMed] [Google Scholar]
- 30.Burgueño-Tapia E, Zepeda LG, Joseph-Nathan P. Phytochemistry. 2010;71:1158–1161. doi: 10.1016/j.phytochem.2010.04.005. [DOI] [PubMed] [Google Scholar]
- 31.Jacobs RS, Kerr RG. Anti-inflammatory Compounds Derived from Pseudopterogorgia elisabethae. PCT Int. Appl. 2002:44. CODEN: PIXXD2 WO 2002044191 A2 20020606 CAN 137:15779 AN 2002:428919 CAPLUS. [Google Scholar]
- 32.Molina-Salinas GM, Ramos-Guerra MC, Vargas-Villarreal J, Mata-Cárdenas BD, Becerril-Montes P, Said-Fernandez S. Arch. Med. Res. 2006;37:45–49. doi: 10.1016/j.arcmed.2005.04.010. [DOI] [PubMed] [Google Scholar]
- 33.Parr RG, Yang W. Density-Functional Theory of Atoms and Molecules. Oxford: Oxford Univ. Press; 1989. [Google Scholar]
- 34.Godbout N, Salahub DR, Andzelm J, Wimmer E. Can. J. Chem. 1992;70:560–571. [Google Scholar]
- 35.Sosa C, Andzelm BC, Elkin E, Wimmer E, Dobbs KD, Dixon DA. J. Phys. Chem. 1992;96:6630–6636. [Google Scholar]
- 36.Davies HML, Dai Z. Tetrahedron. 2006;62:10477–10484. [Google Scholar]
- 37.Dai X, Wan Z, Kerr RG, Davies HM. J. Org. Chem. 2007;72:1895–1900. doi: 10.1021/jo0618167. [DOI] [PubMed] [Google Scholar]
Associated Data
This section collects any data citations, data availability statements, or supplementary materials included in this article.


