

Abstract
It is often an immense challenge to overexpress human membrane proteins at levels sufficient for structural studies. The use of Human Embryonic Kidney 293 (HEK 293) cells to express full-length human membrane proteins is becoming increasingly common, since these cells provide a near-native protein folding and lipid environment. Nevertheless, the labour intensiveness and low yields of HEK 293 cells and other mammalian cell expression systems necessitate the screening for suitable expression as early as possible. Here we present our methodology used to generate constructs of human membrane proteins and to rapidly assess their suitability for overexpression using transiently transfected, glycosylation-deficient GnT I −/− HEK 293 cells (HEK 293S). Constructs, in the presence or absence of a C-terminal Enhanced Green Fluorescence Protein (EGFP) molecule, are made in a modular manner, allowing for the rapid generation of several combinations of fusion tags and gene paralogues/orthologues. Solubilization of HEK 293S cells, using a range of detergents, followed by Western blotting is performed to assess relative expression levels and to detect possible degradation products. Fluorescence-detection size exclusion chromatography (FSEC) is employed to assess expression levels and overall homogeneity of the membrane proteins, to rank different constructs for further downstream expression trials. Constructs identified as having high expression are instantly suitable for further downstream large scale transient expression trials and stable cell line generation. The method described is accessible to all laboratory scales and can be completed in approximately three weeks.
Keywords: human membrane proteins, overexpression, HEK293, transient transfection, FSEC, detergent screening
1. Introduction
Human embryonic kidney cells have been successfully utilized to overexpress a wide variety of mammalian membrane proteins (1-3), including that of human Rh family, C Glycoprotein (RhCG) whose x-ray crystal structure was recently determined in our laboratory (4). With respect to the overexpression of human membrane proteins for structural studies, the advantages that HEK 293 cells, as well as other mammalian cells such as Chinese Hamster Ovary (CHO), possess over lower order expression systems such as Escherichia coli, yeast, and insect cells are clear; the human membrane protein of interest is presented with near native translocation machinery, post-translational modifications, and lipid milieu that can be of critical importance in the biosynthesis of functional human membrane proteins (5, 6). Despite these inherent advantages, it is often an immense challenge to overexpress human membrane proteins in HEK 293 cells. While examples of robust expression levels of human membrane proteins in HEK 293 cells have been described (3), it might be reasonably expected that these examples represent the exception and that modest yields are to be typically expected (4, 7, 8).
To this end, it can be of critical importance to screen a variety of human membrane protein expression constructs for both expression levels and homogeneity, and to assess whether or not these expression constructs are tractable for structural studies. Several variables have been shown to have a pronounced effect on expression level, homogeneity, and crystallizability of membrane proteins, including affinity tag type and location (9), codon usage (10), detergent type (11), truncations (12), paralogues or orthologues (13), ligands (14), and lipids (15, 16). Fortunately, many of these variables can be initially assessed in a facile manner in transiently transfected HEK 293 cells, and do not require the lengthy time scales associated with stable cell line generation. For instance, fluorescence-detection size exclusion chromatography (FSEC) has been shown to possess sufficient sensitivity to screen a number of human P2X receptor paralogues from small-scale, transiently transfected HEK 293 cells (13).
In this manuscript, we describe in detail the methods that we employ to both generate human membrane protein expression constructs and to rapidly assess their suitability for expression by using transiently transfected, glycosylation-deficient GnT I −/− HEK cells (HEK 293S) (17). Our criteria for suitability is that there would be a reasonable expectation that the human membrane protein of interest would be, subsequent to stable cell line generation and protein purification, pure and homogeneous with a final yield of greater than ~0.05 mg of protein per liter of cell culture medium. While these yields are modest, the continued miniaturization of the crystallization screening process allows us to typically screen human membrane proteins purified from medium-scale (~3-6 L) spinner flask HEK 293S cell cultures, circumventing the requirement for larger-scale (~10-20 L) HEK 293S cell cultures until bona fide crystal hits are generated. Our application for these methods are ultimately aimed towards the structure determination of human membrane proteins via x-ray crystallography, nevertheless, the methodologies described in this manuscript are of general interest, and are entirely accessible, to those that are interested in assessing human membrane proteins expressed in HEK 293S for expression and/or homogeneity.
2.1 Construct design and cloning
The expression constructs described in this manuscript are all derived from the tetracycline inducible mammalian cell expression vector pACMV-tetO (18). Inducible expression vectors offer the advantage of delaying transgene expression until high density cell cultures are established, therefore offsetting the toxicity effects associated with the overexpression of certain human membrane proteins constitutively (19). In our experience, a wide variety of human membrane proteins can be subcloned into vectors derived from pACMV-tetO and transfected into HEK 293S cells with little adverse effect on cell viability.
2.1.1 Generation of expression constructs for HEK-293S cell expression
Various paralogues/orthologues and N- and C-terminal truncations can be subcloned into pACMV-tetO, whereby a two-step PCR protocol introduces N- and/or C-terminal affinity tags to the expression construct via PCR primers (Figure 1). In our experience, we have typically utilized an N-terminal FLAG and/or a C-terminal His10 affinity tag for the purification of human or mammalian membrane proteins from HEK 293S cell cultures, nevertheless, the cloning protocol described below can in principle be applied to any affinity tag that is short enough to be introduced via a PCR primer (Table 1). This may be of benefit given the pronounced effect that both affinity tag type and location can have on membrane protein expression and homogeneity (9). In those cases which possess an N-terminal signal sequence, either cleavable or non-cleavable, we typically utilize a sole C-terminal His10 affinity tag.
Figure 1. Two-step PCR schematic.

Individual PCR steps are enclosed in blue boxes and labelled as PCR I and PCR II. The primers are labelled as 3C, Thrombin, FLAG, and 10x HIS for simplicity. The image is not drawn to scale. See the text and Table 1 for details.
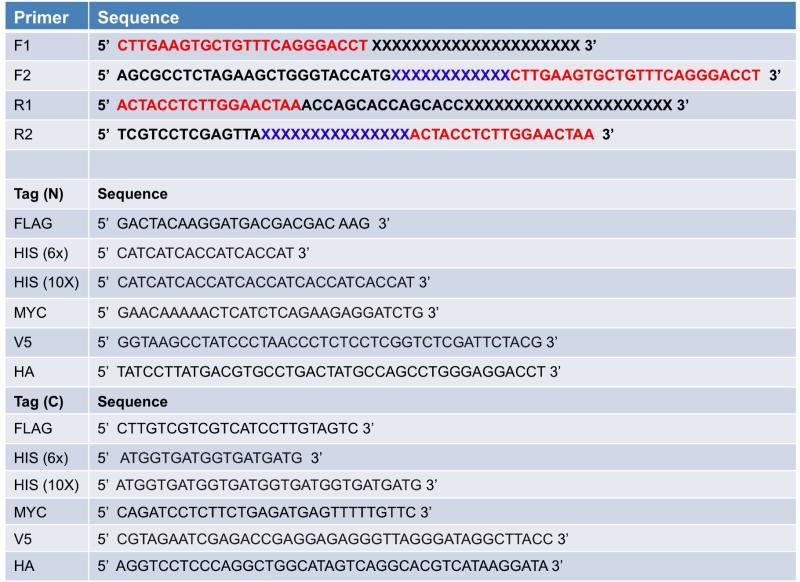
Table 1.
PCR primers used for introducing affinity tags into pACMV-tetO. For the F1 and R1 primers, nucleotides that anneal to the transgene are depicted as a black X. For the F2 and R2 primers, the sequence of the affinity tag is depicted as a blue X. In order to design the F2 and R2 primers, consult the table for the appropriate affinity tag (N or C) and insert the corresponding sequence into either F2 (for an N-terminal tag) or R2 (for a C-terminal tag). In all sets of primers, red nucleotides correspond to sequence that encodes for a protease site (either 3C or thrombin).
|
The primers for the first PCR step (F1 and R1, see Table 1) are designed to introduce 3C and/or thrombin protease restriction sites N- and/or C-terminal to the transgene, respectively. The primers possess approximately 25 nucleotides of overlapping sequence with the transgene, ensuring that the C-terminal primer (R1) does not anneal with the stop codon of the transgene. In the case of the C-terminal primer (R1), sufficient spacer sequence (15 nucleotides, 5 amino acid Gly/Ala repeat) between the C-terminus of the transgene and the thrombin site are introduced to facilitate tag removal via thrombin. Interestingly, we have observed that in several cases the presence of this spacer sequence at the C-terminus increases the apparent expression levels of human membrane proteins as assessed via Western blotting against N-terminal affinity tags (Figure 2), suggesting that the presence or absence of spacer sequence may represent an additional variable to test during expression trials.
The primers for the second PCR step (F2 and R2, see Table 1) possess sequences that overlap solely with the 3C and thrombin sites that were introduced during the first PCR step. Therefore, these primers, which introduce the affinity tags, can be used irrespective of the transgene being cloned. In addition, the start and stop codons are introduced on the F2 and R2 primers, respectively. The F2 primer is designed as follows: NNNNN-XbaI-AGCTG-KpnI-Start-FLAG-3C, where N represents any nucleotide. This primer allows for cloning into either the XbaI or KpnI site of pACMV-tetO, depending on suitability. For the R2 primer, we typically introduce an XhoI site for cloning into pACMV-tetO, however NotI may also be used if suitable.
For the first PCR reaction, 0.5 μM of F1 and R1 primers, 100 ng template, 1X Phusion polymerase HF buffer, 200 μM dNTP, and 2 units Phusion polymerase are added to a total volume of 50 μL. Thermocycling based on a gradient of annealing temperatures is performed. The PCR product is resolved on a 1% agarose gel, gel purified, and used as the template for the second PCR reaction, using the F2 and R2 primers. The second PCR reaction is identical to the first PCR reaction, except for the template and the primers.
The product from the second PCR reaction is gel purified, doubly digested with KpnI (or XbaI) and XhoI, and ligated into pACMV-tetO using standard protocols. Given the relatively large size of the pACMV-tetO expression vectors (~8 kB), we typically transform ligation products into XL-1 Blue Electroporation-Competent cells (Strategene, 200228), following the manufacturers protocols.
Figure 2. Comparison of membrane protein expression levels in the presence and absence of spacer sequences.

A) Five stably transfected HEK 293S clonal cell lines (labelled as 1 to 5) expressing a full length human solute carrier and B) a stably transfected HEK 293S clonal cell line expressing a full length human receptor, resolved on reducing SDS-PAGE and analyzed via Western blotting. In both cases, (-) and (+) denote the absence and presence of a 5 amino acid spacer sequence at the C-terminus of the membrane protein, respectively (see text for details). BS and AS denote “before spin” and “after spin” samples (see section 2.3 for details). Membranes were probed using an anti-FLAG-HRP monoclonal antibody (1:1000 dilution).
2.1.2 Generation of C-terminally enhanced green fluorescence protein (EGFP) tagged expression vectors
We have introduced a C-terminal EGFP molecule into the pACMV-tetO vector, termed pACMV-tetO-EGFP (Figure 3), for use in FSEC based screening of membrane proteins. This construct is typically only utilized in those cases where the C-terminus of the membrane protein of interest is directed towards the cytoplasm, given that GFP is prone to misfolding and aggregation in the presence of oxidizing environments such as the extracellular space or ER lumen (20). A recent report that a “superfolder” GFP molecule is well behaved when targeted to oxidizing environments via the Sec translocon (21) may thus be of interest in the FSEC screening of membrane proteins in the future, and can be introduced into pACMV-tetO using the same methodology as described here.
Figure 3. pACMV-tetO-EGFP expression vector.

An arbitrary transgene (yellow arrow) has been inserted into the vector at the appropriate location, N-terminal to the EGFP molecule (green arrow) using the KpnI and NotI restriction sites, for illustrative purposes.
The sequence for EGFP was PCR amplified using a forward N-terminal primer consisting of NNNNNN-NotI-spacer-thrombin-GFP(N), and a C-terminal primer consisting of GFP(C)-His8-XhoI-NNNNNN, where the spacer encodes for a 5 amino acid Gly/Ala repeat, N represents any nucleotide, and GFP(N or C) represent complementary sequence to the N- and C-termini of EGFP. Following PCR amplification and gel purification of the PCR product, the EGFP insert and pACMV-tetO were doubly digested with NotI and XhoI, and gel purified following standard protocols. Ligation was performed using 25 ng of pACMV-tetO, 75 ng of EGFP insert, 0.5 μL of T4 ligase (New England Biolabs, M0202S) and 1X ligase buffer in a total volume of 10 μL, at room temperature for 2 hours. Ligation products were transformed into electrocompetent XL-1 Blue cells following the manufacturer’s protocols.
Following sequence confirmation that pACMV-tetO-EGFP is generated, the transgene of interest is subcloned into pACMV-tetO in the same manner as described above for cloning into pACMV-tetO, with the exception that the C-terminal primer incorporates a NotI site and is tagless, given that a C-terminal EGFP and His8 are provided for by the vector.
2.2 Cell culture, transient transfection and induction of GnTI −/− HEK 293S cells
All expression trials described in this manuscript were performed using GnTI−/− HEK 293S cells (kindly provided by Dr. H. Gobind Khorana). As mentioned above, the inducibility of these cells using tetracycline make it amenable to the overexpression of human membrane proteins, as high density cell cultures can be generated prior to protein expression, thereby alleviating toxicity effects. In addition, the lack of GnTI results in the production of shorter, homogeneous N-linked glycans (Man5-GlcNAc2) which can be more easily removed via glycosidases compared to wild-type N-linked glycans. Nevertheless, enzymatic removal of the Man5-GlcNAc2 moieties are not necessary for the crystallization of human membrane proteins, as suggested by the structure of human RhCG which was solved in the glycosylated state (4).
During routine cell culture, HEK 293S cells are grown as an adherent monolayer in 100 mm (growth area of 58.1 cm2) tissue culture plates (BD Falcon, 353003) containing 10 mL of D-MEM with high glucose (UCSF Cell Culture Facility, CCFAA005) supplemented with heat-treated bovine calf serum (10%) (Hyclone, SH30072.03), 1X penicillin streptomycin (UCSF Cell Culture Facility, GK004), and maintained at 37°C and 5% CO2/95% air in a humidified incubator. Cells are periodically split twice per week in order to prevent overconfluence; a 1:8 split at the beginning of the work week and a 1:6 split at the end of the work week.
One day prior to a transient transfection experiment, plate HEK 293S to ~30% confluency in a 10 cm2 tissue culture plate, such that the cells are ~60-70% confluent at the time of transfection. The typical doubling time of GnTI −/− HEK 293S cells grown as an adherent monolayer is approximately one day in our experience.
For each construct to be transfected, dilute 10 μg of plasmid DNA in 1.5 mL of Opti-MEM I medium (UCSF Cell Culture Facility, CCFAC008) or D-MEM (both without serum), mix gently and incubate for 10 minutes. Perform the same incubation, minus plasmid DNA, as a negative control.
Dilute 60 μL Lipofectamine 2000 (Invitrogen, 18324-012) in 1.5 ml of Opti-MEM I medium (without serum) for each transfection and incubate for 10 minutes at room temperature.
Combine the diluted plasmids with the diluted Lipofectamine reagent (total volume = 3 ml) and incubate for 30 minute at room temperature to allow for the DNA-liposome complex to form.
During the incubation period of step 5, replace the D-MEM media in the 10 cm2 plates with 7 mL of Opti-MEM I media. Following the incubation period of step 5, gently add 1.5 mL of the DNA-Lipofectamine mixture to each plate, mix gently by rocking the plate back and forth, and incubate for ~6 h at 37°C in the humidified incubator. Replace the Opti-MEM I medium with 10 mL of DMEM medium containing 10% bovine calf serum.
Induce the cells with 2 μg/ml doxycycline hyclate (Sigma, D 9891) after 24 hours. We typically do not add sodium butyrate, which has been shown to increase protein expression (22), during small scale transient transfection experiments.
Harvest the cells 36 hours after induction. Firstly, wash the cells with 10 mL of PBS and aspirate off the PBS. Add 1 mL of room temperature trypsin (0.05% trypsin with EDTA in Saline A) (UCSF Cell Culture Facility, CCFGP002), and incubate at room temperature for 1 minute. During this 1 minute incubation period, gently shake the tissue culture plate to facilitate dislodging of the cells from the plate. After 1 minute, add 5 mL of D-MEM, resuspend the cells, and pellet at low speed for 5 minutes. Aspirate off the D-MEM and wash the cell pellets with 2x10 mL PBS, pelleting the cells at low speed after each wash. Discard the PBS and proceed to small scale, whole cell membrane solubilization.
2.3 Assessment of expression levels by Western blotting
Transient transfection makes quantification difficult since the amount of DNA transfected can vary considerably and thus affect the final yield. To make an initial assessment of protein expression levels, a small scale detergent solubilization of the transiently transfected cells, using a panel of four detergents, followed by Western blotting is performed. The rationale behind screening a panel of detergents at this stage, as opposed to utilizing a single detergent, is that in those cases where solubilization is observed, the homogeneity of the membrane protein in that particular detergent can be immediately assessed via FSEC.
The magnitude of the solubilized Western blot signal is a critical factor in determining if a particular construct is suitable for stable cell line generation. In our experience, in those cases where no Western signal is observed upon film exposure for 5 minutes, or in those cases where significant degradation is observed, the construct should be redesigned to test for different orthologues/paralogues, affinity tags, or codon optimization, as it is highly unlikely that this construct will produce sufficient amounts of the target membrane protein for structural studies. In cases of low expression levels, the quality of the membrane protein as determined via FSEC (see section 2.4) will determine if the particular construct should be utilized for stable cell line generation. For instance, low expressing constructs that possess poor FSEC profiles (see Figure 5A - “full-length”, Figure 6A - “DDM”) are poor candidates for stable cell line generation, as the membrane protein expressed is unlikely to be suitable for structural studies. Given the modest yields associated with expressing human membrane proteins in HEK-293S cells, any construct that expresses at a very high level as determined via Western blotting is typically utilized for stable cell line generation.
Figure 5. Example of using FSEC to assess expression levels quantitatively.

A. Examples of FSEC traces from a mammalian transporter. The asterisk denotes the included peak used for assessment of expression levels. Absorbance at 280 nm (A280) for each construct is depicted below the FSEC traces. B. Relative expression levels normalized to the A280 trace for the three constructs. For each construct, five independent transfections where performed and the normalized expression level was calculated. The asterisk denotes the transfection experiment that gave the chromatograms shown in panel A. For this mammalian transporter, the full length construct did not have an included peak and was discarded. All three truncated constructs produced improved, included FSEC peaks of comparable quality. Based on the FSEC profiles shown in panel A, construct 2 might be expected to have the highest expression. Nevertheless, analysis of the normalized expression levels (panel B) reveals that construct 1 in fact possess the highest expression.
Figure 6. Fluorescence-detection size-exclusion screening of human membrane proteins solubilized from HEK 293S cells.

100 μL of solubilized full-length human membrane proteins (see Figure 4) were injected onto a TSK-G3000SW column equilibrated in 50 mM Hepes pH 7, 200 mM NaCl, and detergent (0.5 mM β-DDM, 0.5 mM FC 14, 40 mM β-OG) at a flow rate of 0.5 ml/min. Fluorescence detection was monitored as described in section 2.4. The void volume, included volume and free EGFP molecule are labelled for the center chromatogram.
Solubilization conditions that increase the ratio of the solubilized material (after spin, see Figure 4) relative to the total protein produced (before spin, see Figure 4) are often beneficial, as this may result in more useable membrane protein produced per liter of HEK-293S cell culture. Near 100% solubilization of human membrane proteins expressed in HEK-293S cells can be achieved (Figure 4-2, “FC-14”), and for the case of human RhCG, the x-ray crystal structure was determined using HEK-293S expressed material that was nearly 100% solubilized using both OG and DDM (4). Nevertheless, the degree of solubilization itself should not be used to determine the suitability of a particular detergent for solubilization, as certain detergents can more readily solubilize misfolded or aggregated membrane proteins (23). Therefore, the ratio of solubilization, in conjunction with FSEC (see sections 2.4 and 2.5) should be used to determine suitable solubilization conditions.
Figure 4. Western blotting analysis of small-scale, whole cell solubilized human membrane proteins.
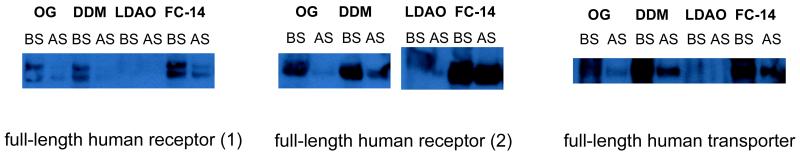
Three full-length human membrane proteins, subcloned into pACMV-tetO-EGFP, were solubilized from GnT I −/− HEK 293S cells (in this case stably transfected) and resolved on a reducing SDS-PAGE. Western blotting was performed using a 1:1000 dilution of anti-His-HRP and a film exposure time of 20 seconds. BS and AS denote the “before spin” and “after spin” samples (see text for details).
Resuspend the harvested HEK 293S cells in 1 mL of 2x solubilization buffer (100 mM Hepes pH 7.0, 400 mM NaCl). Aliquot the resuspended cells equally into four 1.5 mL ultracentrifuge tubes (Beckman, 357448), each possessing a magnetic stirring bar (Fisher Scientific, 1451363)
To each ultracentrifugation tube, add an equal volume of 2x detergent solution. The 2x detergent solutions are: 400 mM β-octylglucoside (β-OG) (Affymetrix, O311), 40 mM β-dodecylmaltoside (β-DDM) (Affymetrix, D310), 200 mM lauryldimethylamine-oxide (LDAO) (Affymetrix, D360), and 40 mM fos-choline 14 (FC-14) (Affymetrix, F312).
Stir at 4° C for 2 hours. Remove the stir bar, and save 10 μL of each solubilization as a “before spin” (BS) sample. Centrifuge at 100,000 g for 1 hour using a TLA-45 ultracentrifuge rotor.
Transfer supernatants (“after spin” (AS)) to a clean 1.5 mL centrifuge tube. To 12 μL of “before spin” and 12 μL of “after spin”, add 4 μL of 4X Laemmli sample buffer (0.25 M Tris pH 6.8, 40% glycerol, 0.4 M DTT, 8% SDS and 0.01% bromophenol blue) and resolve the samples using SDS-PAGE (4-20% precast polyacrylamide gel, Bio-Rad, 456-1095) at constant voltage (200 V). We typically do not boil our samples prior to loading on SDS-PAGE in order to prevent aggregation of the sample.
Perform a Western blot following standard protocols. We typically transfer to an Immobilon-P transfer membrane (Millipore, IPVH07850) at 25 V for 40-45 minutes, block the membrane for 40 minutes with 2.5% nonfat dry milk in Tris buffered saline with 1% Tween-20 (v/v), and probe the membrane using horseradish peroxidase (HRP) conjugated antibodies directed against the affinity tags or GFP following the manufacturers specifications. The antibodies that we have successfully used include monoclonal anti-FLAG M2 (HRP) (Sigma, A8592), Penta-His HRP (Qiagen, 34460), and EGFP monoclonal (Clontech, 632569) with a secondary anti-mouse (Jackson ImmunoResearch, 515-035-003).
The degree of solubilization is determined by comparing the intensity of the AS lane with that of the BS lane (Figure 4). In our experience, FC-14 essentially serves as a positive control for solubilization from HEK 293S cells, while DDM is also effective in solubilization. In addition, β-OG is typically inefficient in solubilising human membrane proteins from HEK 293S cells, nevertheless, the x-ray crystal structure of human RhCG was solved using material that had been solubilized using β-OG (4). Caution should be exercised in those cases where solubilization is only achieved in FC-14, as this detergent is considered to be “harsh” and may result in the purification of a potentially non-native or inactive membrane protein (24).
2.4 Assessment of expression levels by FSEC
Fluorescence-detection size exclusion chromatography (FSEC) is traditionally used to assess the quality of the target gene (13). We find that FSEC can be used in a quantitative manner (Figure 5A) to assist in the determination of expression levels along with Western blots (see section 2.3). We normally prefer to test our constructs a number of times to assess reproducibility between the transient transfections. By stringent protocol adherence, we observe that reproducibility in terms of expression levels is surprisingly good when gauged by FSEC. For most cases the standard deviation of expression assessed by FSEC is 30% or lower (Figure 5B). We find that expression levels are best evaluated by normalizing the area of the included FSEC peak to the area of the absorbance at 280 nm (A280) chromatogram (Figure 5A, 5B). This normalization is performed to account for differences in cell count among the separate transient transfections.
In FSEC, as is the case for standard size exclusion chromatography, the suitability of the sample for overexpression trials and structural studies is assessed in two ways. Firstly, proteins that migrate in the void volume of the size exclusion column are likely to be higher order aggregates, indicative of misfolding and/or insolubility, whereas proteins that migrate in the included volume may be properly folded (see Figure 5A). Therefore, constructs, detergents, ligands, etc., that reduce the magnitude of the void volume peak, and increase the magnitude of the included peak are beneficial for structural studies. Secondly, the shape of the included peak is an excellent indicator of protein quality. A homogeneous protein, which is the ideal sample for crystallization trials, will possess a monodisperse, included peak (e.g. Figure 6C - “DDM”), whereas a protein that exist in multiple conformations and/or oligomeric states will possess a polydisperse, included volume peak (e.g. Figure 6B - “DDM”). Constructs, detergents, ligands, etc. that increase the monodispersity of the included volume peak are beneficial for structural studies.
Equilibrate a 7.5x60 cm TSK-G3000SW (Tosoh, R0270-25) column with 1x solubilization buffer (50 mM Hepes pH 7.0, 200 mM NaCl) and ~2-3x critical micelle concentration (CMC) of the detergent used during solubilization. A Superdex S200 column, or equivalent, can be used in place of a TSK-3000 column in those cases where a HPLC is unavailable.
Set λex = 488 nm and λem = 509 nm on the fluorescence detector. We use a RF-10AXL Shimadzu fluorescence detector, initially set to a sensitivity of “medium” and a gain of “16x”. Absorbance at 280 nm (A280) is detected using a SPD-10A UV-Vis Shimadzu detector.
At a flow rate of 0.5-1 ml/min, inject ~100 μL of solubilized material. In those cases where several samples are to be assessed, an autosampler can be used to facilitate sample injections.
-
Post-run analysis: Calculate normalized expression level [NEL]:
NEL = AUP/AUC
AUP: Area under the included FSEC peak.
AUC: Area under the A280 curve (including the void peak).
Repeat the analysis a number of times and calculate the standard deviation for each construct. Note: each injection and analysis corresponds to a separate transfection experiment.
Compare the expression levels among the different constructs (Figure 5B).
2.5 Construct quality assessment by FSEC
Fluorescence-detection size exclusion chromatography can also be used to assess the homogeneity of GFP-fusion proteins (13). In the methodology described here, the effect that detergent type has on the homogeneity of the membrane protein of interest is assessed by performing FSEC on all solubilized material that scores positively via Western blotting (Figure 4). In principle, additional variables known to impact membrane protein homogeneity can also be assessed via FSEC, simply by performing the small scale whole cell membrane solubilization at different pH, glycerol, salt, or in the presence of ligands.
Perform the FSEC experiment as described in sections 2.4.1 to 2.4.3, using material solubilized in a panel of four detergents as discussed in section 2.3. The relative magnitude of the fluorescence peak correlates with the intensity of the Western blot band (see Figure 4), providing a second estimate for the amount of solubilizable membrane protein that is produced. In those cases where single, monodisperse peaks are not observed (Figure 6A,B), the magnitude of the included volume peak will dictate whether or not effort should be placed into trying to improve the profile, via pH, ligands, etc., or if additional constructs should be tested. As mentioned above, given the modest expression levels associated with expressing human membrane proteins in HEK 293S cells, those constructs that express at high levels, albeit with poor FSEC profiles (Figure 6B - “DDM”), should still be considered for further large-scale expression trials, whereas those constructs that both express poorly and possess poor FSEC profiles (Figure 6A) are unlikely to be suitable for structural studies.
Conclusions
The purpose of the methodology described in this manuscript is to generate and identify expression constructs that may be suitable for structural studies. At the transient transfection level, one can assess, in a facile manner, protein expression levels (via Western blotting and FSEC) and quality (via FSEC), both of which are key variables that determine if an expression construct is tractable for structural studies. Any expression construct generated using the methodologies described in this manuscript is immediately suitable for large scale protein expression trials, either via large-scale transient transfections or via stable cell line generation followed by large scale cell cultures.
It is important to consider expression trials in a variety of systems to assess which system is most suitable for overexpression. Other expression systems, namely insect cells, have been used with success to heterologously express human membrane proteins for structural studies (e.g. 24) Nevertheless, the near-native translocation machinery and lipid milieu encountered when expressing human membrane proteins in human cells can lead to less misfolding and degradation (Figure 7). Furthermore, the fact that we have successfully utilized HEK293S cells in the structure determination of human RhCG (4) suggests that human cell expression systems could be of increased prominence in the structure determination of human membrane proteins in the future.
Figure 7. Comparison of human membrane proteins expressed in HEK 293S and SF9 cells.

A human solute carrier family member of approximately 60 kDa was expressed in stably transfected GnT I −/− HEK 293S and Sf9 cells. In both cases, whole cell membrane solubilized material (using 1% β-DDM) was resolved on a reducing SDS-PAGE, and immunoblotted using an anti-FLAG (HRP) monoclonal antibody. For the HEK 293S expression trials, each lane corresponds to a clonal cell line stably transformed with transgene subcloned into pACMV-tetO. For Sf9 expression, the transgene was expressed using a pFASTBac expression vector (Invitrogen, 10712024), followed by a P2 viral dilution of either 1:200, or 1:500 for infection. In the case of the Sf9 produced material, both higher order aggregates (>250 kDa) and degredation products (20 kDa) were observed, in addition to the expected 60 kDa band, suggesting that Sf9 may not be suitable for the expression of this human solute carrier family member. While higher order aggregates (~150 kDa) were also observed in HEK-293S, their magnitude relative to the 60 kDa band appeared to be less for some clonal cell lines (see clones 4,6 and 9) relative to that observed for Sf9 (see 1:200 diultion).
Acknowledgments
The work described in this manuscript was supported by NIH/NIGMS grants P50 GM73210, U54 GM094625 and R37 GM24485. BPP is supported by the Danish Cancer Society.
References
- 1.Chelikani P, Reeves PJ, Rajbhandary UL, Khorana HG. Protein Sci. 2006;15:1433–40. doi: 10.1110/ps.062080006. [DOI] [PMC free article] [PubMed] [Google Scholar]
- 2.Reeves PJ, Thurmond RL, Khorana HG. Proc Natl Acad Sci U S A. 1996;93:11487–92. doi: 10.1073/pnas.93.21.11487. [DOI] [PMC free article] [PubMed] [Google Scholar]
- 3.Takayama H, Chelikani P, Reeves PJ, Zhang S, Khorana HG. PLoS One. 2008;3:e2314. doi: 10.1371/journal.pone.0002314. [DOI] [PMC free article] [PubMed] [Google Scholar]
- 4.Gruswitz F, Chaudhary S, Ho JD, Schlessinger A, Pezeshki B, Ho CM, Sali A, Westhoff CM, Stroud RM. Proc Natl Acad Sci U S A. 2010;107:9638–43. doi: 10.1073/pnas.1003587107. [DOI] [PMC free article] [PubMed] [Google Scholar]
- 5.Hessa T, Kim H, Bihlmaier K, Lundin C, Boekel J, Andersson H, Nilsson I, White SH, von Heijne G. Nature. 2005;433:377–81. doi: 10.1038/nature03216. [DOI] [PubMed] [Google Scholar]
- 6.White SH, Wimley WC. Annu Rev Biophys Biomol Struct. 1999;28:319–65. doi: 10.1146/annurev.biophys.28.1.319. [DOI] [PubMed] [Google Scholar]
- 7.Allen SJ, Ribeiro S, Horuk R, Handel TM. Protein Expr Purif. 2009;66:73–81. doi: 10.1016/j.pep.2009.03.001. [DOI] [PMC free article] [PubMed] [Google Scholar]
- 8.Gan L, Alexander JM, Wittelsberger A, Thomas B, Rosenblatt M. Protein Expr Purif. 2006;47:296–302. doi: 10.1016/j.pep.2005.11.004. [DOI] [PubMed] [Google Scholar]
- 9.Mohanty AK, Wiener MC. Protein Expr Purif. 2004;33:311–25. doi: 10.1016/j.pep.2003.10.010. [DOI] [PubMed] [Google Scholar]
- 10.Mirzabekov T, Bannert N, Farzan M, Hofmann W, Kolchinsky P, Wu L, Wyatt R, Sodroski J. J Biol Chem. 1999;274:28745–50. doi: 10.1074/jbc.274.40.28745. [DOI] [PubMed] [Google Scholar]
- 11.Sonoda Y, Newstead S, Hu NJ, Alguel Y, Nji E, Beis K, Yashiro S, Lee C, Leung J, Cameron AD, Byrne B, Iwata S, Drew D. Structure. 2011;19:17–25. doi: 10.1016/j.str.2010.12.001. [DOI] [PMC free article] [PubMed] [Google Scholar]
- 12.Rosenbaum DM, Cherezov V, Hanson MA, Rasmussen SG, Thian FS, Kobilka TS, Choi HJ, Yao XJ, Weis WI, Stevens RC, Kobilka BK. Science. 2007;318:1266–73. doi: 10.1126/science.1150609. [DOI] [PubMed] [Google Scholar]
- 13.Kawate T, Gouaux E. Structure. 2006;14:673–81. doi: 10.1016/j.str.2006.01.013. [DOI] [PubMed] [Google Scholar]
- 14.Stevens RC, Sancho J, Martinez A. Methods Mol Biol. 2010;648:313–24. doi: 10.1007/978-1-60761-756-3_22. [DOI] [PubMed] [Google Scholar]
- 15.Guan L, Smirnova IN, Verner G, Nagamori S, Kaback HR. Proc Natl Acad Sci U S A. 2006;103:1723–6. doi: 10.1073/pnas.0510922103. [DOI] [PMC free article] [PubMed] [Google Scholar]
- 16.Long SB, Campbell EB, Mackinnon R. Science. 2005;309:897–903. doi: 10.1126/science.1116269. [DOI] [PubMed] [Google Scholar]
- 17.Reeves PJ, Callewaert N, Contreras R, Khorana HG. Proc Natl Acad Sci U S A. 2002;99:13419–24. doi: 10.1073/pnas.212519299. [DOI] [PMC free article] [PubMed] [Google Scholar]
- 18.Reeves PJ, Kim JM, Khorana HG. Proc Natl Acad Sci U S A. 2002;99:13413–8. doi: 10.1073/pnas.212519199. [DOI] [PMC free article] [PubMed] [Google Scholar]
- 19.McCusker EC, Bane SE, O’Malley MA, Robinson AS. Biotechnol Prog. 2007;23:540–7. doi: 10.1021/bp060349b. [DOI] [PubMed] [Google Scholar]
- 20.Jain RK, Joyce PB, Molinete M, Halban PA, Gorr SU. Biochem J. 2001;360:645–9. doi: 10.1042/0264-6021:3600645. [DOI] [PMC free article] [PubMed] [Google Scholar]
- 21.Aronson DE, Costantini LM, Snapp EL. Traffic. 2011;12:543–8. doi: 10.1111/j.1600-0854.2011.01168.x. [DOI] [PMC free article] [PubMed] [Google Scholar]
- 22.Gorman CM, Howard BH, Reeves R. Nucleic Acids Res. 1983;11:7631–48. doi: 10.1093/nar/11.21.7631. [DOI] [PMC free article] [PubMed] [Google Scholar]
- 23.Drew D, Newstead S, Sonoda Y, Kim H, von Heijne G, Iwata S. Nat Protoc. 2008;3:784–98. doi: 10.1038/nprot.2008.44. [DOI] [PMC free article] [PubMed] [Google Scholar]
- 24.Lewinson O, Lee AT, Rees DC. J Mol Biol. 2008;377:62–73. doi: 10.1016/j.jmb.2007.12.059. [DOI] [PMC free article] [PubMed] [Google Scholar]