

Abstract
In this study, the first in-depth analysis of optically induced dopamine release using fast-scan cyclic voltammetry on striatal slices from rat brain was performed. An adeno-associated virus that expresses Channelrhodopsin-2 was injected in the substantia nigra. Tissue was collected and sectioned into 400 μm-thick coronal slices four weeks later. Blue laser light (473 nm) was delivered through a fiber optic inserted into slice tissue. Experiments revealed some difference between maximal amplitudes measured from optically and electrically evoked dopamine effluxes. Specifically, there was an increase in the amplitude of dopamine release induced by electrical stimulation in comparison with light stimulations. However, we found that dopamine release is more sensitive to changes in the pulse width in the case of optical stimulation. Light-stimulated dopamine was increased as the stimulation pulse widened. There was no difference with repeated stimulations at five minute intervals between stimulation sources and dopamine signal was stable during recording sessions, while one minute intervals resulted in a decline in the amplitude from both sources. Optical stimulation can also produce an artifact that is distinguishable from dopamine by the cyclic voltammogram. These results confirm that optical stimulation of dopamine is a sound approach for future pharmacological studies in slices.
Keywords: Voltammetry, optogenetics, dopamine, brain slices, adenoassociated virus, channelrhodopsin-2
Introduction
Dopamine transmission in the striatum is critically involved in motor control, attention, learning, perception and processing of rewarding and aversive stimuli (Anstrom et al., 2009; Berridge, 2007; Budygin et al., 2012; Day et al., 2007; Grillner et al., 2005; Redgrave et al., 2008; Rice et al., 2011). However, several other neurotransmitter systems impact these behaviors, and it is often difficult to dissect the role of dopamine in these functions. For many years the role of dopamine transmission in different physiological and pathological processes was studied using electrical or chemical/pharmacological stimulation. Recently, optogenetics has provided the field of neuroscience a new way to precisely target stimulation to select neuronal populations (Cao et al., 2011; LaLumiere, 2011), including dopamine neurons (Adamantidis et al., 2011; Bass et al., 2010; Stuber et al., 2010; Tecuapetla et al., 2010; Tsai et al., 2009; Witten et al., 2011). Recent findings demonstrate the precision by which dopamine can be released through optical stimulation of dopaminergic cell bodies in the midbrain (Adamantidis et al., 2011; Bass et al., 2010). In addition, it was observed that short-lasting optical stimulation of striatal dopamine release occurred without concomitant pH changes (Bass et al., 2010), which are a common phenomenon with chemical and electrical stimulation approaches (Venton et al., 2003), and which could interfere with receptor and neuronal functioning (Vyklicky et al., 1990). Therefore, optogenetics allows for a far more precise exploration of the role of dopamine transmission in different brain functions.
Several research groups began to combine optogenetics with fast-scan cyclic voltammetry (FSCV) to examine optically induced dopamine dynamics (Adamantidis et al., 2011; Bass et al., 2010; Stuber et al., 2010; Tecuapetla et al., 2010; Tsai et al., 2009; Witten et al., 2011). Indeed, FSCV detects dopamine in vitro and in vivo with subsecond temporal and micrometer spatial resolution that allows us to evaluate dopamine release and uptake changes in real time. Recently, by combining the tight spatial and temporal resolution of both optogenetics and FSCV we have performed the first in-depth analysis of substantia nigra (SN) optical stimulation on dopamine dynamics in the striatum of anesthetized rats (Bass et al., 2010). These experiments have demonstrated that the optical control over dopamine transmission at the level of cell bodies is highly reproducible, flexible and can be targeted to very precise, discrete subregions of the striatum in vivo based on placement of the opsin and light source in the midbrain. However, an important advantage of optogenetics is that light stimulation can be applied anywhere along the length of the neuron, including both the cell body in the midbrain and the terminals within the striatum. While our first study characterized striatal dopamine dynamics induced by light stimulation of the cell body region (SN) in vivo, the present experiments in vitro were designed to explore striatal dopamine release induced by optical stimulation of only the terminals.
As we did in our first study in vivo, we have used a generalized non-restricted promoter infused directly into the SN (Bass et al., 2010). It is important to note that this promoter should drive opsin expression in all neuronal subtypes in this region. However, in slice preparations only projections, which are sent from the SN, will be targeted for optical stimulation of dopamine release. This is in sharp contrast to the traditional electrical stimulation, which evokes neurotransmitter release from all terminals neighboring to the electrode, regardless of where the projection originates. Therefore, this optogenetic approach combined with FSCV allowed us to characterize dopamine efflux from exciting only SN terminals (dopaminergic and otherwise) in the absence of many other striatal terminals. While our results demonstrate that electrically and optically induced dopamine release is similar, there are some notable differences.
1. Experimental section
2.1. Adeno-associated virus (AAV) packaging
The EF1α-ChR2-EYFP AAV plasmid was a kind gift from K. Deisseroth and consists of AAV2 inverted terminal repeats flanking the transgene cassette, which contains the EF1α promoter followed by a ChR2-EYFP fusion gene, woodchuck postregulatory element (WPRE) and human Growth Hormone polyA signal sequence, respectively. Packaging of the EF1α-ChR2-AAV10 was carried out according to a standard triple transfection protocol to create helper virus-free pseudotyped AAV2/10 virus (Xiao et al., 1998). An AAV2/10 rep/cap plasmid provided the AAV2 replicase and AAV10 capsid genes (Gao et al., 2002), while adenoviral helper functions were supplied by pHelper (Stratagene, La Jolla, CA). Briefly, AAV-293 cells (Stratagene, La Jolla, CA) were transfected with 10 μg of pHelper, and 1.15 pmol each of AAV2/10 and AAV vector plasmids via calcium phosphate precipitation. The cells were harvested 72 hours later and the pellets resuspended in DMEM, freeze-thawed three times and centrifuged multiple times to produce a clarified viral lysate.
2.2. Stereotaxic virus injection
Male Sprague-Dawley rats (300–350 g; Charles River, Raleigh, NC) were anesthetized with ketamine hydrochloride (100 mg/kg, i.p.) and xylazine hydrochloride (20 mg/kg, i.p.) and placed in a stereotaxic frame. The scalp was shaved, swabbed with iodine and a central incision made to expose the skull. Two small holes were drilled and 2 skull screws were placed in to secure a cement cap. A third hole was drilled above the right SN (from bregma: anterior-posterior, −5.6 mm; lateral, 2 mm) and 2 μl of EF1α-ChR2-AAV10 was slowly injected into SN (dorsal-ventral, −7.6 mm) over three minutes via a Hamilton syringe. The tissue was allowed to rest for two minutes before it was slowly retracted. The exposed scull was coated with dental cement secured by skull screws and upon drying the animals were returned to their home cages for recovery. All protocols were approved by the Institutional Care and Use Committee at Wake Forest School of Medicine. All experiments conformed to international guidelines on the ethical use of animals.
2.3. Fast-scan cyclic voltammetry (FSCV) in brain slices
Rats were sacrificed within several minutes by decapitation and the brains rapidly removed and cooled in ice-cold, pre-oxygenated (95% O2/5% CO2) artificial cerebrospinal fluid (aCSF). The tissue was then sectioned into 400 μm-thick coronal slices containing striatum. Slices were kept in a reservoir of oxygenated aCSF with HEPES buffer at room temperature for 30 min. The aCSF consisted of (in mM): NaCl (126), KCl (2.5), NaH2PO4 (1.2), CaCl2 (2.4), MgCl2 (1.2), NaHCO3 (25), glucose (11), HEPES (20) and was pH adjusted to 7.4. One hour before each experiment, a brain slice was transferred to a submersion recording chamber, perfused at 1 ml/min with oxygenated aCSF, and allowed to equilibrate. The buffer was continuously bubbled with 5% CO2 and O2. Recordings were made in the dorsal part of the striatum. A cylindrical carbon fiber microelectrode (7 μm diameter, ~100 μm long) was inserted into the slice and a bipolar stimulating electrodes or fiber optic (Plastics One, Roanoke, VA, USA) were placed on the surface of the brain slice ~200 μm away. Extracellular dopamine was monitored at the carbon fiber microelectrode every 100 ms using FSCV by applying a triangular waveform (−0.4 to +1.3 vs Ag/AgCl, 300 V/s). Data were digitized (National Instruments, Austin, TX, USA) and stored on a computer. Dopamine release was evoked by electrical (4, 10, 20 and 40 ms/phase, monophasic, 300 μA,) or light (4, 10, 20 and 40 ms/phase, ≈5 mW) pulses.
2.4. Visual identification of ChR2 containing terminals
Typically, local electrical stimulation along the dorsal-ventral axis of a striatal slice will result in robust dopamine release at each point, including the ventral striatum. However, as we have previously shown (Bass et al., 2010), dopamine release induced by optical stimulation of the cell bodies in the SN is much more concise in its release patterns and is primarily restricted to the dorsal striatum. In order to identify terminal fields that contain ChR2, we employed a fluorescent stereomicroscope (Kramer Scientific, Amesbury, MA, Model FSM-25) that has been modified to accept a liquid light guide attached to an EXFO X-Cite 120 fluorescence illumination source. Slices were quickly screened with this microscope to determine the location of ChR2 expression, as determined by visualization of the attached EYFP tag, which was used as a map to probe areas that were most likely to be sensitive to optical stimulation. Images were acquired with a Lumenera Infinity 3-1 Monochrome Camera (Ottawa, ON, Canada) and the 8-bit grayscale images were pseudocolored using the fire-LUT in ImageJ.
2.5. Optical delivery
The optical setup consisted of a laser at wavelength 473 nm (Viasho) with a maximum output of 100 mW. The laser was fiber pigtailed into a glass fiber of core diameter 200 μm (Thorlabs –BFL37200 – Custom) and 75 cm in length. The laser was modulated using the TTL input control port on the laser power supply via a USB Data Acquisition unit (National Instruments 6221-USB). The data acquisition unit was controlled by a desktop computer using LabVIEW software (National Instruments). The software allowed us to control the frequency of the square pulses, the total number of pulses in one data stream, and the width of each pulse as a fraction of the period between pulses. The laser power output was measured using a commercial power meter (Newport Model 1815C). We measured the laser output pulses that resulted from the electrical pulses that were used to drive the TTL input of the laser, and the laser pulses faithfully replicated the electrical pulses driving the TTL input of the laser. To understand how the dopamine stimulation depended on pulse width, we selected four pulse widths: 4, 10, 20 and 40 ms, a range that reflects common pulse widths for optical stimulation.
A single desktop computer controlled both the voltammetric electrodes (and amplifier) as well as the USB Data Acquisition unit (National Instruments 6221-USB) that controlled the laser. Two separate LabVIEW programs were used to achieve synchronization between the laser pulse train and the recording of the voltammetric dopamine current by the electrode. One program controlled the voltammetric parameters and readings, while the other LabVIEW program controlled the USB Data Acquisition unit. The USB Data Acquisition unit, which has both inputs and outputs, interfaced to the laser. Synchronization of the laser to the voltammetric recording was achieved through an electronic controller instrument that was built by the Electronics Design Facility at the University of North Carolina at Chapel Hill. The first LabVIEW program controlled the voltammetric electrode via this instrument. Once the instrument received a trigger signal from the LabVIEW program, it triggered the Data Acquisition unit input to begin a sequence controlled in software by the second LabVIEW program that then triggered the laser and sent the appropriate set of pulses (with a preselected width for each pulse, a preselected delay to the beginning of the pulse train, and a preselected number of pulses per triggering event).
2.6. Statistical analysis
Data were analyzed in GraphPad Prism (GraphPad Software, San Diego, CA). A t-test, one-way repeated measures and two-way ANOVAs with a Bonferroni post test were used to determine statistical significance. The data are presented as mean ± SEM and the criterion of significance was set at p < 0.05.
2. Results and discussion
3.1. Striatal dopamine efflux induced by local optical stimulation of rat brain slice
Previously, we have characterized changes in endogenous dopamine release evoked by optical stimulation of dopamine cell bodies (SN) using electrochemical detection with a carbon fiber electrode (FSCV) inserted into the dorsal striatum of rats (Bass et al., 2010). In the current study, we explored characteristics of striatal dopamine release that was evoked by light stimulation of terminals, utilizing FSCV on brain slices (Budygin et al., 2005; Budygin et al., 2007; Phillips et al., 2003a). To introduce the opsin, we injected a viral construct, coding for ChR2 (EF1-ChR2-AAV10) into the SN of adult (8 weeks old) rats (Bass et al., 2010). After 21–26 days, robust expression of ChR2 was observed in the terminals of the striatum (Figure 1). In the representative example in figure 1, we see an intense signal in the dorsal striatum, while in some slices ChR2 expression is strong in both the dorsal and ventral striatum, indicating that in some cases the virus injection was not perfectly restricted to the SN and some spillage to the VTA occurred. However, most of the signals were more or less restricted to the dorsal striatum depending on the accuracy of the midbrain injection. When working with floating sections it is important to establish the relative location of the ChR2, as a slight variation in the virus injection point in the midbrain could result in a shifting pattern, which requires a significant amount of time to detect without the fluorescent marker.
Figure 1. Strong ChR2 expression in the terminal fields of the striatum.

ChR2 expression in the terminal fields of the striatum. 400 micron-thick coronal slices were obtained and quickly visualized while floating in aCSF using a fluorescent stereomicroscope prior to voltammetric analysis. Top panels show two locations (A and B) in the striatum. Bottom panels demonstrate expression of the ChR2-EYFP fusion proteins in the terminals as assessed by native fluorescence in approximately the same locations (C and D, respectively). The monochromatic images were pseudocolored to enhance contrast, and the scale indicates relative intensity of the EYFP signal.
Taking into consideration the potential neuronal projections from the SN to the striatum, all of which should be transduced with opsin, it is reasonable to expect that some GABAergic terminals may be also optogenetically stimulated in striatal slices. Indeed, according to one stereological study, GABAergic (but not glutamatergic) neurons represent a large proportion of SN cells (Nair-Roberts et al., 2008). These neurons play significant roles in the inhibition of dopamine transmission through their local axon collaterals (van Zessen et al., 2012). The regulation of dopamine release by GABA axons projecting from the SN cannot be ruled out also. However to our knowledge, no evidence exists that these GABA projections are colocalized with dopamine terminals and this mechanism takes place. In addition, although we cannot rule out light-induced stimulation of non-dopaminergic SN terminals in the dorsal striatum, our approach nonetheless results in stimulation of only SN terminals, while electrical stimulation will stimulate terminals also projecting from other brain regions.
A stimulation with 1 pulse of blue light (473 nm) with 4-ms duration induced distinct dopamine efflux in the range 300–700 nM (Fig. 2A). Thus, the amplitude of dopamine release obtained in our experiments was not different from that earlier observed following 1 pulse optical stimulation on striatal slices from mouse (Stuber et al., 2010; Tecuapetla et al., 2010) and rat (Witten et al., 2011) brain. Thus, the use of a generalized non-restricted promoter, which allows expression of ChR2 in any neuronal subtypes of the SN, did not change the intensity of light-evoked dopamine release in comparison with the conditional rat (Witten et al., 2011) and mouse (Stuber et al., 2010) transgenic lines, where the opsin was expressed in dopamine cells only. However, final conclusions should be made only following additional experiments, where dopamine release will be measured in the same striatal spots in matched groups of animals (age, sex) and under identical experimental conditions, including parameters of optical stimulation.
Figure 2. Optically and electrically induced dopamine release detected by voltammetry.

Striatal dopamine effluxes were evoked by a single pulse (4 ms) of light stimulation (A - in vitro, B - in vivo) and electrical stimulation (C - in vitro). For in vitro experiments the stimulation was locally executed in the dorsal part of striatal slice, while in experiments in vivo the stimulation was applied to the SN of anesthetized rats. Standard two-dimensional color plots topographically depict the voltammetric data with time on the x-axis, applied scan potential on the y-axis, and background-subtracted faradaic current shown in the z-axis in pseudocolor. Representative background-subtracted voltammograms obtained for every signal show typical oxidation and reduction peak potentials (≈ +0.6 V and −0.2 V, respectively) that identify dopamine.
Therefore, our results align well with studies that employed a genetic approach to restrict opsin expression to dopaminergic neurons. Thus, activation of the entire SN or just the terminals produces similar results across a variety of approaches. In addition, by using a generalized promoter, we can begin to make comparisons between SN activation (without confounding factors such as stimulation of adjacent regions) and activation of SN dopaminergic neurons only. Dopamine release was also evoked using 1 pulse optical stimulation that was applied to the SN of an anesthetized rat (Fig. 2B). The amplitudes of dopamine release in this case were smaller than that observed with direct stimulation of striatal terminals in our slice preparations. The peak amplitude of in vivo evoked dopamine release (by the use of SN stimulation) varied from 20 to 100 nM. This difference between cell body and terminal stimulations can be explained by larger number of synapses activated in response to local stimulation. Similarly, the amplitudes of dopamine release evoked by electrical stimulation of cell body regions are typically lower in comparison with electrically evoked dopamine obtained on striatal slices despite the fact that a higher number of pulses is used with electrical stimulation (Budygin et al., 2000; Budygin et al., 2005; Budygin et al., 2007; Budygin et al., 2001; Mathews et al., 2006; Oleson et al., 2009; Phillips et al., 2003b). To compare the amplitude of dopamine transients obtained from direct optical and electrical activation of striatal terminals in vitro, we performed experiments with electrical monophasic 4-ms stimulation (300 μA) (Fig. 2C), which was applied through a bipolar stimulating electrode (Plastics One Inc., Roanoke, VA). The analysis (t test) revealed a difference between maximal amplitudes measured from optically and electrically evoked dopamine effluxes. Specifically, there was a significant increase in the amplitude of dopamine release induced by electrical stimulation in comparison with light stimulations (1062 ± 98 vs.644 ± 62 nM; P < 0.05, t = 3.611, df = 6). Interestingly, a similar tendency was previously observed with optical and electrical stimulation of the cell body region (SN) (Bass et al., 2010). This may be related to discrepancies in the intensities between electrical and optical output, or could result from the relatively smaller volume of tissue stimulated by blue light compared to electrical stimulation. Alternatively, electrical stimulation of cholinergic interneurons can release additional amounts of dopamine via activation of nicotinic receptors on dopamine axons (Threlfell et al., 2012).
Importantly, in some cases when a working electrode was not placed deep enough in the brain tissue (less than 100 μm), we observed a stimulating artifact that could mimic dopamine spikes (Fig. 3). This artifact was observed both in the absence (Fig. 3A) or together with dopamine detection (Fig. 3B). Generally, this signal contamination could be eliminated by inserting the electrode deeper in the slice tissue, changing the position of fiber-optic or both. However, sometimes when the artificial spike could not be completely removed by these manipulations, reducing the laser power intensity by 20–30% often helped eliminate the artifact. A relatively high possibility of artifact detection following optical stimulation on striatal slice preparations highlights the importance of using the background-subtracted cyclic voltammogram (Figs. 2, 3) to verify the identity of the released species as dopamine. Indeed, recorded artifacts often have a shape that is quite similar to a dopamine transient (Fig. 3). This artifact was not observed in experiments in vivo (Bass et al., 2010; Tsai et al., 2009), including in the present study, since the recording electrode is distant from the fiber-optic when dopamine release is induced optically at the dopamine cell bodies.
Figure 3. Recording artifacts observed with optical stimulation in striatal slices.
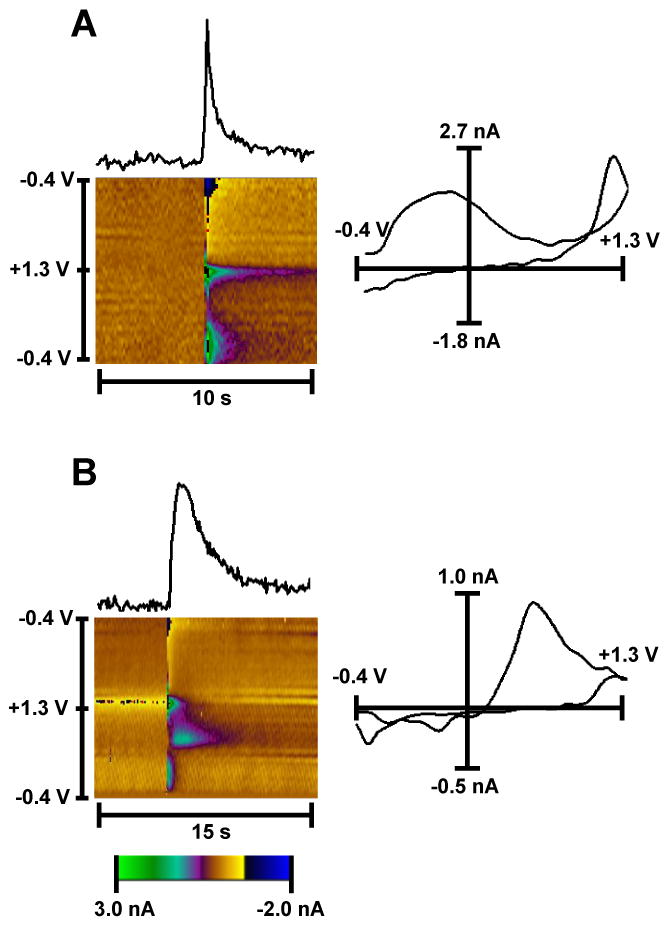
Electrochemical signals and color plots demonstrating artifacts, which were observed without (A) and with (B) dopamine detection and regularly encountered during blue light stimulation. Panel A shows the artifact detected from an area that did not have any visible ChR2 containing terminal. The color plot and cyclic voltammogram revealed no electrochemical characteristics for dopamine identification (there are no oxidation and reduction current peaks, when +0.6 V and −0.2 V were applied). Panel B shows dopamine signal contaminated with a similar artifact. These recordings were made from an area with high intensity of the EYFP signal. In this case, the background subtracted cyclic voltammogram clearly demonstrates that the signal obersved is dopamine. The color depicts additional changes in the background-subtracted faradaic current (in pseudocolor), which are not associated with dopamine detection.
3.2. The responsiveness of dopamine release to different parameters of stimulations: light vs. electrical stimulation
Figure 4 demonstrates the responsiveness of dopamine release to the number of stimulating pulses (4 ms pulse width). We found no significant difference between optically- and electrically-evoked dopamine increases in response to the augmented number of pulses (P>0.05; two-way ANOVA). As expected, there was a significant main effect for the stimulation (pulse number) (F[2, 18]=25.17, P<0.0001, two-way ANOVA). Bonferroni post-hoc analysis indicated a significant difference between 1 and 5 pulse stimulation in both groups (P<0.05 for electrical and P<0.01 for optical stimulation) (Fig. 4A, B). There was also a significant difference between 3 and 5 pulse light-induced dopamine release (P<0.05) (Fig. 4A).
Figure 4. Equal responsiveness of dopamine release to the number of stimulating pulses, induced by optical and electrical stimulation.

A different number of pulses were applied to stimulate dopamine release from striatal slices in using optical (A) and electrical (B) stimulation. Stimulations were performed with 5 min intervals. Data are means ± SEM of four rats per group, expressed as the percent of dopamine response to the 1 pulse stimulation.
To study how optically-induced dopamine release depends on pulse width, four pulse widths were tested: 4, 10, 20 and 40 ms. This range was used earlier for optogenetic studies in vivo (Adamantidis et al., 2011; Bass et al., 2010; Tsai et al., 2009; van Zessen et al., 2012) and it reflects common single pulse durations for optical stimulation. We found that dopamine release is more sensitive to changes in the pulse width in the case of optical stimulation (Fig. 5A, B). Two-way ANOVA revealed a significant difference between these two stimulations (F[1, 18]=9.952, P<0.05).
Figure 5. Optical stimulation is more sensitive to pulse width than electrical stimulation.

A range of pulse widths were used to evoke dopamine release from striatal slices in using optical (A) and electrical (B) single pulse stimulation. Stimulations were performed with 5 min intervals. Data are means ± SEM of four rats per group, expressed as the percent of dopamine response to the 4 ms stimulation. *P < 0.05.
In general, although electrically-evoked dopamine release can be enhanced with increasing pulse width, single pulse electrical stimulation does not always produce a further increase with longer pulse durations (Stamford et al., 1993). Consequently, the lack of dopamine responsiveness to the altered pulse width observed with electrical stimulation in our experiments is not surprising. In sharp contrast to electrically-evoked release, light-stimulated dopamine was increased as the stimulation pulse widened as demonstrated by a significant main effect for the light stimulation (F[3, 12]=5.170, P<0.05, Repeated Measures ANOVA). Bonferroni post-hoc analysis indicated a significant effect of 40 ms stimulation (P<0.05). As stated earlier, in our study the ChR2 was expressed only in the neurons within the SN, and by using striatal slices we were optically stimulating the opsin-containing terminals originating from the SN neuronal cell bodies. This allowed us to avoid an excitation of other terminals integral to the striatum or projecting from non-SN regions, which are undoubtedly also affected by non-selective electrical stimulation. The difference in dopamine response induced by optical and electrical stimulation may be based on the distinction between targeting synapses. In fact, a recent optogenetic study revealed that dopamine release can be independently evoked through activation of striatal cholinergic interneurons (Threlfell et al., 2012). Moreover, the authors also noted that multiple action potentials in a given cholinergic interneuron induced by long pulses did not evoke more dopamine release than a single action potential evoked by short laser pulses (2 ms). This could explain the lack of dopamine responsiveness to the increased pulse width observed with electrical stimulation. Since cholinergic interneurons were not targeted with our optogenetic approach, light-stimulated dopamine was increased as the stimulation pulse widened.
3.3. The reliability of dopamine release induced by optical stimulation in slice preparations
Since FSCV can effectively detect electrically-stimulated neurotransmitter efflux, allowing release and uptake kinetics of endogenous transmitter to be analyzed independently with subsecond accuracy, this technique is intensively used for evaluating different pharmacological agents (Budygin et al., 2001; Mathews et al., 2006; Phillips et al., 2003a) in brain slices. The stability of the electrically-evoked dopamine signal in the terminal fields after repeated stimulation has been essential for pharmacological studies (Ortiz et al., 2010; Yavich, 1996), and we have therefore explored the stability of optically stimulated dopamine release to ensure that it can also meet this requirement. In most investigations on striatal slice preparations a single-pulse electrical stimulation (≈200–300 μA) is applied with 5 minute intervals. Typically, this interval allows for a stable (±5–10 %) amplitude of electrically-evoked dopamine efflux in brain slices from different species, including mice, rats and monkeys (Berridge, 2007; Budygin et al., 2003; Budygin et al., 2005; Budygin et al., 2007; Budygin et al., 2012; Budygin et al., 2001; Mathews et al., 2006; Ortiz et al., 2010; Phillips et al., 2003a). In the present study, we also observed constancy of dopamine signals induced by typical electrical stimulation, which was performed every 5 minutes (Fig. 6A). Likewise, optical stimulation that was matched with electrical stimulus (1 single pulse with 4 ms duration) evoked dopamine release with steady amplitude during the recording period (Fig. 6A). In fact, no significant difference was found in dopamine release changes between optical and electrical stimulation (P>0.05).
Figure 6. Optically induced dopamine release from striatal slices is stable across multiple stimulations with 5 min intervals.

The stability of light evoked dopamine release (open circles) was compared to electrical stimulation (closed circles). Following every stimulation, there was a significant rise in extracellular dopamine, followed by a decrease back to baseline (Fig. 2). When stimulated at five minute intervals (panel A) there was no difference between stimulation sources and dopamine signal was stable during recording sessions. One minute stimulation intervals resulted in a decline in the amplitude for both optical and electrical stimulation (panel B). Data are means ± SEM of three rats per group, expressed as the percent of dopamine response to the first stimulation.
In contrast to the stimulation repeated with 5 minute intervals, both optical and electrical stimulations at intervals of 1 minute intervals induced a gradual decline in the amplitude of dopamine efflux (Fig. 6B). There was a significant main effect for the time (F[12, 52]=7.667, P<0.0001, two-way ANOVA). This stimulation protocol is most likely a consequence of depleting the pool of releasable dopamine, and highlights that the duration of the interval between two subsequent stimulations is critical for obtaining stable dopamine release. There was a difference between optical and electrical stimulations during the entire recording time, including at the 5 minute intervals (recovery phase) (F[1, 52]=38.85, P<0.0001, two-way ANOVA). However, Bonferroni posttests did not reveal significant difference between these stimulations in any time point, including the recovery phase (P>0.05).
3. Conclusions
Therefore, dopamine release from SN terminals in the striatum can be selectively isolated and studied with optical stimulation by the transduction of SN cell bodies with a ChR2 viral vector. The amplitude of striatal dopamine can be controlled by different optical stimulation parameters in a fashion similar to electrical stimulation. Furthermore, optically-induced dopamine efflux in striatal terminals is stable after repeated stimulation (5 min interval) in patterns that are typically used in pharmacological studies of brain slice preparations. Importantly, optical stimulation can result in an artifact that is distinguishable from dopamine by the cyclic voltammogram and which can be avoided by the careful placement of the fiber optic or a reduction in laser power.
Highlights.
Dopamine release from SN terminals in the striatum was studied with optogenetics
The amplitude of release can be controlled by different stimulation parameters
Optically-induced dopamine is stable after repeated stimulation (5 min interval)
Optical stimulation can often result in a stimulating artifact
An artifact is distinguishable from dopamine by the cyclic voltammogram
Acknowledgments
This work was supported by WFU Cross-Campus Collaborative Fund Award (EAB and KDB) and NIH grants DA021634, AA020564 (EAB); DA024763 (CEB).
Footnotes
Publisher's Disclaimer: This is a PDF file of an unedited manuscript that has been accepted for publication. As a service to our customers we are providing this early version of the manuscript. The manuscript will undergo copyediting, typesetting, and review of the resulting proof before it is published in its final citable form. Please note that during the production process errors may be discovered which could affect the content, and all legal disclaimers that apply to the journal pertain.
References
- Adamantidis AR, Tsai HC, Boutrel B, Zhang F, Stuber GD, Budygin EA, Tourino C, Bonci A, Deisseroth K, de Lecea L. Optogenetic interrogation of dopaminergic modulation of the multiple phases of reward-seeking behavior. J Neurosci. 2011;31:10829–35. doi: 10.1523/JNEUROSCI.2246-11.2011. [DOI] [PMC free article] [PubMed] [Google Scholar]
- Anstrom KK, Miczek KA, Budygin EA. Increased phasic dopamine signaling in the mesolimbic pathway during social defeat in rats. Neuroscience. 2009;161:3–12. doi: 10.1016/j.neuroscience.2009.03.023. [DOI] [PMC free article] [PubMed] [Google Scholar]
- Bass CE, Grinevich VP, Vance ZB, Sullivan RP, Bonin KD, Budygin EA. Optogenetic control of striatal dopamine release in rats. J Neurochem. 2010;114:1344–52. doi: 10.1111/j.1471-4159.2010.06850.x. [DOI] [PMC free article] [PubMed] [Google Scholar]
- Berridge KC. The debate over dopamine’s role in reward: the case for incentive salience. Psychopharmacology (Berl) 2007;191:391–431. doi: 10.1007/s00213-006-0578-x. [DOI] [PubMed] [Google Scholar]
- Budygin EA, John CE, Mateo Y, Daunais JB, Friedman DP, Grant KA, Jones SR. Chronic ethanol exposure alters presynaptic dopamine function in the striatum of monkeys: a preliminary study. Synapse. 2003;50:266–8. doi: 10.1002/syn.10269. [DOI] [PubMed] [Google Scholar]
- Budygin EA, Kilpatrick MR, Gainetdinov RR, Wightman RM. Correlation between behavior and extracellular dopamine levels in rat striatum: comparison of microdialysis and fast-scan cyclic voltammetry. Neurosci Lett. 2000;281:9–12. doi: 10.1016/s0304-3940(00)00813-2. [DOI] [PubMed] [Google Scholar]
- Budygin EA, Mathews TA, Lapa GB, Jones SR. Local effects of acute ethanol on dopamine neurotransmission in the ventral striatum in C57BL/6 mice. Eur J Pharmacol. 2005;523:40–5. doi: 10.1016/j.ejphar.2005.09.006. [DOI] [PubMed] [Google Scholar]
- Budygin EA, Oleson EB, Mathews TA, Lack AK, Diaz MR, McCool BA, Jones SR. Effects of chronic alcohol exposure on dopamine uptake in rat nucleus accumbens and caudate putamen. Psychopharmacology (Berl) 2007;193:495–501. doi: 10.1007/s00213-007-0812-1. [DOI] [PubMed] [Google Scholar]
- Budygin EA, Park J, Bass CE, Grinevich VP, Bonin KD, Wightman RM. Aversive stimulus differentially triggers subsecond dopamine release in reward regions. Neuroscience. 2012;201:331–7. doi: 10.1016/j.neuroscience.2011.10.056. [DOI] [PMC free article] [PubMed] [Google Scholar]
- Budygin EA, Phillips PE, Wightman RM, Jones SR. Terminal effects of ethanol on dopamine dynamics in rat nucleus accumbens: an in vitro voltammetric study. Synapse. 2001;42:77–9. doi: 10.1002/syn.1101. [DOI] [PubMed] [Google Scholar]
- Cao ZF, Burdakov D, Sarnyai Z. Optogenetics: potentials for addiction research. Addict Biol. 2011;16:519–31. doi: 10.1111/j.1369-1600.2011.00386.x. [DOI] [PMC free article] [PubMed] [Google Scholar]
- Day JJ, Roitman MF, Wightman RM, Carelli RM. Associative learning mediates dynamic shifts in dopamine signaling in the nucleus accumbens. Nat Neurosci. 2007;10:1020–8. doi: 10.1038/nn1923. [DOI] [PubMed] [Google Scholar]
- Gao GP, Alvira MR, Wang L, Calcedo R, Johnston J, Wilson JM. Novel adeno-associated viruses from rhesus monkeys as vectors for human gene therapy. Proc Natl Acad Sci U S A. 2002;99:11854–9. doi: 10.1073/pnas.182412299. [DOI] [PMC free article] [PubMed] [Google Scholar]
- Grillner S, Hellgren J, Menard A, Saitoh K, Wikstrom MA. Mechanisms for selection of basic motor programs--roles for the striatum and pallidum. Trends Neurosci. 2005;28:364–70. doi: 10.1016/j.tins.2005.05.004. [DOI] [PubMed] [Google Scholar]
- LaLumiere RT. A new technique for controlling the brain: optogenetics and its potential for use in research and the clinic. Brain Stimul. 2011;4:1–6. doi: 10.1016/j.brs.2010.09.009. [DOI] [PubMed] [Google Scholar]
- Mathews TA, John CE, Lapa GB, Budygin EA, Jones SR. No role of the dopamine transporter in acute ethanol effects on striatal dopamine dynamics. Synapse. 2006;60:288–94. doi: 10.1002/syn.20301. [DOI] [PubMed] [Google Scholar]
- Nair-Roberts RG, Chatelain-Badie SD, Benson E, White-Cooper H, Bolam JP, Ungless MA. Stereological estimates of dopaminergic, GABAergic and glutamatergic neurons in the ventral tegmental area, substantia nigra and retrorubral field in the rat. Neuroscience. 2008;152:1024–31. doi: 10.1016/j.neuroscience.2008.01.046. [DOI] [PMC free article] [PubMed] [Google Scholar]
- Oleson EB, Talluri S, Childers SR, Smith JE, Roberts DC, Bonin KD, Budygin EA. Dopamine uptake changes associated with cocaine self-administration. Neuropsychopharmacology. 2009;34:1174–84. doi: 10.1038/npp.2008.186. [DOI] [PMC free article] [PubMed] [Google Scholar]
- Ortiz AN, Kurth BJ, Osterhaus GL, Johnson MA. Dysregulation of intracellular dopamine stores revealed in the R6/2 mouse striatum. J Neurochem. 2010;112:755–61. doi: 10.1111/j.1471-4159.2009.06501.x. [DOI] [PMC free article] [PubMed] [Google Scholar]
- Phillips PE, Johns JM, Lubin DA, Budygin EA, Gainetdinov RR, Lieberman JA, Wightman RM. Presynaptic dopaminergic function is largely unaltered in mesolimbic and mesostriatal terminals of adult rats that were prenatally exposed to cocaine. Brain Res. 2003a;961:63–72. doi: 10.1016/s0006-8993(02)03840-4. [DOI] [PMC free article] [PubMed] [Google Scholar]
- Phillips PE, Stuber GD, Heien ML, Wightman RM, Carelli RM. Subsecond dopamine release promotes cocaine seeking. Nature. 2003b;422:614–8. doi: 10.1038/nature01476. [DOI] [PubMed] [Google Scholar]
- Redgrave P, Gurney K, Reynolds J. What is reinforced by phasic dopamine signals? Brain Res Rev. 2008;58:322–39. doi: 10.1016/j.brainresrev.2007.10.007. [DOI] [PubMed] [Google Scholar]
- Rice ME, Patel JC, Cragg SJ. Dopamine release in the basal ganglia. Neuroscience (2011) 2011;198:112–37. doi: 10.1016/j.neuroscience.2011.08.066. [DOI] [PMC free article] [PubMed] [Google Scholar]
- Stamford JA, Palij P, Davidson C, Jorm CM, Millar J. Simultaneous “real-time” electrochemical and electrophysiological recording in brain slices with a single carbon-fibre microelectrode. J Neurosci Methods. 1993;50:279–90. doi: 10.1016/0165-0270(93)90035-p. [DOI] [PubMed] [Google Scholar]
- Stuber GD, Hnasko TS, Britt JP, Edwards RH, Bonci A. Dopaminergic terminals in the nucleus accumbens but not the dorsal striatum corelease glutamate. J Neurosci. 2010;30:8229–33. doi: 10.1523/JNEUROSCI.1754-10.2010. [DOI] [PMC free article] [PubMed] [Google Scholar]
- Tecuapetla F, Patel JC, Xenias H, English D, Tadros I, Shah F, Berlin J, Deisseroth K, Rice ME, Tepper JM, Koos T. Glutamatergic signaling by mesolimbic dopamine neurons in the nucleus accumbens. J Neurosci. 2010;30:7105–10. doi: 10.1523/JNEUROSCI.0265-10.2010. [DOI] [PMC free article] [PubMed] [Google Scholar]
- Threlfell S, Lalic T, Platt NJ, Jennings KA, Deisseroth K, Cragg SJ. Striatal dopamine release is triggered by synchronized activity in cholinergic interneurons. Neuron. 2012;75:58–64. doi: 10.1016/j.neuron.2012.04.038. [DOI] [PubMed] [Google Scholar]
- Tsai HC, Zhang F, Adamantidis A, Stuber GD, Bonci A, de Lecea L, Deisseroth K. Phasic firing in dopaminergic neurons is sufficient for behavioral conditioning. Science. 2009;324:1080–4. doi: 10.1126/science.1168878. [DOI] [PMC free article] [PubMed] [Google Scholar]
- van Zessen R, Phillips JL, Budygin EA, Stuber GD. Activation of VTA GABA neurons disrupts reward consumption. Neuron. 2012;73:1184–94. doi: 10.1016/j.neuron.2012.02.016. [DOI] [PMC free article] [PubMed] [Google Scholar]
- Venton BJ, Michael DJ, Wightman RM. Correlation of local changes in extracellular oxygen and pH that accompany dopaminergic terminal activity in the rat caudate-putamen. J Neurochem. 2003;84:373–81. doi: 10.1046/j.1471-4159.2003.01527.x. [DOI] [PubMed] [Google Scholar]
- Vyklicky L, Jr, Vlachova V, Krusek J. The effect of external pH changes on responses to excitatory amino acids in mouse hippocampal neurones. J Physiol. 1990;430:497–517. doi: 10.1113/jphysiol.1990.sp018304. [DOI] [PMC free article] [PubMed] [Google Scholar]
- Witten IB, Steinberg EE, Lee SY, Davidson TJ, Zalocusky KA, Brodsky M, Yizhar O, Cho SL, Gong S, Ramakrishnan C, Stuber GD, Tye KM, Janak PH, Deisseroth K. Recombinase-driver rat lines: tools, techniques, and optogenetic application to dopamine-mediated reinforcement. Neuron. 2011;72:721–33. doi: 10.1016/j.neuron.2011.10.028. [DOI] [PMC free article] [PubMed] [Google Scholar]
- Xiao X, Li J, Samulski RJ. Production of high-titer recombinant adeno-associated virus vectors in the absence of helper adenovirus. J Virol. 1998;72:2224–32. doi: 10.1128/jvi.72.3.2224-2232.1998. [DOI] [PMC free article] [PubMed] [Google Scholar]
- Yavich L. Two simultaneously working storage pools of dopamine in mouse caudate and nucleus accumbens. Br J Pharmacol. 1996;119:869–76. doi: 10.1111/j.1476-5381.1996.tb15753.x. [DOI] [PMC free article] [PubMed] [Google Scholar]