

Abstract
Sociocultural phenomena, such as exogamy or phylopatry, can largely determine human sex-specific demography. In Central Africa, diverging patterns of sex-specific genetic variation have been observed between mobile hunter–gatherer Pygmies and sedentary agricultural non-Pygmies. However, their sex-specific demography remains largely unknown. Using population genetics and approximate Bayesian computation approaches, we inferred male and female effective population sizes, sex-specific migration, and admixture rates in 23 Central African Pygmy and non-Pygmy populations, genotyped for autosomal, X-linked, Y-linked, and mitochondrial markers. We found much larger effective population sizes and migration rates among non-Pygmy populations than among Pygmies, in agreement with the recent expansions and migrations of non-Pygmies and, conversely, the isolation and stationary demography of Pygmy groups. We found larger effective sizes and migration rates for males than for females for Pygmies, and vice versa for non-Pygmies. Thus, although most Pygmy populations have patrilocal customs, their sex-specific genetic patterns resemble those of matrilocal populations. In fact, our results are consistent with a lower prevalence of polygyny and patrilocality in Pygmies compared with non-Pygmies and a potential female transmission of reproductive success in Pygmies. Finally, Pygmy populations showed variable admixture levels with the non-Pygmies, with often much larger introgression from male than from female lineages. Social discrimination against Pygmies triggering complex movements of spouses in intermarriages can explain these male-biased admixture patterns in a patrilocal context. We show how gender-related sociocultural phenomena can determine highly variable sex-specific demography among populations, and how population genetic approaches contrasting chromosomal types allow inferring detailed human sex-specific demographic history.
Keywords: approximate Bayesian computation, African Pygmy, demography, history, human population genetics, sex specific
Introduction
Gender-related sociocultural phenomena can deeply influence the sex-specific demography of human populations. For instance, polygyny or polyandry, different clan or lineage transmission systems, historical boundaries or discriminatory barriers between populations, the economic statuses of spouses, or different levels of social acceptance of extramarital reproduction can widely determine levels of male and female migration within and between human communities (MacDonald and Hewlett 1999; Chaix et al. 2004; Hammer et al. 2008; Heyer et al. 2012; Pemberton et al. 2012). Furthermore, complex interactions between social and demographic mechanisms lead to different patterns of sex-biased transmission of reproductive success among human populations, depending on their lifestyle, influencing in turn sex-specific patterns of genetic diversity (Austerlitz and Heyer 1998; Sibert et al. 2002; Heyer et al. 2005; Blum et al. 2006; Brandenburg et al. 2012). Understanding the extent to which demographic features and complex sociocultural behaviors influence sex-specific genetic patterns remains a challenging task for human population geneticists (Ramachandran et al. 2004; Chaix et al. 2007; Hammer et al. 2008; Heyer et al. 2012).
Over the past decades, extensive population genetics studies have focused on the mitochondrial DNA (mtDNA) and the nonrecombining portion of the Y chromosome (NRY) to better understand the history of migration and demography of human populations worldwide (Seielstad et al. 1998; Excoffier and Schneider 1999; Quintana-Murci et al. 1999; Underhill et al. 2000; Hammer et al. 2001; Salas et al. 2002; Macaulay et al. 2005; Kayser et al. 2006; Cruciani et al. 2007). For instance, phylogeographic studies have shown that spatial patterns of mtDNA diversity in the southern part of the Eurasian continent and South-Eastern Asia support a coastal route of eastward migration of human populations out of the horn of Africa approximately 60,000 years ago (Quintana-Murci et al. 1999; Macaulay et al. 2005). Furthermore, studies of uniparentally inherited genetic markers (mtDNA and NRY) have identified sex-biased migrations within and among human populations resulting from sociocultural behaviors related to marriage customs and spouse mobility (Hammer et al. 2001; Oota et al. 2001; Salas et al. 2002; Destro-Bisol et al. 2004; Hamilton et al. 2005; Ségurel et al. 2008; Gunnarsdóttir et al. 2011). Indeed, in patrilocal exogamous populations, where women move to live close to their in-laws and where marriages of women to men outside the community are favored, mtDNA shows lower levels of genetic differentiation among populations than NRY (Seielstad et al. 1998; Oota et al. 2001).
It is often difficult to disentangle sex-specific effective population sizes and migratory parameters when restricting analyses to the levels of genetic differentiation of uniparentally inherited markers within and among populations. To overcome these limitations, a number of studies have jointly investigated autosomal, X-linked, Y-linked, and mtDNA genetic diversity, using specific inference methods (Ramachandran et al. 2004; Wood et al. 2005; Balaresque et al. 2006; Cox et al. 2008; Hammer et al. 2008; Pilkington et al. 2008; Ségurel et al. 2008; Keinan et al. 2009). They demonstrated that patterns of sex-specific demography were highly variable among human populations and that global geographical patterns often did not accurately predict local patterns of sex-specific human diversity (Hammer et al. 2001; Ramachandran et al. 2004; Wilkins and Marlowe 2006; Ségurel et al. 2008; Heyer et al. 2012).
In this context, the diversity of the NRY and mtDNA of sub-Saharan African populations has been extensively studied to address long-standing questions about the demographic history of populations with different subsistence and mobility behaviors (Seielstad et al. 1998; Underhill et al. 2000; Hammer et al. 2001; Salas et al. 2002; Knight et al. 2003; Batini et al. 2007; Cruciani et al. 2007; Tishkoff et al. 2007; Quintana-Murci et al. 2008; Berniell-Lee et al. 2009; Batini, Lopes, et al. 2011; de Filippo et al. 2011). For instance, variable patterns of mtDNA and NRY diversity between hunter–gatherer Pygmies and agricultural non-Pygmies have been found to be consistent with recent demographic expansions of agricultural populations throughout Central and Southern Africa 5,000–3,000 years ago, while hunter–gatherer population sizes remained stationary or even underwent contraction events (Excoffier and Schneider 1999; Quintana-Murci et al. 2008; Berniell-Lee et al. 2009; de Filippo et al. 2011; Batini, Ferri, et al. 2011; Batini, Lopes, et al. 2011).
Differences between sub-Saharan African hunter–gatherers and agriculturalists in marriage practices, such as polygyny and patrilocality, were also proposed for explaining the observed diverging patterns of sex-specific diversity among populations (Seielstad et al. 1998; Hammer et al. 2001; Destro-Bisol et al. 2004). Although mtDNA diversity in sub-Saharan Africa indicated extended female mobility among populations, thus consistent with predominant patrilocal customs in these populations, NRY diversity was also consistent with extended male mobility among populations (Seielstad et al. 1998; Hammer et al. 2001). Destro-Bisol et al. (2004) showed that the observed mtDNA and NRY patterns were consistent with a lesser prevalence of polygyny and patrilocality in hunter–gatherer populations than in farmer populations, as well as with intermarriages between male farmers and female hunter–gatherers. These authors further proposed an elaborated historical scenario that included farmers’ demographic expansion, hunter–gatherers’ stationary or contracting demography, variable prevalence of gender-related marriage customs (such as polygyny and patrilocality), and sociohistorical barriers against intermarriages. They showed how these factors can influence together effective population sizes and sex-specific migrations among and within the two groups of populations.
However, the study by Destro-Bisol et al. (2004) could not provide estimates of male and female effective population size. It could also not estimate levels of gender-related migrations within groups of hunter–gatherer and farmer populations, respectively, as well as the variable levels of sex-specific admixture from the farmers into the hunter–gatherers. The availability of large sets of nuclear markers, computer-intensive clustering algorithms and coalescent-based methods now allow obtaining such demographic parameter estimates (for a review see Nielsen and Beaumont 2009). Furthermore, Destro-Bisol et al. (2004)’s hunter–gatherer sample pooled six populations (Hadza, Hadzabe, !Kung, and three Central African Pygmy populations). Therefore, they could not study the variability of gender-specific processes across the various hunter–gatherer populations. Such variability is however expected, especially across the numerous populations categorized as Pygmies throughout Central Africa. Indeed, more than 20 hunter–gatherer Central African populations are historically designated as “Pygmies” and have been shown to be culturally very heterogeneous and genetically widely differentiated while likely sharing a common origin (Hewlett 1996; Verdu et al. 2009; Patin et al. 2009; Tishkoff et al. 2009; Batini, Lopes, et al. 2011; Bahuchet 2012; Jarvis et al. 2012; Lachance et al. 2012). Furthermore, these studies, mainly based on autosomal and mtDNA data, highlighted that Pygmy populations had variable levels of admixture from neighboring non-Pygmy farmer populations.
In this context, using a large set of markers corresponding to the four modes of parental transmission (autosomal, X-linked, Y-linked, and mtDNA), and taking advantage of recently developed computationally intensive methods, we studied how variable prevalence of phenomena such as polygyny, patrilocality, social discriminations, sex-specific barriers against intermarriages affected sex-specific demographic parameters among Central African hunter–gatherer Pygmies, and their neighboring agricultural non-Pygmy populations. To do so, we performed a thorough comparison of genetic variation at autosomal, X-linked, and Y-linked microsatellites, and at the hypervariable region 1 (HVR-1) of mtDNA in a uniquely large sample of 23 hunter–gatherer Pygmy and neighboring non-Pygmy agricultural populations from Western Central Africa (fig. 1 and table 1). We contrasted results obtained from analysis of genetic variance, model-based Bayesian clustering, and approximate Bayesian computation (ABC) analyses between all four chromosomal types to evaluate sex-related migration patterns among Central African populations, and to estimate sex-specific effective population sizes. We further investigated the complex patterns of sex-specific admixture between Pygmies and non-Pygmies.
Fig. 1.

Geographic location of population samples. Populations were categorized in Pygmy (in red) and non-Pygmy (in blue) based on numerous cultural criteria (see Materials and Methods). Pygmy areas of peopling were inferred based on our field work. See population codes in table 1.
Table 1.
Population Samples.
| Population Code | Population Name | Location | Number of Individuals |
|||
|---|---|---|---|---|---|---|
| 28 Autosomal Microsatellites | 8 X-Chromosome Microsatellites | 6 NRY Microsatellites | mtDNA HVR-1 359 bp | |||
| Pygmies | ||||||
| BEZ | Bezan | North West Cameroon | 29a | 28 | 24 | 35b |
| CBK | Central Baka | Central Cameroon | 29a | 30 | nd | 30b |
| EBK | Eastern Baka | South East Cameroon | 29a | 30 | 29 | nd |
| SBK | Southern Baka | South Cameroon | 29a | 29 | 13 | 58b |
| GBK | Gabonese Baka | North Gabon | 30a | 30 | 25 | 39b |
| KOL | Kola | South West Cameroon | 31a | 30 | 17 | 88b |
| KOY | Koya | North East Gabon | 29a | 29 | 16 | 31b |
| EBG | Eastern Bongo | South East Gabon | 30a | 30 | 18 | 37b |
| SBG | Southern Bongo | South Gabon | 30a | 30 | 13 | nd |
| CBG | Central Bongo | Central Gabon | 13 | 13 | 10 | nd |
| Non-Pygmies | ||||||
| TIK | Tikar | North West Cameroon | 30a | 30 | 19 | nd |
| NZI | Nzime | Central Cameroon | 31a | 32 | 5 | nd |
| BGD | Bangando | South East Cameroon | 30a | 30 | 23 | nd |
| CFG | Camerounese Fang | South Cameroon | 30a | 29 | 17 | 39b |
| GFG | Gabonese Fang | North Gabon | 30a | 30 | 60c | 65b |
| NGB | Ngumba | South West Cameroon | 30a | 30 | nd | 74b |
| AKL | Akele (Mékambo) | North East Gabon | 13a | 10 | 12 | nd |
| AKL+ | Akele (Libreville) | Gabon (Libreville) | nd | nd | nd | 46b |
| TEK | Teke | South East Gabon | 30a | 30 | 48c | 54b |
| NZE | Nzebi | South Gabon | 30a | 30 | 57c | 62b |
| KOT | Kota | Central East Gabon | 30a | 28 | 53c | 56b |
| TSG | Tsogho | Central Gabon | 30a | 29 | 60c | 64b |
| EWD | Ewondo | Cameroon (Yaoundé) | 24a | 23 | 10 | 25b |
| Total | 617 | 610 | 529 | 803 | ||
Note.—The number of individuals genotyped or sequenced is given for each chromosomal type (autosomal, X-chromosome, NRY, and mtDNA HVR-1). Sample geographic locations are given in figure 1. “nd” indicates when no data were available.
aData previously published in Verdu et al. (2009).
bData previously published in Quintana-Murci et al. (2008).
cData previously published in Berniell-Lee et al. (2009).
Results
Opposite Sex-Specific Genetic Diversity Patterns between Pygmies and Non-Pygmies
The 28 independent autosomal microsatellites had an estimated mean genetic diversity (Nei 1978) of 73.7% across the 10 Pygmy populations (standard deviation [SD] = 1.1% across populations) and 74.1% for the 12 non-Pygmy populations (SD = 0.7%) (table 2). This genetic diversity was significantly lower for the eight independent X-chromosome microsatellites than for the autosomes, for both Pygmies and non-Pygmies (Wilcoxon one-sided paired-test P value = 9.8 × 10⁻⁴ for Pygmy populations and 2.4 × 10⁻⁴ for non-Pygmies). In both cases, the genetic diversity values were not significantly different between Pygmy and non-Pygmy populations (Wilcoxon two-sided test P value of 0.23 for the autosomal microsatellites and of 0.06 for the X-chromosome microsatellites).
Table 2.
Population Genetic and Haplotypic Diversity.
| Population | Autosomes |
X-Chromosome |
NRY |
mtDNA HVR-1 |
||||
|---|---|---|---|---|---|---|---|---|
| NS | GDa | NS | GDa | NS | HDb | NS | HDb | |
| Pygmies | ||||||||
| BEZ | 29 | 0.719 (0.064) | 28 | 0.685 (0.096) | 24 | 0.648 (0.108) | 35 | 0.703 (0.027) |
| CBK | 29 | 0.753 (0.068) | 30 | 0.653 (0.088) | nd | nd | 30 | 0.830 (0.035) |
| EBK | 29 | 0.746 (0.066) | 30 | 0.627 (0.085) | 29 | 0.747 (0.111) | nd | nd |
| SBK | 29 | 0.752 (0.053) | 29 | 0.669 (0.091) | 13 | 0.709 (0.065) | 58 | 0.786 (0.037) |
| GBK | 30 | 0.736 (0.074) | 30 | 0.670 (0.099) | 25 | 0.719 (0.044) | 39 | 0.757 (0.052) |
| KOL | 31 | 0.728 (0.070) | 30 | 0.701 (0.062) | 17 | 0.580 (0.132) | 88 | 0.722 (0.024) |
| KOY | 29 | 0.734 (0.086) | 29 | 0.632 (0.131) | 16 | 0.469 (0.213) | 31 | 0.548 (0.087) |
| EBG | 30 | 0.737 (0.069) | 30 | 0.704 (0.103) | 18 | 0.615 (0.119) | 37 | 0.649 (0.078) |
| SBG | 30 | 0.724 (0.061) | 30 | 0.690 (0.083) | 13 | 0.658 (0.098) | nd | nd |
| CBG | 13 | 0.737 (0.071) | 13 | 0.597 (0.201) | 10 | 0.667 (0.173) | nd | nd |
| Average Pygmies | 279 | 0.737 (0.011) | 279 | 0.663 (0.035) | 207 | 0.646 (0.084) | 318 | 0.714 (0.094) |
| Non-Pygmies | ||||||||
| TIK | 30 | 0.739 (0.069) | 30 | 0.676 (0.087) | 19 | 0.590 (0.146) | nd | nd |
| NZI | 31 | 0.743 (0.074) | 32 | 0.695 (0.092) | 5 | 0.450 (0.251) | nd | nd |
| BGD | 30 | 0.728 (0.071) | 30 | 0.702 (0.082) | 23 | 0.480 (0.290) | nd | nd |
| CFG | 30 | 0.744 (0.056) | 29 | 0.689 (0.081) | 17 | 0.622 (0.085) | 39 | 0.970 (0.014) |
| GFG | 30 | 0.746 (0.067) | 30 | 0.708 (0.091) | 60 | 0.565 (0.123) | 65 | 0.974 (0.008) |
| NGB | 30 | 0.741 (0.061) | 30 | 0.669 (0.091) | nd | nd | 74 | 0.968 (0.009) |
| AKL | 13 | 0.738 (0.066) | 10 | 0.683 (0.149) | 12 | 0.593 (0.165) | nd | nd |
| AKL+ | nd | nd | nd | nd | nd | nd | 46 | 0.984 (0.008) |
| TEK | 30 | 0.746 (0.068) | 30 | 0.713 (0.110) | 48 | 0.558 (0.117) | 54 | 0.985 (0.007) |
| NZE | 30 | 0.743 (0.072) | 30 | 0.685 (0.107) | 57 | 0.527 (0.132) | 62 | 0.975 (0.010) |
| KOT | 30 | 0.732 (0.063) | 28 | 0.703 (0.129) | 53 | 0.567 (0.105) | 56 | 0.967 (0.010) |
| TSG | 30 | 0.757 (0.060) | 29 | 0.720 (0.093) | 60 | 0.505 (0.191) | 64 | 0.958 (0.011) |
| EWD | 24 | 0.737 (0.070) | 23 | 0.648 (0.132) | 10 | 0.482 (0.269) | 25 | 0.933 (0.023) |
| Average non-Pygmies | 338 | 0.741 (0.007) | 331 | 0.691 (0.020) | 414 | 0.540 (0.055) | 485 | 0.968 (0.016) |
Note.—Values expressed in parentheses are standard deviations (SD). Refer table 1 for population codes. NS indicates the sample sizes; “nd” indicates when no data were available. GD, gene diversities; HD, haplotypic diversity.
aGD for 28 autosomal and 8 X-chromosome microsatellites were estimated as in Nei (1978).
bHD for six NRY microsatellites and mtDNA HVR-1 359 bp sequences were estimated as in Nei (1978).
Conversely, considering the six NRY microsatellites, we found a significantly lower mean haplotype diversity (Nei 1978) for the non-Pygmy populations than for the Pygmy populations (Wilcoxon two-sided test P value = 6 × 10⁻³). Interestingly however, we found the opposite pattern for the mtDNA HVR-1 sequences, for which haplotype diversity was significantly higher (Wilcoxon two-sided test P value = 2 × 10⁻⁴) in the non-Pygmy populations than in the Pygmy populations (table 2). This higher mitochondrial diversity in non-Pygmies than in Pygmies was accompanied by significantly higher nucleotide diversity (π, Nei 1987) for non-Pygmy populations: on average across nine non-Pygmy populations, π = 0.026 (SD = 0.0017 across populations), compared with π = 0.019 (SD = 0.003) on average across seven Pygmy populations (Wilcoxon two-sided test P value = 9 × 10⁻⁴).
Analysis of Molecular Variance Reveals Opposite Sex-Specific Population Differentiation between Pygmies and Non-Pygmies
Considering the 22 Pygmy and non-Pygmy populations together, we found (table 3) significant FST values of 0.014 for the 28 autosomal microsatellites and of 0.031 for the eight X-chromosome microsatellites (P value < 10−5 in both cases). For the NRY and mtDNA HVR-1 data, we found larger FST values of 0.066 and 0.204, respectively (P value < 10−5 in both cases). For all four chromosomal types, we found much greater genetic structure among Pygmy populations than among non-Pygmies. Indeed, when separately considering the two groups of populations, we found that FST values were systematically between two and eight times higher for Pygmy populations than for non-Pygmy populations (table 3). This can be interpreted under an island model (Wright 1931) as a much greater isolation and/or a much smaller effective population size for Pygmy populations than for non-Pygmy populations.
Table 3.
Population FST Values (AMOVA) for Four Chromosomal Types.
| AMOVA FST |
||||
|---|---|---|---|---|
| Autosomes | X-Chromosome | NRY | mtDNA HVR-1 | |
| All populations | 0.0140** (22) | 0.0312** (22) | 0.0659** (20) | 0.2035** (16) |
| Pygmy populations | 0.0202** (10) | 0.0447** (10) | 0.0681** (9) | 0.1565** (7) |
| Non-Pygmy populations | 0.0037** (12) | 0.0063* (12) | 0.0322** (11) | 0.0205** (9) |
Note.—Refer table 1 for population groupings in Pygmies and non-Pygmies. Values in parentheses are the number of populations considered in the AMOVA analyses. Significance tests are based on 10,000 permutations of individuals among populations.
*P value < 0.05.
**P value < 10−5.
Interestingly, when comparing the NRY and the mtDNA HVR-1 data, we found opposite patterns of sex-specific population structure between Pygmies and non-Pygmies: we found a lower FST value for the NRY (FST(Y) = 0.068, P value < 10−5) than for mtDNA HVR-1 (FST(mtDNA) = 0.157, P value < 10−5) for Pygmy populations; conversely, we found a higher FST value for the NRY (FST(Y) = 0.032, P value < 10−5) than for mtDNA HVR-1 (FST(mtDNA) = 0.020, P value < 10−5) for non-Pygmy populations.
Contrasting FST Values between the Four Chromosomal Types
We calculated the Nm values for male and female lineages from the FST(Y) and FST(mtDNA) values, respectively, under an island model (Wright 1931; see Materials and Methods). Nm was 3.6 times higher for male lineages (Nmmm = 7.09) than for female lineages (Nfmf = 1.96) when considering all populations together (table 4). This could reflect a strong sex-biased migration for males among all populations and/or an effective population size more than triple in males. For the Pygmy populations alone, we found a male to female ratio Nmmm/Nfmf of 2.54, showing thus the same male-biased pattern (table 4). However, we found an opposite pattern when considering non-Pygmy populations only: the ratio Nmmm/Nfmf was of 0.63 (table 4), indicating female-biased migration among non-Pygmy populations, and/or a much greater effective population size for females than for males.
Table 4.
Ratios of Sex-Specific AMOVA FST Values and Demographic Parameters Nm.
| Nmmm/Nfmf | FST(X)/FST(A) | |
|---|---|---|
| All populations | 3.62 | 2.23 |
| Pygmy populations | 2.54 | 2.22 |
| Non-Pygmy populations | 0.63 | 1.70 |
Note.—Nmmm was calculated using the FST values for the NRY microsatellites and Nfmf using the FST values for the mtDNA HVR-1 sequences. FST(X) represents the FST values for the X-chromosome microsatellites and FST(A) for the autosomal microsatellites. AMOVA FST values are as given in table 3.
Computing the ratio of FST(X)/FST(A) in all populations together, the observed ratio (FST(X)/FST(A) = 2.23, table 4) was above 2.0 and, thus, was compatible only with a male-biased sex ratio in Central Africa, that is, where men have a larger effective population size than women (see Materials and Methods and supplementary fig. S1, Supplementary Material online). Considering Pygmies and non-Pygmies separately, we found that, for the Pygmy populations only, the observed ratio (FST(X)/FST(A) = 2.22, table 4) was also above 2.0 and, thus, was compatible only with a male-biased sex ratio. Conversely, for non-Pygmy populations, we found a ratio FST(X)/FST(A) between 1.0 and 2.0, and thus compatible with a nonbiased sex ratio.
Multidimensional Scaling Representations of Population Pairwise FST for the Four Chromosomal Types
Using two-dimensional metric multidimensional scaling (MDS) analyses, we compared the pairwise FST values between each pair of populations for the autosomal, X-chromosome, NRY, and mtDNA HVR-1 data separately (fig. 2). We found that for all four chromosomal types, the first axis separated mostly Pygmy and non-Pygmy populations. Moreover, the Pygmy populations were always scattered across the MDS plots, thus showing their large genetic differentiation. Non-Pygmy populations were much more tightly clustered for the autosomal microsatellites and mtDNA HVR-1 sequences and slightly more scattered for the X-chromosome and NRY microsatellites. Note that Pygmy populations were never found tightly clustered with their immediate non-Pygmy neighbors for any of the four chromosomal types under study.
Fig. 2.

Two-dimensional metric MDS based on population pairwise genetic distances. Pairwise genetic differentiation were estimated as FST (Weir and Cockerham 1984) and set to 0 when found not significant based on 10,000 permutation tests. Matrices of pairwise FST are then projected in a two-dimensional space using a metric MDS approach (Axis 1 = first principal coordinate, Axis 2 = second principal coordinate). Upper-left plot: pairwise FST for 28 autosomal microsatellites, Spearman’s ρ = 0.82 (see Materials and Methods). Upper-right plot: pairwise FST for eight X-chromosome microsatellites, Spearman’s ρ = 0.67. Lower-left plot: pairwise FST for six NRY microsatellites, Spearman’s ρ = 0.69. Lower-right plot: pairwise FST for mtDNA HVR-1 359 bp sequences, Spearman’s ρ = 0.98. Pygmy populations are indicated in light gray and non-Pygmy populations in dark gray. See population codes in table 1.
Importantly, we observed that each uniparentally inherited marker yielded a different picture of the variability of genetic distances, first within Pygmy and non-Pygmy populations, respectively, and, second, between Pygmies and non-Pygmies. First, for non-Pygmy populations, we see a greater structure for the NRY than for the mtDNA HVR-1, for which all these populations were virtually undistinguishable. On the other hand, Pygmy populations exhibited a greater level of genetic structure for these two chromosomal types. Second, using mtDNA HVR-1 sequences, we observed a much greater separation between Pygmy and non-Pygmy populations along the first axis of the MDS, in contrast with their much lower separation for the NRY microsatellites. As an extreme example, we found that the Koya Pygmies (KOY) clustered together with most of the non-Pygmy populations for the NRY. Conversely, when using mtDNA HVR-1 sequences, they exhibited great genetic distances with all non-Pygmy populations and clustered closely with the other Pygmy populations. This suggested that Koya Pygmies are highly similar with non-Pygmies with respect to their male lineages, but not at all for their female lineages.
ABC Estimates of Effective Population Sizes and Admixture Rates in Pygmies and Non-Pygmies
We conducted series of ABC analyses (see Materials and Methods) to disentangle and estimate sex-specific effective population sizes and admixture rates between Pygmies and neighboring non-Pygmy populations, considering the four chromosomal types (autosomal, X-chromosome, NRY, and mtDNA HVR-1) separately. We report effective population size ABC posterior estimates obtained considering each population separately using one-population ABC analyses for both Pygmy and non-Pygmy populations. Note that, as our ABC approach considers stepwise changes in effective population sizes, the posterior effective population sizes (N) reported here correspond to the N of the population during its recent history (i.e., after this change), rather than a value of N averaged over the history of the population. We then report posterior estimates of admixture levels from non-Pygmies into each Pygmy population separately, as well as divergence time estimates between pairs of Pygmy populations obtained using the three-population ABC analyses (see Materials and Methods and supplementary fig. S2, Supplementary Material online). Note that the effective population size posterior distributions (90% confidence interval [CI], 1st and 4th quartile, rank order of medians and of most modes within population across chromosomal types) obtained for each Pygmy population separately were very consistent between the one-population and three-population ABC analyses (supplementary fig. S3, Supplementary Material online), thus showing that effective population size estimates using one-population ABC analyses are not widely affected by the lack of potential admixture between populations in such models.
Effective Population Sizes with One-Population ABC Analyses: Opposite Sex-Specific Effective Population Size Patterns between Pygmies and Non-Pygmies
For the four chromosomal types, posterior estimates of effective population sizes were an order of magnitude higher in non-Pygmies compared with Pygmies (figs. 3 and 4). Considering autosomal microsatellites, posterior modal estimates of effective population sizes in non-Pygmy populations ranged from 11,842 individuals (90% CI: 3,394–83,062) in the Tikar (TIK) to 28,933 individuals (90% CI: 7,553–92,325) in the Kota (KOT), whereas in Pygmy populations these modal estimates ranged from 3,897 individuals (90% CI: 1,680–9,407) in the Bezan (BEZ) to 7,019 individuals (90% CI: 2,333–9,616) in the Southern Bongo (SBG).
Fig. 3.

Posterior distributions of non-Pygmy populations effective population sizes using ABC analyses. Posterior distributions were obtained considering scenarios with a single population and one potential change in effective population size, for each non-Pygmy population separately. For each one of the four chromosomal types, we simulated separately one million data sets and posterior distributions of the effective population sizes were estimated based on the 10,000 (1%) top simulations providing summary statistics closest to the observed data. Results in black correspond to the 28 autosomal microsatellites; in orange: eight X-chromosome microsatellites; in blue: six NRY microsatellites; and in red: mtDNA HVR-1 359 bp sequences. See Materials and Methods and supplementary materials, Supplementary Material online, for further description of the simulation and ABC analyses. See table 1 for population codes.
Fig. 4.

Posterior distributions of Pygmy populations effective population sizes using ABC analyses. Posterior distributions were obtained considering scenarios with a single population and one potential change in effective population size, for each Pygmy population separately. For each one of the four chromosomal types, we simulated separately one million data sets and posterior distributions of the effective population size were estimated based on the 10,000 (1%) top simulations providing summary statistics closest to the observed data. Results in black correspond to the 28 autosomal microsatellites; in orange: eight X-chromosome microsatellites; in blue: six NRY microsatellites; and in red: mtDNA HVR-1 359 bp sequences. See Materials and Methods and supplementary materials, Supplementary Material online, for further description of the simulation and ABC analyses. See table 1 for population codes.
When considering sex-specific effective population sizes, as obtained from NRY and mtDNA HVR-1 data, we observed strikingly different patterns between non-Pygmy and Pygmy populations (figs. 3 and 4). Effective population sizes (estimated either by the mode or the median) were significantly higher for female lineages (mtDNA) than for male lineages (NRY) in the non-Pygmy populations (Wilcoxon one-sided test P value = 0.004), whereas the opposite was true in Pygmy populations (Wilcoxon one-sided test P value = 0.008) (figs. 3 and 4). Finally, the differential patterns found here between Pygmies and non-Pygmies for autosomal or sex-specific markers remained valid when considering the composite parameters N (where
  is the estimated posterior average mutation rate and N is the estimated posterior effective population size) instead of considering only the original parameter N (supplementary tables S1 and S2, Supplementary Material online).
Admixture Levels in Each Pygmy Population with Three-Population ABC Analyses: Heterogeneous Male-Biased Admixture from Non-Pygmies in Each Pygmy Population
Considering the four chromosomal types separately, we found that each Pygmy populations exhibited a different level of genetic introgression from the non-Pygmy populations (fig. 5). Using autosomal data, we found posterior estimates of admixture levels ranging from a mode equal to 62.2% admixture (90% CI: 21.6–93.2) in the Bezan (BEZ) to 83.9% admixture (90% CI: 42.6–97.0) in the Southern Bongo (SBG). Considering only the X-chromosome data, we found that admixture levels ranged from 16.0% admixture (90% CI: 3.1–80.9) in the Central Bongo (CBG) to 89.3% admixture (90% CI: 38.3–97.6) in the Southern Bongo (SBG).
Fig. 5.

Posterior distributions of the rate of genetic introgression from non-Pygmy populations into each Pygmy population using ABC analyses. Posterior distributions were obtained considering the three-population models described in supplementary figure S2, Supplementary Material online. For each one of the four chromosomal types, we simulated separately one million data sets for all the analyses involving a different pair of Pygmy populations (together with the corresponding non-Pygmy neighboring population see Materials and Methods and supplementary fig. S2, Supplementary Material online). For each Pygmy population and each chromosomal type separately, posterior distributions of the level of genetic introgression from the non-Pygmies were estimated based on the 10,000 (1%) top simulations providing summary statistics closest to the observed data. To obtain a single posterior distribution for a given Pygmy population and a given chromosomal type, we merged the corresponding posterior distributions obtained for the ABC analyses considering that particular Pygmy population (see Materials and Methods). The color code is the same as in figures 3 and 4. See table 1 for population codes.
Moreover, we found significantly (Wilcoxon one-sided test P value = 0.016 considering the mode or the median) higher admixture estimates when using the NRY microsatellites than when using mtDNA HVR-1 sequences. The admixture level computed from the NRY microsatellites ranged from 43.1% admixture (90% CI: 10.9–87.6) in the Bezan (BEZ) to 98.0% admixture (90% CI: 42.0–99.0) in the Koya (KOY), whereas the admixture fraction computed from mtDNA HVR-1 sequences ranged from 1.5% (90% CI: 0.8–70.6) in the Kola (KOL) to 19.6% (90% CI: 6.5–77.1) in the Southern Baka (SBK).
Divergence Times between Pairs of Pygmy Populations with ABC Analyses
The estimates obtained for the divergence time among each pair of Pygmy populations in our sample (tp) for the four chromosomal types separately showed a signal for a recent divergence among Western Central African Pygmy populations (supplementary fig. S4 and tables S3–S6, Supplementary Material online). When merging all posterior distributions for the autosomal markers (supplementary fig. S4 and table S3, Supplementary Material online), the Kola showed the lowest estimated divergence time from all other Pygmy populations (351 generations, 90% CI: 89–2,212), whereas the Eastern Bongo showed the highest divergence time (468 generations, 90% CI: 116–2,544) (supplementary fig. S4 and table S3, Supplementary Material online). The averaged posterior estimate tp for the Central Bongo (CBG) differed little from the prior considering only autosomal data indicating a lack of information to estimate this divergence time for this population, presumably due to small sample size.
Our results using X-chromosome, NRY, and mtDNA HVR-1 data provided further evidence for a recent divergence between the Pygmy populations from Western Central Africa (supplementary fig. S4 and table S4, Supplementary Material online). Considering the X-chromosome data, the merged posterior estimates for tp ranged from 410 generations (90% CI: 103–2,614) for the Southern Bongo (SBG) to 491 generations (90% CI: 120–2,846) for the Eastern Bongo (EBG). The averaged posterior estimates of tp for the Koya and Central Bongo (KOY and CBG) differed little from the prior, indicating a lack of information to estimate these divergence times when considering only eight X-chromosome microsatellites (supplementary fig. S4 and table S4, Supplementary Material online).
Considering the NRY, the merged posterior estimates for tp ranged from 489 generations (90% CI: 111–2,960) for the Southern Bongo (SBG) to 664 generations (90% CI: 159–3,279) for the Bezan (BEZ). However, using this paternally inherited marker, the ABC posterior estimates of tp were very similar to the prior (supplementary fig. S4 and table S5, Supplementary Material online), presumably because of the small sample sizes considering the NRY, and should hence be considered with caution.
Considering the mtDNA HVR-1 sequences only (supplementary fig. S4 and table S6, Supplementary Material online), the merged posterior estimates for tp ranged from 338 generations (90% CI: 93–2,443) for the Bezan (BEZ) to 467 generations (90% CI: 133–2,607) for the Kola (KOL). We did not consider the posterior estimate of tp for the Eastern Bongo (EBG) because it differed little from the prior, indicating a lack of information about this divergence time for this locus and this population (supplementary fig. S4 and table S6, Supplementary Material online).
Finally, as compared with the five and seven population ABC approaches developed in Verdu et al. (2009), our three-population approach presumably lacked genetic information due to small sample sizes for accurately estimating ancient historical events of divergence and admixture. The ancient Pygmy/non-Pygmy divergence time parameter (tpnp, supplementary fig. S2, Supplementary Material online), the ancient admixture time and rate parameters (taa and raa, supplementary fig. S2, Supplementary Material online), and the recent admixture time (tra, supplementary fig. S2, Supplementary Material online) should thus be regarded as nuisance parameters in our models.
Individual Clustering Using Jointly Autosomal and X-Chromosome Data Reveal New Patterns of Genetic Structure
Using the Bayesian clustering algorithm implemented in the software program STRUCTURE (Pritchard et al. 2000; Falush et al. 2003) on the 28 autosomal microsatellites and the eight X-chromosome microsatellites jointly, we found, for K = 2 (fig. 6), that non-Pygmy individuals had their genotype membership predominantly in the blue cluster (on average 87.7% across all non-Pygmy individuals, SD = 8.7%). Conversely, Pygmy individuals had a higher level of genotype membership in the alternative red cluster (on average 43.5% across all Pygmy individuals, SD = 23.9%). However, all Pygmies exhibited a substantial level of genotype membership in the blue cluster, with great heterogeneity among individuals and populations. This was true, in particular, for the three Bongo Pygmy groups (CBG, SBG, and EBG), whose members belonged primarily to the blue cluster. However, they still showed, on average, more genotype membership in the red cluster (18.8%, SD = 11.8%) than non-Pygmy individuals (12.3%, SD = 8.7%).
Fig. 6.

Individual clustering of Central African Populations using autosomal and X-chromosome microsatellites. Each individual in the data set is represented by a single vertical line divided into K colors corresponding to the proportion of their genotype clustering in each one of the K pre-assumed clusters obtained with STRUCTURE v2.3 (Pritchard et al. 2000; Falush et al. 2003), using 28 autosomal and eight X-chromosome microsatellites. The number of pre-assumed clusters K is indicated on the left of each bar plot. See table 1 for population codes. Pygmy population codes are indicated in red and non-Pygmy in blue. At K = 2, all 40 runs (see Materials and Methods) provided results that belonged to the same mode [average ln(Probability of observing the data) = −63,164.2, SD = 13.0]. At K = 3, 21 runs out of the 40 belonged to the same mode (presented here) with a higher average likelihood [average ln(Probability of observing the data) = −63,250.0, SD = 231.7] than that of the 19 runs belonging to the second mode [average ln(Probability of observing the data) = −63,328.0, SD = 232.4]. This alternate mode was however highly uninformative (result not shown). At K = 4, we found two informative modes among the 40 runs: one comprising 15 runs out of the 40 [mode 1, average ln(Probability of observing the data) = −63,947.4, SD = 903.5]; one comprising five runs out of the 40 [mode 2, average ln(Probability of observing the data) = −63,795.5, SD = 1,078.8]. The last mode found at K = 4 comprised 20 runs out of 40 and was highly uninformative (result not shown). No further clear population-specific genetic structure was found at K = 5 and higher (result not shown) Results were plotted using DISTRUCT (Rosenberg 2004).
A third cluster (in yellow, fig. 6) emerged at K = 3 and was associated mainly with Bezan Pygmy individuals (BEZ), who showed, on average, 56.4% (SD = 31.8%) genotype membership. Note that Koya (KOY) and Kola (KOL) Pygmy individuals also exhibited a substantial membership proportion in this yellow cluster: 15.5% (SD = 22.5%) and 28.0% (SD = 23.7%), on average, respectively.
At K = 4, we found two different informative clustering solutions with STRUCTURE (K = 4 modes 1 and 2, fig. 6). In the first solution (mode 1), a fourth pink cluster was associated mainly with Koya Pygmy individuals (KOY) and, to a lesser extent, Kola Pygmy individuals (KOL): on average 39.5% (SD = 22.1%) and 22.6% (SD = 19.6%), respectively, and only 5.6% (SD = 7.1%) for all other Pygmy and non-Pygmy individuals. In the second solution (mode 2), the fourth pink cluster corresponded almost exclusively to six non-Pygmy individuals from the Bangando population (BGD). Interestingly, the South-Eastern Cameroonian Bangando were the only Adamawa–Ubangian speaking non-Pygmy population in our sample, a family of languages mainly spoken in Central African Republic, Northern Democratic Republic of Congo and South Sudan (Lewis 2009). This was the only STRUCTURE result that showed a clear specific genetic pattern for some individuals from the same non-Pygmy population as compared with all other non-Pygmy individuals. Patterns of individual genetic structure in the other blue, red, and yellow clusters remain very similar to results obtained for K = 3 and K = 2 for all other Pygmy and non-Pygmy individuals. Finally, for K = 5 and K = 6, we found no further strong population-specific clustering pattern as compared with results obtained with K = 4 (results not shown).
Discussion
We inferred sex-specific effective population sizes, migrations, and admixture rates among numerous Central African Pygmy and non-Pygmy populations using population genetic approaches contrasting the four chromosomal types. We illustrate in details how historic and complex gender-related sociocultural factors can consistently explain the sex-specific patterns here found.
Opposite Sex-Specific Effective Population Sizes for Pygmies and Non-Pygmies, Respectively
Using ABC analyses and the four chromosomal types (autosomes, X-chromosome, NRY, and mtDNA HVR-1), we found effective population sizes systematically higher by an order of magnitude in non-Pygmy populations than in Pygmy populations. This is consistent with previous estimates (Verdu et al. 2009; Patin et al. 2009; Batini, Lopes, et al. 2011) and can be related to the recent non-Pygmy expansions associated with the emergence of agriculture 5,000–3,000 years ago in Central Africa (Excoffier and Schneider 1999; Phillipson 2005; Quintana-Murci et al. 2008; Berniell-Lee et al. 2009; Patin et al. 2009; Tishkoff et al. 2009; Verdu et al. 2009; Wegmann et al. 2009; Batini, Ferri, et al. 2011; Batini, Lopes, et al. 2011; de Filippo et al. 2011; Veeramah et al. 2012). Note that Veeramah et al. (2012) estimated an effective population size of approximately 20,000 individuals for Western Central African Pygmies, thus more than twice the various modal estimates found here using autosomal microsatellites (fig. 4). Nevertheless, they obtained this estimate by pooling their Biaka and Bakola Pygmy population samples into a single Western Pygmy population, whereas their study had shown significant levels of genetic differentiation between these two populations. Pooling genetically differentiated population should lead to effective population sizes estimates for the pooled population much larger than that of each population separately (Whitlock and Barton 1997), hence explaining the discrepancy with our own estimates. It is worth mentioning nevertheless that Veeramah et al. (2012) were focusing on inferring more ancient divergence events among Central and Southern African populations and could merge, for this purpose, their two Western Central African Pygmy populations given the recent common origin found among Pygmies (Verdu et al. 2009; Patin et al. 2009; Batini, Lopes, et al. 2011).
Focusing on sex-specific effective population sizes, we found opposite patterns between Pygmies and non-Pygmies (fig. 7A). Using ABC analyses, we found larger male than female effective population sizes in Pygmies, and the opposite in non-Pygmies. This was consistent with high levels of genetic diversity for the NRY and low levels for the mtDNA HVR-1 in Pygmies, and vice versa in non-Pygmies. Similarly, the ratio of X-chromosome to autosomal genetic differentiation (FST(X)/FST(A)) was consistent with higher male than female effective population sizes in Pygmies.
Fig. 7.

Schematic representation of the influence of historical and sociocultural factors on the sex-specific demography of Central African Pygmy and non-Pygmy populations inferred from genetic data. Non-Pygmy populations are represented in dark gray and Pygmy populations in light gray. Circle sizes are schematically proportional to effective population sizes (indicated by “Ne”). Arrow sizes represent schematically the intensity of migrations between populations in (A), and the intensity of genetic admixture in (B). ♀ represents women and ♂ represents men. (A) Sex-specific effective population sizes and migrations among non-Pygmy and Pygmy groups of populations, respectively. (B) How complex gender-related sociocultural behaviors regarding barriers against intermarriages and discriminations between Pygmies and non-Pygmies result in male-biased asymmetric gene flow from non-Pygmies in each Pygmy population in a context of patrilocality.
In non-Pygmy populations, the higher female than male effective population sizes have previously been explained by polygyny practices, which increase the variance of male reproductive success (Seielstad et al. 1998; Hammer et al. 2001, 2008; Destro-Bisol et al. 2004; Quintana-Murci et al. 2008; Berniell-Lee et al. 2009; Coia et al. 2009; Batini, Lopes, et al. 2011). In addition, potential socioeconomic or cultural transmission of polygyny along non-Pygmy male lineages can further amplify this phenomenon. It will be interesting to investigate this hypothesis in future studies using demographic and ethnographic data (Heyer et al. 2012).
Although Pygmy populations also practice polygyny, they do so to a much lesser extent than their non-Pygmy neighbors (Bahuchet and Guillaume 1982; Joiris 2003). This could mainly be due to the lower economic status of most Pygmy individuals strongly limiting the possibilities for Pygmy men to marry and pay bride compensations more than once. Additionally, the smaller female than male effective population sizes in Pygmies may stem from maternal fertility inheritance, that is, a positive correlation between a woman’s number of offspring and that of her mother (Austerlitz and Heyer 1998; Heyer et al. 2005), a phenomenon connected with the transmission of social status by women in other populations (Murray-McIntosh et al. 1998). Matrilineal fertility inheritance has been shown to be more prevalent in hunter–gatherers than in agriculturalists (Blum et al. 2006). This decreases female effective population sizes in hunter–gatherers (Austerlitz and Heyer 1998; Sibert et al. 2002), and thus may explain the low mitochondrial diversity and smaller female than male effective population sizes observed in Pygmy populations, as opposed to non-Pygmies.
Opposite Sex-Specific Migrations in Pygmies and Non-Pygmies, Respectively
Using analysis of molecular variance (AMOVA), STRUCTURE, and MDS analyses, we found greater genetic structure among Pygmy populations than among neighboring non-Pygmies, consistently with previous studies (Destro-Bisol et al. 2004; Batini et al. 2007; Quintana-Murci et al. 2008; Verdu et al. 2009; Berniell-Lee et al. 2009; Patin et al. 2009; Batini, Lopes, et al. 2011; Jarvis et al. 2012; Lachance et al. 2012). This may result from more frequent migrations among non-Pygmies than among Pygmies (fig. 7A), which is somewhat at odds with the view that agricultural non-Pygmies have more sedentary lifestyles than mobile hunter–gatherer Pygmies (Hewlett et al. 1982; Bahuchet 1992; MacDonald and Hewlett 1999). However, historic factors and complex mobility behaviors can accurately explain these genetic patterns.
First, linguistic data support several waves of Bantu languages expansions in the last 5,000 to 3,000 years (Vansina 1995). Population-genetic studies suggest that these events have occurred not only via cultural diffusions but also through population expansions and migrations (de Filippo et al. 2011; Montano et al. 2011). These demic expansions and diffusions could have increased among-population migrations, thereby reducing the genetic structure among non-Pygmies. More recent population migrations, induced by the slave trade between the 16th and 18th Centuries, may have further genetically homogenized non-Pygmy populations. This trade triggered indeed numerous non-Pygmy migrations, as large groups of individuals fled enslavement and settled in regions previously occupied by other non-Pygmies, or as individuals that had been forcibly transported from inland Central Africa to the coast escaped (Martin 1972; Vansina and Bennett 1973; Bahuchet 1985). Such slavery-induced migrations could have recently increased migrations among non-Pygmy populations and counterbalanced the potential loss of within population genetic diversity experienced by some populations during the demographic crisis engendered by the slave trade (Lovejoy 1989). To our knowledge, these latter hypotheses have not been specifically explored from a genetic point of view in Central African populations. Future work considering genome-wide genetic data among several Central African non-Pygmy populations may bring further insights in the recent shaping of African genetic diversity in light of this major historical and demographic event.
Second, ethnographic observations report that Pygmy populations ignore each other’s existence in most cases, in agreement with the genetic isolation observed in these mobile hunter–gatherer populations (Bahuchet 1993, 2012; Hewlett 1996; Verdu and Destro-Bisol 2012). Furthermore, Baka Pygmies have been shown to have surprisingly reduced effective dispersal ranges despite a large exploratory mobility (Verdu et al. 2010). If other Pygmy populations also have reduced effective dispersal, this demographic mechanism could further explain the large among-population genetic differentiation found here (Verdu et al. 2009, 2010).
The AMOVA results and ratios of sex-specific demographic parameters (Nmmm/Nfmf) were consistent with higher female than male migration rates among non-Pygmies (fig. 7A). Patrilocal marriages, where women move to live with their husband’s family, are highly prevalent in non-Pygmy populations similarly as in most populations worldwide (Seielstad et al. 1998; Destro-Bisol et al. 2004; Ségurel et al. 2008; Hammer et al. 2001). These sociocultural customs could explain the female-biased mobility inferred here from genetic data, as observed in previous studies (e.g., Hamilton et al. 2005 in Thailand, Bolnick et al. 2006 in North-Eastern Native American populations, and Cerny et al. 2011 in African Sahel populations; for a review see Ségurel et al. 2008; Heyer et al. 2012).
Conversely, we found a low diversity and high differentiation for mtDNA HVR-1, and the opposite pattern for the NRY, consistent with a higher male than female migration rate among Pygmies (fig. 7A). This has been shown to be a characteristic pattern of matrilocal populations in other geographic regions (Oota et al. 2001; Bolnick et al. 2006; Kumar et al. 2006; Gunnarsdóttir et al. 2011). Although Pygmies are also patrilocal, this custom is often less prevalent in Pygmies than in non-Pygmies. In some Pygmy populations, newly wedded couples can live indeed for long periods of time with the bride’s family in order for the husband to pay bride compensations by working for them (Bahuchet 1992; Hewlett 1996). These complex and variable marital behaviors, together with male mediated genetic introgression from the neighboring non-Pygmies (discussed later), are among the likely explanations for the increased signal of matrilocality found here in Pygmy populations.
Complex Social Behaviors Drive Male-Biased Admixture from Non-Pygmies into Pygmies
Using ABC analyses, we found reduced female and extensive male gene-flow from non-Pygmies into each Pygmy population (fig. 7B). These patterns of male-biased admixture are consistent with the AMOVA and MDS analyses, for which the Pygmy and non-Pygmy populations are more differentiated for the mtDNA HVR-1 than for the NRY.
In a context of patrilocality and social discrimination against Pygmies, ethnologists have observed that marriages between non-Pygmy females and Pygmy males are socially prohibited and occur at low frequencies, whereas unions between Pygmy females and non-Pygmy males are more frequent (Kazadi 1981; Bahuchet and Guillaume 1982; Hewlett 1996). For instance, economically poor non-Pygmy males may have more opportunities to marry a Pygmy female since the lower social status of Pygmies reduces the price of bride compensations. Furthermore, social alliances with the family of renowned Pygmy medicine-men or skilled hunters can contribute to these sex-biased intermarriages. Finally, fertility myths concerning Pygmy females can also encourage sex-biased intermarriages in part because of high secondary infertility rates in the Congo Basin (Romaniuk 1967; Retel-Laurentin 1974).
These sex-biased intermarriages should result in Pygmy genetic material introgressing non-Pygmies, in contradiction with the patterns observed here and in some previous studies (Patin et al. 2009; Tishkoff et al. 2009; Verdu et al. 2009; Batini, Lopes, et al. 2011; Veeramah et al. 2012). However, social discrimination against Pygmy women living in non-Pygmy villages often lead to divorce and the return of the Pygmy women and their admixed children to their village of origin (fig. 7B). Importantly, these returns also occur after the death of a non-Pygmy husband. Therefore, social customs and discriminations driving the mobility of Pygmy women and their admixed children can explain the gene flow of non-Pygmy male lineages into Pygmy populations that we inferred here and previously (Destro-Bisol et al. 2004; Verdu et al. 2009). Furthermore, illegitimate unions, as well as sexual abuse, can also contribute to this male-biased gene flow although these phenomena are particularly difficult to accurately quantify in the field (Destro-Bisol et al. 2004; Verdu et al. 2009). Finally, in addition to the non-Pygmy to Pygmy admixture pattern here identified, some studies have also identified signals of limited Pygmy to non-Pygmy gene flow based on mtDNA diversity (Destro-Bisol et al. 2004; Batini et al. 2007; Quintana-Murci et al. 2008). Such pattern could easily be explained by the occurrence of intermarriages in a patrilocal context resulting in Pygmy female lineages introgressing the non-Pygmy gene-pool. However, given the major differences in both effective and census population sizes between Pygmies and neighboring non-Pygmies, it has been difficult to precisely estimate the intensity of such gene flow (Destro-Bisol et al. 2004). Future studies using genome-wide genetic data may have the sufficient power to more accurately detect and estimate these migration events.
STRUCTURE individual clustering results correspond to proportions of an individual genotypes likely clustering in a given pre-assumed genetic cluster. Using the admixture model, STRUCTURE results can potentially correspond to individual admixture estimates, although such interpretation should be made with caution (Pritchard et al. 2000; Falush et al. 2003). When considering genotype membership proportions in the “blue” cluster as individuals’ admixture levels with the non-Pygmy gene pool, our results indicate varying levels of admixture from the non-Pygmies into each Pygmy population. They were consistent with previous results on samples aggregating some of our populations and HGDP sub-Saharan populations (Becker et al. 2011) and also with a study using more than 800 microsatellite markers among numerous sub-Saharan Africa populations (Tishkoff et al. 2009).
Performing a STRUCTURE analysis on 22 resequencing haplotypes, Patin et al. (2009) also found a signal of heterogeneous admixture among their sample of Western Pygmy populations (two Baka and one Kola). However, these authors found much lower levels of admixture among Baka individuals than ours (Patin et al. 2009). This discrepancy could be due to the fact that they treated their haplotypes as microsatellite alleles and/or to a lower power due to much smaller sample sizes compared with ours (216 in Patin et al. [2009] vs. 605 in this study). Note that our STRUCTURE results are consistent with two recent studies investigating, respectively, genome-wide single nucleotide polymorphism data and whole-genome sequences in a number of Western Central African Pygmies and non-Pygmies (Jarvis et al. 2012; Lachance et al. 2012). These studies also found heterogeneous admixture from non-Pygmies into each Pygmy population and, in particular, substantial levels of non-Pygmy admixture among Baka individuals.
Variable Sex-Specific Demography across Pygmy Populations
Using ABC analyses, we found that sex-specific non-Pygmy admixture levels varied substantially across Pygmy populations, with high to very high levels using NRY and, conversely, low to very low levels using mtDNA HVR-1 (fig. 7B). Based only on autosomal data, Verdu et al. (2009) proposed that the variability of admixture levels found among Pygmy populations could be explained by variable levels of social integration between Pygmies and neighboring non-Pygmies. Our results demonstrate that such framework may not always be sufficient to predict sex-specific patterns of admixture among populations. For instance, the Koya Pygmies have been reported to have little social integration with their Akele non-Pygmy neighbors (Soengas 2009), in agreement with their relatively low levels of autosomal admixture (Verdu et al. 2009). However, they showed such a high level of male admixture from the non-Pygmies in our ABC analyses, that virtually all their Y chromosomes may come from their non-Pygmy neighbors, meaning that the original Koya Pygmy male genetic lineage may no longer exist. This result was consistent with the Koya NRY diversity pattern highly resembling that of the non-Pygmy populations with low average diversity and wide CI, and with the fact that this Koya population clustered with non-Pygmies on the NRY MDS plot. Conversely, the Koya showed the largest distance to non-Pygmy populations on the mtDNA HVR-1 MDS plot, consistently with the reduced signal of female non-Pygmy introgression found using ABC. Such strongly male-biased admixture pattern in the Koya Pygmies could further explain their separate clustering with STRUCTURE at K = 4 using jointly autosomal and X-chromosome data. Koya males would have inherited a Pygmy X-chromosome from their mothers, whereas females would have inherited one of their X-chromosomes from their non-Pygmy fathers.
The three Bongo Pygmy populations (CBG, EBG, and SBG) represent another interesting case. Using ABC, they showed among the highest estimated separation times with other Pygmy groups, consistent with substantial pairwise FST values observed for all chromosomal types between these three populations. This pattern contrasted highly with the various Baka groups (CBK, EBK, GBK, and SBK), which showed much lower FST values, probably indicating their much more recent common origin. Therefore, populations that are traditionally designated with a common ethno-name can have strikingly different demographic patterns, as the Bongo consist of several genetically differentiated populations highly admixed with non-Pygmy neighbors, whereas the Baka consist mainly of a single population containing several highly related groups substantially less admixed with non-Pygmy neighbors.
These findings highlight the complementarity of population genetics studies with the work of ethnographers, who showed that the common designation of several Pygmy groups with a single ethno-name does not necessarily imply that they are culturally homogeneous. In particular, the various Bongo populations exhibit high levels of cultural variation; for instance, they speak very different Bantu languages (Bahuchet 2012). Our study demonstrates that biological anthropologists and population geneticists should be careful in considering a priori the demographic and cultural homogeneity of populations gathered under a single ethno-name or under the name “Pygmy” (Bahuchet et al. 1993; Bahuchet 2012; Verdu and Destro-Bisol 2012).
Conclusion
Ethnologists and anthropologists have historically categorized as Pygmies more than 20 Central African hunter–gatherer populations using numerous cultural criteria (Cavalli-Sforza 1986; Bahuchet 1992, 2012; Hewlett 1996). The only common cultural feature among all Pygmy populations today is probably the sharing of complex socioeconomic relationships with specific agricultural non-Pygmy neighbors (Kazadi 1981; Bahuchet and Guillaume 1982; Hewlett 1996; Joiris 2003). This may in turn influence genetic and demographic patterns (Destro-Bisol et al. 2004; Verdu et al. 2009; Verdu and Destro-Bisol 2012). Studying the genetic diversity of numerous Central African populations, we found strikingly opposite sex-specific effective population sizes and migrations between Pygmy and non-Pygmy groups of populations, non-Pygmies resembling most patrilocal human populations worldwide while Pygmies widely differ and resembled matrilocal populations despite being usually described as patrilocal (fig. 7A). Furthermore, we found largely male-biased and variable introgression rates from non-Pygmies in every Pygmy population, a pattern explained by sociocultural-driven movements of spouses in a context of patrilocality and social discriminations against Pygmies (fig. 7B). Our study illustrates how the four chromosomal types can be contrasted to infer detailed sex-specific demographic patterns within and among populations. We showed how recent history and complex sociocultural factors regarding intermarriage customs, mobility of spouses, and gender-related socioeconomic discriminations can explain highly variable sex-specific genetic and demographic patterns at a local geographical scale among human populations.
Materials and Methods
Population Samples
Using a single criterion of categorization is usually not sufficient to distinguish Pygmies and non-Pygmies in the multiethnic context of Central African populations (Bahuchet and Guillaume 1982; Cavalli-Sforza 1986; Bahuchet et al. 1991; Bahuchet 1993; Froment 1993; Hewlett 1996; Becker et al. 2011). Therefore, following anthropologists and ethnographers, as well as previous genetics studies (Verdu et al. 2009; Becker et al. 2011; Verdu and Destro-Bisol 2012), we categorized as Pygmies groups of individuals that report themselves as a different ethnic group with a different name than the neighboring communities, even when speaking closely related languages (Bahuchet 2012); that are identified as different ethnic groups by neighboring communities (Bahuchet 1993); that are recognized by neighboring communities as specialists of forest knowledge and activities such as hunting and gathering, even if practicing agriculture on a daily basis (Bahuchet and Guillaume 1982; Cavalli-Sforza 1986; Hewlett 1996); that share complex socio-economic relationships with neighboring communities, including specific social barriers against intermarriages with complex discriminations against the Pygmies (Kazadi 1981; Bahuchet and Guillaume 1982; Hewlett 1996; Joiris 2003; Verdu et al. 2009). We did not consider adult height as a criterion for the categorization of Pygmy and non-Pygmy populations.
We obtained more than 800 individual samples from 23 populations (10 categorized as Pygmies and 13 categorized as non-Pygmies based on the earlier mentioned criteria) from Gabon and Cameroon (fig. 1 and table 1). Classical familial anthropology questionnaires were conducted to determine levels of familial relationship among participants, and only one individual was kept among individuals who had grandparents in common. DNA was extracted and purified using standard protocols from venous blood samples for all Cameroonian participants and for all Gabonese non-Pygmy participants, and from saliva samples using Oragen Self-Sampling Saliva Kits from DNA—Genotek for all Gabonese Pygmy participants except the Baka (GBK). Cameroonian, French, and Gabonese governments and ethical committees provided appropriate research and sampling authorizations. Appropriate oral, written, and/or video-recorded informed consents were provided by each donor.
Microsatellites and DNA Sequence Data
Autosomal, X-Chromosome, and NRY Microsatellite Data
Six hundred four individuals had been previously genotyped for 28 tetranucleotide autosomal microsatellites (Verdu et al. 2009). Following the protocol described in Verdu et al. (2009), we genotyped an additional 13 individuals from the Central Bongo population (CBG) for the same 28 microsatellites, yielding a total of 617 genotypes for the autosomal loci. All genotype callings for the 604 individuals and the additional 13 CBG samples were normalized using 20 positive controls from the 604 individuals from Verdu et al. (2009).
For 610 individual samples (table 1), we genotyped eight tetranucleotide microsatellites on the X-chromosome from Marshfield Foundation Mammalian Genotyping Service Screening Set 10 (http://research.marshfieldclinic.org/genetics/GeneticResearch/screeningsets.asp, last accessed January 14, 2013): TATC043, GATA69C12, GATA52B03, GATA144D04, CTAT014, GATA165B12, GATG011, and GATA72E05. Based on the information provided in Marshfield database, all markers were chosen to be polymorphic in African populations, at least 2 Mb apart from each other, and at least 50 kb from any known gene, to ensure a priori neutrality and independence between markers.
For 251 male individuals (table 1), we genotyped six tetranucleotide microsatellites on the NRY, chosen from the Y-chromosome Reference Database (http://www.yhrd.org/, last accessed January 14, 2013): DYS19, DYS389I, DYS389II, DYS390, DYS391, and DYS393. We also obtained data for 278 non-Pygmy individuals from Gabon for the same six markers from previously published data (Berniell-Lee et al. 2009). Genotype callings were normalized using 38 overlapping individuals from the Baka Pygmies from Cameroon and Gabon (GBK and SBK) between our study and the previously published sample set.
All autosomal, X-chromosome and NRY microsatellite original data presented here (table 1), were genotyped using the same polymerase chain reactions procedures presented in Verdu et al. (2009), and analyzed in an Applied Biosystems 3100 automated sequencer. Allele calls were obtained using the software GeneMarker v1.6 (Softgenetics) and verified manually.
mtDNA Hyper Variable Region 1,359 bp Sequences
We used the previously published data (Quintana-Murci et al. 2008) on the polymorphism of the mtDNA Hyper Variable Region 1 (HVR-1, 359 bp), which had been sequenced for 803 individuals from 16 Pygmy and non-Pygmy populations out of the 23 populations considered here (table 1).
Relatedness
Although familial relatedness among individuals was evaluated conducting family questionnaires while sampling DNA on the field (discussed earlier), we also calculated genetic relatedness between individuals with the software RelPair v2.0 (Epstein et al. 2000) using the 28 autosomal microsatellite data. No individuals potentially sharing grandparents were identified in our sample.
Genetic Diversity
We computed the expected heterozygosities He (Nei 1978) separately in each population for the 28 autosomal and the eight X-chromosome microsatellites, respectively, and the haplotype diversity (Nei 1978) for the six NRY microsatellites and mtDNA HVR-1 sequences using SPAGeDi v1.2 (Hardy and Vekemans 2002) for the microsatellite data sets, and ARLEQUIN v3.5 (Excoffier et al. 2005) for mtDNA HVR-1 sequences. Nucleotide diversity (π, Nei 1987) was also computed for the mtDNA HVR-1 sequences in each population using ARLEQUIN v3.0. We evaluated whether the level of genetic diversities for each of the four chromosomal types differed significantly between Pygmy and non-Pygmy populations, using a Wilcoxon rank-sum test as implemented in R (R Development Core Team 2012).
Analysis of Molecular Variance
We estimated the levels of genetic differentiation (FST) among all Central African populations, and also among Pygmy and non-Pygmy populations separately, using an AMOVA procedure (Excoffier et al. 1992) as implemented in ARLEQUIN v3.0 (Excoffier et al. 2005). This was done separately for the autosomal, X-chromosome, NRY, and mtDNA HVR-1 data (FST(A), FST(X), FST(Y), and FST(mtDNA), respectively). 10,000 permutations of individuals among populations and groups of populations were performed to obtain the P values for these F-statistics.
Contrasting FST Values among Autosomal, X-Chromosome, NRY, and mtDNA
As the NRY and mtDNA are uniparentally inherited haploid markers, we used FST values obtained from our AMOVA procedures to estimate the parameters Nmmm and Nf mf, where Nm and Nf are the effective male and female population sizes, and mm and mf the male and female migration rates among pairs of populations assuming an island model (Wright 1931). This island model assumes an ideal set of populations that all have the same effective population size and exchange the same proportions of migrants. Under such model, the expected FST value obtained in a given set of populations is proportional to the demographic parameter Nm, where N is the effective population size of one population of the set and m the migration rate among populations. Although being idealized, it has the advantage of mathematical tractability and is therefore quite helpful to contrast sex-specific patterns at a regional scale (Ségurel et al. 2008).
Under this model, the quantities Nmmm and Nf mf, can be estimated, respectively, as 2Nmmm = (1/FST(Y) – 1) and 2Nf mf = (1/FST(mtDNA) – 1) (Wright 1931). We calculated then the ratios between Nmmm and Nfmf to evaluate potential sex-specific differences in these demographic parameters. This was done for all Central African populations together and also separately for the Pygmy and non-Pygmy groups of populations.
The expected ratio between the X-linked and autosomal FST’s under an island model can be computed using equation (4) in Ségurel et al. (2008) as
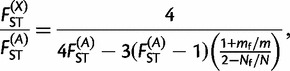 |
with m = mm + mf and N = Nf + Nm. Thus, mf/m represents the proportion of female migrants among all migrants and Nf/N the proportion of effective female individuals in the total population. These two ratios take their values between 0 and 1. Supplementary figure S1, Supplementary Material online, shows the extent that the ratio FST(X)/FST(A) can take as a function of FST(A) and mf/m, assuming a balanced sex ratio (Nf/N = 1/2). This graph shows that, whatever the migration rates, the ratio FST(X)/FST(A) will be always between 1.0 and 2.0 under a balanced sex ratio. A value below 1.0 for the ratio FST(X)/FST(A) will be only compatible with an excess of females and a value above 2.0 only with an excess of males. We computed this ratio for Pygmy and non-Pygmy populations separately to assess whether the effective sex ratio was biased or not in these two groups of populations.
Population Pairwise Genetic Distances and MDS Analyses
We computed the pairwise levels of genetic differentiation (FST, Weir and Cockerham 1984) between all pairs of populations, for autosomal, X-chromosome, NRY, and mtDNA HVR-1 markers separately, using ARLEQUIN v3.0 (Excoffier et al. 2005) for autosomal, NRY and mtDNA HVR-1 data, and SPAGeDi v1.2 (Hardy and Vekemans 2002) for the haplo-diploid X-chromosome markers. P values were obtained using 10,000 permutations of individuals among populations. Negative and/or non-significant values of FST were set to 0. The four matrices of pairwise FST values hence obtained (one per chromosomal type) were used to perform separately four 2-dimensional metric MDS analyses using the software package R (R Development Core Team 2012). To evaluate the accuracy of the 2-dimensional MDS projection with respect to the original pairwise FST matrices, we computed the Spearman correlation coefficient ρ between Euclidian distances between each pairs of population on the MDS plot and their corresponding pairwise FST values.
Approximate Bayesian Computation
It is often impossible to compute the likelihood of the full genetic data to estimate the parameters of complex historical and demographic scenarios involving numerous population samples and loci (Stephens 2003). Instead, ABC approaches focus on a limited number of summary statistics calculated on the genetic data to infer the posterior distribution of demographic parameters of interest in complex historical models (Tavaré et al. 1997; Beaumont et al. 2002). ABC proceeds by simulating genetic data under a given historical and demographic model assumed to be underlying the observed data set. Summary statistics are computed for each simulated data set and for the observed data set separately. The posterior distributions of the model parameters are then estimated from the top 1% of simulations that produce summary statistics closest to the one computed on the observed data set.
All the following simulations, calculations of summary statistics, ABC regressions, and model parameters posterior estimation procedures were conducted using the software package DIY ABC v1.0.4.46 (Cornuet et al. 2008, 2010).
Three-Population Models
The ABC analyses developed in Verdu et al. (2009) to reconstruct the history of Western Central African populations supported a common origin of all Pygmy populations, together with recent admixture with the neighboring non-Pygmy populations and a demographic expansion having occurred in the non-Pygmy lineage. Capitalizing on these results, we considered here the same historical and demographic scenario as “scenario 1a” in Verdu et al. (2009), but, instead of considering all Pygmy populations at once, we used three-population models with two Pygmy populations and one non-Pygmy population (supplementary fig. S2, Supplementary Material online). This latter population resulted from the merging of the two non-Pygmy populations that were geographically closest to the two Pygmy populations, respectively, this merging being possible because non-Pygmy populations are almost completely genetically undifferentiated (see Verdu et al. 2009 and our results below). In these scenarios, we assumed that the pairs of Pygmy populations shared a common origin, the ancestral Pygmy population having diverged in a more ancient past from the lineage giving birth to the non-Pygmy neighboring populations (supplementary fig. S2, Supplementary Material online). We also included the possibility for recent admixture events from the non-Pygmy population into each one of the Pygmy populations separately, and a more ancient event of admixture between the ancestral Pygmy and non-Pygmy populations. We included a potential stepwise increase of effective population size occurring at any time in the non-Pygmy lineage (supplementary fig. S2, Supplementary Material online).
Iterations. We iterated the simulations of this three-population model (supplementary fig. S2, Supplementary Material online) in turn for all the possible pairs of Pygmy populations in our sample and for the four chromosomal types separately (autosomal, X-chromosome, NRY, and mtDNA HVR-1) to infer autosomal and sex-specific patterns separately. For instance, we first simulated autosomal microsatellite data considering the EBG and SBG Pygmy populations (Pop1 and Pop2, respectively, in supplementary fig. S2, Supplementary Material online) and the merged TEK and NZE neighboring non-Pygmy populations (Pop3 in supplementary fig. S2, Supplementary Material online); then separately simulated data considering the EBG and the KOY Pygmies (Pop1 and Pop2 in supplementary fig. S2, Supplementary Material online) and the merged TEK and AKL neighboring non-Pygmy populations (Pop3 in supplementary fig. S2, Supplementary Material online), and so on for each pair of Pygmy populations in our autosomal microsatellite data set. We performed this simulation process for each chromosomal type separately.
Overall, we conducted 128 separate ABC analyses: 39 procedures considering the 28 autosomal microsatellites; 39 considering the eight X-chromosome microsatellites; 33 considering the six NRY microsatellites; and 17 considering the 359 bp sequences of the mtDNA HVR-1.
The four Baka Pygmy population samples (CBK, EBK, GBK, and SBK) share the same language, the same cultural features and are geographical subgroups of a single Baka Pygmy ethnic group. These four geographical samples therefore likely share a common origin as illustrated by the low levels of genetic differentiation previously found (Verdu et al. 2009, see also the Results and Discussion sections here). To limit the number of three-population model simulations, we considered models including each one of the four Baka Pygmy populations separately (CBK, EBK, GBK, and SBK) and compared them in-turn with the other non-Baka Pygmy populations in our sample set, respectively. We excluded from analyses the three-population models considering a pair of Baka Pygmy populations. We chose not to merge these four populations into a single population (as was previously done in Verdu et al. 2009) since, although belonging to the same Pygmy ethnic group (Baka), they are neighboring different non-Pygmy populations, and may thus have different sociocultural behavior concerning sex-specific admixture with their respective neighbors.
Note that we lacked NRY data for the CBK Pygmies and mtDNA HVR-1 data for the EBK, SBG, and CBG Pygmies (table 1). This reduced the number of iterations of three-population ABC analyses conducted for these two chromosomal types. Finally, also note that we lacked non-Pygmy population samples neighboring Bezan (BEZ) and Central Baka (CBK) Pygmies for the mtDNA HVR-1 sequences (table 1). Therefore, we excluded the model considering the pair of BEZ and CBK Pygmies from the analysis using mtDNA HVR-1 data. For all other models involving either one of the BEZ or CBK Pygmy population and another given Pygmy population, the non-Pygmy population sample (Pop3 in supplementary fig. S2, Supplementary Material online) consisted only of the mtDNA HVR-1 data from the non-Pygmy population available and neighboring this other Pygmy population.
Prior Set, Summary Statistics, and ABC Regression. We simulated one million data sets for each one of the 128 ABC analyses separately. For all simulations, we used the same set of priors as considered in the “scenario 1a” in Verdu et al. (2009) for the parameters of the model (supplementary fig. S2, Supplementary Material online). Details of the prior set used can be found in supplementary material, Supplementary Material online.
We used 15 within- and among-populations summary statistics for autosomal, X-chromosome, and NRY microsatellite data, respectively, and 21 within- and among-population summary statistics for the mtDNA HVR-1 sequences (supplementary material, Supplementary Material online, for details). Note that using both within- and among-populations summary statistics that capture different components of the genetic variation allowed us to disentangle the various demographic parameters of interest in our model. Intuitively, within-population summary statistics a priori allow joint estimation of N and mutation rates. Using average mutation rates estimated from within-population summary statistics thus allows estimating the original parameter N. Furthermore, between-populations summary statistics will capture further information on admixture parameters between populations. Therefore, using jointly within- and between-population summary statistics a priori allows estimating N and admixture rates (Csilléry et al. 2010).
To obtain the posterior distributions of the model parameters, we followed the regression method by Beaumont et al. (2002): we first applied a logit transformation to the model parameters and then performed a logistic regression on the 10,000 simulations (1%) closest to our real data set; we then used a local linear regression to estimate the posterior distributions of the parameters of the model for each one of the ABC analyses conducted for the four chromosomal types separately.
Merging Posterior Distributions of the Model Parameters for a Given Pygmy Population and a Given Chromosomal Type. For each chromosomal type, we compared separately in turn each Pygmy population with all the other Pygmy populations, together with the corresponding neighboring non-Pygmy populations (see three-population models and iterations descriptions discussed earlier). Therefore, for the autosomal and X-chromosome sets of microsatellites, respectively, we had nine ABC analyses for each one of the six non-Baka Pygmy populations and six ABC analyses for each one of the four Baka Pygmy populations. For the NRY microsatellites, due to the lack of data for the CBK Pygmies, we had eight ABC analyses for each one of the six non-Baka Pygmy populations and six ABC analyses for each one of the three Baka Pygmy populations. For the mtDNA HVR-1 sequence data, we had six ABC analyses for each one of the EBG, KOL and KOY Pygmies, five analyses for the BEZ Pygmies, four analyses for each one of the GBK and SBK Pygmies, and three analyses for the CBK Pygmies.
In short, each Pygmy population appeared in several iterations of the three-population ABC analyses for each chromosomal type. We needed thus to summarize the results for each Pygmy population. For this purpose, for each chromosomal type separately, we obtained a composite posterior distribution of each model parameter in a given Pygmy population by merging posterior distributions obtained for this population in all the three-population ABC analyses where it was included. For instance, to obtain a synthetic result for the posterior distribution of the effective population size of the EBG Pygmies using the autosomal microsatellite data set, we merged the values of the EBG effective population size used to generate the 10,000 (1%) top simulations closest to the real autosomal data for the ABC analysis considering the EBG and the SBG Pygmies, with those from the analysis considering the EBG and the KOY Pygmies, and so on for all the three-population ABC analyses with a pair of Pygmy populations that included the EBG Pygmies for autosomal microsatellite data.
These merged results allowed us to generate an average posterior distribution for each model parameter for a given Pygmy population and a given chromosomal type. Note that all detailed results of posterior distributions of the original and composite model parameters for all three-population ABC analyses are available upon request to the corresponding author.
Mode, Median, and Quartile Estimations from the Posterior Distributions. We estimated the 90% credibility intervals, the 1st and 3rd quartile and the Median of the posterior distributions for all the original parameters of the models using the stats package implemented in the software package R (R Development Core Team 2012). We estimated the mode of the posterior distributions for all the parameters of the model using kernel density estimation implemented in the parzen function with a bandwidth of 0.01 (modest package in R). Changing the band-with of the kernel density estimation to 0.05 or 0.1 did not change the mode estimates here provided (results not shown).
One Population Models
Because our three-population approach considered merged pairs of non-Pygmy populations for each pair of Pygmy populations considered, we could not obtain estimates of the effective population sizes (Nnp) for each non-Pygmy population separately. Therefore, for each chromosomal type separately, we performed another set of ABC analyses considering only one non-Pygmy population at a time. We considered here a single population with the potential for a change in effective population size occurring at any possible time in the past. Therefore, our one-population models consider three historical parameters: Nnp the current effective population size of the non-Pygmy population, NA, the ancient effective population size, and tA, the time when the stepwise demographic change occurred. We considered the same prior distributions for these parameters and the same mutation models as discussed earlier (supplementary material, Supplementary Material online). We generated one million simulations under this model for each analysis. We considered the same four within-population summary statistics as discussed earlier. We conducted ABC regression procedures as previously described to obtain the posterior distributions of the model parameters using the 10,000 (1%) top simulations closest to the observed data sets. Finally, to evaluate potential discrepancies in the posterior distributions of effective population sizes in each population between our ABC analyses using the three-population and one-population models, we conducted the same one-population ABC analyses considering each one of the Pygmy populations and each one of the four chromosomal types separately.
Individual Genetic Structure
To evaluate levels of individual genetic structure in our data set and identify potential traces of admixture among individuals and populations, we used the Bayesian model-based clustering software STRUCTURE v2.3 (Pritchard et al. 2000; Falush et al. 2003), considering altogether the 28 autosomal and the eight X-chromosome microsatellites on the 605 individuals for which both kinds of data were available. We assumed a number of predefined genetic clusters (K) between 2 and 6, and performed 40 independent runs for each value of K. All runs were conducted using the admixture model with correlated allele frequencies and separate values of the Dirichlet parameter in each cluster, with a burn-in period of 200,000 iterations and 600,000 subsequent iterations. We searched for potential distinct modes among the results of the 40 independent runs of STRUCTURE at each value of K by using the Greedy algorithm of the software CLUMPP (Jakobsson and Rosenberg 2007). Groups of runs for which all pairwise symmetric similarity coefficients were found above 0.9 were considered as belonging to the same STRUCTURE mode. Genotype membership proportions were then averaged across runs belonging to the same mode for each individual separately. Individual results were plotted using the software DISTRUCT (Rosenberg 2004).
Supplementary Material
Supplementary materials and methods, figures S1–S4, and tables S1–S6 are available at Molecular Biology and Evolution online (http://www.mbe.oxfordjournals.org/).
Acknowledgments
The authors thank David Comas, Ethan M. Jewett, Trevor J. Pemberton, Noah A. Rosenberg, Laure Ségurel, Zachary A. Szpiech, and two anonymous reviewers for useful comments and suggestions on this work. They warmly thank all donors from Cameroon and Gabon. This work was funded, in part, by the French Agence Nationale pour la Recherche program C3A, the National Institutes of Health grant RO1 GM081441, and the National Science Foundation grant BCS-1145734. This work was supported in part by the Italian Ministry of the University, Progetti Ricerca Interesse Nazionale 2009 grant to V.G. The authors declare no conflict of interest.
References
- Austerlitz F, Heyer E. Social transmission of reproductive behavior increases frequency of inherited disorders in a young-expanding population. Proc Natl Acad Sci U S A. 1998;95:15140–15144. doi: 10.1073/pnas.95.25.15140. [DOI] [PMC free article] [PubMed] [Google Scholar]
- Bahuchet S. Les Pygmées Aka et la forêt centrafricaine. Paris: Peeters; 1985. [Google Scholar]
- Bahuchet S. Spatial mobility and access to the resources among the African pygmies. In: Casimir J, Rao A, editors. Mobility and territoriality. Social and spatial boundaries among foragers, fishers, pastoralists and peripatetics. New York: Berg; 1992. pp. 205–257. [Google Scholar]
- Bahuchet S. L'invention des Pygmées. Cahiers d'Etudes Africaines. 1993;129:153–181. [Google Scholar]
- Bahuchet S. Changing language, remaining pygmy. Hum Biol. 2012;84:11–43. doi: 10.3378/027.084.0101. [DOI] [PubMed] [Google Scholar]
- Bahuchet S, Guillaume H. Aka-farmer relations in the northwest Congo basin. Cambridge: Cambridge University Press; 1982. [Google Scholar]
- Bahuchet S, Mac Key D, De Garine I. Wild yams revisted: is independence from agriculture possible for rain-forest hunter-gatherers? Hum Ecol. 1991;19:213–243. [Google Scholar]
- Balaresque P, Manni F, Dugoujon JM, Crousau-Roy B, Heyer E. Estimating sex-specific processes in human populations: are XY-homologous markers an effective tool? Heredity. 2006;96:214–221. doi: 10.1038/sj.hdy.6800779. [DOI] [PubMed] [Google Scholar]
- Batini C, Coia V, Battaggia C, Rocha J, Pilkington MM, Spedini G, Comas D, Destro-Bisol G, Calafell F. Phylogeography of the human mitochondrial L1c haplogroup: genetic signatures of the prehistory of Central Africa. Mol Phylogenet Evol. 2007;43:635–644. doi: 10.1016/j.ympev.2006.09.014. [DOI] [PubMed] [Google Scholar]
- Batini C, Ferri G, Destro-Bisol G, et al. (17 co-authors) Signatures of the preagricultural peopling processes in sub-Saharan Africa as revealed by the phylogeography of early Y chromosome lineages. Mol Biol Evol. 2011;28:2603–2613. doi: 10.1093/molbev/msr089. [DOI] [PubMed] [Google Scholar]
- Batini C, Lopes J, Behar DM, Calafell F, Jorde LB, van der Veen L, Quintana-Murci L, Spedini G, Destro-Bisol G, Comas D. Insights into the demographic history of African pygmies from complete mitochondrial genomes. Mol Biol Evol. 2011;28:1099–1110. doi: 10.1093/molbev/msq294. [DOI] [PubMed] [Google Scholar]
- Beaumont MA, Zhang W, Balding DJ. Approximate Bayesian computation in population genetics. Genetics. 2002;162:2025–2035. doi: 10.1093/genetics/162.4.2025. [DOI] [PMC free article] [PubMed] [Google Scholar]
- Becker NS, Verdu P, Froment A, Le Bomin S, Pagezy H, Bahuchet S, Heyer E. Indirect evidence for the genetic determination of short stature in African pygmies. Am J Phys Anthropol. 2011;145:390–401. doi: 10.1002/ajpa.21512. [DOI] [PubMed] [Google Scholar]
- Berniell-Lee G, Calafell F, Bosch E, Heyer E, Sica L, Mouguiama-Daouda P, van der Veen L, Hombert JM, Quintana-Murci L, Comas D. Genetic and demographic implications of the Bantu expansion: insights from human paternal lineages. Mol Biol Evol. 2009;26:1581–1589. doi: 10.1093/molbev/msp069. [DOI] [PubMed] [Google Scholar]
- Blum MG, Heyer E, Francois O, Austerlitz F. Matrilineal fertility inheritance detected in hunter-gatherer populations using the imbalance of gene genealogies. PLoS Genet. 2006;2:e122. doi: 10.1371/journal.pgen.0020122. [DOI] [PMC free article] [PubMed] [Google Scholar]
- Bolnick DA, Bolnick DI, Smith DG. Asymmetric male and female genetic histories among Native Americans from eastern North America. Mol Biol Evol. 2006;23:2161–2174. doi: 10.1093/molbev/msl088. [DOI] [PubMed] [Google Scholar]
- Brandenburg JT, Austerlitz F, Toupance B. Impact of fertility transmission and other sociodemographic factors on reproductive success and coalescent trees. Genet Res. 2012;94:121–131. doi: 10.1017/S0016672312000298. [DOI] [PubMed] [Google Scholar]
- Cavalli-Sforza LL. African pygmies. Orlando (FL): Academic Press; 1986. [Google Scholar]
- Cerny V, Pereira L, Musilova E, et al. (11 co-authors) Genetic structure of pastoral and farmer populations in the African Sahel. Mol Biol Evol. 2011;28:2491–2500. doi: 10.1093/molbev/msr067. [DOI] [PubMed] [Google Scholar]
- Chaix R, Austerlitz F, Khegay T, Jacquesson S, Hammer MF, Heyer E, Quintana-Murci L. The genetic or mythical ancestry of descent groups: lessons from the Y chromosome. Am J Hum Genet. 2004;75:1113–1116. doi: 10.1086/425938. [DOI] [PMC free article] [PubMed] [Google Scholar]
- Chaix R, Quintana-Murci L, Hegay T, Hammer MF, Mobasher Z, Austerlitz F, Heyer E. From social to genetic structures in central Asia. Curr Biol. 2007;17:43–48. doi: 10.1016/j.cub.2006.10.058. [DOI] [PubMed] [Google Scholar]
- Csilléry K, Blum MG, Gaggiotti OE, François O. Approximate Bayesian computation (ABC) in practice. Trends Ecol Evol. 2010;25(7):410–418. doi: 10.1016/j.tree.2010.04.001. [DOI] [PubMed] [Google Scholar]
- Coia V, Brisighelli F, Donati F, et al. (14 co-authors) A multi-perspective view of genetic variation in Cameroon. Am J Phys Anthropol. 2009;140:454–464. doi: 10.1002/ajpa.21088. [DOI] [PubMed] [Google Scholar]
- Cornuet JM, Ravigne V, Estoup A. Inference on population history and model checking using DNA sequence and microsatellite data with the software DIYABC (v1.0) BMC Bioinformatics. 2010;11:401. doi: 10.1186/1471-2105-11-401. [DOI] [PMC free article] [PubMed] [Google Scholar]
- Cornuet JM, Santos F, Beaumont MA, Robert CP, Marin JM, Balding DJ, Guillemaud T, Estoup A. Inferring population history with DIY ABC: a user-friendly approach to approximate Bayesian computation. Bioinformatics. 2008;24:2713–2719. doi: 10.1093/bioinformatics/btn514. [DOI] [PMC free article] [PubMed] [Google Scholar]
- Cox MP, Woerner AE, Wall JD, Hammer MF. Intergenic DNA sequences from the human X chromosome reveal high rates of global gene flow. BMC Genet. 2008;9:76. doi: 10.1186/1471-2156-9-76. [DOI] [PMC free article] [PubMed] [Google Scholar]
- Cruciani F, La Fratta R, Trombetta B, et al. (24 co-authors) Tracing past human male movements in northern/eastern Africa and western Eurasia: new clues from Y-chromosomal haplogroups E-M78 and J-M12. Mol Biol Evol. 2007;24:1300–1311. doi: 10.1093/molbev/msm049. [DOI] [PubMed] [Google Scholar]
- de Filippo C, Barbieri C, Whitten M, et al. (13 co-authors) Y-chromosomal variation in sub-Saharan Africa: insights into the history of Niger-Congo groups. Mol Biol Evol. 2011;28:1255–1269. doi: 10.1093/molbev/msq312. [DOI] [PMC free article] [PubMed] [Google Scholar]
- Destro-Bisol G, Donati F, Coia V, Boschi I, Verginelli F, Caglia A, Tofanelli S, Spedini G, Capelli C. Variation of female and male lineages in sub-Saharan populations: the importance of sociocultural factors. Mol Biol Evol. 2004;21:1673–1682. doi: 10.1093/molbev/msh186. [DOI] [PubMed] [Google Scholar]
- Epstein MP, Duren WL, Boehnke M. Improved inference of relationship for pairs of individuals. Am J Hum Genet. 2000;67:1219–1231. doi: 10.1016/s0002-9297(07)62952-8. [DOI] [PMC free article] [PubMed] [Google Scholar]
- Excoffier L, Laval L, Schneider SE. Arlequin (version 3.0): an integrated software package for population genetics data analysis. Bioinformatics. 2005;1:47–50. [PMC free article] [PubMed] [Google Scholar]
- Excoffier L, Schneider S. Why hunter-gatherer populations do not show signs of pleistocene demographic expansions. Proc Natl Acad Sci U S A. 1999;96:10597–10602. doi: 10.1073/pnas.96.19.10597. [DOI] [PMC free article] [PubMed] [Google Scholar]
- Excoffier L, Smouse PE, Quattro JM. Analysis of molecular variance inferred from metric distances among DNA haplotypes: application to human mitochondrial DNA restriction data. Genetics. 1992;131:479–491. doi: 10.1093/genetics/131.2.479. [DOI] [PMC free article] [PubMed] [Google Scholar]
- Falush D, Stephens M, Pritchard JK. Inference of population structure using multilocus genotype data: linked loci and correlated allele frequencies. Genetics. 2003;164:1567–1587. doi: 10.1093/genetics/164.4.1567. [DOI] [PMC free article] [PubMed] [Google Scholar]
- Froment A. Adaptation biologique et variation dans l'espèce humaine: le cas des Pygmées d'Afrique. Bull Mém Soc Anthropol Paris. 1993;5:417–448. [Google Scholar]
- Gunnarsdóttir ED, Nandineni MR, Li M, Myles S, Gil D, Pakendorf B, Stoneking M. Larger mitochondrial DNA than Y-chromosome differences between matrilocal and patrilocal groups from Sumatra. Nat Commun. 2011;2:228. doi: 10.1038/ncomms1235. [DOI] [PubMed] [Google Scholar]
- Hamilton G, Stoneking M, Excoffier L. Molecular analysis reveals tighter social regulation of immigration in patrilocal populations than in matrilocal populations. Proc Natl Acad Sci U S A. 2005;102:7476–7480. doi: 10.1073/pnas.0409253102. [DOI] [PMC free article] [PubMed] [Google Scholar]
- Hammer MF, Karafet TM, Redd AJ, Jarjanazi H, Santachiara-Benerecetti S, Soodyall H, Zegura SL. Hierarchical patterns of global human Y-chromosome diversity. Mol Biol Evol. 2001;18:1189–1203. doi: 10.1093/oxfordjournals.molbev.a003906. [DOI] [PubMed] [Google Scholar]
- Hammer MF, Mendez FL, Cox MP, Woerner AE, Wall JD. Sex-biased evolutionary forces shape genomic patterns of human diversity. PLoS Genet. 2008;4:e1000202. doi: 10.1371/journal.pgen.1000202. [DOI] [PMC free article] [PubMed] [Google Scholar]
- Hardy OJ, Vekemans X. SPAGeDi: a versatile computer program to analyse spatial genetic structure at the individual or population levels. Mol Ecol Notes. 2002;2:618–620. [Google Scholar]
- Hewlett B. Cultural diversity among African pygmies. In: Kent S, editor. Cultural diversity among twentieth-century foragers. An African perspective. Cambridge: Cambridge University Press; 1996. pp. 215–244. [Google Scholar]
- Hewlett B, Van de Koppel J, Cavalli-Sforza LL. Exploration ranges of Aka pygmies of the central African Republic. Man. 1982;17:418–430. [Google Scholar]
- Heyer E, Chaix R, Pavard S, Austerlitz F. Sex-specific demographic behaviours that shape human genomic variation. Mol Ecol. 2012;21:597–612. doi: 10.1111/j.1365-294X.2011.05406.x. [DOI] [PubMed] [Google Scholar]
- Heyer E, Sibert A, Austerlitz F. Cultural transmission of fitness: genes take the fast lane. Trends Genet. 2005;21:234–239. doi: 10.1016/j.tig.2005.02.007. [DOI] [PubMed] [Google Scholar]
- Jakobsson M, Rosenberg NA. CLUMPP: a cluster matching and permutation program for dealing with label switching and multimodality in analysis of population structure. Bioinformatics. 2007;23:1801–1806. doi: 10.1093/bioinformatics/btm233. [DOI] [PubMed] [Google Scholar]
- Jarvis JP, Scheinfeldt LB, Soi S, et al. (12 co-authors) Patterns of ancestry, signatures of natural selection, and genetic association with stature in western African pygmies. PLoS Genet. 2012;8(4):e1002641. doi: 10.1371/journal.pgen.1002641. [DOI] [PMC free article] [PubMed] [Google Scholar]
- Joiris DV. The framework of central African hunter-gatherers and neighbouring societies. Afr Study Monogr Suppl. 2003;28:57–79. [Google Scholar]
- Kayser M, Brauer S, Cordaux R, et al. (15 co-authors) Melanesian and Asian origins of Polynesians: mtDNA and Y chromosome gradients across the Pacific. Mol Biol Evol. 2006;23:2234–2244. doi: 10.1093/molbev/msl093. [DOI] [PubMed] [Google Scholar]
- Kazadi M. Méprisés et admirés: l'ambivalence des relations entre les Bacwa (Pygmées) et les Bahemba (Bantu) Africa. 1981;51:837–847. [Google Scholar]
- Keinan A, Mullikin JC, Patterson N, Reich D. Accelerated genetic drift on chromosome X during the human dispersal out of Africa. Nat Genet. 2009;41:66–70. doi: 10.1038/ng.303. [DOI] [PMC free article] [PubMed] [Google Scholar]
- Knight A, Underhill PA, Mortensen HM, Zhivotovsky LA, Lin AA, Henn BM, Louis D, Ruhlen M, Mountain JL. African Y chromosome and mtDNA divergence provides insight into the history of click languages. Curr Biol. 2003;13:464–473. doi: 10.1016/s0960-9822(03)00130-1. [DOI] [PubMed] [Google Scholar]
- Kumar V, Langstieh BT, Madhavi KV, Naidu VM, Singh HP, Biswas S, Thangaraj K, Singh L, Reddy BM. Global patterns in human mitochondrial DNA and Y-chromosome variation caused by spatial instability of the local cultural processes. PLoS Genet. 2006;2:e53. doi: 10.1371/journal.pgen.0020053. [DOI] [PMC free article] [PubMed] [Google Scholar]
- Lachance J, Vernot B, Elbers CC, et al. (13 co-authors) Evolutionary history and adaptation from high-coverage whole-genome sequences of diverse African hunter-gatherers. Cell. 2012;150(3):457–469. doi: 10.1016/j.cell.2012.07.009. [DOI] [PMC free article] [PubMed] [Google Scholar]
- Lewis MP. Ethnologue: languages of the world. Dallas (TX): SIL International; 2009. [Google Scholar]
- Lovejoy PE. The impact of the Atlantic slave trade on Africa: a review of the literature. J Afr Hist. 1989;30(3):365–394. [Google Scholar]
- Macaulay V, Hill C, Achilli A, et al. (21 co-authors) Single, rapid coastal settlement of Asia revealed by analysis of complete mitochondrial genomes. Science. 2005;308:1034–1036. doi: 10.1126/science.1109792. [DOI] [PubMed] [Google Scholar]
- MacDonald DH, Hewlett BS. Reproductive interests and forager mobility. Curr Anthropol. 1999;40:501–523. [Google Scholar]
- Martin PM. The external trade of the Loango Coast, 1576–1870: the effects of changing commercial relations on the Vili Kingdom of Loango. Oxford: Clarendon Press; 1972. [Google Scholar]
- Montano V, Ferri G, Marcari V, Batini C, Anyaele O, Destro-Bisol G, Comas D. The Bantu expansion revisited: a new analysis of Y chromosome variation in central western Africa. Mol Ecol. 2011;20:2693–2708. doi: 10.1111/j.1365-294X.2011.05130.x. [DOI] [PubMed] [Google Scholar]
- Murray-McIntosh RP, Scrimshaw BJ, Hatfield PJ, Penny D. Testing migration patterns and estimating founding population size in Polynesia by using human mtDNA sequences. Proc Natl Acad Sci U S A. 1998;95:9047–9052. doi: 10.1073/pnas.95.15.9047. [DOI] [PMC free article] [PubMed] [Google Scholar]
- Nei M. Estimation of average heterozygosity and genetic distance from a small number of individuals. Genetics. 1978;89:583–590. doi: 10.1093/genetics/89.3.583. [DOI] [PMC free article] [PubMed] [Google Scholar]
- Nei M. Molecular evolutionary genetics. New York: Columbia University Press; 1987. [Google Scholar]
- Nielsen R, Beaumont MA. Statistical inferences in phylogeography. Mol Ecol. 2009;18(6):1034–1047. doi: 10.1111/j.1365-294X.2008.04059.x. [DOI] [PubMed] [Google Scholar]
- Oota H, Settheetham-Ishida W, Tiwawech D, Ishida T, Stoneking M. Human mtDNA and Y-chromosome variation is correlated with matrilocal versus patrilocal residence. Nat Genet. 2001;29:20–21. doi: 10.1038/ng711. [DOI] [PubMed] [Google Scholar]
- Patin E, Laval G, Barreiro LB, et al. (15 co-authors) Inferring the demographic history of African farmers and pygmy hunter-gatherers using a multilocus resequencing data set. PLoS Genet. 2009;5:e1000448. doi: 10.1371/journal.pgen.1000448. [DOI] [PMC free article] [PubMed] [Google Scholar]
- Pemberton TJ, Li FY, Hanson EK, Mehta NU, Choi S, Ballantyne J, Belmont JW, Rosenberg NA, Tyler-Smith C, Patel PI. Impact of restricted marital practices on genetic variation in an endogamous gujarati group. Am J Phys Anthropol. 2012;149:92–103. doi: 10.1002/ajpa.22101. [DOI] [PMC free article] [PubMed] [Google Scholar]
- Phillipson DW. African archaeology. Cambridge: Cambridge University Press; 2005. [Google Scholar]
- Pilkington MM, Wilder JA, Mendez FL, et al. (13 co-authors) Contrasting signatures of population growth for mitochondrial DNA and Y chromosomes among human populations in Africa. Mol Biol Evol. 2008;25:517–525. doi: 10.1093/molbev/msm279. [DOI] [PubMed] [Google Scholar]
- Pritchard JK, Stephens M, Donnelly P. Inference of population structure using multilocus genotype data. Genetics. 2000;155:945–959. doi: 10.1093/genetics/155.2.945. [DOI] [PMC free article] [PubMed] [Google Scholar]
- Quintana-Murci L, Quach H, Harmant C, et al. (23 co-authors) Maternal traces of deep common ancestry and asymmetric gene flow between Pygmy hunter-gatherers and Bantu-speaking farmers. Proc Natl Acad Sci U S A. 2008;105:1596–1601. doi: 10.1073/pnas.0711467105. [DOI] [PMC free article] [PubMed] [Google Scholar]
- Quintana-Murci L, Semino O, Bandelt HJ, Passarino G, McElreavey K, Santachiara-Benerecetti AS. Genetic evidence of an early exit of Homo sapiens sapiens from Africa through eastern Africa. Nat Genet. 1999;23:437–441. doi: 10.1038/70550. [DOI] [PubMed] [Google Scholar]
- R Development Core Team. R: a language and environment for statistical computing. Vienna (Austria): R Foundation for Statistical Computing; 2012. [Google Scholar]
- Ramachandran S, Rosenberg NA, Zhivotovsky LA, Feldman MW. Robustness of the inference of human population structure: a comparison of X-chromosomal and autosomal microsatellites. Hum Genomics. 2004;1:87–97. doi: 10.1186/1479-7364-1-2-87. [DOI] [PMC free article] [PubMed] [Google Scholar]
- Retel-Laurentin A. Infécondité en Afrique noire : maladies et conséquences sociales. Paris: Masson; 1974. [Google Scholar]
- Romaniuk A. La Fécondité des populations congolaises. Paris: Mouton; 1967. [Google Scholar]
- Rosenberg NA. DISTRUCT: a program for the graphical display of population structure. Mol Ecol Notes. 2004;4:137–138. [Google Scholar]
- Salas A, Richards M, De la Fe T, Lareu MV, Sobrino B, Sanchez-Diz P, Macaulay V, Carracedo A. The making of the African mtDNA landscape. Am J Hum Genet. 2002;71:1082–1111. doi: 10.1086/344348. [DOI] [PMC free article] [PubMed] [Google Scholar]
- Ségurel L, Martinez-Cruz B, Quintana-Murci L, et al. (11 co-authors) Sex-specific genetic structure and social organization in central Asia: insights from a multi-locus study. PLoS Genet. 2008;4:e1000200. doi: 10.1371/journal.pgen.1000200. [DOI] [PMC free article] [PubMed] [Google Scholar]
- Seielstad MT, Minch E, Cavalli-Sforza LL. Genetic evidence for a higher female migration rate in humans. Nat Genet. 1998;20:278–280. doi: 10.1038/3088. [DOI] [PubMed] [Google Scholar]
- Sibert A, Austerlitz F, Heyer E. Wright-Fisher revisited: the case of fertility correlation. Theor Popul Biol. 2002;62:181–197. doi: 10.1006/tpbi.2002.1609. [DOI] [PubMed] [Google Scholar]
- Soengas B. Preliminary ethnographic research on the Bakoya in Gabon. Afr Study Monogr. 2009;30:187–208. [Google Scholar]
- Stephens M. Inference under the coalescent. Chichester (United Kingdom): Wiley; 2003. [Google Scholar]
- Tavaré S, Balding DJ, Griffiths RC, Donnelly P. Inferring coalescence times from DNA sequence data. Genetics. 1997;145:505–518. doi: 10.1093/genetics/145.2.505. [DOI] [PMC free article] [PubMed] [Google Scholar]
- Tishkoff SA, Gonder MK, Henn BM, et al. (12 co-authors) History of click-speaking populations of Africa inferred from mtDNA and Y chromosome genetic variation. Mol Biol Evol. 2007;24:2180–2195. doi: 10.1093/molbev/msm155. [DOI] [PubMed] [Google Scholar]
- Tishkoff SA, Reed FA, Friedlaender FR, et al. (25 co-authors) The genetic structure and history of Africans and African Americans. Science. 2009;324:1035–1044. doi: 10.1126/science.1172257. [DOI] [PMC free article] [PubMed] [Google Scholar]
- Underhill PA, Shen P, Lin AA, et al. (21 co-authors) Y chromosome sequence variation and the history of human populations. Nat Genet. 2000;26:358–361. doi: 10.1038/81685. [DOI] [PubMed] [Google Scholar]
- Vansina J. New linguistic evidence and “the Bantu expansion.”. J Afr Hist. 1995;36:173–195. [Google Scholar]
- Vansina J, Bennett NR. The Tio kingdom of the middle Congo, 1880–1892. Oxford: Oxford University Press; 1973. [Google Scholar]
- Veeramah KR, Wegmann D, Woerner A, Mendez FL, Watkins JC, Destro-Bisol G, Soodyall H, Louie L, Hammer MF. An early divergence of KhoeSan ancestors from those of other modern humans is supported by an ABC-based analysis of autosomal resequencing data. Mol Biol Evol. 2012;29:617–630. doi: 10.1093/molbev/msr212. [DOI] [PMC free article] [PubMed] [Google Scholar]
- Verdu P, Austerlitz F, Estoup A, et al. (14 co-authors) Origins and genetic diversity of pygmy hunter-gatherers from Western Central Africa. Curr Biol. 2009;19:312–318. doi: 10.1016/j.cub.2008.12.049. [DOI] [PubMed] [Google Scholar]
- Verdu P, Destro-Bisol G. African pygmies, what's behind a name? Hum Biol. 2012;84:1–10. doi: 10.3378/027.084.0105. [DOI] [PMC free article] [PubMed] [Google Scholar]
- Verdu P, Leblois R, Froment A, Thery S, Bahuchet S, Rousset F, Heyer E, Vitalis R. Limited dispersal in mobile hunter-gatherer Baka pygmies. Biol Lett. 2010;6:858–861. doi: 10.1098/rsbl.2010.0192. [DOI] [PMC free article] [PubMed] [Google Scholar]
- Wegmann D, Leuenberger C, Excoffier L. Efficient approximate Bayesian computation coupled with Markov chain Monte Carlo without likelihood. Genetics. 2009;182:1207–1218. doi: 10.1534/genetics.109.102509. [DOI] [PMC free article] [PubMed] [Google Scholar]
- Weir BS, Cockerham CC. Estimating F-statistics for the analysis of population-structure. Evolution. 1984;38:1358–1370. doi: 10.1111/j.1558-5646.1984.tb05657.x. [DOI] [PubMed] [Google Scholar]
- Whitlock MC, Barton NH. The effective size of a subdivided population. Genetics. 1997;146:427–441. doi: 10.1093/genetics/146.1.427. [DOI] [PMC free article] [PubMed] [Google Scholar]
- Wilkins JF, Marlowe FW. Sex-biased migration in humans: what should we expect from genetic data? Bioessays. 2006;28:290–300. doi: 10.1002/bies.20378. [DOI] [PubMed] [Google Scholar]
- Wood ET, Stover DA, Ehret C, et al. (11 co-authors) Contrasting patterns of Y chromosome and mtDNA variation in Africa: evidence for sex-biased demographic processes. Eur J Hum Genet. 2005;13:867–876. doi: 10.1038/sj.ejhg.5201408. [DOI] [PubMed] [Google Scholar]
- Wright S. Evolution in Mendelian populations. Genetics. 1931;16:97–159. doi: 10.1093/genetics/16.2.97. [DOI] [PMC free article] [PubMed] [Google Scholar]
Associated Data
This section collects any data citations, data availability statements, or supplementary materials included in this article.