Abstract
Background
Poor kidney function is associated with increased risk of cognitive decline and generalized brain atrophy. Chronic kidney disease impairs glomerular filtration rate (eGFR), and this deterioration is indicated by elevated blood levels of kidney biomarkers such as creatinine (SCr) and cystatin C (CysC). Here we hypothesized that impaired renal function would be associated with brain deficits in regions vulnerable to neurodegeneration.
Methods
Using tensor-based morphometry, we related patterns of brain volumetric differences to SCr, CysC levels, and eGFR in a large cohort of 738 (mean age: 75.5±6·8 years; 438 men/300 women) elderly Caucasian subjects scanned as part of the Alzheimer’s Disease Neuroimaging Initiative.
Results
Elevated kidney biomarkers were associated with volume deficits in the white matter region of the brain. All the three renal parameters in our study showed significant associations consistently with a region that corresponds with the anterior limb of internal capsule, bilaterally.
Conclusions
This is the first study to report a marked profile of structural alterations in the brain associated with elevated kidney biomarkers; helping us explain the cognitive deficits.
Keywords: creatinine, cystatin C, GFR, kidney function, brain volumes, brain structure, brain atrophy, neuroimaging, cognitive deficits
1. Introduction
Normal cognitive functioning is an important determinant of the quality of life and socio-economic burden for the elderly worldwide (Rocca, et al., 2011). It is therefore essential to identify biomarkers that might predict imminent brain decline, making it easier to initiate treatment well before the onset of dementia.
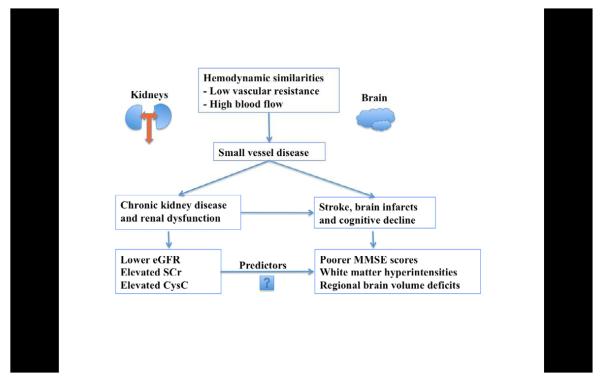
Risk factors for cardiovascular disease, have long been linked to dementia – including Alzheimer’s disease (AD) (Newman, et al., 2005). These risk factors are also associated with increased brain atrophy in cognitively normal elderly subjects (Manolio, et al., 1994,Rajagopalan, et al.). Recently, renal dysfunction has been consistently associated with cardiovascular (Go, et al., 2004) and cerebrovascular events (Uhlig and Levey, 2012). Some correlations between vascular disease in the brain and in the kidney are to be expected, as both these end-organs have similar hemodynamic properties; both experience a very high blood flow, with low vascular resistance (Mogi and Horiuchi, 2011,O’Rourke and Safar, 2005). This can result in an abnormal transmission of pulsatile blood pressure to their microvascular networks (Mogi and Horiuchi, 2011). Increasing arterial stiffness with age (Mitchell, 2008) may add to the microvascular deterioration, promoting both kidney and brain dysfunction (O’Rourke and Safar, 2005) (Figure 1).
Figure 1.
A graphic depicting the hemodynamic similarities between kidneys and brain, leading to our hypotheses.
Renal function is best evaluated by estimating the glomerular filtration rate (eGFR). Endogenous biomarkers such as serum creatinine (SCr) and cystatin C (CysC) are used to determine eGFR in clinical settings. SCr, a derivative of muscle creatine phosphate, is an inert molecule that is freely filtered by the kidneys. It has been the screening test of choice in clinical medicine (Perrone, et al., 1992), and is commonly used to determine eGFR (Perrone, et al., 1992). CysC, a cysteine proteinase inhibitor, is a newer biomarker. It is a low-molecular-weight protein produced at a constant rate by all nucleated cells. Unlike SCr, (Swedko, et al., 2003) CysC concentrations are not significantly affected by age, sex, race, dietary intake or muscle mass and has been proposed to be a more sensitive determinant of eGFR, than SCr (Dharnidharka, et al., 2002). CysC can also be used in combination with SCr to give a more accurate estimate of eGFR than either measure alone (Stevens, et al., 2008).
A review of the literature suggests that individuals in all stages of renal impairment may be at a higher risk for developing cognitive impairment (Elias, et al., 2009) and dementia (Madero, et al., 2008). Several studies have reported associations of (a) SCr with white matter hyperintensity volumes (Khatri, et al., 2007) and rate of brain atrophy (Smith, et al.) (b) CysC with silent brain infarcts (Seliger, et al., 2005), lacunae and white matter lesions (Wada, et al., 2010) and (c) lower eGFR with silent brain infarcts (Kobayashi, et al., 2009), lacunar infarcts (Kobayashi, et al., 2004,Wada, et al., 2008), and higher grades of white matter lesions (Wada, et al., 2008). However there is scant literature relating renal function to specific anatomical patterns of brain volumetry or brain atrophy (Ikram, et al., 2008,Knopman, et al., 2008,Yakushiji, et al., 2010). To our knowledge, no study has mapped the profile of associations between renal function and brain structure in 3D, which may help explain the neurodegeneration associated with cognitive decline. One recent study of renal markers even noted that “the absence of neuroimaging studies … prevents us from inferring which specific areas of the brain are associated with the observed cognitive deficits” (Elias, et al., 2009). By collecting and analyzing renal biomarkers and brain structure in a large elderly cohort scanned with MRI, we hypothesized that we would find elevated SCr, elevated CysC and lower eGFR to be associated with (a) poor cognition, (b) greater white matter hyperintensity volumes, and (c) smaller regional brain volumes.
2. Methods
Data used in the preparation of this article were obtained from the Alzheimer’s Disease Neuroimaging Initiative (ADNI) database (adni.loni.ucla.edu). ADNI was launched in 2003, as a public-private partnership, by the National Institute on Aging (NIA), the National Institute of Biomedical Imaging and Bioengineering (NIBIB), the Food and Drug Administration (FDA), private pharmaceutical companies and non-profit organizations. ADNI assessed 842 subjects at baseline, who received a 1.5 Tesla anatomical brain MRI scan at one of 58 sites across North America.
2.1 Study population
In ADNI almost the entire cohort was Caucasian; we therefore restricted our analysis to Caucasian subjects (n=738; mean age: 75.5±6·8 years; 173 with AD, 359 with mild cognitive impairment (MCI) and 206 cognitively normal controls (CTL)) to avoid population stratification effects. Inclusion and exclusion criteria are detailed in the ADNI protocol (Mueller, et al., 2005). All subjects underwent clinical and cognitive evaluations at the time of their MRI scan including the mini-mental state examination (MMSE) (Folstein, et al., 1975) and Alzheimer’s Disease Assessment Scale (ADAS-cog) (Rosen, et al., 1984), which we focused on for one of our primary hypotheses here. The MMSE, with scores ranging from 0 to 30, is a global measure of mental status based on five cognitive domains; lower scores indicate poorer performance and scores below 24 are typically associated with dementia. The ADAS-cog, with scores ranging from 0 to 70, assesses cognitive performance; higher scores indicate poorer cognitive function. A global measure of white matter hyperintensities (WMH), another focus of our hypotheses, was also downloaded from the ADNI website. WMH was assessed on the basis of the signal intensities of coregistered T1-, T2-, and proton density weighted scans and on the basis of population statistics regarding the spatial distribution and neighborhood structure of white matter lesions throughout the brain. The method provides white matter hyperintensity measures that agree strongly with FLAIR-based gold-standard measures (Schwarz, et al., 2009).
The study was conducted according to the Good Clinical Practice guidelines, the Declaration of Helsinki, and US 21 CFR Part 50–Protection of Human Subjects, and Part 56– Institutional Review Boards. All data are publicly available, at http://www.loni.ucla.edu/ADNI/.
2.2 Renal function biomarkers
Of the 738 subjects in total, one or more renal biomarker data was available for 716 subjects, where, SCr alone was available for 716 subjects, CysC alone was available for 517 subjects and eGFR was calculated for 501 subjects who had data for both SCr and CysC.
SCr (μmol/L), from blood samples collected at the time of the subject’s MRI scans, was determined using a validated Isotope dilution mass spectrometry (IDMS) traceable methods, at Covance laboratory, Madison, Wisconsin (Shaw, 2008). Data was available for 716 Caucasian subjects; in this group, we tested creatinine associations with brain structure. CysC (mg/L) was measured at baseline for 517 Caucasian subjects, so we carried out CysC based correlations in this more limited subgroup. CysC was measured using the ‘Human Discovery Multi-Analyte Profile’ platform by Rules-Based Medicine (RBM, www.rulesbasedmedicine.com, Austin, TX). The quantification methods are described in the document ‘Biomarkers Consortium ADNI Plasma Targeted Proteomics Project – Data Primer’ (available at http://adni.loni.ucla.edu).
The estimated glomerular filtration rate, eGFR (in units of mL/min/1.73m2), was calculated by using both SCr values (in mg/dL for the formula) and CysC values (mg/L) in 501 Caucasian subjects, using the following equation (Stevens, et al., 2008):
| (Eqn.1) |
This study was confined to Caucasian subjects, so we did not use the final term. In the original paper (Stevens, et al., 2008), the coefficients in the equation for estimating eGFR come from a model developed and internally validated in pooled individual-level patient data from the Modification of Diet in Renal Disease (MDRD) Study, African American Study of Kidney Disease (AASK) and Collaborative Study Group (CSG), and externally validated in a clinical population in Paris, France.
2.3 MRI acquisition, calibration, and processing
High-resolution structural brain MRI scans, using 1.5- and 3-Tesla (T) MRI scanners, were acquired from subjects at multiple ADNI sites, according to a standardized protocol (Jack Jr, et al., 2008,Leow, et al., 2006); however, as not all ADNI subjects had a 3T scan, we restricted our analysis to 1.5T MRI scans as scanner field strength can affect tissue volume quantification (Ho, et al., 2010). Each anatomical scan was collected using a 3D sagittal magnetization-prepared rapid gradient-echo sequence (MPRAGE) with the following parameters: repetition time (2400 ms), flip angle (8°), inversion time (1000 ms), 24 cm field of view, a 192x192x166 acquisition matrix, a voxel size of 1.25x1.25x1.2 mm3, later reconstructed to 1 mm isotropic voxels. Globally aligned images were resampled in an isotropic space of 220 voxels along each axis (x, y, and z) with a final voxel size of 1 mm3 (Hua, et al., 2008b). Images were calibrated with phantom-based geometric corrections to ensure consistency across scanners. Each incoming image file was quality checked for medical abnormalities and image quality. The ADNI scanning protocol was developed after a rigorous preparatory phase in which we and others made sure that the volumetric methods used were reproducible across repeated scans (Leow, et al., 2006).
2.4 Tensor-Based Morphometry (TBM) and 3D Jacobian maps
As part of the TBM analysis, T1-weighted structural brain MRI scans were analyzed using a standard protocol (Hua, et al., 2008b). An average brain template, also called a “minimal deformation template” (MDT) was created from the MRI scans of 40 cognitively healthy ADNI subjects matched for age, sex, education with the overall sample. This average brain image is used to ease automated image registration, reduce statistical bias and boost the power to detect statistically significant effects (Hua, et al., 2008a). All pre-processed MRI images were non-linearly aligned to the study-specific template so that they would all share a common coordinate system defined by the MDT. For each subject, the local expansion or compression factor of the 3D elastic warping transform (Leow, et al., 2005), calculated as the determinant of the Jacobian matrix of the deformation, was plotted to show relative volume differences between each individual and the common template. These 3D maps for each subject reveal areas of structural volume expansions or deficits, relative to the healthy elderly population average.
2.5 Data for cerebral white matter volumes
Bilateral cerebral white matter volumes (in mm3) were obtained from the ADNI database and were computed at UC San Francisco, using the FreeSurfer image analysis suite (http://surfer.nmr.mgh.harvard.edu/). Only 705, 508 and 492 subjects at baseline passed quality control and also had data for SCr, CysC and eGFR respectively; in this group, we tested renal function associations with overall cerebral white matter volumes.
2.6 Statistical correlations
We modeled the effect of renal measures and other predictors on regional brain volumes by fitting the following multiple regression equation at each image voxel:
| (Eqn.2) |
The outcome variables considered, y, were (a) cognitive scores (MMSE and ADAS-cog), (b) white matter hyperintensity volumes (c) TBM brain volumes, relative to the standard template, at each image voxel within the brain region analyzed and d) overall cerebral white matter volumes. The primary predictors included renal biomarkers SCr, CysC and eGFR (Eqn. 1). The distributions of SCr and CysC were somewhat skewed (Fig. 2a, 3a left) in our population. To normalize the values, and because SCr and CysC are inversely related to renal function, we used the reciprocal (inverse) of the measured values for the renal biomarkers, i.e., 1/SCr and 1/SCys. This transformation has been advocated in prior studies (Kurella, et al., 2005,Seliger, et al., 2005)_ENREF_31, as the inverse values more closely approximate a Normal distribution (Fig. 2a, 3a right).
Figure 2a.
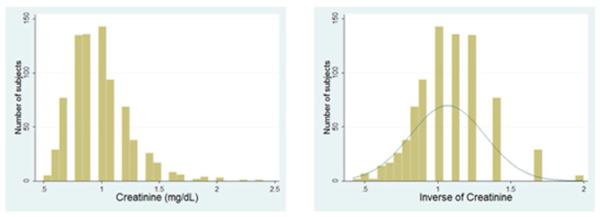
Left –distribution of SCr values in ADNI population; Right - transformed (reciprocal) SCr values used in our analysis.
Figure 2c.
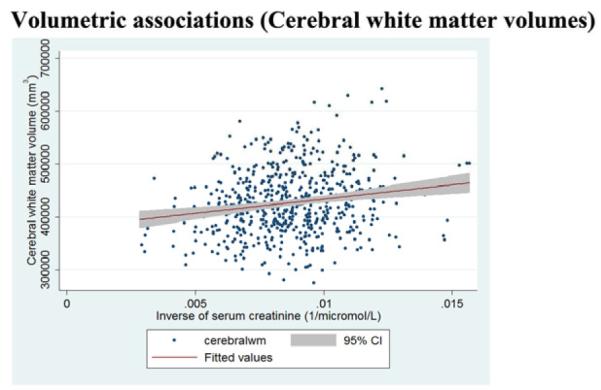
Regression slopes, with a 95% confidence band, show that higher baseline creatinine levels are associated (p<0·05) with smaller cerebral white matter volumes.
Figure 2b.
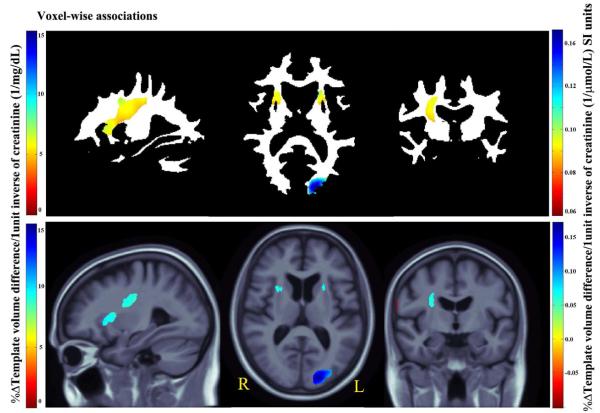
3D Beta-value maps show the estimated average brain volume differences per 1unit increase in the inverse of SCr (1/mg/dL left and 1/μmol/L right color bar) levels across whole brain white matter (upper panel) and the cerebral region (lower panel).
In the same regression models, we adjusted for standard predictors - age, sex and cardiovascular risk factors including systolic blood pressure, diastolic blood pressure, history of smoking and history of diabetes mellitus – which we regarded as confounders, or covariates of no interest. These specific confounders were chosen based on a prior hypothesis that they might have an effect on the brain, rather than just testing a large number of measures and retaining only the ones that gave a good fit to the empirical data. We did not include homocysteine as a covariate in the analysis, as it was significantly correlated with SCr (r = 0.5, p < 0.0001) and CysC levels (r = 0.49, p < 0.0001) and may possibly be a proxy for renal dysfunction.
2.6 Mapping Regional Brain Volumes
We created 3D maps to highlight regions of volume deficit or excess relative to the average brain template, reflecting, in part, profiles of neurodegeneration. We used a standard false discovery rate (FDR) correction, at the conventionally accepted level of 5% (i.e., q = 0.05), for multiple statistical comparisons across all voxels in the brain region studied. As customary, the critical p-values for these associations are listed. The critical p value represents the highest statistical threshold, if one exists, for which the statistical map controls the false discovery rate at 5%.
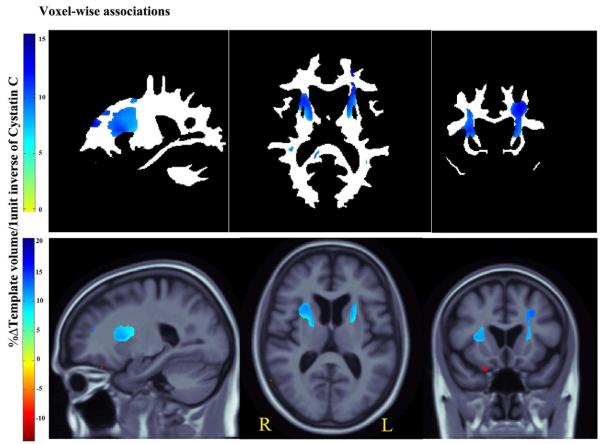
Figures 2b-4b show statistical (beta or regression coefficient) maps of the brain volume associations, using the critical p-value as threshold. Thus, only 5% of the voxels in the maps are expected to be false positives.
Figure 4b.
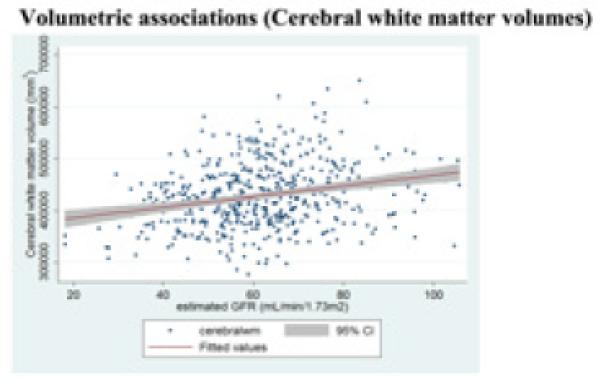
Regression slopes, with a 95% confidence band, show that higher baseline GFR levels are associated (p<0·05) with larger cerebral white matter volumes.
The upper panels show associations across voxels in the white matter region only – a region where lesions, due to vascular infarcts, are most commonly detected based on prior findings (Ikram, et al., 2008). The lower panels, show associations across all cerebral voxels, the primary region involved with cognitive changes associated with small vessel disease.
The greater the volume expansion, the darker is the blue color. To ease interpretation, the color scales differ for each figure, and are indexed by their respective color bars.
2.7 Cerebral white matter volumes and renal parameters
All three renal parameters were tested for associations with cerebral white matter volumes after adjusting for age, sex and cardiovascular risk factors. The results were plotted as graphs (Figures 2c, 3c and 4b) using the software Stata (StataCorp, 2011, College Station, Texas).
Figure 3c.
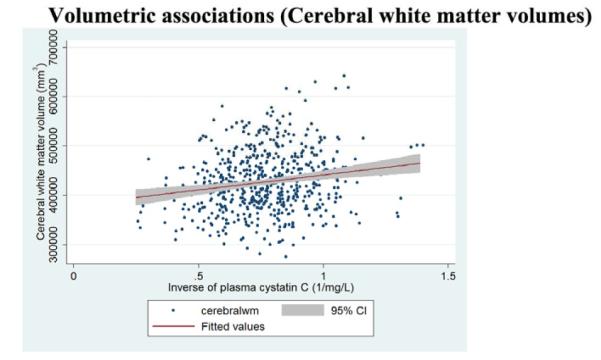
Regression slopes, with a 95% confidence band, show that higher baseline cystatin C levels are associated (p<0·05) with smaller cerebral white matter volumes.
3. Results
Table 1 summarizes the clinical and demographic characteristics of the cohort, including the kidney biomarkers. When compared to men, women in the cohort had significantly lower SCr levels (two-tailed Student’s t-test, p < 0.0001) but not CysC levels (two-tailed t-test, p=0.05). In line with our hypotheses, we found that diminished renal function was associated with (a) lower MMSE scores and (b) brain volume deficits. However, contrary to our predictions, our kidney biomarkers did not show detectable associations with WMH volumes.
Table 1.
Clinical and demographic characteristics of the ADNI cohort.
| Mean±SD | AD (n=173) | MCI (n=359) | Controls (n=206) |
|---|---|---|---|
| Age | 75.6±7.6 | 75.1±7.2 | 76.2±5.0 |
| Sex (M/F) | 95/78 | 231/128 | 112/94 |
| Education (Years) | 14.9±3.0 | 15.7±3.0 | 16.2±2.7 |
| MMSE | 23.4±2.0 | 27.1±1.8 | 29.2±1.0 |
| Creatinine (μmol/L) (n=716) | 90.3±23.3 (n=164) |
89.3±23.2 (n=348) |
88.2±22.9 (n=204) |
| Cystatin C (mg/L) (n=517) | 1.5±0.6 (n=110) | 1.4±0.4 (n=354) | 1.4±0.3 (n=53) |
| eGFR (mL/min/1.73 m2) | 58.7±16.0 | 62.3±15.1 | 61.7±12.1 |
| Systolic blood pressure (mm Hg) | 137±17 | 135±18 | 134±17 |
| Diastolic blood pressure (mm Hg) | 75±10 | 75±10 | 74±10 |
| White matter hyperintensity (cc) | 1.3±2.7 | 0.9±2.5 | 0.7±2.2 |
3.1 Poor renal function is associated with poor cognition
Inverse of SCr (β = 109.2 per 1/μmol/L; p = 0.005), inverse of CysC (β = 1.2 per 1/mg/L; p = 0.047) and eGFR (β = 0.22 per 15mL/min/1.73m2; p = 0.049) were significantly associated with MMSE scores after appropriate corrections for age, sex and cardiovascular risk factors; and the directions of association were as expected, where, poor kidney function was associated with poorer cognitive scores.
Subjects with poor kidney function showed higher ADAS-cog scores and thus poor cognitive performance. However, none of the associations were significant (Inverse of SCr: β = -159.6 per 1/μmol/L; p = 0.005, inverse of CysC: β = -2.2 per 1/mg/L; p = 0.1 and eGFR: β = -0.3 per 15mL/min/1.73m2; p = 0.3).
3.2 Poor renal function showed no significant association with WMH volumes
None of the three renal parameters was significantly associated with WMH volumes after appropriate corrections for age, sex and cardiovascular risk factors (1/SCr: β = 30.1 per 1/μmol/L; p = 0.4, 1/CysC: β = 0.4 per 1/mg/L; p = 0.6, eGFR: β = 0.09 per 15mL/min/1.73m2; p = 0.4), although such an association would have been somewhat expected based on the prior literature (Ikram, et al., 2008,Khatri, et al., 2007,Wada, et al., 2010)_ENREF_21.
3.3 Poor renal function was associated with regional brain volume deficits
Consistent with our proposed hypothesis, all brain volume associations were detected after appropriate corrections for age and sex. These associations remained significant after controlling for cardiovascular risk factors.
3.3.1 Serum Creatinine
Every unit increase in 1/SCr (better kidney function) was associated with an average of 0.05 to 0.2% white matter excess (per 1/μmol/L) in the anterior limb of (AL) internal capsule, bilaterally, and in the left forceps major in the occipital lobe (Fig. 2b upper panel, critical p-value: 0.006).
In the same subjects, we found significant correlations with cerebral volumes (Fig. 2b lower panel; critical p-value: 0.0007) with an average of almost 0.2% brain tissue excess (per 1/μmol/L) (depending on the brain region). The red region at the right side periphery in the coronal slice represents a volume deficit in the CSF region associated with increase in 1/SCr (better kidney function); this is in the direction that would be expected.
3.3.2 Cystatin C
After controlling for age and sex, every unit increase in 1/CysC (better kidney function) was associated with an average of 1%–15% white matter excess in the AL internal capsule, bilaterally, and extending into left forceps minor in the frontal lobe, in ADNI subjects at baseline (Fig. 3b upper panel, critical p-value: 0.007).
Figure 3b.
3D Beta-value maps show, the estimated average regional brain differences per every 1unit increase in the inverse of CysC (1/mg/L) levels across white matter (upper panel) and the cerebral region (lower panel).
In the same subjects, we found significant correlations with cerebral volumes (Fig. 3b lower panel; critical p-value: 0.0007) with an average of 1%–20% brain tissue excess (depending on the brain region).
3.3.3 eGFR
In a voxelwise regression analysis using TBM, every standard deviation (15 mL/min/1.73 m2) increase in eGFR (better kidney function) was associated with an average white matter excess of 1%–4% (depending on the brain region) in bilateral AL internal capsule region (Fig. 4a upper panel, critical p-value: 0.004).
Figure 4a.
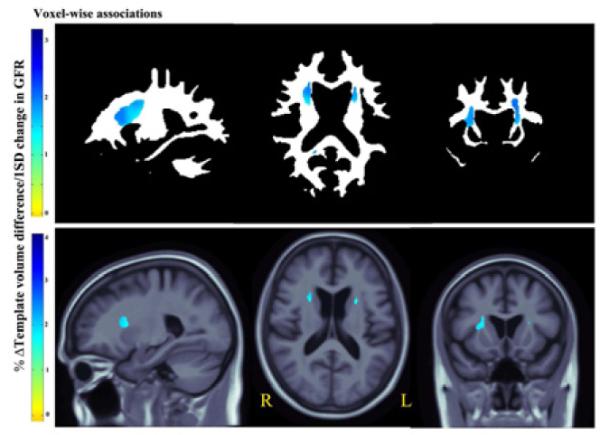
3D Beta-value maps show the estimated regional brain differences (% relative to mean template) at each significant voxel across white matter (upper panel) and the cerebral region (lower panel), per every 1standard deviation (15 mL/min/1.76m2) increase in the eGFR.
In the same subjects, we found an average of 1%–4% cerebral volume excess (depending on the brain region) associated with every standard deviation increase in eGFR (Fig. 4a lower panel; critical p-value: 0.0004).
3.4 Poor renal function was associated with smaller cerebral white matter volumes
We found significant associations (Figures 2c, 3c and 4b) for all the three renal parameters with overall (left + right) cerebral white matter volumes (mm3) after appropriate corrections for age, sex and cardiovascular risk factors (1/SCr: β = 2.46 x 10⁶ per 1/μmol/L; p = 0.001, 1/CysC: β = 32756.0 per 1/mg/L; p = 0.02, eGFR: β = 483.5 per mL/min/1.73m2; p = 0.003). 3.5 In a post hoc test, renal biomarkers did not show correlations with cerebrospinal fluid biomarkers for brain atrophy in AD, including levels of beta amyloid and tau.
4. Discussion
This is the first study to reveal a 3D pattern of regional brain volume deficits associated with poor kidney function, in a large population of elderly subjects, some of them diagnosed with AD and MCI. We found that poor renal function, as measured by elevated SCr, elevated CysC and lower eGFR, was associated with poor cognition and volume deficits in brain, especially in the white matter. These correlations were partially independent of other known risk factors that affect brain atrophy, such as age, sex and cardiovascular risk factors including systolic and diastolic blood pressure, history of smoking and diabetes mellitus.
The affected regions mapped out in our study are primarily in the white matter and agree with findings of a prior study (Ikram, et al., 2008). All the three renal parameters in our study showed associations consistently with a region that approximately corresponds with the AL internal capsule, bilaterally. The AL internal capsule contains fibers from the anterior thalamic radiation, which forms a reciprocal connection between dorsomedial and anterior thalamic nuclei, the prefrontal cortex and the cingulate gyrus (Parent, 1996). The AL internal capsule is also connected to the medial limbic circuit involving the hippocampal formation and the cingulate gyrus (Papez, 1937). The brain regions that are reciprocally connected with AL internal capsule are associated with cognitive deficits (Reed, et al., 2000). It is possible that the disintegration in these circuits may result in cognitive deficits.
The brain regions connected with the AL internal capsule are also among those that show AD-related brain atrophy (Hua, et al., 2008a). We tested associations of renal biomarkers with known cerebrospinal fluid biomarkers of AD, in a subset of ADNI subjects who had a lumbar puncture and had cerebrospinal fluid beta amyloid (n = 387) and tau (n = 379) measured. However, we did not find any significant correlations.
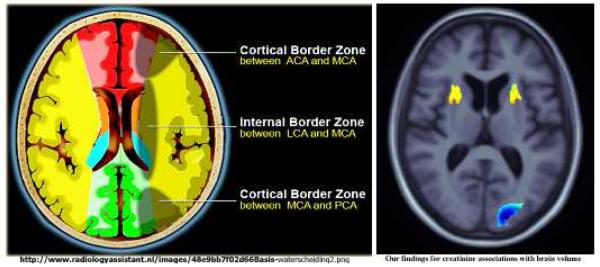
The mechanism underlying the association of poor renal function with brain structure is unknown. Small vessel disease in the kidney may lead to elevated renal biomarkers, and similar vascular deterioration in the brain (more likely the deep perforating arterioles supplying the deep white matter regions (Scheltens, et al., 1995) may lead to subtle and distributed atrophy, contributing to cognitive decline and the brain volume deficit findings (Figure 1). These regions are also the so-called “watershed” regions - representing the border zone of blood supply between the anterior, middle and posterior cerebral arteries respectively (Figure 5). These watershed regions have a precarious blood supply and are more prone to micro infarcts. Intriguingly, this may explain our localized regional brain volume deficit findings.
Figure 5.
“Watershed” infarcts possibly explaining the regional anatomical localization of brain atrophy that is associated with poor kidney function.
We tried to explore the differential associations between the kidney measures and the diagnostic subgroups (AD, MCI and healthy controls). For creatinine, we found that, in the MCI group, significant white matter deficits were primarily detected near the internal capsule region. In the control group, significant white matter deficits were found in the posterior occipital region. The AD group showed deficits in similar internal capsule regions as MCI, however, it did not show overall significant associations after correcting for FDR, possibly because of the smaller sample size of AD (n=163) versus MCI (n=348) and control (n=204) groups. For cystatin C, significant white matter deficits were primarily near the internal capsule region for the AD and the MCI group. However, the healthy controls showed significant greater lateral ventricular volumes and indirectly smaller brain volumes associated with cystatin C.
Unlike prior studies (Ikram, et al., 2008,Khatri, et al., 2007,Wada, et al., 2010)_ENREF_21, associations of kidney function with WMH measures were not significant in our subjects, even though the associations between brain volumes and kidney function were localized to white matter regions frequently affected by WMH. It is not clear why this is, but TBM may offer somewhat more reproducible and precise measures, making it easier to pick up a correlation with other pertinent biomarkers such as the kidney parameters in this study. Further, prior studies associating CysC correlations with WMH (Wada, et al., 2008) have used a clinical measurement of CysC, whereas the ADNI data was generated as part of a proteomics study which used a multiplex assay method, where a large number of proteins were measured simultaneously. This limitation of multiplex could have resulted in greater variance and lesser sensitivity to detect WMH correlations.
Strengths of our study include 1) the relatively large sample of elderly subjects, 2) high quality brain MRI scans, 3) a well-validated computational method for volume quantification which allowed us to map the association at every single voxel across the brain, 4) estimating eGFR using a combination of values of SCr and CysC, a superior marker of renal status.
Our study may be limited by the lack of a longitudinal study design – the SCr measures were assessed only once, at baseline - so we were unable to study possible associations of brain atrophy with any active changes in SCr and eGFR measures. Additional studies are needed to replicate our findings and confirm the localization of these associations to the internal capsule region. TBM analysis is to some extent hypothesis generating, and the overall magnitude of effects is considered significant, regardless of their location. As such, the findings regarding the left occipital region also need replication before firm conclusions can be drawn on the spatial distribution of effects. The results for eGFR associations need to be interpreted with caution as the eGFR equations were developed in a population with chronic kidney disease, and most ADNI subjects would not meet those criteria. We adjusted for age and sex in our correlations, as they also affect regional brain volumes, and since eGFR included age and sex in the equations to estimate it, we might have controlled for it twice. SCr levels are influenced by age, sex, diet, muscle mass and other factors which may have under- or over-estimated the values. Only Caucasian subjects were studied, so care must be exercised in generalizing the findings to other ethnic groups.
5. Conclusion
We found that poor renal function is associated with impaired cognitive performance and white matter deficits independent of age, sex and cardiovascular risk factors. These findings may have implications for SCr, CysC and eGFR to act as predictors for cognitive impairment, dementia, and cerebral atrophy. These findings also underscore the need for early diagnosis and treatment of subclinical kidney dysfunction.
Figure 3a.
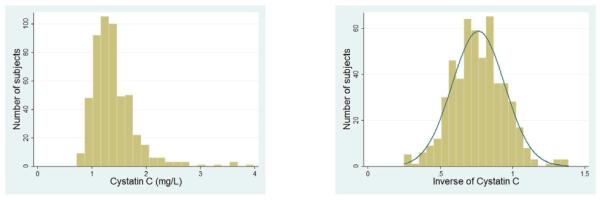
Left –distribution of CysC values in ADNI population; Right - transformed (reciprocal) CysC values used in our analysis.
Acknowledgments
This work was supported by NIH grants U01 AG024904, R01 EB008281 and R01 AG020098 to P.T. Data used in this article was from Alzheimer’s Disease Neuroimaging Initiative database (www.loni.ucla.edu/ADNI). ADNI data collection was funded by the Alzheimer’s Disease Neuroimaging Initiative (ADNI; NIH Grant U01 AG024904). ADNI is funded by the National Institute on Aging, the National Institute of Biomedical Imaging and Bioengineering, Abbott, AstraZeneca AB, Bayer Schering Pharma AG, Bristol-Myers Squibb, Eisai Global Clinical Development, Elan Corporation, Genentech, GE Healthcare, GlaxoSmithKline, Innogenetics, Johnson and Johnson, Eli Lilly and Co., Medpace, Inc., Merck and Co., Inc., Novartis AG, Pfizer Inc, F. Hoffman-La Roche, Schering-Plough, Synarc, Inc., Wyeth, and non-profit partners the Alzheimer’s Association and Alzheimer’s Drug Discovery Foundation, with participation from the U.S. Food and Drug Administration. Private sector contributions to ADNI are facilitated by the Foundation for the National Institutes of Health (www.fnih.org <http://www.fnih.org>). The grantee organization is the Northern California Institute for Research and Education, and the study is coordinated by the Alzheimer’s Disease Cooperative Study at the University of California, San Diego. ADNI research was also supported by NIH grants P30 AG010129, K01 AG030514, and the Dana Foundation. ADNI data are disseminated by the Laboratory for Neuro Imaging at the University of California, Los Angeles.
Michael Weiner is supported in part by a variety of commercial agencies including private and public agencies that support ADNI, which did not influence this work-Abbott Alzheimer’s Association Alzheimer’s Drug Discovery Foundation Anonymous Foundation AstraZeneca Bayer Healthcare BioClinica, Inc. (ADNI 2) Bristol-Myers Squibb Cure Alzheimer’s Fund Eisai Elan Gene Network Sciences Genentech GE Healthcare GlaxoSmithKline Innogenetics Johnson & Johnson Eli Lilly & Company Medpace Merck Novartis Pfizer Inc Roche Schering Plough Synarc Wyeth
Footnotes
Publisher's Disclaimer: This is a PDF file of an unedited manuscript that has been accepted for publication. As a service to our customers we are providing this early version of the manuscript. The manuscript will undergo copyediting, typesetting, and review of the resulting proof before it is published in its final citable form. Please note that during the production process errors may be discovered which could affect the content, and all legal disclaimers that apply to the journal pertain.
Data used in preparation of this article were obtained from the Alzheimer’s Disease Neuroimaging Initiative (ADNI) database (adni.loni.ucla.edu). As such, the investigators within the ADNI contributed to the design and implementation of ADNI and/or provided data but did not participate in analysis or writing of this report. A complete listing of ADNI investigators can be found at: http://adni.loni.ucla.edu/wp-content/uploads/how_to_apply/ADNI_Acknowledgement_List.pdf
Disclosure statement All the authors have no actual or potential conflicts of interest including any financial, personal or other relationships with other people or organizations within three years of beginning the work submitted that could inappropriately influence (bias) this work.
REFERENCES
- Dharnidharka VR, Kwon C, Stevens G. Serum cystatin C is superior to serum creatinine as a marker of kidney function: a meta-analysis. American Journal of Kidney Diseases. 2002;40(2):221–6. doi: 10.1053/ajkd.2002.34487. [DOI] [PubMed] [Google Scholar]
- Elias MF, Elias PK, Seliger SL, Narsipur SS, Dore GA, Robbins MA. Chronic kidney disease, creatinine and cognitive functioning. Nephrology Dialysis Transplantation. 2009;24(8):2446. doi: 10.1093/ndt/gfp107. [DOI] [PMC free article] [PubMed] [Google Scholar]
- Folstein MF, Folstein SE, McHugh PR. “Mini-mental state”. A practical method for grading the cognitive state of patients for the clinician. J Psychiatr res. 1975;12(3):189–98. doi: 10.1016/0022-3956(75)90026-6. [DOI] [PubMed] [Google Scholar]
- Go AS, Chertow GM, Fan D, McCulloch CE, Hsu C. Chronic kidney disease and the risks of death, cardiovascular events, and hospitalization. New England Journal of Medicine. 2004;351(13):1296–305. doi: 10.1056/NEJMoa041031. [DOI] [PubMed] [Google Scholar]
- Ho AJ, Hua X, Lee S, Leow AD, Yanovsky I, Gutman B, Dinov ID, Leporé N, Stein JL, Toga AW. Comparing 3 T and 1.5 T MRI for tracking Alzheimer’s disease progression with tensor-based morphometry. Human brain mapping. 2010;31(4):499–514. doi: 10.1002/hbm.20882. [DOI] [PMC free article] [PubMed] [Google Scholar]
- Hua X, Leow AD, Lee S, Klunder AD, Toga AW, Lepore N, Chou YY, Brun C, Chiang MC, Barysheva M. 3D characterization of brain atrophy in Alzheimer’s disease and mild cognitive impairment using tensor-based morphometry. Neuroimage. 2008a;41(1):19–34. doi: 10.1016/j.neuroimage.2008.02.010. [DOI] [PMC free article] [PubMed] [Google Scholar]
- Hua X, Leow AD, Parikshak N, Lee S, Chiang MC, Toga AW, Jack CR, Jr, Weiner MW, Thompson PM. Tensor-based morphometry as a neuroimaging biomarker for Alzheimer’s disease: an MRI study of 676 AD, MCI, and normal subjects. Neuroimage. 2008b;43(3):458–69. doi: 10.1016/j.neuroimage.2008.07.013. [DOI] [PMC free article] [PubMed] [Google Scholar]
- Ikram MA, Vernooij MW, Hofman A, Niessen WJ, van der Lugt A, Breteler M. Kidney function is related to cerebral small vessel disease. Stroke. 2008;39(1):55–61. doi: 10.1161/STROKEAHA.107.493494. [DOI] [PubMed] [Google Scholar]
- Jack CR, Jr, Bernstein MA, Fox NC, Thompson P, Alexander G, Harvey D, Borowski B, Britson PJ, L Whitwell J, Ward C. The Alzheimer’s disease neuroimaging initiative (ADNI): MRI methods. Journal of Magnetic Resonance Imaging. 2008;27(4):685–91. doi: 10.1002/jmri.21049. [DOI] [PMC free article] [PubMed] [Google Scholar]
- Khatri M, Wright CB, Nickolas TL, Yoshita M, Paik MC, Kranwinkel G, Sacco RL, DeCarli C. Chronic kidney disease is associated with white matter hyperintensity volume. Stroke. 2007;38(12):3121–6. doi: 10.1161/STROKEAHA.107.493593. [DOI] [PMC free article] [PubMed] [Google Scholar]
- Knopman DS, Mosley TH, Bailey KR, Jack CR, Schwartz GL, Turner ST. Associations of microalbuminuria with brain atrophy and white matter hyperintensities in hypertensive sibships. Journal of the neurological sciences. 2008;271(1):53–60. doi: 10.1016/j.jns.2008.03.009. [DOI] [PMC free article] [PubMed] [Google Scholar]
- Kobayashi M, Hirawa N, Yatsu K, Kobayashi Y, Yamamoto Y, Saka S, Andoh D, Toya Y, Yasuda G, Umemura S. Relationship between silent brain infarction and chronic kidney disease. Nephrology Dialysis Transplantation. 2009;24(1):201–7. doi: 10.1093/ndt/gfn419. [DOI] [PMC free article] [PubMed] [Google Scholar]
- Kobayashi S, Ikeda T, Moriya H, Ohtake T, Kumagai H. Asymptomatic cerebral lacunae in patients with chronic kidney disease. American Journal of Kidney Diseases. 2004;44(1):35–41. doi: 10.1053/j.ajkd.2004.03.026. [DOI] [PubMed] [Google Scholar]
- Kurella M, Chertow GM, Fried LF, Cummings SR, Harris T, Simonsick E, Satterfield S, Ayonayon H, Yaffe K. Chronic kidney disease and cognitive impairment in the elderly: the health, aging, and body composition study. Journal of the American Society of Nephrology. 2005;16(7):2127–33. doi: 10.1681/ASN.2005010005. [DOI] [PubMed] [Google Scholar]
- Leow A, Huang SC, Geng A, Becker J, Davis S, Toga A, Thompson P. Inverse consistent mapping in 3D deformable image registration: its construction and statistical properties. Springer; 2005. pp. 493–503. [DOI] [PubMed] [Google Scholar]
- Leow AD, Klunder AD, Jack CR, Toga AW, Dale AM, Bernstein MA, Britson PJ, Gunter JL, Ward CP, Whitwell JL. Longitudinal stability of MRI for mapping brain change using tensor-based morphometry. Neuroimage. 2006;31(2):627–40. doi: 10.1016/j.neuroimage.2005.12.013. [DOI] [PMC free article] [PubMed] [Google Scholar]
- Madero M, Gul A, Sarnak MJ. Review: Cognitive Function in Chronic Kidney Disease. Wiley Online Library; 2008. pp. 29–37. [DOI] [PubMed] [Google Scholar]
- Manolio TA, Kronmal RA, Burke GL, Poirier V, O’Leary DH, Gardin JM, Fried LP, Steinberg EP, Bryan RN. Magnetic resonance abnormalities and cardiovascular disease in older adults. The Cardiovascular Health Study. Stroke. 1994;25(2):318–27. doi: 10.1161/01.str.25.2.318. [DOI] [PubMed] [Google Scholar]
- Mitchell GF. Effects of central arterial aging on the structure and function of the peripheral vasculature: implications for end-organ damage. Journal of Applied Physiology. 2008;105(5):1652–60. doi: 10.1152/japplphysiol.90549.2008. [DOI] [PMC free article] [PubMed] [Google Scholar]
- Mogi M, Horiuchi M. Clinical interaction between brain and kidney in small vessel disease. Cardiology research and practice. 2011;2011 doi: 10.4061/2011/306189. [DOI] [PMC free article] [PubMed] [Google Scholar]
- Mueller SG, Weiner MW, Thal LJ, Petersen RC, Jack C, Jagust W, Trojanowski JQ, Toga AW, Beckett L. The Alzheimer’s disease neuroimaging initiative. Neuroimaging Clinics of North America. 2005;15(4):869. doi: 10.1016/j.nic.2005.09.008. [DOI] [PMC free article] [PubMed] [Google Scholar]
- Newman AB, Fitzpatrick AL, Lopez O, Jackson S, Lyketsos C, Jagust W, Ives D, DeKosky ST, Kuller LH. Dementia and Alzheimer’s disease incidence in relationship to cardiovascular disease in the Cardiovascular Health Study cohort. Journal of the American Geriatrics Society. 2005;53(7):1101–7. doi: 10.1111/j.1532-5415.2005.53360.x. [DOI] [PubMed] [Google Scholar]
- O’Rourke MF, Safar ME. Relationship between aortic stiffening and microvascular disease in brain and kidney. Hypertension. 2005;46(1):200–4. doi: 10.1161/01.HYP.0000168052.00426.65. [DOI] [PubMed] [Google Scholar]
- Papez JW. A proposed mechanism of emotion. Archives of neurology and psychiatry. 1937;38(4):725. [Google Scholar]
- Parent A. Carpenter’s Human Neuroanatomy. Williams & Wilkins Baltimore; 1996. [Google Scholar]
- Perrone RD, Madias NE, Levey AS. Serum creatinine as an index of renal function: new insights into old concepts. Clinical chemistry. 1992;38(10):1933–53. [PubMed] [Google Scholar]
- Rajagopalan P, Hua X, Toga AW, Jack CR, Jr, Weiner MW, Thompson PM. Homocysteine effects on brain volumes mapped in 732 elderly individuals. NeuroReport. 22(8):391. doi: 10.1097/WNR.0b013e328346bf85. [DOI] [PMC free article] [PubMed] [Google Scholar]
- Reed B, Eberling J, Mungas D, Weiner M, Jagust W. Memory failure has different mechanisms in subcortical stroke and Alzheimer’s disease. Annals of neurology. 2000;48(3):275. [PMC free article] [PubMed] [Google Scholar]
- Rocca WA, Petersen RC, Knopman DS, Hebert LE, Evans DA, Hall KS, Gao S, Unverzagt FW, Langa KM, Larson EB. Trends in the incidence and prevalence of Alzheimer’s disease, dementia, and cognitive impairment in the United States. Alzheimer’s and Dementia. 2011;7(1):80–93. doi: 10.1016/j.jalz.2010.11.002. [DOI] [PMC free article] [PubMed] [Google Scholar]
- Rosen WG, Mohs RC, Davis KL. A new rating scale for Alzheimer’s disease. The American Journal of Psychiatry; The American Journal of Psychiatry. 1984 doi: 10.1176/ajp.141.11.1356. [DOI] [PubMed] [Google Scholar]
- Scheltens P, Barkhof F, Leys D, Wolters EC, Ravid R, Kamphorst W. Histopathologic correlates of white matter changes on MRI in Alzheimer’s disease and normal aging. Neurology. 1995;45(5):883–8. doi: 10.1212/wnl.45.5.883. [DOI] [PubMed] [Google Scholar]
- Schwarz C, Fletcher E, DeCarli C, Carmichael O. Fully-automated white matter hyperintensity detection with anatomical prior knowledge and without FLAIR. Springer; 2009. pp. 239–51. [DOI] [PMC free article] [PubMed] [Google Scholar]
- Seliger SL, Longstreth W, Jr, Katz R, Manolio T, Fried LF, Shlipak M, Stehman-Breen CO, Newman A, Sarnak M, Gillen DL. Cystatin C and subclinical brain infarction. Journal of the American Society of Nephrology. 2005;16(12):3721–7. doi: 10.1681/ASN.2005010006. [DOI] [PubMed] [Google Scholar]
- Shaw LM. PENN biomarker core of the Alzheimer’s Disease Neuroimaging Initiative. Neurosignals. 2008;16(1):19–23. doi: 10.1159/000109755. [DOI] [PMC free article] [PubMed] [Google Scholar]
- Smith AD, Smith SM, de Jager CA, Whitbread P, Johnston C, Agacinski G, Oulhaj A, Bradley KM, Jacoby R, Refsum H. Homocysteine-lowering by B vitamins slows the rate of accelerated brain atrophy in mild cognitive impairment: a randomized controlled trial. PLoS One. 5(9):e12244. doi: 10.1371/journal.pone.0012244. [DOI] [PMC free article] [PubMed] [Google Scholar]
- Stevens LA, Coresh J, Schmid CH, Feldman HI, Froissart M, Kusek J, Rossert J, Van Lente F, Bruce RD, III, Zhang YL. Estimating GFR using serum cystatin C alone and in combination with serum creatinine: a pooled analysis of 3,418 individuals with CKD. American Journal of Kidney Diseases. 2008;51(3):395–406. doi: 10.1053/j.ajkd.2007.11.018. [DOI] [PMC free article] [PubMed] [Google Scholar]
- Swedko PJ, Clark HD, Paramsothy K, Akbari A. Serum creatinine is an inadequate screening test for renal failure in elderly patients. Archives of internal medicine. 2003;163(3):356. doi: 10.1001/archinte.163.3.356. [DOI] [PubMed] [Google Scholar]
- Uhlig K, Levey AS. Developing Guidelines for Chronic Kidney Disease: We Should Include All of the Outcomes. Annals of internal medicine. 2012;156(8):599–601. doi: 10.7326/0003-4819-156-8-201204170-00009. [DOI] [PubMed] [Google Scholar]
- Wada M, Nagasawa H, Iseki C, Takahashi Y, Sato H, Arawaka S, Kawanami T, Kurita K, Daimon M, Kato T. Cerebral small vessel disease and chronic kidney disease (CKD): results of a cross-sectional study in community-based Japanese elderly. Journal of the neurological sciences. 2008;272(1):36–42. doi: 10.1016/j.jns.2008.04.029. [DOI] [PubMed] [Google Scholar]
- Wada M, Nagasawa H, Kawanami T, Kurita K, Daimon M, Kubota I, Kayama T, Kato T. Cystatin C as an index of cerebral small vessel disease: results of a cross-sectional study in community-based Japanese elderly. European Journal of Neurology. 2010;17(3):383–90. doi: 10.1111/j.1468-1331.2009.02809.x. [DOI] [PubMed] [Google Scholar]
- Yakushiji Y, Nanri Y, Hirotsu T, Nishihara M, Hara M, Nakajima J, Eriguchi M, Nishiyama M, Hara H, Node K. Marked cerebral atrophy is correlated with kidney dysfunction in nondisabled adults. Hypertension Research. 2010;33(12):1232–7. doi: 10.1038/hr.2010.171. [DOI] [PubMed] [Google Scholar]


