

Abstract
Background and Purpose
Voltage-gated sodium channels (VGSCs) are assembled from two classes of subunits, a pore-bearing α-subunit (NaV1) and one or two accessory β-subunits (NaVβs). Neurons in mammals can express one or more of seven isoforms of NaV1 and one or more of four isoforms of NaVβ. The peptide μ-conotoxins, like the guanidinium alkaloids tetrodotoxin (TTX) and saxitoxin (STX), inhibit VGSCs by blocking the pore in NaV1. Hitherto, the effects of NaVβ-subunit co-expression on the activity of these toxins have not been comprehensively assessed.
Experimental Approach
Four μ-conotoxins (μ-TIIIA, μ-PIIIA, μ-SmIIIA and μ-KIIIA), TTX and STX were tested against NaV1.1, 1.2, 1.6 or 1.7, each co-expressed in Xenopus laevis oocytes with one of NaVβ1, β2, β3 or β4 and, for NaV1.7, binary combinations of thereof.
Key Results
Co-expression of NaVβ-subunits modifies the block by μ-conotoxins: in general, NaVβ1 or β3 co-expression tended to increase kon (in the most extreme instance by ninefold), whereas NaVβ2 or β4 co-expression decreased kon (in the most extreme instance by 240-fold). In contrast, the block by TTX and STX was only minimally, if at all, affected by NaVβ-subunit co-expression. Tests of NaVβ1 : β2 chimeras co-expressed with NaV1.7 suggest that the extracellular portion of the NaVβ subunit is largely responsible for altering μ-conotoxin kinetics.
Conclusions and Implications
These results are the first indication that NaVβ subunit co-expression can markedly influence μ-conotoxin binding and, by extension, the outer vestibule of the pore of VGSCs. μ-Conotoxins could, in principle, be used to pharmacologically probe the NaVβ subunit composition of endogenously expressed VGSCs.
Keywords: μ-conotoxin KIIIA, μ-conotoxin PIIIA, μ-conotoxin SmIIIA, μ-conotoxin TIIIA, NaVβ-subunit, saxitoxin, site 1, tetrodotoxin, voltage-gated sodium channel, Xenopus oocytes
Introduction
Voltage-gated sodium channels (VGSCs), which are responsible for the upstroke of the action potential, consist of two classes of integral membrane glycoprotein subunits, large (260 kDa) α-subunits and smaller (30–40 kDa) β-subunits. These subunits assemble into complexes formed from a single α-subunit and one or two β-subunits. Mammals have nine isoforms of the α-subunit (NaV1.1 through 1.9) and four of the β-subunit (NaVβ1 through β4) (Catterall et al., 2005). The α-subunit, which comprises four homologous domains, each with six membrane-spanning segments, bears the essential features of a functioning VGSC; namely, a Na+-selective pore as well as voltage-sensors responsible for the gating of the channel in response to changes in membrane potential [for recent review see (Catterall, 2012)]. The β-subunit has a single membrane-spanning segment, with a large extracellular and small intracellular domain, and regulates the expression and trafficking of the α-subunit as well as modulates its voltage sensitivity (for recent reviews see Brackenbury and Isom, 2011; Chahine and O'leary, 2011). NaVβ2 and β4 are covalently linked to the α-subunit via a disulfide bond (Isom et al., 1995a; Yu et al., 2003), whereas NaVβ1 and β3 are non-covalently linked (Isom et al., 1992; Morgan et al., 2000). Multiple α-subunit paralogs have been found in all vertebrates examined (Lopreato et al., 2001; Widmark et al., 2011); and conserved orthologs of all four mammalian NaVβ isoforms are found in fish, frog and bird, with NaVβ1/β3 and NaVβ2/β4 sharing a common ancestry (Chopra et al., 2007).
Adult rat dorsal root ganglia (DRG) consist of a heterogeneous population of sensory neurons, where more than one NaV1 and NaVβ isoform can be expressed by a given neuron (see reviews by Dib-Hajj et al., 2010; Chahine and O'leary, 2011). Thus, a given neuron may express a multiplicity of different species of VGSCs, each composed of different combinations of NaV1 and NaVβ isoforms, and to untangle this mélange by pharmacological means presents a challenge. We are attempting to address this problem by using conotoxins that target VGSCs, of which there are four families: μ-, μO-, δ- and ι-conotoxins. Each family has a characteristic amino acid sequence framework and distinct mode of action: μ-conotoxins are pore blockers, whereas the other three families consist of gating modifiers (Terlau and Olivera, 2004; Fiedler et al., 2008; Lewis et al., 2012).
We recently reported that the action potentials in A and C fibres in rat sciatic nerve could be pharmacologically dissected with a panel of μ-conotoxins, whose NaV1 isoform selectivities were determined for NaV1.1 through 1.8 expressed in Xenopus laevis oocytes. We concluded that mainly NaV1.6 and NaV1.7 were the responsible for the propagation of action potentials in A and C fibres respectively (Wilson et al., 2011a). In the course of investigating the block by μ-conotoxins of TTX-sensitive sodium currents (TTX-s INa) of voltage-clamped, acutely dissociated rat dorsal root ganglion (DRG) neurons, we observed an inconsistency insofar as the kinetics of block by μ-SmIIIA of what we surmised were sodium currents mediated by NaV1.7 differed between large neurons and a subset of small neurons (Zhang et al., 2013). Thus, we were motivated to investigate whether association of NaV1.7 with different NaVβ subunits might account this discrepancy. In this report, we examined four TTX-sensitive NaV1 isoforms reported to be normally present in adult rat DRG neurons, NaV1.1, 1.2, 1.6 and 1.7 (Black 1996; 2004; Rush et al., 2007; Fukuoka et al., 2008), and compared how their co-expression with each of the four rat NaVβ subunits in X. laevis oocytes affected their block by three conotoxins, μ-TIIIA, μ-PIIIA and μ-SmIIIA, whose sequences are illustrated in Figure 1. These conotoxins had been previously tested against NaV1.1-1.8 (all from rat except NaV1.6, which was from mouse) expressed in oocytes without co-expression of any NaVβ subunit (Wilson et al., 2011a). In this report, all NaV1 subunits examined were from rat, including NaV1.6, whose sensitivity to μ-conotoxins, are reported here for the first time.
Figure 1.
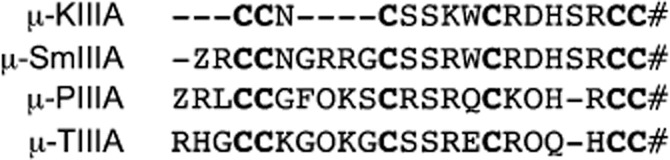
Amino acid sequences of the four μ-conopeptides used in this report. Sequences were aligned by their Cys residues, which are in bold. Z = pyroglutamine, O = hydroxyproline, # = amidated carboxyl terminal. References for sequences are as follows: μ-KIIIA (Bulaj et al., 2005); μ-PIIIA (Shon et al., 1998); μ-SmIIIA (West et al., 2002) and μ-TIIIA (Lewis et al., 2007).
Particular attention was devoted to NaV1.7 because this NaV1 isoform is implicated in the pathophysiology of inherited and acquired pain states, and antagonists of NaV1.7 could serve as analgesics (Dib-Hajj et al., 2009a; 2010). Only 2 of 11 μ-conotoxins recently examined blocked NaV1.7 with IC50 or Kd ≲ 1 μM: μ-SmIIIA and μ-KIIIA (Wilson et al., 2011a); thus, in addition to μ-SmIIIA, μ-KIIIA was also tested on NaV1.7 co-expressed with the various NaVβ subunits. The sequence of μ-KIIIA is also illustrated in Figure 1.
We show here that co-expression of NaVβ subunits does alter the affinities of μ-conotoxins. We believe this is the first demonstration that co-expression of NaVβ subunits can affect the binding of a toxin that blocks VGSCs by interacting with the extracellular vestibule of the pore of the channel; that is, neurotoxin receptor site 1 (Cestèle and Catterall, 2000). Tetrodotoxin (TTX) and saxitoxin (STX), which are guanidinium alkaloids, were originally used to define site 1 (Catterall, 1980); thus, we also examined these two alkaloids and report here that their activities were minimally, if at all, altered by NaVβ subunit co-expression. This is an interesting result to contemplate in view of our recent findings that the μ-conotoxin binding site appears to abut that of TTX and STX, but is situated more superficially in the vestibule (Zhang et al., 2009; 2010a).
Methods
Toxins
μ-Conotoxins were synthesized as previously described (Wilson et al., 2011a). TTX was purchased from Alomone Labs (Jerusalem, Israel) and STX from the National Research Council of Canada (Halifax, Nova Scotia, Canada).
Cloning of rat NaV1.6
Rat NaV1.6 DNA (GenBank accession #NM_019266.2), subcloned in pSGEM vector (which was derived from pGEMHE vector) (Liman et al., 1992), was synthesized by GenScript USA (Piscataway, NJ, USA). The DNA was amplified using the GenomiPhi V2 DNA amplification kit (GE Lifesciences, Pittsburgh, PA, USA). The amplified DNA was sequenced, digested with NheI and transcribed with T7 RNA polymerase (mMessage mMachine RNA transcription kit, Ambion, Life Technology, Grand Island, NY, USA).
The remaining clones, also from rat, were obtained as follows. NaV1.1, NaV1.2, NaVβ1 and NaVβ2 were provided by Prof Alan A Goldin; NaVβ3 and NaVβ4 by Prof Lori L Isom; and NaV1.7 by Prof Gail Mandel. The preparation of RNA from these was as previously described (Wilson et al., 2011a). The nomenclature of the channel subunits conforms to this journal's Guide to Receptors and Channels (Alexander et al., 2011).
Construction of NaVβ chimeras NaVβ112 and NaVβ211
We followed the lead of Zimmer and Benndorf (2002) in the construction and nomenclature of these chimeras; see also (McCormick et al., 1999). Both chimeras were made by PCR. To synthesize the NaVβ112 chimera (which consisted of the extracellular and transmembrane portions of NaVβ1 and intracellular portion of NaVβ2) and the NaVβ211 chimera (which consisted of the extracellular region of β2 and the transmembrane and intracellular portions of β1), primers were designed to PCR-amplify the desired area of one subunit, followed by a 15–20 bp overhang belonging to the other subunit (designating the chimera junction; see cartoon in Figure 4B). In a subsequent PCR, the two DNA pieces were allowed to hybridize first at the overhangs and then were amplified using primers at the 5′ and 3′ ends, used to introduce restriction sites NotI and XhoI respectively. The PCR product was gel-extracted and purified using Qiaquick PCR purification kit (Qiagen Sciences, Valencia, CA, USA). The chimeras were subcloned into the pSGEM oocyte expression vector (which contains the 5′ and 3′ Xenopus globin regions) using the NotI and XhoI restriction sites, transformed into DH10B competent cells and grown in ampicillin-containing LB; DNA was isolated using Qiaprep Spin mini prep kit (Qiagen Sciences). The DNA was linearized using NheI, and sense RNA was transcribed using T7 polymerase (mMessage mMachine RNA transcription kit, Ambion).
Figure 4.
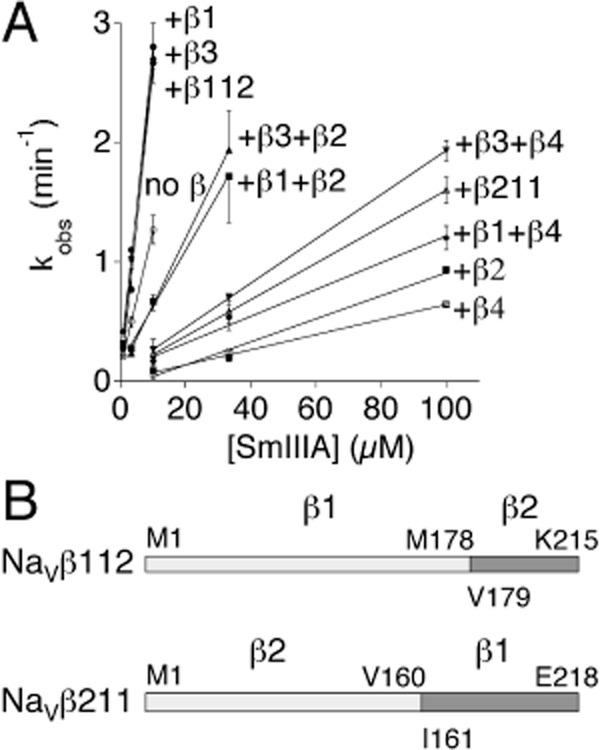
Peptide concentration dependency of the observed rate constants (kobs) for the block by μ-SmIIIA of NaV1.7 either alone, co-expressed with NaVβ1, β2, β3 or β4 (individually or in pairs) or co-expressed with the chimeras NaVβ112 or NaVβ211. Peak INa of voltage-clamped oocytes expressing NaV1.7 ± co-expression of indicated NaVβ subunit(s) were monitored as in Figure 3. (A) The three steepest curves, which essentially overlie each other, are those of NaVβ1, β3 and the β112 chimera. The remaining curves, in the order of decreasing slope, are those of NaV1.7 alone, +β3 + β2, +β1 + β2, +β3 + β4, +β211 chimera, +β1 + β4, +β2 and +β4. Slopes of curves such as these provided kon values in Table 2. (B) Cartoon of chimeras of NaVβ1 and NaVβ2 with amino acid residues at splice sites, as well as at N- and C-termini, indicated. Top, the NaVβ112 chimera consisted of the extracellular and transmembrane portions of NaVβ1 and the intracellular portion of NaVβ2. Bottom, the NaVβ211 chimera was formed from the extracellular portion of NaVβ2 and the transmembrane and intracellular portions of NaVβ1. cRNA encoding these chimeras were made as described in Methods.
Preparation and recording from X. laevis oocytes
Use of X. laevis frogs, which provided oocytes for this study, followed protocols approved by the University of Utah Institutional Animal Care and Use Committee that conform to the National Institutes of Health Guide for the Care and Use of Laboratory Animals. All studies involving animals are reported in accordance with the ARRIVE guidelines for reporting experiments involving animals (Kilkenny et al., 2010; McGrath et al., 2010).
Oocytes were prepared and voltage-clamped essentially as previously described (Zhang et al., 2010a; Wilson et al., 2011a). Briefly, a given oocyte was injected with 30–50 nl of cRNA in distilled water of one of the following rat NaV1 isoforms without or with an equal weight of rat NaVβ isoform cRNA (when two different NaVβ isoforms were involved, the weight of each was equal to that of the NaV1 isoform): NaV1.1, NaV1.2, NaV1.6 or NaV1.7 (3, 1.5, 30 or 15 ng, respectively) and incubated 1 to 6 days at 16°C in ND96 composed (in mM) of: NaCl (96), KCl (2), CaCl2 (1.8) MgCl2 (1) and HEPES (5), pH 7.5. The incubation medium also contained the antibiotics penicillin (100 units·mL−1), streptomycin (0.1 mg·mL−1), amikacin (0.1 mg·mL−1) and Septra (0.2 mg·mL−1). Oocytes in ND96 were two-electrode voltage-clamped using microelectrodes containing 3 M KCl (<0.5 MΩ) and clamped at a holding membrane potential of −80 mV unless indicated otherwise. Sodium channels were activated by stepping the potential to −10 mV for 50 ms every 20 s in all experiments, including toxin wash-in and washout. Current signals were filtered at 2 KHz, digitized at a sampling frequency of 10 KHz and leak-subtracted by a P/8 protocol using in-house software written in LabVIEW (National Instruments, Austin, TX, USA). All experiments were done at room temperature.
Application and washout of μ-conotoxins, TTX and STX
The oocyte-recording chamber was a 30 μL cylindrical well, 4 mm in diameter and ∼3 mm deep, fabricated from the silicone elastomer, Sylgard (Dow Corning, Midland, MI). Oocytes were exposed to toxin by applying 3 μL of toxin at 10 times its final concentration with a pipettor and manually stirring the bath for a few seconds by gently aspirating and expelling a few microlitres of the bath fluid several times with the pipettor (Wilson et al., 2011a). All toxin exposures were conducted in a static bath to conserve toxin. Toxins were washed out by continuous perfusion with ND96, at an initial rate of 1.5 mL·min−1 for 20 s, followed by a steady rate of 0.5 mL·min−1 (Zhang et al., 2009).
Data analysis
Conductance values were calculated with the formula gNa = INa/(Vstep − Vrev), where gNa is the conductance, INa is the peak current amplitude in response to the potential step, Vstep is the test potential and Vrev is the reversal potential estimated by extrapolation of the linear part of the I–V curve at positive Vstep values, which yielded Vrev values near 50 mV. Normalized activation and inactivation curves were fit to the Boltzmann equation of the form Y = 1/(1 + exp[(Vstep − V1/2)/k]), where Y is the normalized gNa or INa, Vstep is the test pulse (for activation curves, stepped in 5 mV increments) or the 500 ms conditioning prepulse (for inactivation curves, stepped in 10 mV increments and immediately preceded the test pulse to −10 mV), V1/2 is the voltage at half-maximal activation or inactivation and k is the slope factor. Fits of activation and inactivation curves to the Boltzman equation were obtained with Prism software (GraphPad Software Inc., San Diego, CA, USA).
Fitting of time course data to a single-exponential function was done with home-made software written with LabVIEW (e.g. to obtain rates of fast inactivation from the falling phases of current traces).
The interaction of toxin with channel was assumed to be that of simple bimolecular reaction whose kinetics are described by the following equation: kobs = kon[toxin] + koff, with kinetic constants determined as previously described (West et al., 2002). Briefly, the time course of peak INa was plotted before, during and after exposure to toxin. The rate constant for the recovery from block, koff, was determined by fitting the toxin-washout curve to a single-exponential function. However, when recovery from block was very slow (less than 50% recovery after 20 min), koff was estimated from the level of recovery observed after 20 min of washing and assuming recovery followed a single-exponential time course; these involved koff values <0.035·min−1 (Zhang et al., 2009; Wilson et al., 2011a). Values of koff are presented as the mean obtained with n ≥ 9 oocytes. Times longer than 20 min were not used to avoid error due to drift in baseline.
The onset of block was fit to a single-exponential function to yield the observed rate constant, kobs. Values of kobs were determined for at least three toxin concentrations (where each concentration was tested with at least three different oocytes) and plotted as a function of [toxin], the slope of the linear regression fit yielded kon. In principle, the Y-intercept of this plot should yield koff, but we chose to calculate koff directly from toxin-washout curves (see above) to avoid extrapolation errors. The dissociation constant, Kd, was calculated from the ratio koff/kon. In instances where the level of block achieved a steady state within the experimental time frame of ∼20 min, steady-state dose–response curves were fit to the equation: % block = 100% × (1/(1 + (IC50/[toxin]))), and IC50 values were obtained using either Prism software or KaleidaGraph (Synergy Software, Reading, PA). When a toxin blocked very poorly (i.e. less than half-block was achieved at the highest toxin concentration tested), Kd was estimated from the level of block (% block) achieved at the highest [toxin] tested by use of the Langmuir adsoption isotherm: % block = 100% × (1/(1 + (Kd/[toxin]))).
The tests of co-expression with each the four NaVβ subunits yielded a large set of kinetic data, which was condensed to Δk values as follows. The relative change in a kinetic rate constant (either kon or koff) induced by co-expression of a NaVβ subunit, Δk, was the ratio A × (k+/k–), where k+ and k– are the respective rates with and without NaVβ subunit co-expression, and A = 1 or −1 when NaVβ subunit co-expression increased k or decreased k respectively. Thus, a positive Δk indicates the factor by which NaVβ subunit co-expression increased the rate constant, and a negative Δk indicates the factor by which NaVβ subunit co-expression decreased the rate constant.
Data are represented as mean ± SE. Statistical comparisons were performed by two-tailed unpaired t-tests, except for kon values, where analysis of covariance was performed with Prism software.
Results
All VGSCs examined in this report were those exogenously expressed in oocytes. The intrinsic biophysical properties of α-subunits are altered by co-expression with the various NaVβ subunits, and we will first consider this aspect of NaVβ subunit co-expression before presenting results regarding the influence NaVβ subunit co-expression exerted on the pharmacological properties of VGSCs.
NaVβ subunits and the biophysical properties of sodium currents in oocytes exogenously expressing NaV1.7
Rat NaVβ1 through β4 were individually co-expressed with rat NaV1.7 in oocytes, which were two-electrode voltage clamped to measure voltage-gated sodium currents (INa) as described in Methods. Figure 2A shows representative current traces, and the effects of NaVβ subunit co-expression on the voltage dependence of activation and inactivation are plotted in Figure 2B. The biophysical parameters are quantified in Table 1, which shows that at least two of the five parameters were significantly changed by co-expression of each of NaVβ2 and β4, whereas all five parameters were significantly changed by co-expression of each of NaVβ1 and β3. The effects of the latter largely mirrored each other; that is, both NaVβ1 and β3 co-expression decreased the time constant of fast inactivation three- to fourfold and shifted the V1/2 of activation and inactivation by about −10 and −5 mV respectively (Table 1). The effects of co-expression of NaVβ1 with NaV1.7 in our hands are qualitatively consistent with those reported by Chahine's laboratory (Vijayaragavan et al., 2001). Effects of co-expression of the NaVβ subunits, particularly the increase in the rate of fast inactivation by NaVβ1 and β3, but not by NaVβ2 and β4, were also evident with the other three α-subunits, NaV1.1, 1.2 and 1.6, examined in this report (see Supporting Information Table S1).
Figure 2.
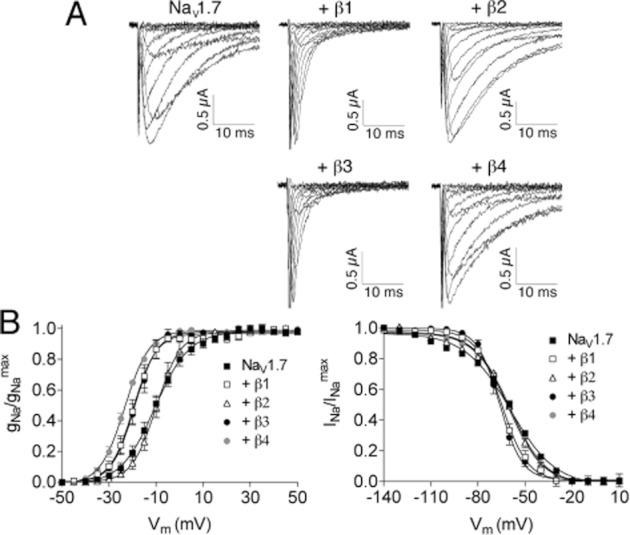
Sodium current traces and activation and inactivation curves of NaV1.7 without and with co-expression of NaVβ1, β2, β3 or β4. X. laevis oocytes were voltage clamped as described in Methods. (A) Representative sodium current traces in response to activation steps, between −50 and 50 mV in 5 mV increments, from a holding potential of −80 mV. (B) activation curves (left, where Vm represents the Vstep of the test pulse) and inactivation curves (right, where Vm represents the Vstep of the conditioning prepulse) acquired and plotted as described in Methods. Data points represent mean ± SE, with n ≥ 6 oocytes. Solid curves are fits of the data to the Boltzmann equation (see Methods), parameters of which are presented in Table 1.
Table 1.
Activation and inactivation parameters and time constants of fast inactivation of NaV1.7 without and with NaVβ-subunit co-expression
| Activationa | Inactivationb | Inactivationc | |||
|---|---|---|---|---|---|
| NaV1.7 | V1/2 (mV) | k (mV) | V1/2 (mV) | k (mV) | τ (ms) |
| Alone | −10.5 ± 0.3 | 7.2 ± 0.3 | −59.4 ± 1.1 | −14.4 ± 1.0 | 6.1 ± 0.6 |
| +β1 | −20.0 ± 0.3* | 4.8 ± 0.3* | −64.7 ± 0.4* | −8.2 ± 0.3* | 2.1 ± 0.2* |
| +β2 | −9.9 ± 0.3 | 5.2 ± 0.2* | −60.2 ± 0.9 | −10.9 ± 0.8* | 6.0 ± 0.3 |
| +β3 | −19.1 ± 0.2* | 4.8 ± 0.2* | −66.1 ± 0.4* | −7.2 ± 0.4* | 1.5 ± 0.2* |
| +β4 | −23.2 ± 0.2* | 5.3 ± 0.2* | −59.5 ± 0.6 | −11.1 ± 0.5* | 6.2 ± 0.3 |
NaVβ subunit co-expression alters the kinetics of block by μ-conotoxins
The effects of co-expression of NaVβ1, β2, β3 or β4 on the block of NaV1.7 by μ-SmIIIA are illustrated in Figures 3 and 4. Representative sodium current (INa) traces are shown in Figure 3A, and representative time courses of block and recovery of from block of peak INa are shown in Figure 3B and C respectively. Co-expression of NaVβ1 and β3 clearly accelerated the block of NaV1.7 by μ-SmIIIA, whereas co-expression of NaVβ2 and β4 decelerated the block (Figure 3B). Co-expression of NaVβ2 and β4 decreased the rate of dissociation of μ-SmIIIA from NaV1.7, while co-expression of NaVβ1 and β3 had minimal effects (Figure 3C).
Figure 3.
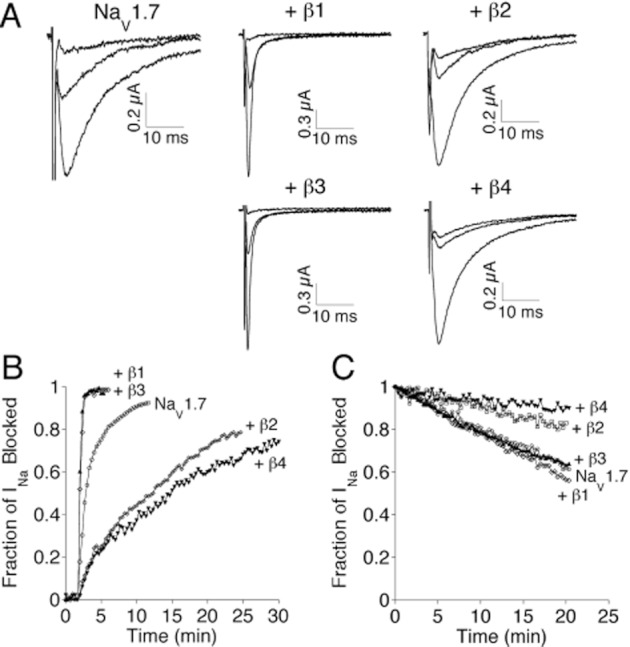
Effects of co-expression of NaVβ1, β2, β3, or β4 on the kinetics of block of NaV1.7 by 10 μM μ-SmIIIA. INa of voltage-clamped oocytes expressing NaV1.7 ± NaVβ co-expression was measured as described in Methods. Representative INa traces (A), time course of block upon exposure to peptide (B) and time course of recovery following peptide washout (C). In panel A, each set of three traces is from a different oocyte: the largest trace represents the control response obtained before exposure to peptide; the smallest trace corresponds to the last response obtained in the presence of peptide in panel B; and the middle trace is the last response obtained during peptide washout in panel C. Each curve in panels B and C is from a different oocyte, where a given symbol represents the co-expression with the same NaVβ-subunit in both panels B and C. The observed rate constant of block (kobs) was obtained by fitting curves, such as those in panel B, each to a single exponential; the slope of the plot of kobs as a function of peptide concentration (see Figure 4A) yielded the on rate constant, kon. Values of koff were obtained by measuring the level of recovery at the end of a 20 min wash (e.g. panel C) and assuming recovery followed a single-exponential time course (or, when >50% recovery was achieved within 20 min, by actually fitting the washout curve to a single exponential, see Methods); resulting koff values are provided in Table 2.
On-rate constants, kon, were obtained from plots such as those in Figure 3B by fitting the onset of block to a single-exponential function to obtain the observed rate constant, kobs. Plots of kobs versus toxin concentration yielded linear curves (Figure 4A), the slopes of which provided kon values (see Methods) that are listed in Table 2.
Table 2.
Influence of the co-expression of rat NaVβ1, β2, β3 or β4 on the of block of rat NaV1.1, 1.2, 1.6 or 1.7 by μ-TIIIA, μ-PIIIA or μ-SmIIIAa
| μ-SmIIIA | μ-PIIIA | μ-TIIIA | |||||||
|---|---|---|---|---|---|---|---|---|---|
| kon (μM·min)−1 | koff (min−1) | Kd (μM) | kon (μM·min)−1 | koff (min−1) | Kd or IC50b (μM) | kon (μM·min)−1 | koff (min−1) | Kd or IC50b (μM) | |
| NaV1.1 | 2.4 ± 0.1 | 0.009 ± 0.001 | 0.0038 ± 0.0004 | 1.0 ± 0.1 | 0.053 ± 0.003 | 0.053 ± 0.004 | 0.39 ± 0.03 | 1.10 ± 0.22 | 0.90 ± 0.08b |
| +β1 | 7.1 ± 1.3 | 0.017 ± 0.003 | 0.0024 ± 0.0006 | 6.1 ± 0.8 | 0.084 ± 0.006 | 0.014 ± 0.002 | 0.49 ± 0.04 | 0.78 ± 0.14 | 0.71 ± 0.07b |
| +β2 | 0.030 ± 0.002 | 0.0024 ± 0.0003 | 0.07 ± 0.01 | 0.044 ± 0.002 | 0.006 ± 0.001 | 0.14 ± 0.02 | 0.35 ± 0.03 | 1.01 ± 0.08 | 1.7 ± 0.1b |
| +β3 | 4.4 ± 0.5 | 0.010 ± 0.001 | 0.0023 ± 0.0003 | 5.20 ± 0.47 | 0.09 ± 0.01 | 0.017 ± 0.003 | 1.96 ± 0.06 | 0.84 ± 0.09 | 0.48 ± 0.05b |
| +β4 | 0.010 ± 0.002 | 0.0027 ± 0.0006 | 0.30 ± 0.08 | 0.019 ± 0.002 | 0.007 ± 0.002 | 0.37 ± 0.11 | 0.14 ± 0.04 | 0.47 ± 0.05 | 1.66 ± 0.16b |
| NaV1.2 | 1.5 ± 0.1 | 0.0017 ± 0.0004 | 0.0013 ± 0.0003 | 0.48 ± 0.04 | 0.24 ± 0.02 | 0.62 ± 0.04b | 0.44 ± 0.02 | 0.020 ± 0.002 | 0.045 ± 0.005 |
| +β1 | 3.5 ± 0.4 | 0.0028 ± 0.0007 | 0.0009 ± 0.0002 | 1.82 ± 0.28 | 0.16 ± 0.01 | 0.24 ± 0.03b | 0.41 ± 0.07 | 0.016 ± 0.002 | 0.039 ± 0.008 |
| +β2 | 0.61 ± 0.06 | 0.0016 ± 0.0002 | 0.0030 ± 0.0005 | 0.21 ± 0.02 | 0.14 ± 0.02 | 0.65 ± 0.05b | 0.49 ± 0.018 | 0.027 ± 0.003 | 0.055 ± 0.006 |
| +β3 | 3.2 ± 0.2 | 0.0025 ± 0.001 | 0.0009 ± 0.0003 | 1.1 ± 0.3 | 0.20 ± 0.03 | 0.22 ± 0.02b | 0.68 ± 0.05 | 0.009 ± 0.001 | 0.015 ± 0.002 |
| +β4 | 0.40 ± 0.04 | 0.0030 ± 0.0001 | 0.0075 ± 0.0008 | 0.17 ± 0.03 | 0.14 ± 0.01 | 1.10 ± 0.05b | 0.21 ± 0.014 | 0.014 ± 0.002 | 0.067 ± 0.010 |
| NaV1.6c | 1.70 ± 0.18 | 0.12 ± 0.02 | 0.069 ± 0.013 | 0.82 ± 0.29 | 0.067 ± 0.012 | 0.081 ± 0.032 | |||
| +β1 | 2.38 ± 0.05 | 0.11 ± 0.01 | 0.046 ± 0.003 | 7.77 ± 0.45 | 0.039 ± 0.006 | 0.005 ± 0.001 | |||
| +β2 | 0.05 ± 0.00 | 0.035 ± 0.003 | 0.75 ± 0.06 | 0.19 ± 0.04 | 0.046 ± 0.006 | 0.243 ± 0.058 | |||
| +β3 | 1.87 ± 0.34 | 0.11 ± 0.01 | 0.059 ± 0.013 | 6.59 ± 0.47 | 0.062 ± 0.010 | 0.009 ± 0.002 | |||
| +β4 | 0.030 ± 0.007 | 0.014 ± 0.003 | 0.40 ± 0.12 | 0.18 ± 0.02 | 0.168 ± 0.015 | 0.951 ± 0.151 | |||
| NaV1.7d | 0.12 ± 0.01 | 0.031 ± 0.005 | 0.26 ± 0.05 | ||||||
| +β1 | 0.27 ± 0.05 | 0.034 ± 0.002 | 0.13 ± 0.02 | ||||||
| +β2 | 0.010 ± 0.001 | 0.015 ± 0.002 | 1.50 ± 0.22 | ||||||
| +β3 | 0.252 ± 0.017 | 0.027 ± 0.001 | 0.11 ± 0.01 | ||||||
| +β4 | 0.0063 ± 0.0002 | 0.0067 ± 0.0004 | 1.17 ± 0.08 | ||||||
| +β112 | 0.27 ± 0.02 | 0.027 ± 0.002 | 0.10 ± 0.01 | ||||||
| +β211 | 0.015 ± 0.001 | 0.018 ± 0.003 | 1.20 ± 0.22 | ||||||
| +β1+β2 | 0.047 ± 0.010 | 0.018 ± 0.003 | 0.38 ± 0.10 | ||||||
| +β1+β4 | 0.011 ± 0.001 | 0.0056 ± 0.0004 | 0.55 ± 0.08 | ||||||
| +β3+β2 | 0.056 ± 0.008 | 0.011 ± 0.001 | 0.20 ± 0.03 | ||||||
| +β3+β4 | 0.018 ± 0.001 | 0.0064 ± 0.0004 | 0.35 ± 0.03 | ||||||
Values are mean ± SE (n ≥ 9 oocytes) and were obtained as described in Methods (see also Figure 3); values for NaV1.1, 1.2 and 1.7, all without NaVβ-subunit co-expression, are from (Wilson et al., 2011a).
Value is Kd, but if it has a superscript ‘b’, then it is IC50 (see Methods).
NaV1.6, regardless of NaVβ-subunit co-expression, was poorly blocked by μ-TIIIA – at 100 μM, the highest concentration tested, ≲ 30% block was observed in all cases, from which a minimum Kd >200 μM was estimated (see Methods); furthermore, the kobs and koff were too large (>2·min−1) to accurately measure, so corresponding area in table is greyed out.
NaV1.7, regardless of NaVβ-subunit co-expressed, was essentially insensitive to μ-PIIIA and μ-TIIIA – at 30 μM, the highest concentration tested, each peptide blocked less than 5%, which indicates a minimum Kd > 570 μM, so corresponding areas are greyed out. Plots of kobs versus [μ-conotoxin], the slopes of which provided kon values listed here, are illustrated in Figure 4A and Supporting Information Figure S1.
Experiments such as those described in Figures 3 and 4 were also performed for NaV1.1, 1.2, 1.6 and 1.7 with μ-conotoxins TIIIA, μ-PIIIA as well as μ-SmIIIA. These results are summarized in Table 2. Note that all three toxins blocked NaV1.1 and 1.2, while NaV1.6 was blocked by μ-SmIIIA and μ-PIIIA but hardly at all by μ-TIIIA; finally, NaV1.7 was blocked only by μ-SmIIIA. The estimated lower-limit Kd values of the impotent blockers are given in the footnotes of Table 2.
A conotoxin that blocks NaV1.7 much like μ-SmIIIA (but more slowly) is μ-KIIIA (Wilson et al., 2011a), so this conopeptide's block of NaV1.7 was also examined for reasons mentioned in the Introduction, and the results are in Table 3.
Table 3.
Influence of the co-expression of NaVβ1, β2, β3 or β4 on the kinetics of block of NaV1.7 by μ-conotoxin KIIIIAa
| kon (μM·min)−1 | koff (min−1) | Kd (μM) | |
|---|---|---|---|
| NaV1.7 | 0.024 ± 0.002 | 0.007 ± 0.001 | 0.292 ± 0.052 |
| +β1 | 0.041 ± 0.001* | 0.010 ± 0.001* | 0.244 ± 0.025 |
| +β2 | 0.0053 ± 0.0007* | 0.0073 ± 0.0011 | 1.38 ± 0.03 |
| +β3 | 0.031 ± 0.004 | 0.013 ± 0.001* | 0.42 ± 0.06 |
| +β4 | 0.0030 ± 0.0002* | 0.0027 ± 0.0007* | 0.93 ± 0.24 |
Values are mean ± SE (n ≥ 9 oocytes). Values for NaV1.7 without any NaVβ-subunit co-expression are from Wilson et al., (2011a).
Statistically different than NaV1.7 without NaVβ-subunit co-expression (P < 0.05). Plots of kobs versus [μ-KIIIA], the slopes of which yielded the kon values listed here, are shown in the lower-right corner of Supporting Information Figure S1.
Co-expression of two chimeras, NaVβ112 and NaVβ211, constructed from different parts of NaVβ1 and NaVβ2, and their effects on μ-SmIIIA's block of NaV1.7
These NaVβ chimera experiments followed the footsteps of others (e.g. Makita et al., 1996; Zimmer and Benndorf, 2002). To determine which portions of the NaVβ subunit (i.e. extracellular, intracellular or transmembrane) were responsible for the subunit's effects, two chimeras of NaVβ1 and β2 were constructed and tested: the NaVβ112 chimera consisted of NaVβ1 with its intracellular portion replaced by that of NaVβ2, while the NaVβ211 chimera consisted of NaVβ1 with its extracellular portion replaced by that of NaVβ2 (see Figure 4B). Plotted in Figure 4A are data displaying the consequences of the co-expression of the two chimeras on the susceptibility of NaV1.7 to μ-SmIIIA; the curve representing NaVβ112 lies essentially superimposed on those of NaVβ1 and β3, while the NaVβ211 curve lies near that of NaVβ2. The quantified kinetic constants are presented near the bottom of Table 2, which shows that the kon and koff values with NaVβ112 co-expression are close to the corresponding rate constants with NaVβ1 co-expression; likewise, each rate constant with NaVβ211 co-expression is close to that corresponding to NaVβ2 co-expression. These results suggest that the extracellular portion of the NaVβ subunit is largely responsible for the β-subunit's ability to modulate the susceptibility of NaV1.7 to μ-SmIIIA.
Binary combinations of NaVβ subunits co-expressed with NaV1.7: effects on μ-SmIIIA's kinetics
Thus far, we've only considered unary co-expression of NaVβ subunits; however, an α-subunit can associate with a binary combination of NaVβ subunits [e.g. β1 and β2 (Hartshorne and Catterall, 1984), or one non-covalently (β1 or β3) and one covalently (β2 or β4) (Patino and Isom, 2010)] to form a ternary complex. We co-expressed NaVβ subunits in four binary combinations of NaVβ subunits (+β1+β2, +β1+β4, +β3+β2 and +β3+β4) with NaV1.7, and the block by μ-SmIIIA of each combination was assessed. The unary kon value of a given β-subunit of a combination differed from that of its partner by at least an order of magnitude (Table 2); nevertheless, the observed rate of block by μ-SmIIIA of the INa of oocytes expressing each of the four combinations could be fit by single-exponential functions (not shown), suggesting that in each case a relatively homogeneous population of channels was being expressed. This, in turn, suggests that essentially all the functional channels expressed by given oocyte were likely a ternary complex possessing the same pair of NaVβ subunits. The constants for the block of these channels by μ-SmIIIA are presented near the bottom of Table 2 (see also Figure 4A).
Effects of NaVβ-subunit co-expression on TTX and STX block of NaV1.1 and 1.7
In view of the relatively large decreases in kon produced by co-expression of NaVβ2 and β4 with NaV1.1 and 1.7 (Table 2) (ranging from >5-fold to 240-fold for at least two μ-conopeptides; see Figure 5 below), we examined whether the block of NaV1.1 and 1.7 by TTX and STX was also affected by NaVβ subunit co-expression. The results are presented in Table 4 and summarized as follows. (i) The kon values of TTX for both NaV1.1 and 1.7 were essentially the same. (ii) The koff of TTX for NaV1.1 was about twice that for NaV1.7 and presumably accounts for the twofold difference in the IC50 values of TTX for these two NaV1 isoforms. (iii) The koff values of STX for NaV1.1 and 1.7 were essentially the same. (iv) The kon of STX for NaV1.1 was larger than that for NaV1.7 and presumably largely accounts for the difference in the IC50 values of STX for the two NaV1 isoforms. (v) Overall, NaVβ subunit co-expression had no statistically significant effect on the binding properties of TTX and STX, except: (i) NaVβ3 co-expression slightly elevated the kon of TTX for NaV1.1 (kon was altered by a factor of 1.25); and (ii) NaVβ2 co-expression slightly reduced the kon of TTX for NaV1.7 (kon was altered by a factor of 0.8). Thus, unlike the binding of μ-conotoxins, the binding of STX and TTX to the channel's pore was only minimally affected by co-expression of the channel with NaVβ subunits.
Figure 5.
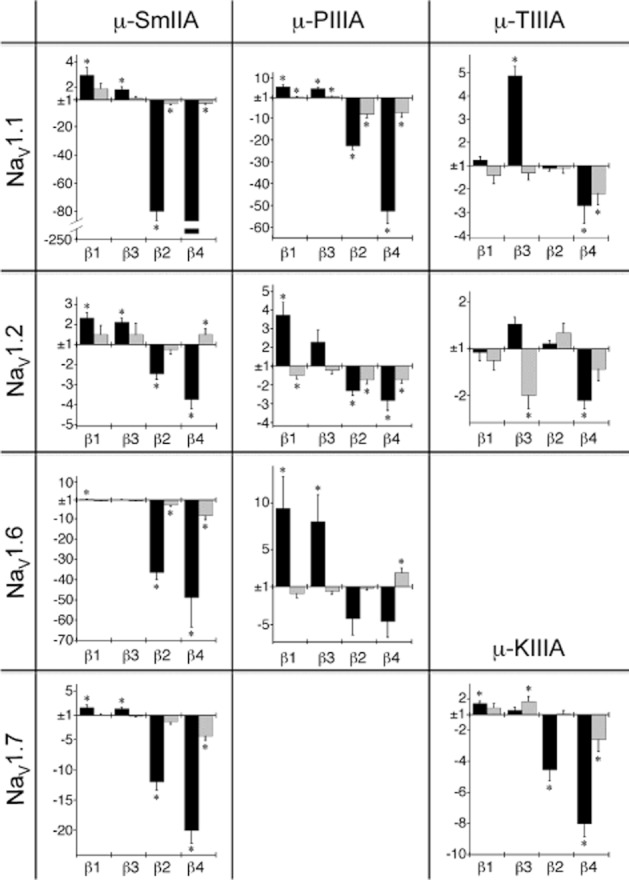
Matrix of plots summarizing the changes in rate constant (Δk) of block by μ-SmIIIA, μ-PIIIA or μ-TIIIA of NaV1.1, 1.2, 1.6 or 1.7 induced by co-expression with NaVβ1, β3, β2 or β4. μ-PIIIA and μ-TIIIA don't block NaV1.7, and μ-TIIIA blocks NaV1.6 very poorly, so no results are shown for those combinations; instead, lower right corner shows results for the block by μ-KIIIA of NaV1.7. Bars represent values of Δkon or Δkoff (mean ± SE). The Y-axis shows the Δk value, where, as described in Methods, an upward (positive-going) bar indicates the factor by which NaVβ co-expression increased k, and a downward (negative-going) bar indicates the factor by which NaVβ co-expression decreased k. Note, the scale for both directions is the same in a given plot except the first (where the downward bars are shown with a relatively compressed Y-axis scale and a break in the plot was necessary to accommodate the very large decrease in kon induced by NaVβ4 co-expression (240 ± 49.5, statistically different from NaV1.1 expressed alone, P < 0.0001). Values of kon and koff in Tables 2 and 3 were used to calculate Δk values in these plots. *Statistically different from α-subunit expressed alone (P < 0.05).
Table 4.
Influence of co-expression of NaVβ1, β2, β3 or β4 on the block of NaV1.1 and NaV1.7 by TTX or STXa
| TTX | STX | |||||
|---|---|---|---|---|---|---|
| kon (μM·min)−1 | koff (min−1) | IC50 (nM) | kon (μM·min)−1 | koff (min−1) | IC50 (nM) | |
| NaV1.1 | 49.7 ± 4.2 | 1.17 ± 0.06 | 13.7 ± 0.6 | 351.7 ± 27.2 | 1.50 ± 0.07 | 2.11 ± 0.06 |
| NaV1.1+β1 | 55.1 ± 7.1 | 1.18 ± 0.09 | 13.7 ± 0.6 | 358.1 ± 22.1 | 1.39 ± 0.05 | 2.10 ± 0.06 |
| NaV1.1+β2 | 49.1 ± 7.1 | 1.40 ± 0.08 | 13.1 ± 0.5 | 372.0 ± 21.0 | 1.38 ± 0.07 | 2.2 ± 0.1 |
| NaV1.1+β3 | 62.1 ± 1.3* | 1.42 ± 0.05 | 14.0 ± 0.4 | 320.5 ± 19.2 | 1.40 ± 0.02 | 2.26 ± 0.05 |
| NaV1.1+β4 | 53.5 ± 9.6 | 1.42 ± 0.13 | 13.4 ± 0.4 | 433.9 ± 53.5 | 1.38 ± 0.05 | 1.99 ± 0.08 |
| NaV1.7 | 49.6 ± 3.7 | 0.46 ± 0.04 | 7.5 ± 0.4 | 266.8 ± 33.4 | 1.66 ± 0.18 | 5.1 ± 0.4 |
| NaV1.7+β1 | 56.6 ± 1.1 | 0.46 ± 0.04 | 6.3 ± 0.4 | 251.0 ± 21.5 | 1.51 ± 0.07 | 5.2 ± 0.2 |
| NaV1.7+β2 | 40.0 ± 1.3* | 0.38 ± 0.02 | 7.0 ± 0.3 | 206.3 ± 9.8 | 1.42 ± 0.05 | 4.3 ± 0.2 |
| NaV1.7+β3 | 47.5 ± 1.0 | 0.42 ± 0.02 | 6.8 ± 0.3 | 236.1 ± 25.7 | 1.47 ± 0.03 | 5.1 ± 0.3 |
| NaV1.7+β4 | 42.8 ± 2.3 | 0.44 ± 0.03 | 7.0 ± 0.4 | 241.9 ± 40.4 | 1.38 ± 0.06 | 4.5 ± 0.3 |
Values are mean ± SE (n ≥ 9 oocytes).
Statistically different than corresponding NaV1-subunit expressed without any NaVβ-subunit (P < 0.03). Sample current traces of the block by 10 μM TTX, as well as sample time courses for the bock by10 μM TTX and its washout, are illustrated in Supporting Information Figure S2.
Discussion and conclusions
This report reveals a new way to functionally characterized the interaction of β- with α-subunits of VGSCs. Previously, such interactions were assessed almost exclusively by analyzing how NaVβ subunit co-expression modulated the gating of the channel (i.e. the biophysical characteristics and parameters such those as illustrated in Figure 2 and listed Table 1). The ensuing figures and tables in this report clearly demonstrate that β-subunit co-expression in oocytes can alter an α-subunit's susceptibility to μ-conotoxins, but much less so to TTX or STX. We discuss our results here under two headings: (i) consequences of NaVβ subunit co-expression on the μ-conotoxin susceptibility of VGSCs and (ii) prospects of using μ-conotoxins to identify the NaVβ subunit composition of endogenously expressed VGSCs.
(i) Consequences of NaVβ subunit co-expression on a channel's interaction with μ-conotoxin
To help distill the large amount of kinetic data presented in Tables 2 and 3, the changes induced by NaVβ subunit co-expression on the value of a kinetic constant, Δk, are plotted in Figure 5. The derivation of Δk is given in Methods and outlined in the legend to Figure 5. Thus, Figure 5 represents a matrix of plots summarizing the changes induced by co-expression of each of the four NaVβ subunits on the kinetics of block of the various NaV1 isoforms by the four μ-conotoxins. For the most part, kon was modestly increased by co-expression of β1 or β3 (e.g. <3-fold with μ-SmIIIA on all NaV1 isoforms; maximum was ∼9-fold, which was achieved with μ-PIIIA on NaV1.6). In contrast, kon could be markedly decreased by co-expression of β2 or β4 (minimally twofold in most instances and >10-fold in four instances: NaV1.1 with μ-SmIIIA and μ-PIIIA, and both NaV1.6 and 1.7 with μ-SmIIIA). Alterations in koff were mostly modest (≲4-fold in most instances with the exception of an ∼8-fold decrease observed in three instances: μ-PIIIA on NaV1.1 with NaVβ2 or β4 and μ-SmIIIA on NaV1.6 with NaVβ4).
Thus, Figure 5 shows two robust effects were observed for the most part; namely, NaVβ1 and β3 co-expression increased kon, and NaVβ2 and β4 co-expression decreased kon, the latter quite strikingly in several instances.
Note that each of the four NaV1 isoforms examined was susceptible to at least two of the tested μ-conotoxins. Only a minority of the μ-conotoxins discovered thus far are able to block NaV1.7 (Wilson et al., 2011a); and tests with μ-KIIIA, in addition to those with μ-SmIIIA, show that the aforementioned generalizations regarding NaVβ subunit co-expression apply to NaV1.7. Of note is that μ-KIIIA has only 16 amino acid residues, six fewer than the other μ-conopeptides examined in this report (Figure 1); and additional tests with KIIIA and its synthetic derivatives (e.g. Zhang et al., 2010b) could reveal what factors, such as steric ones, play a role in the modulatory effect of NaVβ subunit co-expression on μ-conotoxin activity.
Binary co-expression of NaVβ subunits
The block by μ-SmIIIA of NaV1.7 was also examined in the context of binary co-expression of NaVβ subunits. Table 5 recasts the binary co-expression data in Table 2 under the assumption that in a ternary VGSC complex (comprised of one α-subunit and two β-subunits), one of the β-subunits is either NaVβ1 or β3, and the other either NaVβ2 or β4. The Δk values for unary NaVβ co-expression relative to NaV1.7 alone are shown in the first row of each triplet of rows in Table 5; note that these data are also plotted in the lower left graph in Figure 5. The Δk values for binary relative to unary co-expression are in the remaining rows of Table 5. Note that within each triplet of rows, the respective Δk values are similar (i.e. within about a factor of three of each other). It would appear that the relative changes induced by a given β-subunit's co-expression on kon (a decrease in the case of β2 and β4, and an increase in the case of β1 and β3) and on koff (a decrease in the case of β2 and β4, and minimal change in the case of β1 and β3) are not markedly disturbed by the co-expression of an additional β-subunit.
Table 5.
Block of NaV1.7 by μSmIIIA: Effects of co-expression of binary combinations of NaVβ-subunits relative to unary (or no) co-expression of NaVβ-subunitsa
| β-subunit(s) co-expressedb | Reference NaV1.7c | Δkond | Δkoffd |
|---|---|---|---|
| +β2 | alone | −12.0 ± 1.4 | −2.1 ± 0.4 |
| +β2+β1 | +β1 | −5.7 ± 1.6 | −1.9 ± 0.3 |
| +β2+β3 | +β3 | −4.5 ± 0.7 | −2.5 ± 0.3 |
| +β4 | alone | −20.0 ± 2.1 | −4.4 ± 0.8 |
| +β4+β1 | +β1 | −24.5 ± 5.1 | −5.7 ± 0.5 |
| +β4+β3 | +β3 | −13.9 ± 1.2 | −4.5 ± 0.4 |
| +β1 | alone | 2.3 ± 0.5 | 1.1 ± 0.2 |
| +β1+β2 | +β2 | 4.7 ± 1.0 | 1.2 ± 0.3 |
| +β1+β4 | +β4 | 1.8 ± 0.2 | −1.2 ± 0.1 |
| +β3 | alone | 2.1 ± 0.3 | −1.1 ± 0.2 |
| +β3+β2 | +β2 | 5.6 ± 0.9 | −1.4 ± 0.2 |
| +β3+β4 | +β4 | 3.0 ± 0.2 | −1.2 ± 0.1 |
Original data are in Table 2.
Terminology as in first column of Table 2 for NaV1.7.
Channel used as reference to calculate Δk values; e.g. Δk values with ‘alone’ as reference correspond to those of NaV1.7 alone (first row in each triplet of rows), which are also plotted in lower-left graph in Figure 5.
Magnitude and polarity of a value were obtained as described in Methods (and Figure 5 legend) except for cases with binary β-subunit co-expression, where the reference was NaV1.7 co-expressed with the β-subunit indicated in second column.
NaVβ1 : β2 chimeras
The β112 and β211chimeras behaved much like NaVβ1 and NaVβ2, respectively (Table 2), consistent with the extracellular domain of the molecule being the major factor contributing to its phenotype. This is reminiscent of NaVβ1's modulation of the gating kinetics of NaV1.2 and 1.4, where the extracellular domain of the NaVβ1 subunit was found to contain the determinant site (Chen and Cannon, 1995; Makita et al., 1996; McCormick et al., 1999; Zimmer and Benndorf, 2002).
Block by TTX and STX
The results in Table 4 clearly show that, unlike the binding of μ-conotoxins, the binding of STX and TTX to the channel's pore seems largely immune to co-expression of the channel with NaVβ-subunits. Likewise, in our previous experiments, the block of NaV1.8 by STX was only minimally affected by co-expression of any of the four NaVβ subunits – the only significant effects were modest decreases in koff induced by co-expression of NaVβ1 and β4 (koff reduced by 30% and 40% respectively) (Wilson et al., 2011b). These results are consistent with biochemical experiments involving tritiated-STX binding to NaV1.2 expressed in Chinese hamster cell lines, which showed that the Kd for STX was not affected by co-expression of NaVβ1 (Isom et al., 1995b).
Our recent work showed that TTX/STX can co-occupy site 1 with (at least some) μ-conopeptides and suggested that site 1 might be considered a macrosite (Olivera et al., 1991) consisting of two abutting microsites, one very close to the ion-selectivity filter and accessible to TTX or STX (say, ‘site 1a’) and the other a more superficial site occupiable by μ-conopeptide (say, ‘site 1b’) (Zhang et al., 2009; 2010a, b). Thus, with regard to our present results, it appears that the ‘reach’ of NaVβ-subunit co-expression extends to site 1b, but not to site 1a.
Site 1 is in the pore loops (or S5–S6 linkers) of the α-subunit (Cestèle and Catterall, 2000), and NaVβ1 is close to these loops insofar as the pore loops of the first and fourth domains of the α-subunit contain important determinants that allow β1 to modulate the gating of the α-subunit (Makita et al., 1996; Catterall, 2000). Our results suggest that the other NaVβ subunits may likewise be close to site 1(b).
Other considerations
It should be noted that although it is clear that co-expression of NaVβ subunits with the various NaV1 isoforms perturbed the block of VGSCs by μ-conotoxins, we cannot conclude unequivocally that the association of the β- with the α-subunit in the plasma membrane per se was responsible for the perturbation. Other possibilities exist; for example, the β-subunit could influence posttranslational modifications, such as glycosylation, of the α-subunit during its synthesis.
Regarding glycosylation of NaVβ-subunits themselves, mutation of N-linked glycosylation sites (for sialic acids) of NaVβ1 and β2 affect their ability, to varying degrees, to modulate the gating of α-subunits (such as NaV1.2, 1.4, 1.5, and 1.7) expressed in CHO cell lines (Johnson et al., 2004; Johnson and Bennett, 2006). It would be interesting to examine whether NaVβ-subunit glycosylation plays a role in the β-subunit's ability to modulate μ-conotoxin binding.
(ii) Prospects of using μ-conotoxins to identify the NaVβ subunit composition of endogenously expressed VGSCs
An important point to keep in mind in this regard is that the properties of VGSCs produced by different exogenous expression systems can differ; an example close to home is the following. As noted earlier, the rate of fast inactivation of NaV1.7 co-expressed with either NaVβ1 or β3 was faster than that of NaV1.7 expressed alone (Figure 1 and Table 2; see also Vijayaragavan et al., 2001). However, this result was not observed when HEK293 cells served as the expression system; there, co-expression of any NaVβ isoform (NaVβ1-β4) had no effect on the kinetics of NaV1.7 current (Ho et al., 2012). These investigators also noted that their results with HEK293 cells seemed at odds with the behaviour of TTX-sensitive INa in small neurons of DRG of mice (presumably mediated at least in part by NaV1.7), where fast inactivation is more rapid in control than in mutant mice where NaVβ2 expression was knocked out (Lopez-Santiago et al., 2006). It is becoming increasingly clear that the background cell type in which VGSCs are expressed, neuron versus non-neuronal cell line or even among neurons themselves, can influence the physiological properties of VGSCs (Cummins et al., 2001; Dib-Hajj et al., 2009b).
The issue at hand is how important a role does background cell type play in the pharmacological properties of VGSCs (as opposed to their biophysical properties), specifically regarding the pharmacology of site 1. It remains to be seen whether the effects of NaVβ subunit co-expression we report here for oocytes also apply to neurons. With regard to the latter, experiments seem called for that involve the use of siRNA to knockdown the expression levels of specific NaVβ isoforms (Bant and Raman, 2010) or mutant (knockout) mice where specific NaVβ subunits are not expressed altogether (Lopez-Santiago et al., 2006).
In the meantime, we are characterizing the μ-conotoxin susceptibility of sodium currents in different cell types of DRG neurons (Zhang et al., 2013), with the expectation that cell type-specific differences that show up might be correlatable with the different levels of transcripts for the various NaVβ subunits expressed by the different cell types (e.g. Ho et al., 2012).
Conclusions
Our discovery that NaVβ subunit co-expression can affect the affinity of VGSCs for μ-conotoxins provides yet another avenue through which to explore the interaction of μ-conotoxins with site 1, a potentially important drug target for the therapeutic treatment of neurological disorders where VGSCs are implicated, such as epilepsy and neuropathic pain (Catterall, 2012; Waxman, 2012).
Acknowledgments
We thank the following for generously providing rat clones: Prof Alan A Goldin (University of California, Irvine, CA), NaV1.1, NaV1.2, NaVβ1 and NaVβ2; Prof Lori L Isom (University of Michigan Medical School, Ann Arbor, MI), NaVβ3 and NaVβ4; Prof Gail Mandel (Howard Hughes Medical Institute, Portland, OR), NaV1.7.
This work was supported by the National Institutes of Health grant GM 48677 to GB, BMO, JER and DY.
Glossary
- DRG
dorsal root ganglion
- INa
sodium current
- μ-KIIIA
μ-conotoxin KIIIA from Conus kinoshitai
- μ-PIIIA
μ-conotoxin PIIIA from Conus pururascens
- μ-SmIIIA
μ-conotoxin SmIIIA from Conus stercusmuscarum
- μ-TIIIA
μ-conotoxin TIIIA from Conus tulipa
- NaV1
α-subunit of voltage-gated sodium channel
- NaVβ
β-subunit of voltage-gated sodium channel
- NaVβ112
chimera of the extracellular and transmembrane domains of NaVβ1 and intracellular domain of NaVβ2
- NaVβ211
chimera of the extracellular domain of NaVβ2 and transmembrane and intracellular domains of NaVβ1
- STX
saxitoxin
- TTX
tetrodotoxin
- VGSC
voltage-gated sodium channel
Conflict of interest
BMO is a cofounder of Cognetix, Inc., and GB is a cofounder of NeuroAdjuvants, Inc.
Supporting information
Additional Supporting Information may be found in the online version of this article at the publisher's web-site:
Figure S1 Matrix of kobs versus [μ-conotoxin] plots for the block by μ-SmIIIA, μ-PIIIA or μ-TIIIA of NaV1.1, 1.2, 1.6, or 1.7, each alone or co-expressed with NaVβ1, β3, β2 or β4. Also included is the plot for the block by μ-KIIIA of NaV1.7 ± NaVβ-subunits (lower right). Slopes of these plots provided the kon values for Tables 2 and 3 (and thus the Δkon values in Figure 5). Each plot is modelled after Figure 4A, and overall arrangement of plots mirrors that of Figure 5 (including plot in lower right corner illustrating the results for the block by μ-KIIIA of NaV1.7 ± NaVβ subunit co-expression). Thus, columns represent different μ-conotoxins, and rows represent different NaV1 isoforms. Each plot shows five curves: respective NaV1 alone (‘no β’), NaV1 + β1 (‘+β1’), NaV1 + β2 (‘+β2’), NaV1 + β3 (‘+β3’) and NaV1 + β4 (‘+β4’). Note, first two plots in the first row and first plot in the third row each have an inset showing curves for ‘no β’, ‘+β1’ and ‘+β3’ (because these three curves are too close together to easily distinguish among them in the parent plot), where the X-axis has been expanded relative to that of the parent plot; the axes of each inset have the same units as those of the parent plot.
Figure S2 Block by TTX of NaV1.7 without (left column) and with co-expression of NaVβ1 (middle column) or NaVβ4 (right column). Top row, sample current traces before (control) and during exposure to 10 nM TTX; in each case, the current was blocked by about 60%. Bottom row, representative time courses of block by 10 nM TTX and recovery following TTX washout. Horizontal black bar represents time interval during which TTX was present. Solid curves represent best fits to single-exponential functions, from which values of kobs and koff were obtained. Such koff values from ≥9 oocytes were averaged to yield each koff value in Table 4. Also, such kobs values from 9 oocytes were plotted versus [TTX], and the resulting slope yielded each kon value in Table 4.
Table S1 Time constant of fast inactivation, τ, for NaV1.1, 1.2 and 1.6 without and with co-expression of NaVβ-subunits.a
References
- Alexander SPH, Mathie A, Peters JA. Guide to Receptors and Channels (GRAC), 5th edition. Br J Pharmacol. 2011;164(Suppl. 1):S1–S324. doi: 10.1111/j.1476-5381.2011.01649_1.x. [DOI] [PMC free article] [PubMed] [Google Scholar]
- Bant JS, Raman IM. Control of transient, resurgent, and persistent current by open-channel block by Na channel beta4 in cultured cerebellar granule neurons. Proc Natl Acad Sci U S A. 2010;107:12357–12362. doi: 10.1073/pnas.1005633107. [DOI] [PMC free article] [PubMed] [Google Scholar]
- Black JA, Dib-Hajj S, McNabola K, Jeste S, Rizzo MA, Kocsis JD, et al. Spinal sensory neurons express multiple sodium channel alpha-subunit mRNAs. Brain Res Mol Brain Res. 1996;43:117–131. doi: 10.1016/s0169-328x(96)00163-5. [DOI] [PubMed] [Google Scholar]
- Black JA, Liu S, Tanaka M, Cummins TR, Waxman SG. Changes in the expression of tetrodotoxin-sensitive sodium channels within dorsal root ganglia neurons in inflammatory pain. Pain. 2004;108:237–247. doi: 10.1016/j.pain.2003.12.035. [DOI] [PubMed] [Google Scholar]
- Brackenbury WJ, Isom LL. Na channel β subunits: overachievers of the ion channel family. Front Pharmacol. 2011;2:53. doi: 10.3389/fphar.2011.00053. [DOI] [PMC free article] [PubMed] [Google Scholar]
- Bulaj G, West PJ, Garrett JE, Watkins M, Marsh M, Zhang M-M, et al. Novel conotoxins from Conus striatus and Conus kinoshitai selectively block TTX-resistant sodium channels. Biochemistry. 2005;44:7259–7265. doi: 10.1021/bi0473408. [DOI] [PubMed] [Google Scholar]
- Catterall WA. Neurotoxins that act on voltage-sensitive sodium channels in excitable membranes. Annu Rev Pharmacol Toxicol. 1980;20:15–43. doi: 10.1146/annurev.pa.20.040180.000311. [DOI] [PubMed] [Google Scholar]
- Catterall WA. From ionic currents to molecular mechanisms: the structure and function of voltage-gated sodium channels. Neuron. 2000;26:13–25. doi: 10.1016/s0896-6273(00)81133-2. [DOI] [PubMed] [Google Scholar]
- Catterall WA. Voltage-gated sodium channels at 60: structure, function, and pathophysiology. J Physiol. 2012;590:2577–2589. doi: 10.1113/jphysiol.2011.224204. [DOI] [PMC free article] [PubMed] [Google Scholar]
- Catterall WA, Goldin AL, Waxman SG. International Union of Pharmacology. XLVII. Nomenclature and structure-function relationships of voltage-gated sodium channels. Pharmacol Rev. 2005;57:397–409. doi: 10.1124/pr.57.4.4. [DOI] [PubMed] [Google Scholar]
- Cestèle S, Catterall WA. Molecular mechanisms of neurotoxin action on voltage-gated sodium channels. Biochimie. 2000;82:883–892. doi: 10.1016/s0300-9084(00)01174-3. [DOI] [PubMed] [Google Scholar]
- Chahine M, O'leary ME. Regulatory role of voltage-gated Na channel β subunits in sensory neurons. Front Pharmacol. 2011;2:70. doi: 10.3389/fphar.2011.00070. [DOI] [PMC free article] [PubMed] [Google Scholar]
- Chen C, Cannon SC. Modulation of Na+ channel inactivation by the beta 1 subunit: a deletion analysis. Pflugers Arch. 1995;431:186–195. doi: 10.1007/BF00410190. [DOI] [PubMed] [Google Scholar]
- Chopra SS, Watanabe H, Zhong TP, Roden DM. Molecular cloning and analysis of zebrafish voltage-gated sodium channel beta subunit genes: implications for the evolution of electrical signaling in vertebrates. BMC Evol Biol. 2007;7:113. doi: 10.1186/1471-2148-7-113. [DOI] [PMC free article] [PubMed] [Google Scholar]
- Cummins TR, Aglieco F, Renganathan M, Herzog RI, Dib-Hajj SD, Waxman SG. Nav1.3 sodium channels: rapid repriming and slow closed-state inactivation display quantitative differences after expression in a mammalian cell line and in spinal sensory neurons. J Neurosci. 2001;21:5952–5961. doi: 10.1523/JNEUROSCI.21-16-05952.2001. [DOI] [PMC free article] [PubMed] [Google Scholar]
- Dib-Hajj SD, Black JA, Waxman SG. Voltage-gated sodium channels: therapeutic targets for pain. Pain Med. 2009a;10:1260–1269. doi: 10.1111/j.1526-4637.2009.00719.x. [DOI] [PubMed] [Google Scholar]
- Dib-Hajj SD, Choi J-S, Macala LJ, Tyrrell L, Black JA, Cummins TR, et al. Transfection of rat or mouse neurons by biolistics or electroporation. Nat Protoc. 2009b;4:1118–1126. doi: 10.1038/nprot.2009.90. [DOI] [PubMed] [Google Scholar]
- Dib-Hajj SD, Cummins TR, Waxman SG. Sodium channels in normal and pathological pain. Neuroscience. 2010;33:325–347. doi: 10.1146/annurev-neuro-060909-153234. [DOI] [PubMed] [Google Scholar]
- Fiedler B, Zhang M-M, Buczek O, Azam L, Bulaj G, Norton RS, et al. Specificity, affinity and efficacy of iota-conotoxin RXIA, an agonist of voltage-gated sodium channels Na(V)1.2, 1.6 and 1.7. Biochem Pharmacol. 2008;75:2334–2344. doi: 10.1016/j.bcp.2008.03.019. [DOI] [PMC free article] [PubMed] [Google Scholar]
- Fukuoka T, Kobayashi K, Yamanaka H, Obata K, Dai Y, Noguchi K. Comparative study of the distribution of the alpha-subunits of voltage-gated sodium channels in normal and axotomized rat dorsal root ganglion neurons. J Comp Neurol. 2008;510:188–206. doi: 10.1002/cne.21786. [DOI] [PubMed] [Google Scholar]
- Hartshorne RP, Catterall WA. The sodium channel from rat brain. Purification and subunit composition. J Biol Chem. 1984;259:1667–1675. [PubMed] [Google Scholar]
- Ho C, Zhao J, Malinoswki S, Chahine M, O'Leary ME. Differential expression of sodium channel β subunits in dorsal root ganglion sensory neurons. J Biol Chem. 2012;287:15044–15053. doi: 10.1074/jbc.M111.333740. [DOI] [PMC free article] [PubMed] [Google Scholar]
- Isom LL, De Jongh KS, Patton DE, Reber BF, Offord J, Charbonneau H, et al. Primary structure and functional expression of the beta 1 subunit of the rat brain sodium channel. Science. 1992;256:839–842. doi: 10.1126/science.1375395. [DOI] [PubMed] [Google Scholar]
- Isom LL, Ragsdale DS, De Jongh KS, Westenbroek RE, Reber BF, Scheuer T, et al. Structure and function of the beta 2 subunit of brain sodium channels, a transmembrane glycoprotein with a CAM motif. Cell. 1995a;83:433–442. doi: 10.1016/0092-8674(95)90121-3. [DOI] [PubMed] [Google Scholar]
- Isom LL, Scheuer T, Brownstein AB, Ragsdale DS, Murphy BJ, Catterall WA. Functional co-expression of the beta 1 and type IIA alpha subunits of sodium channels in a mammalian cell line. J Biol Chem. 1995b;270:3306–3312. doi: 10.1074/jbc.270.7.3306. [DOI] [PubMed] [Google Scholar]
- Johnson D, Bennett ES. Isoform-specific effects of the beta2 subunit on voltage-gated sodium channel gating. J Biol Chem. 2006;281:25875–25881. doi: 10.1074/jbc.M605060200. [DOI] [PubMed] [Google Scholar]
- Johnson D, Montpetit ML, Stocker PJ, Bennett ES. The sialic acid component of the beta1 subunit modulates voltage-gated sodium channel function. J Biol Chem. 2004;279:44303–44310. doi: 10.1074/jbc.M408900200. [DOI] [PubMed] [Google Scholar]
- Kilkenny C, Browne W, Cuthill IC, Emerson M, Altman DG. NC3Rs Reporting Guidelines Working Group. Br J Pharmacol. 2010;160:1577–1579. doi: 10.1111/j.1476-5381.2010.00872.x. [DOI] [PMC free article] [PubMed] [Google Scholar]
- Lewis RJ, Schroeder CI, Ekberg J, Nielsen KJ, Loughnan M, Thomas L, et al. Isolation and structure-activity of mu-conotoxin TIIIA, a potent inhibitor of tetrodotoxin-sensitive voltage-gated sodium channels. Mol Pharmacol. 2007;71:676–685. doi: 10.1124/mol.106.028225. [DOI] [PubMed] [Google Scholar]
- Lewis RJ, Dutertre S, Vetter I, Christie MJ. Conus venom Peptide pharmacology. Pharmacol Rev. 2012;64:259–298. doi: 10.1124/pr.111.005322. [DOI] [PubMed] [Google Scholar]
- Liman ER, Tytgat J, Hess P. Subunit stoichiometry of a mammalian K+ channel determined by construction of multimeric cDNAs. Neuron. 1992;9:861–871. doi: 10.1016/0896-6273(92)90239-a. [DOI] [PubMed] [Google Scholar]
- Lopez-Santiago LF, Pertin M, Morisod X, Chen C, Hong S, Wiley J, et al. Sodium channel beta2 subunits regulate tetrodotoxin-sensitive sodium channels in small dorsal root ganglion neurons and modulate the response to pain. J Neurosci. 2006;26:7984–7994. doi: 10.1523/JNEUROSCI.2211-06.2006. [DOI] [PMC free article] [PubMed] [Google Scholar]
- Lopreato GF, Lu Y, Southwell A, Atkinson NS, Hillis DM, Wilcox TP, et al. Evolution and divergence of sodium channel genes in vertebrates. Proc Natl Acad Sci U S A. 2001;98:7588–7592. doi: 10.1073/pnas.131171798. [DOI] [PMC free article] [PubMed] [Google Scholar]
- McCormick KA, Srinivasan J, White K, Scheuer T, Catterall WA. The extracellular domain of the beta1 subunit is both necessary and sufficient for beta1-like modulation of sodium channel gating. J Biol Chem. 1999;274:32638–32646. doi: 10.1074/jbc.274.46.32638. [DOI] [PubMed] [Google Scholar]
- McGrath J, Drummond G, Kilkenny C, Wainwright C. Guidelines for reporting experiments involving animals: the ARRIVE guidelines. Br J Pharmacol. 2010;160:1573–1576. doi: 10.1111/j.1476-5381.2010.00873.x. [DOI] [PMC free article] [PubMed] [Google Scholar]
- Makita N, Bennett PB, George AL. Molecular determinants of beta 1 subunit-induced gating modulation in voltage-dependent Na+ channels. J Neurosci. 1996;16:7117–7127. doi: 10.1523/JNEUROSCI.16-22-07117.1996. [DOI] [PMC free article] [PubMed] [Google Scholar]
- Morgan K, Stevens EB, Shah B, Cox PJ, Dixon AK, Lee K, et al. beta 3: an additional auxiliary subunit of the voltage-sensitive sodium channel that modulates channel gating with distinct kinetics. Proc Natl Acad Sci U S A. 2000;97:2308–2313. doi: 10.1073/pnas.030362197. [DOI] [PMC free article] [PubMed] [Google Scholar]
- Olivera BM, Rivier J, Scott JK, Hillyard DR, Cruz LJ. Conotoxins. J Biol Chem. 1991;266:22067–22070. [PubMed] [Google Scholar]
- Patino GA, Isom LL. Electrophysiology and beyond: multiple roles of Na+ channel β subunits in development and disease. Neurosci Lett. 2010;486:53–59. doi: 10.1016/j.neulet.2010.06.050. [DOI] [PMC free article] [PubMed] [Google Scholar]
- Rush AM, Cummins TR, Waxman SG. Multiple sodium channels and their roles in electrogenesis within dorsal root ganglion neurons. J Physiol. 2007;579(Pt 1):1–14. doi: 10.1113/jphysiol.2006.121483. [DOI] [PMC free article] [PubMed] [Google Scholar]
- Shon KJ, Olivera BM, Watkins M, Jacobsen RB, Gray WR, Floresca CZ, et al. mu-Conotoxin PIIIA, a new peptide for discriminating among tetrodotoxin-sensitive Na channel subtypes. J Neurosci. 1998;18:4473–4481. doi: 10.1523/JNEUROSCI.18-12-04473.1998. [DOI] [PMC free article] [PubMed] [Google Scholar]
- Terlau H, Olivera BM. Conus venoms: a rich source of novel ion channel-targeted peptides. Physiol Rev. 2004;84:41–68. doi: 10.1152/physrev.00020.2003. [DOI] [PubMed] [Google Scholar]
- Vijayaragavan K, O'Leary ME, Chahine M. Gating properties of Na(v)1.7 and Na(v)1.8 peripheral nerve sodium channels. J Neurosci. 2001;21:7909–7918. doi: 10.1523/JNEUROSCI.21-20-07909.2001. [DOI] [PMC free article] [PubMed] [Google Scholar]
- Waxman SG. Sodium channels, the electrogenisome, and the electrogenistat: lessons and questions from the clinic. J Physiol. 2012;590:2601–2612. doi: 10.1113/jphysiol.2012.228460. [DOI] [PMC free article] [PubMed] [Google Scholar]
- West PJ, Bulaj G, Garrett JE, Olivera BM, Yoshikami D. Mu-conotoxin SmIIIA, a potent inhibitor of tetrodotoxin-resistant sodium channels in amphibian sympathetic and sensory neurons. Biochemistry. 2002;41:15388–15393. doi: 10.1021/bi0265628. [DOI] [PubMed] [Google Scholar]
- Widmark J, Sundström G, Ocampo Daza D, Larhammar D. Differential evolution of voltage-gated sodium channels in tetrapods and teleost fishes. Mol Biol Evol. 2011;28:859–871. doi: 10.1093/molbev/msq257. [DOI] [PubMed] [Google Scholar]
- Wilson MJ, Yoshikami D, Azam L, Gajewiak J, Olivera BM, Bulaj G, et al. μ-Conotoxins that differentially block sodium channels NaV1.1 through 1.8 identify those responsible for action potentials in sciatic nerve. Proc Natl Acad Sci U S A. 2011a;108:10302–10307. doi: 10.1073/pnas.1107027108. [DOI] [PMC free article] [PubMed] [Google Scholar]
- Wilson MJ, Zhang M-M, Azam L, Olivera BM, Bulaj G, Yoshikami D. Navβ subunits modulate the inhibition of Nav1.8 by the analgesic gating modifier μO-conotoxin MrVIB. J Pharmacol Exp Ther. 2011b;338:687–693. doi: 10.1124/jpet.110.178343. [DOI] [PMC free article] [PubMed] [Google Scholar]
- Yu FH, Westenbroek RE, Silos-Santiago I, McCormick KA, Lawson D, Ge P, et al. Sodium channel beta4, a new disulfide-linked auxiliary subunit with similarity to beta2. J Neurosci. 2003;23:7577–7585. doi: 10.1523/JNEUROSCI.23-20-07577.2003. [DOI] [PMC free article] [PubMed] [Google Scholar]
- Zhang M-M, McArthur JR, Azam L, Bulaj G, Olivera BM, French RJ, et al. Synergistic and antagonistic interactions between tetrodotoxin and mu-conotoxin in blocking voltage-gated sodium channels. Channels (Austin, Tex) 2009;3:32–38. doi: 10.4161/chan.3.1.7500. [DOI] [PMC free article] [PubMed] [Google Scholar]
- Zhang M-M, Gruszczynski P, Walewska A, Bulaj G, Olivera BM, Yoshikami D. Cooccupancy of the outer vestibule of voltage-gated sodium channels by micro-conotoxin KIIIA and saxitoxin or tetrodotoxin. J Neurophysiol. 2010a;104:88–97. doi: 10.1152/jn.00145.2010. [DOI] [PMC free article] [PubMed] [Google Scholar]
- Zhang M-M, Han TS, Olivera BM, Bulaj G, Yoshikami D. μ-conotoxin KIIIA derivatives with divergent affinities versus efficacies in blocking voltage-gated sodium channels. Biochemistry. 2010b;49:4804–4812. doi: 10.1021/bi100207k. [DOI] [PMC free article] [PubMed] [Google Scholar]
- Zhang M-M, Wilson MJ, Gajewiak J, Rivier JE, Bulaj G, Olivera BM, et al. Pharmacological Fractionation of Tetrodotoxin-sensitive Sodium Currents in Rat Dorsal Root Ganglion Neurons by μ-Conotoxins. Br J Pharmacol. 2013 doi: 10.1111/bph.12119. DOI: 10.1111/bph.12119. [DOI] [PMC free article] [PubMed] [Google Scholar]
- Zimmer T, Benndorf K. The human heart and rat brain IIA Na+ channels interact with different molecular regions of the beta1 subunit. J Gen Physiol. 2002;120:887–895. doi: 10.1085/jgp.20028703. [DOI] [PMC free article] [PubMed] [Google Scholar]
Associated Data
This section collects any data citations, data availability statements, or supplementary materials included in this article.