

Abstract
We show that in networks with a hierarchical architecture, critical dynamical behaviors can emerge even when the underlying dynamical processes are not critical. This finding provides explicit insight into current studies of the brain's neuronal network showing power-law avalanches in neural recordings, and provides a theoretical justification of recent numerical findings. Our analysis shows how the hierarchical organization of a network can itself lead to power-law distributions of avalanche sizes and durations, scaling laws between anomalous exponents, and universal functions—even in the absence of self-organized criticality or critical points. This hierarchy-induced phenomenon is independent of, though can potentially operate in conjunction with, standard dynamical mechanisms for generating power laws.
Many real-world networks are hierarchically organized into layers of modules and submodules, one prominent example being the neuronal network of the human brain. A central but still largely unexplored question is how an underlying hierarchical structure can affect a network's dynamical behavior. In this paper, we develop a renormalization analysis to uncover some important implications of hierarchical architecture in a network. Our main result reveals the interesting role of hierarchy in generating robust power-law behavior in networks, a fact which helps explain recent results on neuronal cascades in human brains. In addition, we show that other properties of these networks are consistent with the experimental data on brain networks and suggest new experiments to improve our understanding of brain networks and behavior. The ideas developed in this paper should be broadly applicable to many other network settings which exhibit a hierarchical modular (HM) structure, ranging from engineered to biological to social systems.
INTRODUCTION
The existence and interpretation of power-law distributions in physical, biological, and social systems are an important and sometimes controversial10 subject. While power laws may potentially signal the presence of underlying critical dynamics in a system (i.e., self-organized criticality3 or a critical point), a variety of other processes—including some commonly used data sampling, filtering, and thresholding methodologies—have also been found capable of generating power-law-like behavior.28, 29, 4, 21, 25 Hence, power laws are suggestive of, but not conclusive evidence of, critical behavior. The issue of criticality is particularly relevant to current experimental studies of neuronal avalanches in brain networks, where it is being vigorously investigated.14, 4, 29, 28, 5 A definitive determination of criticality would have important implications for our understanding of brain function and neural information processing—but when and whether criticality can be properly inferred from experimental power-law data remains an unsettled and sometimes contentious matter.
In this paper, we introduce an interesting new wrinkle (and obstacle) to the detection of standard models of criticality in brain networks and related systems. There is a strong evidence that the neuronal network of the brain, like that of many real-world networks (e.g., protein networks, genomes, modern software design, VLSI chips, business organizational structures, the internet, social networks18, 19, 15, 17, 13), is not “flat,” but rather hierarchically organized into layers of modules and submodules. We show here how the HM architecture of a network can naturally induce several of the hallmark signatures of criticality—including not only power laws but also relationships between different scaling exponents—even if the underlying dynamics is simple and non-critical. We do this by constructing a simple prototype of a hierarchical modular network (HMN) and carrying out a renormalization-inspired analysis.
Our finding of a structural mechanism capable of generating power laws provides explicit insight into recent observations of realistic networks of spiking neurons6, 26 which suggest that power laws seem to be enhanced by the presence of a hierarchical modular structure in the underlying network. We remark that the presence of this structural mechanism does not rule out the possibility that observed power laws in a network may also have a dynamical origin—in fact, the two effects might work in tandem as suggested by Refs. 26, 30—but it does raise the bar for proof for properly ascribing the origin of power-law behaviors in neuronal networks with hierarchical structure. Our work, for example, provides theoretical support for recent numerical observations30 showing that hierarchical structure can improve the robustness of observed criticality. We also show how a network's hierarchical modularity can obfuscate even sophisticated attempts to assess the origin of critical behavior. For example, a recent study by Friedman et al. involving cultured cortical networks looked beyond simple power laws and instead turned to universal scaling exponents and functions for more definitive evidence of intrinsic criticality.14 However, we demonstrate here that a network's hierarchical structure is also capable of producing similar (universal scaling) results, and hence even these more sophisticated measures can be inconclusive.
Note that the distinction we draw between structurally versus dynamically induced criticality is not formally sharp, since in a general network there is always interplay between the network's structure and the intrinsic dynamics of its nodes, and both contribute to its overall behavior. However, in the following, we will demonstrate the existence of critical behavior which is driven mainly by the network's (HM) structure—i.e., criticality appears in HM models whose intrinsic nodal behaviors are so simple that they would be incapable of generating critical avalanching in ordinary (non-HM) networks (such as a regular lattice). This distinction is particularly relevant, since to date most analyses of critical avalanching in the brain (with the notable exceptions of Refs. 26, 30) have looked to intrinsic nodal dynamics (of the sort commonly associated with self-organized criticality) as being the root source of the criticality, rather than the network structure itself. Our finding shows that a hierarchical modular structure in a network can be an equally important contributor to criticality. This is particularly germane to current studies on the brain, where at the micro-scale level it is widely believed that groups of 80–120 neurons are organized into minicolumns, and groups of 50–100 minicolumns are organized into columns;9, 16 at higher levels, there is evidence from both cyto-architecture and MRI of modular structure.16, 8
HIERARCHICAL MODULAR NETWORKS
To begin, we define a HMN to be a network whose nodal connections are such that it naturally decomposes into a nested series of (possibly self-similar) modules. Here, we present a basic random HMN model motivated by the work of Refs. 26, 30, among others.1, 17, 31 While this model and its subsequent analysis can be easily generalized in many ways, for illustrative purposes, we focus here on a simple, restricted version. We consider a random HMN organized into sets of modules at different levels . Each module at level k, denoted Mk, is composed of r “children” modules (with ). Each such child module itself contains r children modules, and so on. At the lowest level in this nested hierarchy are the M0 modules, each containing a single node. Note that each module Mk at level k (for ) has a unique “parent” module , and that the size of Mk is . At the topmost level in the hierarchy is a single module that contains all the nodes (see Figure 1a). Note that one can easily generalize this model and our subsequent analysis (at the cost of additional notation) in several ways, including allowing r to vary by module and truncating the branching structure asymmetrically to create unbalanced trees.
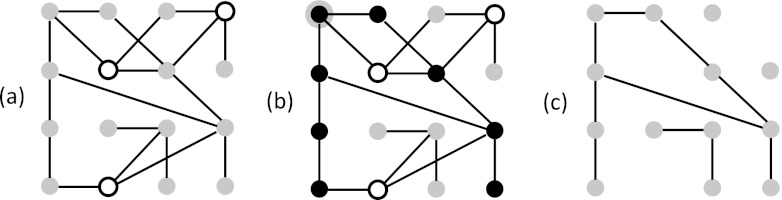
Figure 1.

HM structure and renormalization procedures (a) schematic of a hierarchical modular network. Shown is a HMN with r = 9, , and . Dots represent individual nodes (level-0 modules); each 3 × 3 grouping of nodes is a level-1 module M1 (small square); a 3 × 3 grouping of M1 modules forms an M2 module (large square). Level-1 edges (solid lines) connect nodes within a given M1 module; level-2 edges (dashed lines) connect nodes from different (i.e., “sibling”) M1 modules within a given M2 module. (b) First step of renormalization procedure: only edges between the giant components of the level-1 modules are retained. In the figure, . (c) The reduced network. Here, the giant component of each M1 is contracted into a single meta-node (large dot).
Edges between nodes are added based on their level of separation within the hierarchy, so nodes in the same module are more likely to be connected to one another than to nodes in distant modules. Given any 2 nodes let to be the smallest k such that . Add an edge between with probability , where ; we call this a “level- k edge.” We let denote the expected number of level-k edges per node, and dk the expected number of level-k edges from an entire module to sibling modules within Mk. Note that since a module contains nodes, .
We now consider what happens if we impose a very simple, seemingly non-critical dynamical process on such a HM network (i.e., so simple that—were the network just a regular lattice—no critical (SOC-like) behavior would be generated). We will illustrate with a rudimentary nodal-dynamics process originally used to study disease (or rumor) propagation.2 In particular, we assume that a single random node fires and sends signals to each of its neighbors which can be in one of two states, primed or quiescent. If primed, a neighbor will fire upon receiving the signal and then become quiescent; if quiescent, it will not fire. This activity may propagate through the network, generating an avalanche. Though simple, this dynamical model captures the fast timescale behavior of integrate-and-fire models under the simplifying assumption that the phases are set at random and ignoring the effect of repeated triggerings.20, 26
AVALANCHING IN A HMN
A non-HMN example
Our goal is to understand the nature of the network avalanches that can result from simple underlying dynamical processes like that described above in networks with a HM structure. For comparative purposes, first consider these same dynamics on a non-HM network: an Erdos-Renyi random network with nodes and edge probability p. Letting q denote the probability of a node being primed, the statistics of the avalanching process can be computed from the statistics of the connected components of the subnetwork generated by removing each node with probability 1 − q (Figure 2). If the average degree of the subnetwork , then the network will consist of a giant component of approximate size nqh(d), where h(d) is the solution of
| (1) |
all other components will be small, O(log(n)) in the worst case and O(1) on average.12 If , then all components will be small (O(log(n))). Therefore, when , the dynamical avalanches will also have an essentially bimodal distribution: with probability h(d) a single firing neuron will trigger a large avalanche of size nqh(d), while with probability 1 − h(d) the avalanche will involve a negligible fraction of the nodes, O(log(n)/n). When , all avalanches will contain a negligible fraction of the nodes. In either case, this example shows that, for non-HM networks, when the underlying nodal dynamics is sufficiently simple, then the resulting avalanching distribution (as described by the distribution of connected components) tends to be bimodal or trivially unimodal, but not critical. (We remark that while power-law scaling does appear exactly at d = 1, this is a non-generic special case that is not relevant to the analysis.)
Figure 2.
Relationships between dynamics and structure. (a) Initial state of system. Gray nodes are primed; white quiescent. (b) If the node in upper left corner (black, with gray border) fires, it generates an avalanche (black nodes) by spreading along edges. (c) The subnetwork attained by removing the quiescent nodes from the network in (a). An avalanche beginning at a given node in the subnetwork will propagate and encompasses the entire connected component containing that node.
HMNs: A renormalization approach
The above example foreshadows a key difference between most standard (non-HM) network behaviors22 and HMNs: As we demonstrate next, if a network has a HM structure, then even if the underlying nodal dynamics is extremely simple (as above), the resulting avalanching behavior naturally scales over a wide range of sizes, and under some parameter specifications the distribution of connected components formally satisfies a power law. In this way, the hierarchical structure itself can induce behavior which mimics that of self-organized criticality. Hints that this might be possible can be found in a somewhat different context—hierarchical percolation models—where some similar-in-spirit behaviors appear (e.g., Refs. 23, 7).
Our analysis of the distribution of connected components in a HMN is based on a renormalization-inspired approach. The intuition behind this approach is as follows: Starting from the lowest level in the network hierarchy, one recursively generates a series of renormalized (i.e., “reduced”) networks by treating the largest connected component in each module (at a given level) as a single “meta-node” in a reduced network (see Figures 1a, 1b, 1c). This level-by-level iterative approach is possible because of the system's underlying hierarchical structure, wherein intra-module connections dominate inter-module connections. Analysis of these renormalized networks will yield the desired component distribution. For ease of exposition, in what follows we will omit some of the details of these calculations, but note that rigorous error bounds can be computed for , which is the main case of interest.
We begin our analysis of HMNs by recalling that a module Mk has rk nodes, so each node in Mk has a “level-k degree” , where
| (2) |
on average, neglecting O(1/r) terms. Assuming , we see that nodes have many more edges at level k than at for , allowing the system to be treated level by level. In our iterative renormalization scheme, at level k, we contract each module into a single “meta”-node of a reduced network. We define the level-k degree of these meta-nodes inside Mk to be dk, where . As noted previously, in terms of the original (non-reduced) network, dk represents the expected number of edges from all nodes in module to nodes in its sibling modules in Mk.
This allows us to compute the distribution of component sizes. First consider some M1 with only the level-1 edges. There is a giant component with nodes; the remaining components are all negligible in size. Next, we consider some M2 and a reduced network where all nodes in the giant component of each child M1 are contracted into a single meta-node and, importantly, the remaining nodes in M1 ignored. The key insight is that the effective average degree for nodes in this reduced network is , not d2, since nodes not in the giant component have been discarded. There are meta-nodes in this reduced network which corresponds to actual nodes. We continue this iterative process as we work our way up through each level of the hierarchy: Defining fk to be the fraction of nodes in the giant connected component (at level k of the reduced network) and to be the effective average degree of these nodes (discarding nodes not in the giant component), we have
| (3) |
and
| (4) |
with initial condition (see Figures 1a, 1b, 1c).
To compute a discretized component distribution for the HMN, for each , let Sk be a giant component (of the reduced network) at level-k and note that
| (5) |
up to poly-logarithmic factors. Starting from a random initial node, the probability of being in some Sk is given by for .
Now, suppose that the pk's are chosen so that is constant for all k (so that the hierarchical structure is self-similar), in which case , , and . The probability that a randomly chosen node is in a component of size or larger is approximately . (To see this, note that the fraction of nodes in components of size sk is for and for . Thus, the fraction of the nodes in components of size sk or larger is
| (6) |
which simplifies (via telescoping) to .) Thus, the cumulative tail distribution is , and the preceding formula for sk shows that . Writing this implies that , and thus the cumulative tail distribution is
| (7) |
for , demonstrating the existence of a power law distribution for the simple models of avalanches presented earlier (see Figures 3a, 3b). Hence, we see that a HM structure alone (without intrinsic critical dynamics) is capable of mimicking a key attribute of a critical dynamical system. We note that in simulations finite size effects are clearly evident, which is to be expected since one needs modules that are large enough to display stable giant components and multiple hierarchical levels to attain the power law. Observe too from the figure that for , it shows the expected step behavior while for it does not. This effect arises from the relative steepness of the slope of the function for an Erdos-Renyi random graph, which leads to large fluctuations in the size of the giant component, overwhelming the steps that would normally arise. Generally speaking, we note that steps become more pronounced as both r and β increase, as long as β is not too small, while the precise interplay between r and β is complicated. (A simple estimate shows that the fluctuations are proportional to and the derivative of at β.)
Figure 3.

Comparison of numerical and theoretical results for HMNs with r = 100, . (a) Log-log plots of the cumulative tails versus (fractional) component size. The upper set of lines are for , with the solid line from numerical simulations and the dashed line representing the theoretical (renormalization-based) prediction. The lower set of lines are for . Both sets display good agreement between the theory and simulations. Note that shows the expected step behavior, while does not, as discussed in the text. (b) Same as in (a), except with the numerical data averaged over 100 randomly generated HMNs; the error bars show a single standard deviation. (Note that extremely small error bars are not shown.) Note that although the data are smoothed by random fluctuations and do not exhibit the step behavior, nonetheless one can see strong linearity in the main region (before the edge effects take over), clearly exhibiting power-law behavior. (c) Average path lengths and average eccentricities for .
We also mention that our analytical identification of a hierarchical mechanism responsible for generating/enhancing power laws provides some intuitive foundations for the numerical and analytical findings of Ref. 30. (In that numerical work, an analogous but different hierarchical model is used, which has the advantage of producing cleaner numerical results.)
Note that the above computation is valid at discrete values of x ( for ); however, it is easy to see that the distribution consists of discrete steps. Nonetheless, it can be viewed as a (continuous) power law as it is both upper and lower bounded by a polynomial with exponent , formally in Bachmann–Landau notation.
HM networks can also display a second key attribute of neuronal avalanches at a critical point noted by Friedman et al.,14 namely, the existence of sub- and super-critical phases arising from varied parameters. Observe that the requirement that is independent of k implies that in the definition . Now, if , then the network will be supercritical and there will be a true giant (containing a non-vanishing fraction of the nodes) component in the limit , while if then the system will be subcritical and all components will remain small in that same limit. We note, however, that for a HMN this transition can be either relatively sharp (akin to a critical point) or more broadened (where the power-law-like behavior persists, akin to SOC systems) depending on the details of the limiting process and .
In addition to the size distribution of avalanches, one can also study their temporal distribution. Let t be the total number of (fast) time steps in an avalanche and G(t) its cumulative distribution function. For our simple dynamic process, the duration of an avalanche starting out from a specific node is equivalent to the eccentricity of that node in its connected component. In the following, we compute this eccentricity assuming that for all k, although the more general case is still tractable.
Recall that the eccentricity of a node is the longest (shortest path) distance from that node to another one in its connected component. The diameter of such a component is the largest eccentricity. Thus, for a specific component, the average path length (APL) is smaller than the average eccentricity which is smaller than the diameter. Note that for an Erdos-Renyi random graph with nodes and average degree , asymptotically the diameter, average path length, and eccentricity, denoted here , are all of the form
| (8) |
where .
We first compute the APL using our renormalization-inspired approach, similar in spirit to that in Refs. 31, 1 and paralleling that above. Specifically, we estimate the average path length in our HMN between two connected nodes with . To begin, observe that the APL between two nodes in the (giant component) of the same M1, considering only level-1 edges, is . Next, we renormalize this level, combining all the nodes in each giant component of M1 into a single meta-node and then repeat the analysis for level 2 by only considering level-2 edges. This yields . In general, we get the recursive formula
| (9) |
(see Figure 3c).
To compute the average eccentricity of a node in a level-k component, we consider the level-k reduced (i.e., renormalized) network and the specific path that gives the eccentricity in this reduced network. On average, to get from the initial node to the farthest node, one must (i) make hops between different modules, (ii) take steps within each level-(k − 1) module, and (iii) traverse edges in the last module. This leads to the following recursive formula for the average eccentricity
| (10) |
(see Figure 3c).
Thus, for , the duration of the avalanche corresponding to a component at level k is of order . Recall that such a component has approximately nodes and arises with probability . Thus, we see that , a power law distribution with exponent , yet another standard signature of critical dynamics originating here not from underlying critical processes but rather from the underlying HM structure.
A third distribution which is often studied in critical systems is , which is the expected size of the avalanche given its duration. In the limit of large r, this expectation converges to for durations of order , thus
| (11) |
where
| (12) |
another power law (see Ref. 14 for comparison).
As discussed in Refs. 14, 27, general scaling theory predicts the identity
| (13) |
Observe that our exponent computations above satisfy precisely this result in the large r limit. (For comparison with Ref. 14 and related papers, note that we consider here cumulative distribution functions rather than the probability distribution functions which add 1 to the exponents.) However, whereas recent experimental results on universal scaling exponents and functions in neuronal avalanches on cortical slices have been cited as evidence of critical dynamics, in light of our new findings one must also consider the potential influence of an underlying HM network structure (particularly as one goes from small experimental samples to larger brain networks).
An additional prediction of critical theory considers the scaling of the function S(q, t) which is the average number of nodes “firing” at time q for an avalanche with duration t. The prediction is that
| (14) |
for some universal function . Figure 4 shows the simulation estimate of for two different values of t that differ by approximately a factor of 30, , and . The two estimates for are reasonably similar considering the scales involved; we would expect increasingly better agreement for larger values of based on the recursive structure of the HMNs. Thus, non-critical dynamical processes on HMNs appear to exhibit universal functions like those that arise for critical dynamical processes,27, 14 but probably require extremely large systems for convergence. Unfortunately, due to the discreteness of the component sizes, it is computationally prohibitive to analyze a wider variety of avalanche sizes without increasing both r and which require extremely large network simulations to analyze.
Figure 4.

Simulation results for H(q/t) for a HMN with r = 40, , comparing small avalanches (solid line) of approximate size 1000 to large ones (dashed line) of approximate size 30 000, both (a) before and (b) after rescalings.
DISCUSSION
In summary, we see that simple non-critical nodal dynamics in networks with a hierarchical modular structure can display many of the hallmarks of critical dynamics. An immediate implication of this finding is that hierarchical structure cannot always be treated as merely a passive player in the generation of critical dynamics in a network, but rather requires a careful analysis. This is particularly relevant for current experimental studies of neuronal avalanching in brain networks, where it is quite possible that both hierarchical structure and intrinsic critical dynamics are at play and that the two effects are mutually reinforcing, thereby magnifying the “criticality” of the observed behavior, a result consistent with the recent numerical experiments and analysis.26, 30 Our analysis, thus, provides direct theoretical insight and underpinnings into those numerical findings by identifying the simple mechanism at work in HM networks that contribute to their observed critical behavior (see Ref. 30 for a related analysis which utilizes a somewhat different approach). However, rather than solely serving to enhance any intrinsic critical dynamics that a network may have, a second possibility, fully consistent with our findings, is that hierarchical structure in neuronal networks might itself be responsible for generating critical behaviors even in the absence of intrinsic critical dynamics. Indeed, there are ongoing discussions in neuroscience about seemingly contradictory experimental observations regarding the existence of critical behaviors like SOC in neuronal networks. For example, the work of Dehghani et al.11 suggests that there is no power-law scaling of neuronal firings (at the neuronal level), whereas others such as Petermann et al.24 do find evidence of power laws at the level of the local-field potentials (LFPs). Our work suggests that findings about the presence or absence of critical behavior may depend on the spatial scale within the hierarchical structure that is being considered.
Finally, we remark that while our emphasis has been on understanding the influence of hierarchical modular structure on the dynamics of brain networks, HM architecture is also found in a great variety of engineered and naturally occurring networks (e.g., social networks, computer chips, genetics, the structure of large corporations, etc.). Thus, our finding of a structural mechanism capable of inducing power-law-like behavior should be broadly applicable to a host of other systems with a HM structure.
ACKNOWLEDGMENTS
The authors would like to thank Jerry Feldman, Richard Karp, Cris Moore, Pratik Mukherjee, and Steve Strogatz for helpful conversations, as well as the (anonymous) referees for their suggestions. This research has been supported by the NSF Grant CDI-0835706 (E.J.F.), the NIH Grant K25 NS-703689-01 (E.J.F.), and a W.M. Keck Foundation Grant (A.S.L.).
References
- Adamic L. and Adar E., “How to search a social network,” Soc. Networks 27(3), 187–203 (2005). 10.1016/j.socnet.2005.01.007 [DOI] [Google Scholar]
- Bailey N. T. J.et al. , The Mathematical Theory of Infectious Diseases and Its Applications (Charles Griffin & Company Ltd, 5a Crendon Street, High Wycombe, Bucks HP13 6LE., 1975). [Google Scholar]
- Bak P., Tang C., and Wiesenfeld K., “Self-organized criticality,” Phys. Rev. A 38(1), 364–374 (1988). 10.1103/PhysRevA.38.364 [DOI] [PubMed] [Google Scholar]
- Bedard C., Kroeger H., and Destexhe A., “Does the 1/f frequency scaling of brain signals reflect self-organized critical states?” Phys. Rev. Lett. 97(11), 118102 (2006). 10.1103/PhysRevLett.97.118102 [DOI] [PubMed] [Google Scholar]
- Beggs J. M. and Plenz D., “Neuronal avalanches in neocortical circuits,” J. Neurosci. 23(35), 11167–11177 (2003). [DOI] [PMC free article] [PubMed] [Google Scholar]
- Beggs J. M., “The criticality hypothesis: how local cortical networks might optimize information processing,” Philos. Trans. R. Soc. London, Ser. A 366(1864), 329–343 (2008). 10.1098/rsta.2007.2092 [DOI] [PubMed] [Google Scholar]
- Boettcher S., Cook J. L., and Ziff R. M., “Patchy percolation on a hierarchical network with small-world bonds,” Phys. Rev. E 80(4), 041115 (2009). 10.1103/PhysRevE.80.041115 [DOI] [PubMed] [Google Scholar]
- Bullmore E., Barnes A., Bassett D. S., Fornito A., Kitzbichler M., Meunier D., and Suckling J., “Generic aspects of complexity in brain imaging data and other biological systems,” Neuroimage 47(3), 1125–1134 (2009). 10.1016/j.neuroimage.2009.05.032 [DOI] [PubMed] [Google Scholar]
- Buxhoeveden D. P. and Casanova M. F., “The minicolumn hypothesis in neuroscience,” Brain 125(5), 935–951 (2002). 10.1093/brain/awf110 [DOI] [PubMed] [Google Scholar]
- Clauset A., Shalizi C. R., and Newman M. E. J., “Power-law distributions in empirical data,” SIAM Rev. 51(4), 661–703 (2009). 10.1137/070710111 [DOI] [Google Scholar]
- Dehghani N., Hatsopoulos N. G., Haga Z. D., Parker R. A., Greger B., Halgren E., Cash S. S., and Destexhe A., “Avalanche analysis from multielectrode ensemble recordings in cat, monkey, and human cerebral cortex during wakefullness and sleep,” Front. Physiol. 3(302), 2012. 10.3389/fphys.2012.00302 [DOI] [PMC free article] [PubMed] [Google Scholar]
- Erdős P. and Rényi A., “On the evolution of random graphs,” Publ. Math., Inst. Hung. Acad. Sci. 5, 17–61 (1960). [Google Scholar]
- Erwin D. H. and Davidson E. H., “The evolution of hierarchical gene regulatory networks,” Nature Rev. Genetics 10(2), 141–148 (2009). 10.1038/nrg2499 [DOI] [PubMed] [Google Scholar]
- Friedman N., Ito S., Brinkman B. A. W., Shimono M., DeVille R. E. L., Dahmen K. A., Beggs J. M., and Butler T. C., “Universal critical dynamics in high resolution neuronal avalanche data,” Phys. Rev. Lett. 108(20), 208102 (2012). 10.1103/PhysRevLett.108.208102 [DOI] [PubMed] [Google Scholar]
- Gazzaniga M. S., The Cognitive Neurosciences (The MIT, 2004). [Google Scholar]
- Kandel E. R., Schwartz J. H., Jessell T. M.et al. Principles of Neural Science (McGraw-Hill; New York, 2000), Vol. 4. [Google Scholar]
- Kleinberg J., “The convergence of social and technological networks,” Commun. ACM 51(11), 66–72 (2008). 10.1145/1400214.1400232 [DOI] [Google Scholar]
- Kuh E. S. and Ohtsuki T., “Recent advances in VLSI layout,” Proc. IEEE 78(2), 237–263 (1990). 10.1109/5.52212 [DOI] [Google Scholar]
- Kurose J. F. and Ross K. W., Computer Networking (Pearson/Addison Wesley, 2005). [Google Scholar]
- Levina A., Herrmann J. M., and Geisel T., “Dynamical synapses causing self-organized criticality in neural networks,” Nat. Phys. 3, 857–860 (2007). 10.1038/nphys758 [DOI] [Google Scholar]
- Newman M. E. J., “Power laws, pareto distributions and zipfs law,” Contemp. Phys. 46, 323 (2005). 10.1080/00107510500052444 [DOI] [Google Scholar]
- Newman M. E. J., Barabasi A. L., and Watts D. J., The Structure and Dynamics of Networks (Princeton University Press, 2006). [Google Scholar]
- Nogawa T. and Hasegawa T., “Monte carlo simulation study of the two-stage percolation transition in enhanced binary trees,” J. Phys. A: Mathematical and Theoretical 42, 145001 (2009). 10.1088/1751-8113/42/14/145001 [DOI] [Google Scholar]
- Petermann T., Thiagarajan T. C., Lebedev M. A., Nicolelis M. A. L., Chialvo D. R., and Plenz D., “Spontaneous cortical activity in awake monkeys composed of neuronal avalanches,” Proc. Natl. Acad. Sci. U.S.A. 106(37), 15921–15926 (2009). 10.1073/pnas.0904089106 [DOI] [PMC free article] [PubMed] [Google Scholar]
- Reed W. J. and Hughes B. D., “From gene families and genera to incomes and internet file sizes: Why power laws are so common in nature,” Phys. Rev. E 66(6), 067103 (2002). 10.1103/PhysRevE.66.067103 [DOI] [PubMed] [Google Scholar]
- Rubinov M., Sporns O., Thivierge J. P., and Breakspear M., “Neurobiologically realistic determinants of self-organized criticality in networks of spiking neurons,” PLoS Comput. Biol. 7(6), e1002038 (2011). 10.1371/journal.pcbi.1002038 [DOI] [PMC free article] [PubMed] [Google Scholar]
- Sethna J. P., Dahmen K. A., and Myers C. R., “Crackling noise,” Nature 410, 242 (2001). 10.1038/35065675 [DOI] [PubMed] [Google Scholar]
- Touboul J. and Destexhe A., “Can power-law scaling and neuronal avalanches arise from stochastic dynamics?” PLoS One 5(2), e8982 (2010). 10.1371/journal.pone.0008982 [DOI] [PMC free article] [PubMed] [Google Scholar]
- Viola P., Matthias M., and Michael W., “Subsampling effects in neuronal avalanche distributions recorded in vivo,” BMC Neurosci. 10(40), 2009. 10.1186/1471-2202-10-40 [DOI] [PMC free article] [PubMed] [Google Scholar]
- Wang S. J. and Zhou C., “Hierarchical modular structure enhances the robustness of self-organized criticality in neural networks,” New J. Phys. 14(2), 023005 (2012). 10.1088/1367-2630/14/2/023005 [DOI] [Google Scholar]
- Watts D. J., Dodds P. S., and Newman M. E. J., “Identity and search in social networks,” Science 296(5571), 1302–1305 (2002). 10.1126/science.1070120 [DOI] [PubMed] [Google Scholar]