

Abstract
The Gram-negative enteroinvasive bacterium Shigella flexneri is responsible for the endemic form of bacillary dysentery, an acute rectocolitis in humans. S. flexneri uses a type III secretion system to inject effector proteins into host cells, thus diverting cellular functions to its own benefit. Protective immunity to reinfection requires several rounds of infection to be elicited and is short-lasting, suggesting that S. flexneri interferes with the priming of specific immunity. Considering the key role played by T-lymphocyte trafficking in priming of adaptive immunity, we investigated the impact of S. flexneri on T-cell dynamics in vivo. By using two-photon microscopy to visualize bacterium–T-cell cross-talks in the lymph nodes, where the adaptive immunity is initiated, we provide evidence that S. flexneri, via its type III secretion system, impairs the migration pattern of CD4+ T cells independently of cognate recognition of bacterial antigens. We show that bacterial invasion of CD4+ T lymphocytes occurs in vivo, and results in cell migration arrest. In the absence of invasion, CD4+ T-cell migration parameters are also dramatically altered. Signals resulting from S. flexneri interactions with subcapsular sinus macrophages and dendritic cells, and recruitment of polymorphonuclear cells are likely to contribute to this phenomenon. These findings indicate that S. flexneri targets T lymphocytes in vivo and highlight the role of type III effector secretion in modulating host adaptive immune responses.
Keywords: host–pathogen cross-talks, imaging
The bacterium Shigella is an enteroinvasive pathovar of Escherichia coli that causes shigellosis, otherwise known as bacillary dysentery, an acute rectocolitis characterized by a rapid influx of polymorphonuclear neutrophils (PMNs) to the lamina propria that leads to massive tissue destruction (1, 2). Shigella’s pathogenesis relies on the expression of a type III secretion system (T3SS) and its secreted effector proteins. A first wave of secreted effectors are required for cellular invasion and initiation of the inflammatory innate response upon bacterial targeting of resident macrophages (Mϕs) and intestinal epithelial cells, whereas a second wave of T3SS effectors targets MAP kinases and the NF-κB signaling pathway to control the level of the induced inflammatory response (3–5).
Mechanisms and role of T3SS effectors leading to adaptive immunity to Shigella infection have been poorly investigated. Natural infection fails to elicit a long-lasting protective immunity, and several infection episodes are required to generate a short-term, mainly antibody-mediated protection (6, 7). This suggests that Shigella has evolved strategies to dampen the acquired immune response. The induced acute inflammation certainly contributes to the profile of the specific immunity. Indeed, acute inflammation has been associated with apoptotic cell death of T lymphocytes in rectal biopsies of infected individuals (8, 9), impairment of dendritic cell (DC) recruitment to the site of Shigella infection in a model of human intestinal xenotransplant (10), and the predominant priming of Shigella-specific CD4+ Th17 cells conferring limited protection against reinfection in a murine model of infection (11). Evidence suggests that CD8+ T lymphocytes are not required for protective immunity (11). In fact, antigen-specific CD8+ T cells fail to be primed upon Shigella infection (12). Information is also scant regarding Shigella’s capacity to subvert the host acquired immune responses by directly interacting with T or B lymphocytes. Such interactions may take place in the colonic lymphoid follicles after Shigella’s crossing of the intestinal barrier via M cells located within the follicle-associated epithelium, in the lamina propria, or the mesenteric lymph nodes (LNs) (5).
We recently demonstrated that Shigella invades activated, but not resting, human CD4+ T cells in vitro, leading to cell migration arrest toward a chemoattractant stimulus in a transwell migration assay (13). Whether this occurs in vivo is unknown. In addition, in vivo T cells rapidly integrate multiple signals from the environment to respond to infection, a scenario that is obviously absent in in vitro settings. Therefore, the present study aimed at investigating the targeting of CD4+ T cells by Shigella in vivo and its impact on T-cell dynamics. We used two-photon microscopy (2PM) to study Shigella–T lymphocyte cross-talks occurring early on in the draining popliteal LN upon footpad inoculation with Shigella. 2PM of live intact tissues has been recently applied to study immune cell dynamics in infectious settings (14, 15). The LN is of particular interest because it is within secondary lymphoid organs where pathogen-specific immune responses are orchestrated or fail to be generated. Furthermore, the microanatomy and function of the LN is highly conserved regardless of its body localization (reviewed in refs. 16–18).
We report here that Shigella induces CD4+ T-cell migration paralysis in vivo. This might represent a way to sabotage the host capacity to induce T-cell–mediated immunity and hence impede the priming of an effective protective response.
Results
S. flexneri Interacts with CD4+ T Cells in Subcapsular Sinus Interfollicular Regions of LN.
LNs are characterized by their highly organized architecture and cellular compartmentalization. The LN paracortex, where T cells home to interact with DCs, is largely inaccessible to lymph-borne antigens and pathogens, which accumulate in the LN subcapsular sinus (SCS) upon draining via lymphatic vessels (14, 15, 19). To assess where S. flexneri meets CD4+ T lymphocytes in the LN early on, polyclonal naive CD4+ T cells were labeled with the cytoplasmic dye carboxyfluorescein succinimidyl ester (CFSE) and adoptively transferred into BL6 mice. Approximately 18 h after transfer, mice were inoculated s.c. with physiological water (for uninfected conditions), DsRed-expressing WT, or T3SS-deficient (T3SS−) S. flexneri. The later strain was used to further analyze the impact of T3SS effectors on T-cell dynamics. Two-photon microscopy was used to generate 3D reconstructions of intact LNs. In uninfected LNs, T cells were mainly confined to the paracortex T-cell zone. However, in areas where the paracortex extends into the interfollicular regions, they were seen close to the SCS (Fig. 1A). Upon infection, T cells were distributed more diffusely at the periphery of the interfollicular areas (Fig. 1 B and C), migrating in between B-cell follicles to gain access to the SCS, where WT and T3SS− S. flexneri were largely found (Fig. 1D). Similar bacterial counts were recovered from WT and T3SS− infected LNs, thus allowing accurate comparison between the two strains and indicating that draining of Shigella into the LN is independent of T3SS effector secretion.
Fig. 1.

Visualizing S. flexneri and polyclonal CD4+ T-cell distribution in LNs. Two-photon microscopy reconstruction of the surface of uninfected and infected LNs, showing the capsule (blue, second harmonics), CFSE-labeled CD4+ T cells (green), and DsRed-expressing S. flexneri. (A) T-cell access to the SCS from the interfollicular regions in uninfected LNs (dashed square). T-cell proximity to the LN periphery in WT (B) or T3SS− S. flexneri-infected LNs (C) 4 h post inoculation. (D) S. flexneri accumulates in the LN SCS 4 h post s.c. inoculation.
Shigella Via Its T3SS Drastically Reduces CD4+ T-Cell Motility in LN.
Based on the aforementioned observations, T-cell migration was therefore tracked in the interfollicular regions, no deeper than 90 μm from the SCS. CD4+ T-cell dynamics were evaluated by using the three following parameters: (i) mean velocity; (ii) arrest coefficient, which represents the percentage of the tracked time an individual T-cell moves at velocities less than 4 μm/min [a T cell is considered arrested at velocities of less than 2 μm/min (20)]; and (iii) confinement index, which represents the ratio of the distance between the first and the last position of the cell to the length of the trajectory.
In uninfected LNs, the majority of the CD4+ T cells migrated with a typical random walk behavior, which refers to the multidirectional and rather stochastic nature of individual T-cell motion under homeostatic conditions (21). Only a small proportion of the cells were observed transiently migrating close to the SCS (Fig. 2A and Movie S1). The mean velocity was 8.9 ± 0.15 μm/min (SEM), with 63% of the cells exhibiting velocities higher than 8 μm/min and only 8% exhibiting velocities of slow migrating cells (<4 μm/min; Fig. 2 D and E). These cells also exhibited low arrest coefficients (23 ± 1%), with 64% stopping for less than 20% of the time, and only 3% stopping for more than 80% of the time. A direct correlation between high velocity and low arrest coefficient is consistent with T cells traveling under homeostatic conditions (Fig. S1A).
Fig. 2.
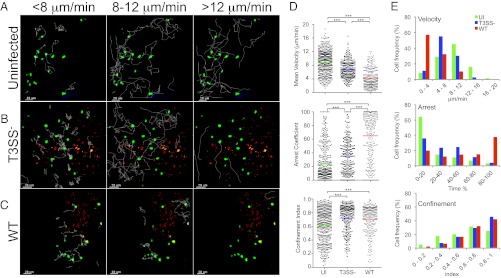
Polyclonal CD4+ T-cell migration patterns in the surface of the LN. (A–E) Two-photon microscopy analysis of CD4+ T-cell dynamics in LNs infected or not with T3SS− or WT S. flexneri. (A–C) T-cell track projections depicted as white lines in uninfected (A), T3SS− infected (B), or WT infected LNs (C). Tracks corresponding to T cells migrating at <8 μm/min (Left), 8 to 12 μm/min (Center), or >12 μm/min (Right) are overlaid on a one-time frame projection. (D) Three-dimensional quantification of mean velocity, confinement index, and arrest coefficient of T cells from individual tracks. Each symbol represents an individual cell. Colored horizontal lines indicate the mean value (***P < 0.0001, nonparametric one-way ANOVA, Kruskal–Wallis test; no P value indicates no statistical significance). Data are pooled from at least three independent experiments. (E) Distribution of T cells mean velocity, confinement index, and arrest coefficient under the various conditions tested.
Upon infection with T3SS− S. flexneri, T cells migrated at lower speeds (6.8 ± 0.16 μm/min), with an approximately twofold decrease in the percentage of cells (33%) exhibiting velocities higher than 8 μm/min, whereas the percentage of cells exhibiting velocities less than 4 μm/min was similar (Fig. 2 B, D, and E and Movie S2). The arrest coefficient was increased by approximately 1.5 fold (35 ± 2%). This resulted from a decrease in the percentage of cells exhibiting arrest coefficients less than 20% whereas the percentage of cells with arrest coefficients higher than 80% was similar. Confinement index was increased, indicating that T-cell migration area was more restricted. These T-cell dynamics are consistent with the behavior of polyclonal CD4+ T cells scanning the site of infection for possible recognition of cognate antigen (Fig. S1A) (21).
Infection with WT S. flexneri resulted in a marked decrease in T-cell velocities (4.2 ± 0.2 μm/min; Fig. 2C and Movie S3) compared with the T3SS− strain. Only 11% exhibited velocities higher than 8 μm/min (a threefold decrease), and almost 60% of the cells migrated at velocities lower than 4 μm/min (a 20 fold-increase; Fig. 2 D and E). The arrest coefficient increased by approximately 1.9 fold (65 ± 2%), with a 12-fold increase in the percentage of the cells stopping for more than 80% of the time (37%). The confinement index was not significantly different. These findings provide evidence that S. flexneri dramatically impairs T-cell migration in vivo by a mechanism dependent on the activity of the T3SS.
S. flexneri-Induced Impairment of CD4+ T-Cell Migration Is Independent of Cognate Recognition of Specific Bacterial Antigens.
Considering the global impact of S. flexneri on polyclonal CD4+ T-cell migration, it is unlikely that cognate recognition of S. flexneri antigens by T cells is involved, as only very few antigen-specific CD4+ T cells are present in polyclonal CD4+ T cells from naive mice (22). To rule out this possibility, experiments were carried out by using CD4+ T cells that express a transgenic receptor specific for the antigen ovalbumin (i.e., OT-II cells). By performing the experiment in the absence of ovalbumin, the OT-II cell dynamics are expected to reflect the environmental cues received by the cells. As observed with polyclonal CD4+ T cells, OT-II cells were present in the SCS interfollicular regions, readily scanning the tissue (Movies S4, S5, and S6). In uninfected and T3SS− S. flexneri-infected LNs, OT-II cells migrated at mean velocities of 5.4 ± 0.27 μm/min and 4.9 ± 18 μm/min, respectively, whereas, in WT S. flexneri-infected LNs, their mean velocity decreased to 2.8 ± 0.09 μm/min (Fig. 3A). A similar arrest coefficient was observed in uninfected and T3SS− S. flexneri-infected LNs, with 20% to 30% of OT-II cells displaying velocities of less than than 4 μm/min for more than 80% of the time, whereas the arrest coefficient increased in WT S. flexneri-infected LNs with 60% of OT-II cells displaying velocities of less than than 4 μm/min for more than 80% of the time (Fig. 3 A and B). As with polyclonal T cells, OT-II cell mean velocities were linearly correlated with arrest coefficients and experienced similar confinement in all conditions (Fig. 3C and Fig. S1). These results demonstrate that the changes in CD4+ T-cell migration pattern triggered by S. flexneri are independent of antigen-specific recognition and confirm the key role played by the S. flexneri T3SS effectors in the induction of inhibitory signals leading to the alteration of T lymphocyte dynamics.
Fig. 3.

OT-II T cells exhibit similar migration patterns as polyclonal CD4+ T cells. Two-photon microscopy analysis of OT-II T-cell dynamics in the surface of intact LNs infected or not with T3SS− or WT S. flexneri. (A) Mean velocity, (B) arrest coefficient, and (C) confinement index of OT-II T cells calculated from individual tracks. Each symbol represents an individual cell. Colored horizontal lines indicate the mean value (*P < 0.02 and ***P < 0.0001, nonparametric one-way ANOVA, Kruskal–Wallis test; no P value indicates no statistical significance). Data are pooled from at least three independent experiments.
S. flexneri Invades CD4+ T Cells in Vivo, and Invaded Cells Are Arrested.
We observed that, in LNs infected with WT S. flexneri, the effects of infection on T-cell dynamics were more pronounced with OT-II cells than with polyclonal CD4+ T cells (Fig. S1). Indeed, the mean velocity of OT-II cells was decreased by 1.5 fold. The arrest coefficient was increased, with a 1.6-fold increase of OT-II cells stopping for more than 80% of the time (Fig. S1). When focusing on this cell population, we noticed that numerous arrested cells (displaying velocities ≤2 μm/min) were invaded (Fig. 4 and Movie S6). These results provide evidence that S. flexneri invades T cells in vivo with a subsequent drastic effect on their migration pattern.
Fig. 4.

WT S. flexneri invades OT-II cells in vivo and infected cells are arrested. (A) Orthogonal views of OT-II cells infected with WT S. flexneri. (B) Two-photon microscopy image representative of LNs infected with S. flexneri. Arrows point to S. flexneri-invaded OT-II cells. (C) Confinement index and mean velocity of OT-II cells shown in B, underscoring the arrest of OT-II T cells invaded by S. flexneri.
Altered Speed and Migration Patterns of CD4+ T Cells Are Not Exclusively Driven by Direct Cell–Bacterium Contact.
As bacteria in LNs were largely restricted to the SCS, it remained possible that the CD4+ T-cell migration patterns were driven by the proximity to the infection foci. To address this possibility, the imaged volume at each condition was divided into 25-μm sections in depth. The sections were projected in space and time to visualize the infection foci in relationship to the migrating cells (Fig. 5 A–C), and the instantaneous speed of polyclonal CD4+ T cells in the sections was plotted for each condition (Fig. 5D). Whereas bacterial fluorescence was mainly observed within the first 50 μm of the imaged volume (Fig. 5 B and C), the average speed was unchanged throughout the entire volume, with significant differences between T3SS− and WT S. flexneri-infected LNs remaining throughout the varying depths (Fig. 5D). These results indicate that the migration patterns of CD4+ T cells are not exclusively driven by proximity to S. flexneri infection foci.
Fig. 5.

The LN environment induced in the SCS area during infection dictates CD4+ T-cell speed and migration patterns. T-cell instantaneous speed determined at increasing depths from the capsule under infected or uninfected conditions. (A–C) Maximum intensity projections in space and time of 25-μm sections, depicting the T-cell trajectories (green) at the infection foci (red). (D) Instantaneous speed of T cells in the three sections analyzed. Data are representative of at least three independent experiments.
One may hypothesize that the S. flexneri-induced environment in the LN impacts T-cell motility, with T cells responding to environmental signals released or induced by S. flexneri-infected cells. As bacteria remained restricted to the SCS, where sinus Mϕs and resident DCs strategically line the floor of the SCS and trap antigens and pathogens upon entry (15, 23–26), we investigated the interactions of S. flexneri with these cells. Sinus Mϕs were labeled in vivo with anti-CD169 FITC-conjugated antibody injected into the footpad. In uninfected mice, the sinus Mϕs were clearly seen as a layer of interconnected cells ∼20 μm in thickness (Fig. S2A). S. flexneri was readily found in tight association with or inside sinus Mϕs at 4 h after inoculation (Fig. S2B). By using CD11c-YFP reporter mice, resident CD11c-YFPHi DCs were visualized lining the floor of the SCS and extending well beneath into the LN paracortex. Multiple intracellular bacteria were detected within DCs (Fig. S2 C and D).
When using LysM-GFP reporter mice and intravital imaging to analyze the ability of S. flexneri to induce PMN recruitment, infiltrating PMNs scanning infected areas and engulfing bacteria were also observed (Fig. S3). These findings suggest that S. flexneri, when entering the LN, may modulate the local environment by interacting with sinus Mϕs and DCs and recruiting PMNs.
Discussion
Priming of long-term protective immunity to acute infection is a complex process with T-cell activation being a key element for eliciting efficient humoral and cell-mediated immune responses. T-cell activation relies on productive encounters between antigen-presenting cells bearing foreign antigens and cognate T lymphocytes, which are present at low frequencies. Motility of naive T cells within lymphoid structures is of utmost importance for these encounters to occur rapidly and efficiently (16, 27), and high motility coefficients have been proposed to play a role in optimizing the effector response to pathogens (28).
Here, we provide evidence that S. flexneri impairs the dynamics of polyclonal CD4+ T cells attracted to the SCS where S. flexneri mainly resides, either extracellularly or intracellularly in SCS macrophages and DCs. Both recruitment of T cells in this particular area of the LN and containment of the bacteria within the SCS are consistent with previous studies reporting on the dynamic imaging of host–pathogen interactions in vivo (14). The region directly beneath the SCS has been proposed to be a previously underappreciated location where lymphocytes are primed (14).
The present study reveals that T-cell targeting by Shigella occurs in vivo, including cell invasion and cell migration inhibition. Indeed, we show that S. flexneri, via its T3SS, dramatically impacts T-cell migration patterns by (i) invading T lymphocytes and (ii) influencing the local LN environment. T-cell invasion results in cell migration characterized by velocities of less than 2 μm/min for more than 80% of the imaged time. It is noteworthy that, surprisingly, T-cell invasion in vivo was observed with OT-II cells but not polyclonal CD4+ T cells. Why OT-II T cells are more efficiently invaded by Shigella than polyclonal T cells remains unclear at the moment, and might reflect subtle differences in phenotype and/or activation state. Alternatively, differences in the local microenvironment following transfer of OT-II vs. polyclonal T cells might influence the rate of invasion. The observation that migration parameters are similarly affected regardless of the T-cell proximity to the bacteria suggests that S. flexneri triggers signals that modify the LN local environment. Several studies have shown that inflammation alters the integrity of the LN microenvironment and therefore the immunocompetence of the host (16). Shigella-induced acute inflammation has been studied extensively, and both resident Mϕ pyroptosis accompanied by IL-1β release and PMN recruitment upon IL-8 production by invaded intestinal epithelial cells are known to be crucial steps for initiating the inflammatory process within the colonic mucosa (10). Indeed, IL-1β was detected in the LN 24 h post S. flexneri inoculation, which might reflect pyroptosis of SCS Mϕs shown here to carry intracellular S. flexneri. In addition, the observed S. flexneri-induced PMN recruitment in the LN is likely to affect the microenvironment. Recent reports provide evidence that, upon infection, PMN accumulation within the LN SCS contributes to the shaping of the LN microenvironment and subsequently the immune response (24). In this context, the T-cell dynamics might reflect a complex tissue environment, where inhibition of migration could result from (i) tissue injury, for example, the degradation of the T-cell reticular network, composed of collagen fibers, extracellular matrix, and fibroblastic reticular cells that facilitate T-cell motility; (ii) display of a variety of adhesion or recognition molecules by activated, invaded, dead, or dying cells that cause nonspecific interactions with lymphocytes; and/or (iii) cellular overcrowding from excessive recruitment of neutrophils. Further studies will be required to delineate the role of the different components of the Shigella-induced inflammation. Besides, it would be interesting to develop the appropriate tools to assess in vivo the dynamics of Shigella–T cell interactions in terms of bacterial invasion vs. “injection-only” of T3SS effectors into T cells. Indeed, we have reported that injection of T3SS effectors such as the virulence protein IpgD may occur in vitro in the absence of invasion, thus contributing to the impairment of T-cell migration (13). We propose that the global impact on T-cell migration induced by Shigella certainly affects the key steps required for the initiation of the specific response, such as DC–T cell interactions as well as recirculation after priming. It is therefore likely that the impairment of T-cell dynamics we report here is one of the mechanisms contributing to the induction of a poorly efficient Shigella-specific immune response upon natural infection.
The present study reports the manipulation of T-cell dynamics within the LN upon bacterial infection. Indeed, the dynamic imaging of host–pathogen interactions in vivo focusing on T-cell behavior in LNs has been reported so far for parasites and viruses only (24, 29–33), whereas dynamic imaging of T-cell behavior upon bacterial infections has been studied in the spleen and in the liver upon Listeria monocytogenes (34) and bacillus Calmette–Guérin infection (35), respectively. Tissue imaging allows more coherent analysis of an infected tissue for a much better understanding of bacterial pathogenesis within the live host. Such all-inclusive approaches promise to reveal relevant interactions and angles for disease intervention (36). Altogether, this study contributes to a better understanding of the complex interactions between bacteria and cells of the adaptive immune system. It also emphasizes the role of T3SS and its secreted effectors in the manipulation of the adaptive response in vivo, a so far very poorly studied topic (37). It would be worthwhile to take into account these findings for revisiting the design of live, attenuated Shigella vaccine candidates.
Materials and Methods
Bacterial Strains, Animals, and Infection.
The WT invasive strain of S. flexneri serotype 5a (38) and the T3SS− noninvasive variant (∆mxiD) (39) expressing the pMW211 plasmid (40) carrying a DsRed variant downstream of a constitutive promoter were used. Pathogen-free female mice were purchased from Janvier. CD11c:EYFP mice (expressing enhanced YFP under the control of the CD11c promoter) and Rag−/− OT-II mice were bred in our facilities. For infection, mice were given 5 to 7 × 10⁸ bacteria s.c. (hind paws) in 40-μL volumes. Popliteal LNs where chosen for the ease and reproducibility of delivering bacteria by footpad inoculation. Bacterial counts were determined by an overnight 37 °C incubation of 100-µL volume of LN cell suspensions on trypticase soy (Becton Dickinson) agar plates containing 0.01% Congo red (Serva).All procedures involving animals were approved by the Institut Pasteur Safety Committee in accordance with French and European guidelines.
Cell Purification and Transfer.
CD4+ T cells were isolated by magnetic depletion and autoMACS system (Miltenyi Biotec) from the LNs and spleens of C57BL/6 mice. OT-II cells were isolated from the LNs and spleens of Rag−/− OT-II TCR transgenic mice. T cells were labeled with 5 μM CFSE (Invitrogen) for 10 min at 37 °C (41), and 15 × 106 T cells were adoptively transferred into recipient WT C57BL/6 female mice by i.v. injection. T-cell transfer was performed ∼18 h before bacterial inoculation. For the visualization of SCS macrophages, 20 μL of FITC-conjugated CD169-specific antibody (AbD Serotec) was injected in the footpad 2 h after bacterial inoculation, and LNs were recovered 2 h after antibody injection (i.e., at 4 h post infection).
Two-Photon Microscopy.
LNs were carefully collected by using a dissecting microscope without inducing macroscopic damage or opening the capsula. Two-photon microscopy was performed on explanted LNs perfused with oxygenated RPMI media, as previously described, with minor modifications (41, 42). An LSM 710 laser-scanning microscope (Zeiss) equipped with a 40× objective with numerical aperture of 0.8 (Achroplan; Zeiss) was used to image 200 × 200-μm frames of 60- to 100-μm stacks scanned in 3- to 4-μm steps with no image average (30 s per stack) for as long as 90 min (usually no less than 40 min). The Chameleon Ultra Ti:Sapphire laser (Coherent) was tuned at 900 nm. Signals were collected using four nondescanned detectors (Zeiss) and appropriate dichroic filters and mirrors (Semrock). The capsule was visualized by second harmonics as follows. The two-photon microscope (LSM710 Meta; Zeiss) was used with a Ti:Sapphire femtosecond laser (140 fs, 90 Mhz) tunable from 690 to 1,040 nm (Chameleon Ultra II; Coherent) and a Zeiss W Plan-Apochromat 20× objective (1.0 NA, water immersion, axial resolutions Rxy of 0.64 mm and Rz of 5 mm). The excitation output wavelength was 820 nm. The second harmonic generation signal was detected through a bandwidth filter 395 to 425 nm of a nondescanned detector in a backscattering geometry. All movies were analyzed by using Imaris software (version 7.2; Bitplane).
Data Analysis and Statistics.
Three-dimensional cell tracking was performed by using Imaris software (Bitplane) with the spot detection function. Only cell tracks longer than 10 min were included in the analysis. The Imaris software provided the mean velocity of individual T-cell tracks, straightness, and instantaneous speed. Straightness was defined as the ratio of the straight distance of the cell from the origin to the total distance traveled. The straightness value was used to calculate the confinement index (i.e., 1 − straightness). The arrest coefficient of an individual T cell was defined as the percentage of time the cell instantaneous velocity was less than 4 μm/min. A T cell was considered arrested if the mean velocity was less than 2 μm/min. Images and movies were compressed with ImageJ. Statistical analysis was determined by using nonparametric one-way ANOVA, Kruskal–Wallis test. A P value of less than 0.05 was considered significant.
Supplementary Material
Acknowledgments
We thank the members of the Pathogénie Microbienne Moléculaire unit for helpful discussions, in particular Claude Parsot and Ilia Belotserkovsky; Patrick M. Schlievert (University of Iowa) for advice and critical reading of the manuscript; Emmanuelle Perret and Anne Danckaert (Platform for Dynamic Imaging Studies) for imaging and data analysis support; Gerald Eberl and Shinichiro Sawa (Institut Pasteur) for reagents and help with fluorescence immunohistochemistry; Sabrina Nabti (Institut National de la Santé et de la Recherche Médicale Unit U932, Institut Curie) for the initial Rag−/− OT-II T-cell receptor transgenic mouse breeding pairs; and Cecile Arrieumerlou and Dirk Bumann (Biozentrum, University Basel) for pMW211 plasmid. This work was supported by Institut Pasteur Programme Transversal de Recherche project no. 251, the Domaine d'Intérêt Majeur Malinf-Région Île de France, Agence Nationale de la Recherche project “PATHIMMUN,” Ministère des Affaires Etrangères Projet P2R, Pasteur Foundation (W.S.-P.), and Philippe Foundation (W.S.-P.). P.J.S. is supported by the European Research Council (ERC) (project Homeopith); he is a Howard Hughes Medical Institute Foreign Scholar.
Footnotes
The authors declare no conflict of interest.
See QnAs on page 4437.
This article contains supporting information online at www.pnas.org/lookup/suppl/doi:10.1073/pnas.1300981110/-/DCSupplemental.
References
- 1.Mathan MM, Mathan VI. Morphology of rectal mucosa of patients with shigellosis. Rev Infect Dis. 1991;13(suppl 4):S314–S318. doi: 10.1093/clinids/13.supplement_4.s314. [DOI] [PubMed] [Google Scholar]
- 2.Perdomo OJ, et al. Acute inflammation causes epithelial invasion and mucosal destruction in experimental shigellosis. J Exp Med. 1994;180(4):1307–1319. doi: 10.1084/jem.180.4.1307. [DOI] [PMC free article] [PubMed] [Google Scholar]
- 3.Ashida H, Ogawa M, Mimuro H, Sasakawa C. Shigella infection of intestinal epithelium and circumvention of the host innate defense system. Curr Top Microbiol Immunol. 2009;337:231–255. doi: 10.1007/978-3-642-01846-6_8. [DOI] [PubMed] [Google Scholar]
- 4.Parsot C, Sansonetti PJ. Invasion and the pathogenesis of Shigella infections. Curr Top Microbiol Immunol. 1996;209:25–42. doi: 10.1007/978-3-642-85216-9_2. [DOI] [PubMed] [Google Scholar]
- 5.Phalipon A, Sansonetti PJ. Shigella’s ways of manipulating the host intestinal innate and adaptive immune system: A tool box for survival? Immunol Cell Biol. 2007;85(2):119–129. doi: 10.1038/sj.icb7100025. [DOI] [PubMed] [Google Scholar]
- 6.Raqib R, et al. Innate immune responses in children and adults with Shigellosis. Infect Immun. 2000;68(6):3620–3629. doi: 10.1128/iai.68.6.3620-3629.2000. [DOI] [PMC free article] [PubMed] [Google Scholar]
- 7.Raqib R, et al. Delayed and reduced adaptive humoral immune responses in children with shigellosis compared with in adults. Scand J Immunol. 2002;55(4):414–423. doi: 10.1046/j.1365-3083.2002.01079.x. [DOI] [PubMed] [Google Scholar]
- 8.Islam MM, Azad AK, Bardhan PK, Raqib R, Islam D. Pathology of shigellosis and its complications. Histopathology. 1994;24(1):65–71. doi: 10.1111/j.1365-2559.1994.tb01272.x. [DOI] [PubMed] [Google Scholar]
- 9.Raqib R, et al. Apoptosis in acute shigellosis is associated with increased production of Fas/Fas ligand, perforin, caspase-1, and caspase-3 but reduced production of Bcl-2 and interleukin-2. Infect Immun. 2002;70(6):3199–3207. doi: 10.1128/IAI.70.6.3199-3207.2002. [DOI] [PMC free article] [PubMed] [Google Scholar]
- 10.Sperandio B, et al. Virulent Shigella flexneri subverts the host innate immune response through manipulation of antimicrobial peptide gene expression. J Exp Med. 2008;205(5):1121–1132. doi: 10.1084/jem.20071698. [DOI] [PMC free article] [PubMed] [Google Scholar]
- 11.Sellge G, et al. Th17 cells are the dominant T cell subtype primed by Shigella flexneri mediating protective immunity. J Immunol. 2010;184(4):2076–2085. doi: 10.4049/jimmunol.0900978. [DOI] [PubMed] [Google Scholar]
- 12.Jehl SP, et al. Antigen-specific CD8(+) T cells fail to respond to Shigella flexneri. Infect Immun. 2011;79(5):2021–2030. doi: 10.1128/IAI.00939-10. [DOI] [PMC free article] [PubMed] [Google Scholar]
- 13.Konradt C, et al. The Shigella flexneri type three secretion system effector IpgD inhibits T cell migration by manipulating host phosphoinositide metabolism. Cell Host Microbe. 2011;9(4):263–272. doi: 10.1016/j.chom.2011.03.010. [DOI] [PubMed] [Google Scholar]
- 14.Coombes JL, Robey EA. Dynamic imaging of host-pathogen interactions in vivo. Nat Rev Immunol. 2010;10(5):353–364. doi: 10.1038/nri2746. [DOI] [PubMed] [Google Scholar]
- 15.Konjufca V, Miller MJ. Two-photon microscopy of host-pathogen interactions: Acquiring a dynamic picture of infection in vivo. Cell Microbiol. 2009;11(4):551–559. doi: 10.1111/j.1462-5822.2009.01289.x. [DOI] [PubMed] [Google Scholar]
- 16.Junt T, Scandella E, Ludewig B. Form follows function: lymphoid tissue microarchitecture in antimicrobial immune defence. Nat Rev Immunol. 2008;8(10):764–775. doi: 10.1038/nri2414. [DOI] [PubMed] [Google Scholar]
- 17.Neyt K, Perros F, GeurtsvanKessel CH, Hammad H, Lambrecht BN. Tertiary lymphoid organs in infection and autoimmunity. Trends Immunol. 2012;33(6):297–305. doi: 10.1016/j.it.2012.04.006. [DOI] [PMC free article] [PubMed] [Google Scholar]
- 18.Glaysher BR, Mabbott NA. Isolated lymphoid follicle maturation induces the development of follicular dendritic cells. Immunology. 2007;120(3):336–344. doi: 10.1111/j.1365-2567.2006.02508.x. [DOI] [PMC free article] [PubMed] [Google Scholar]
- 19.Mueller SN, Hickman HD. In vivo imaging of the T cell response to infection. Curr Opin Immunol. 2010;22(3):293–298. doi: 10.1016/j.coi.2009.12.009. [DOI] [PubMed] [Google Scholar]
- 20.Filipe-Santos O, et al. A dynamic map of antigen recognition by CD4 T cells at the site of Leishmania major infection. Cell Host Microbe. 2009;6(1):23–33. doi: 10.1016/j.chom.2009.04.014. [DOI] [PubMed] [Google Scholar]
- 21.Breart B, Bousso P. Cellular orchestration of T cell priming in lymph nodes. Curr Opin Immunol. 2006;18(4):483–490. doi: 10.1016/j.coi.2006.05.006. [DOI] [PubMed] [Google Scholar]
- 22.Riggs T, et al. A comparison of random vs. chemotaxis-driven contacts of T cells with dendritic cells during repertoire scanning. J Theor Biol. 2008;250(4):732–751. doi: 10.1016/j.jtbi.2007.10.015. [DOI] [PMC free article] [PubMed] [Google Scholar]
- 23.Amino R, et al. Quantitative imaging of Plasmodium transmission from mosquito to mammal. Nat Med. 2006;12(2):220–224. doi: 10.1038/nm1350. [DOI] [PubMed] [Google Scholar]
- 24.Chtanova T, et al. Dynamics of neutrophil migration in lymph nodes during infection. Immunity. 2008;29(3):487–496. doi: 10.1016/j.immuni.2008.07.012. [DOI] [PMC free article] [PubMed] [Google Scholar]
- 25.Iannacone M, et al. Subcapsular sinus macrophages prevent CNS invasion on peripheral infection with a neurotropic virus. Nature. 2010;465(7301):1079–1083. doi: 10.1038/nature09118. [DOI] [PMC free article] [PubMed] [Google Scholar]
- 26.Junt T, et al. Subcapsular sinus macrophages in lymph nodes clear lymph-borne viruses and present them to antiviral B cells. Nature. 2007;450(7166):110–114. doi: 10.1038/nature06287. [DOI] [PubMed] [Google Scholar]
- 27.Bousso P. T-cell activation by dendritic cells in the lymph node: Lessons from the movies. Nat Rev Immunol. 2008;8(9):675–684. doi: 10.1038/nri2379. [DOI] [PubMed] [Google Scholar]
- 28.Nicholson D, Nicholson LB. A simple immune system simulation reveals optimal movement and cell density parameters for successful target clearance. Immunology. 2008;123(4):519–527. doi: 10.1111/j.1365-2567.2007.02721.x. [DOI] [PMC free article] [PubMed] [Google Scholar]
- 29.Millington OR, et al. Malaria impairs T cell clustering and immune priming despite normal signal 1 from dendritic cells. PLoS Pathog. 2007;3(10):1380–1387. doi: 10.1371/journal.ppat.0030143. [DOI] [PMC free article] [PubMed] [Google Scholar]
- 30.Bajénoff M, et al. Natural killer cell behavior in lymph nodes revealed by static and real-time imaging. J Exp Med. 2006;203(3):619–631. doi: 10.1084/jem.20051474. [DOI] [PMC free article] [PubMed] [Google Scholar]
- 31.John B, et al. Dynamic Imaging of CD8(+) T cells and dendritic cells during infection with Toxoplasma gondii. PLoS Pathog. 2009;5(7):e1000505. doi: 10.1371/journal.ppat.1000505. [DOI] [PMC free article] [PubMed] [Google Scholar]
- 32.Hickman HD, et al. Direct priming of antiviral CD8+ T cells in the peripheral interfollicular region of lymph nodes. Nat Immunol. 2008;9(2):155–165. doi: 10.1038/ni1557. [DOI] [PubMed] [Google Scholar]
- 33.Harris TH, et al. Generalized Lévy walks and the role of chemokines in migration of effector CD8+ T cells. Nature. 2012;486(7404):545–548. doi: 10.1038/nature11098. [DOI] [PMC free article] [PubMed] [Google Scholar]
- 34.Aoshi T, et al. Bacterial entry to the splenic white pulp initiates antigen presentation to CD8+ T cells. Immunity. 2008;29(3):476–486. doi: 10.1016/j.immuni.2008.06.013. [DOI] [PubMed] [Google Scholar]
- 35.Egen JG, et al. Macrophage and T cell dynamics during the development and disintegration of mycobacterial granulomas. Immunity. 2008;28(2):271–284. doi: 10.1016/j.immuni.2007.12.010. [DOI] [PMC free article] [PubMed] [Google Scholar]
- 36.Richter-Dahlfors A, Rhen M, Udekwu K. Tissue microbiology provides a coherent picture of infection. Curr Opin Microbiol. 2012;15(1):15–22. doi: 10.1016/j.mib.2011.10.009. [DOI] [PubMed] [Google Scholar]
- 37.Marketon MM, DePaolo RW, DeBord KL, Jabri B, Schneewind O. Plague bacteria target immune cells during infection. Science. 2005;309(5741):1739–1741. doi: 10.1126/science.1114580. [DOI] [PMC free article] [PubMed] [Google Scholar]
- 38.Sansonetti PJ, d’Hauteville H, Formal SB, Toucas M. Plasmid-mediated invasiveness of “Shigella-like” Escherichia coli. Ann Microbiol (Paris) 1982;133(3):351–355. [PubMed] [Google Scholar]
- 39.Allaoui A, Sansonetti PJ, Parsot C. MxiD, an outer membrane protein necessary for the secretion of the Shigella flexneri lpa invasins. Mol Microbiol. 1993;7(1):59–68. doi: 10.1111/j.1365-2958.1993.tb01097.x. [DOI] [PubMed] [Google Scholar]
- 40.Sörensen M, et al. Rapidly maturing red fluorescent protein variants with strongly enhanced brightness in bacteria. FEBS Lett. 2003;552(2-3):110–114. doi: 10.1016/s0014-5793(03)00856-1. [DOI] [PubMed] [Google Scholar]
- 41.Celli S, Bousso P. Intravital two-photon imaging of T-cell priming and tolerance in the lymph node. Methods Mol Biol. 2007;380:355–363. doi: 10.1007/978-1-59745-395-0_22. [DOI] [PubMed] [Google Scholar]
- 42.Azar GA, Lemaître F, Robey EA, Bousso P. Subcellular dynamics of T cell immunological synapses and kinapses in lymph nodes. Proc Natl Acad Sci USA. 2010;107(8):3675–3680. doi: 10.1073/pnas.0905901107. [DOI] [PMC free article] [PubMed] [Google Scholar]
Associated Data
This section collects any data citations, data availability statements, or supplementary materials included in this article.