

Abstract
Type zero copper is a hard-ligand analogue of the classical type 1 or blue site in copper proteins that function as electron transfer (ET) agents in photosynthesis and other biological processes. The EPR spectroscopic features of type zero CuII are very similar to those of blue copper, although lacking the deep blue color, owing to the absence of thiolate ligation. We have measured the rates of intramolecular ET from the pulse radiolytically generated C3-C26 disulfide radical anion to the CuII in both type zero C112D/M121L and type 2 C112D Pseudomonas aeruginosa azurins in pH 7.0 aqueous solutions between 8 and 45 °C. We also have obtained rate/temperature (10 to 30 °C) profiles for ET reactions between these mutants and the wild type azurin. Analysis of the rates and activation parameters for both intramolecular and intermolecular ET reactions indicates that the type zero copper reorganization energy falls in a range (0.9–1.1 eV) slightly above that for type 1 (0.7–0.8 eV), but substantially smaller than that for type 2 (> 2 eV), consistent with XAS and EXAFS data that reveal minimal type zero site reorientation during redox cycling.
Introduction
While relatively few elements of the periodic table find biological use, yet fewer participate in physiological electron transfer (ET) reactions; here, iron and copper are the main players.1 Iron is typically suited for its roles in biological ET by incorporation into porphyrin cofactors or assembly into inorganic iron-sulfur clusters. These modalities of iron binding allow for efficient electron transfer via the FeIII/II couple with reduction potentials tuned across a very large window. Side-chain-ligated copperII/I active sites also span a wide potential range, owing to the key role played by noncovalent interactions between outer-sphere residues and the metal center.2,3
Protein copper sites have been classified according to their spectroscopic and reactivity properties. Type 1 copper ET proteins feature hydrogen-bonded cysteine thiolate ligation that gives rise to unique spectroscopic and reactivity properties.4,5 Specifically, this highly covalent (~ 40% Cu character) CuII-S(Cys) bond is responsible for an intense (ε ~ 5,000 M−1 cm−1) ligand to metal charge transfer (LMCT) band in the optical absorption spectrum as well as unusually narrow hyperfine splitting (A|| ~ 5 mK) in the CuII EPR spectrum. A complex network of hydrogen bonds linking inner and outer coordination spheres (the “rack”) confers a low reorganization energy on type 1 copper sites.6,7 Together, the high coupling through the thiolate, a low reorganization energy, and widely tunable reduction potentials of type 1 copper sites make for efficient, versatile ET domains that are essential components of diverse processes such as photosynthesis,8 dioxygen activation,9–11 and nitrogen cycling.12
We have recently reported the construction and characterization of a novel copper binding site within mutated Pseudomonas aeruginosa azurin that demonstrates EPR spectroscopic properties of type 1 copper and exhibits enhanced ET reactivity over type 2 or “normal” copper (weak visible absorption, A|| ~ 15 mK);5 we named this the “type zero copper” binding site.13,14 In short, type zero sites arise when C112 is replaced by aspartate and M121 is substituted by noncoordinating amino acids (L, F, I); this leads to adoption of tetrahedral site geometry as the CuII interacts more strongly with the backbone carbonyl of G45 (CuII-O(G45) = ~2.4 Å). This structural rearrangement propagates to D112, which rotates to a decidedly monodentate coordination configuration, with the noncoordinating oxygen positioned to hydrogen bond with the amide protons of N47 and F114. We suggested that the restoration of the “rack” hydrogen bond network enhances the ET reactivity of type zero copper over that of the type 2 C112D protein. Comparison of rates of ET from azurins to self-assembled monolayer (SAM) modified Au electrodes supports this claim, as there is an order of magnitude rate increase on going from type 2 to type zero copper.14 Such a result has interesting implications for designed ET architectures in polypeptide matrices, especially considering the importance ascribed to thiolate ligation for copper-based ET reactivity. To this end, we have investigated both inter- and intramolecular ET reactions of type zero copper to determine both coupling and reorganization parameters within this system. We also report spectroscopic and structural data for type zero CuI azurin.
Materials and Methods
Materials
All chemicals were used as obtained. Milli-Q water (18.2 MΩ) was used in the preparation of all buffers and solutions.
Protein Expression and Purification
Both C112D and C112D/M121L P. aeruginosa azurins were expressed and purified as published previously.14 As recombinantly expressed azurins are isolated with a substantial ZnII population,15,16 this material was reserved and purified separately. The wild-type (WT) protein was expressed in a similar fashion, but was purified by a divergent procedure; following isolation from cellular debris, 1:10 volume of 100 mM CuSO4 was added to the periplasmic fraction. Metalation was allowed to proceed for 30 minutes, after which time 1:10 volume of 500 mM ammonium acetate pH 4.5 was added to the solution and the pH was adjusted to 4.6 using glacial acetic acid. Acid-precipitated contaminants were removed by centrifugation. The crude blue solution was repeatedly concentrated in an Amicon cell fitted with a YM-10 membrane and diluted with 50 mM ammonium acetate at pH 4.5 to remove low-molecular weight contaminants and adjust the ionic strength of the solution. This material was applied to a HiLoad SP Sepharose 26/10 FPLC column and eluted by a pH gradient using 50 mM ammonium acetate at pH 9.0. Portions of this material were then dialyzed against 100 mM potassium phosphate, containing 500 mM potassium cyanide, at pH 8.0 to remove contaminating ZnII. Cyanide was removed by repeated dialysis against 50 mM Tris at pH 7.5. The holoprotein was reconstituted by two 1-hour dialyses against 50 mM Tris pH 7.5 containing 10 mM CuSO4. Excess CuII was removed by dialysis against 15 mM sodium acetate at pH 4.6. Protein was purified to homogeneity on a MonoS 10/10 cation exchange column by a gradient from 15 to 300 mM sodium acetate at pH 4.6.
P. aeruginosa cytochrome c551 (cytc) was expressed recombinantly in dual-transformed E. coli BL21(DE3): one plasmid contained the periplasmically-tagged cytc gene while a second plasmid bore eight genes to facilitate protein biosynthesis.17 A 50 mL starter culture in Luria-Bertani (LB) medium was incubated with shaking for 24 h at 37 °C. This culture was harvested, resuspended in Terrific Broth (TB) medium, and added to 6 L TB medium (3×2L cultures in 6L Erlenmeyer flasks). The expression culture was incubated at 37 °C with shaking for 15 h. Protein was extracted, following culture harvesting, and osmotic shock. The extract was concentrated in an Amicon cell fitted with a YM-10 membrane and exchanged into 10 mM Tris at pH 7.6 by repeated dilution/concentration cycles. The solution was then loaded onto a batch column packed with DEAE Sepharose FF; protein was eluted with a stepwise gradient from 10–40 mM Tris at pH 7.6. The solution was acidified with glacial acetic acid to pH 4.0 and the resulting precipitate isolated by centrifugation. Buffer was then exchanged to 25 mM sodium acetate at pH 4.0 with a desalting column. This solution was loaded onto a HiLoad 26/10 SP Sepharose FPLC column and eluted by a pH gradient from 4–7.
All proteins were determined to be homogeneous by silver-stained PAGE. Identities were verified by UV/vis (cytc) and ESI-MS.
Stopped-Flow Kinetics
Kinetics data were collected on an Applied Photophysics SX20 stopped-flow spectrometer equipped with a photodiode array detector and a thermostated circulating water bath under constant argon sparge. The instrument was flushed with dithionite, followed by deoxygenated buffer prior to data collection. WT azurin was reduced by incubation for approximately one hour in a solution of 40 mM sodium ascorbate in 100 mM sodium phosphate at pH 8.0. Reduced protein was subsequently exchanged into experimental buffers by a PD-10 desalting column in an anaerobic chamber and inserted into a glass tonometer that was then sealed from the atmosphere. Excess oxidized mutant azurins were mixed with reduced WT protein. Measurements were repeated at least three times at each concentration of oxidized protein. Data were collected at 5 °C intervals from 10 to 30 °C. Temperatures were allowed to equilibrate for ten minutes prior to measurements. 1024 data points were collected on a logarithmic timescale. Data were analyzed by direct numerical integration and non-linear least squares fitting of a bimolecular, reversible process, using the Kintecus package.18 In this approach, the forward rate constant and the initial concentration of WT azurin were optimized. Five half-lives of absorbance data at 630 nm were fit directly, with conversion to concentration using ε630 = 5,700 M−1cm−1.19 An offset was included in the fitting procedure that accounted for lamp intensity (baseline) drift between data sets. The reverse rate constant was maintained at the value calculated from the forward rate constant and the equilibrium constant. Acceptable fits to the integrated bimolecular reversible reaction, with the assumed equilibrium constant, were achieved by optimizing the initial concentration of WT azurin (the limiting reactant); this value was found to vary ~15% through fitting of each dataset. The values obtained by optimization were within 25% of the values estimated using ε280 = 8800 M−1cm−1
X-ray Absorption Spectroscopy
CuI K-edge X-ray absorption spectra (XAS) including extended X-ray absorption fine structure (EXAFS) were collected at the Stanford Synchrotron Radiation Lightsource at beam line 9-3 under ring condition of 3 GeV and 200 mA. A Si(220) double-crystal monochromator was used for energy selection and a Rh-coated mirror (set to an energy cutoff of 13 keV) was used for harmonic rejection. Internal energy calibration was performed by assigning the first inflection point of a Cu foil spectrum to 8980.3 eV. Following reduction in similar fashion to stopped-flow samples, proteins were exchanged into 50 mM HEPES at pH 7.0 containing 40% glycerol. Proteins were loaded into 2 mm Delrin XAS cells with 38 micron Kapton windows and glassed by rapid immersion in liquid nitrogen. Data were collected in fluorescence mode (using a Canberra Ge 30-element array detector) with the sample maintained at 10 K in an Oxford liquid helium flow cryostat. Data were collected from 8900 to 9857 eV (k = 15 Å−1). 10 scans were averaged and processed using the MAVE and PROCESS modules of the EXAFSPAK20 software package. Background subtractions were achieved using PYSPLINE.21 XRD coordinates for C112D/M121L azurin (PDBID: 3FPY) were used to generate models for path calculation by FEFF7.22–23 Relevant paths were then optimized by least-squares fitting in the OPT package of EXAFSPAK.
Pulse Radiolysis
ET kinetics measurements were performed using the pulse-radiolysis (PR) system based on the Varian V-7715 linear accelerator at the Hebrew University in Jerusalem, Israel, employing 5 MeV accelerated electrons. All experiments were performed under anaerobic conditions between 8 and 45 °C at pH 7.0 in nitrous oxide saturated solutions containing 100 mM formate and 10 mM phosphate. Protein concentrations were in the range 40 to 60 μM. Pulse widths of 0.3 Us were used, yielding ~ 4–5 UM CO2− radicals, as determined by independent dosimetry measurements. A 1×1 cm Suprasil (HELLMA®) cuvette was used, with three light passes that result in an overall optical pathlength of 3 cm. A 150 W xenon lamp produced the analyzing light beam together with a Bausch & Lomb double grating monochromator. An appropriate optical filter with cutoff at 385 nm was used to reduce photochemical and light scattering effects. The data acquisition system consisted of a Tektronix 390 A/D transient recorder attached to a PC. The temperature of the reaction solutions in the cuvette was controlled by a thermostated circulating system, and continuously monitored by a thermocouple attached to the cuvette. Reactions were generally performed under pseudo-first-order conditions, with at least a10-fold excess of oxidized protein over reducing radicals. In each experiment 2,000 data points were collected, divided equally between two different time ranges. Usually the processes were recorded over at least three half-lives. The formation and decay of the RSSR− radical was followed at 410 nm (ε410 = 10,000 M−1 cm−1).24 Each individual measurement was repeated at least three times at each temperature, with data collection repeated at least four times. The data were analyzed by fitting to a sum of exponentials using a nonlinear least squares program written in MATLAB®.
Results
Spectra and Structures
XAS of C112D and C112D/M121L azurins were recorded at 10 K in pH 7.0 buffered solution (Figure 1). Previous analysis of the CuI X-ray absorption near edge spectrum (XANES) of C112D azurin compared the energy and intensity of the ~8985 eV pre-edge feature to corresponding values for three- and four-coordinate model complexes.25 This feature in the C112D/M121L pre-edge spectrum is shifted roughly to 1 eV higher energy (from 8985.7 eV to 8986.6 eV), with a concomitant decrease in intensity. It is likely that CuI in C112D/M121L azurin retains all four ligands during redox cycling in contrast to C112D, which was shown to undergo ligand loss upon reduction of CuII to CuI.25
Figure 1.

Cu K-edge X-ray absorption spectra of CuI C112D (black) and C112D/M121L (red) azurins in glassed pH 7.0 aqueous solution at 10 K. Normalization error is estimated to be ~ 5%.
In the same study, an analysis of C112D azurin EXAFS indicated a 0.2 Å expansion of the Cu equatorial ligands upon reduction to CuI. EXAFS data for CuI C112D/M121L azurin were collected to k = 15 Å−1, although signal to noise precluded fitting beyond 14.5 Å−1 (Figure 2). Data were fit to models of increasing complexity (Table 1). Repeated attempts to force coordination spheres with four equidistant ligands resulted in damped Debye-Waller coefficients and degraded F-factors. Best fits were achieved by explicitly modeling the CuI-O(G45) and CuI-Oε2(D112) pairs as distinct scattering paths.
Figure 2.

EXAFS of CuI C112D/M121L azurin in pH 7.0 glassed aqueous solution at 10 K. The red traces correspond to experimental data, while gray dashed traces represent simulated data from fit number 9 (Table 1).
Table 1.
EXAFS simulations.
| Fit Number | Path | CN | R(Å) | σ2 | F |
|---|---|---|---|---|---|
| 1 | Cu to N/O | 3 | 1.96 | 0.00697 | 0.43 |
| 2 | Cu to N/O | 4 | 1.969 | 0.00956 | 0.47 |
| 3 | Cu to N/O | 3 | 1.95 | 0.00695 | 0.37 |
| Cu to N/O | 1 | 2.45 | 0.00521 | ||
| 4 | Cu to N/O | 4 | 1.95 | 0.00954 | 0.42 |
| Cu to N/O | 1 | 2.45 | 0.00553 | ||
| 5 | Cu to N/O | 3 | 1.95 | 0.00697 | 0.32 |
| Cu to N/O | 1 | 2.45 | 0.00512 | ||
| Cu to N/C (MS) | 4 | 4.17 | 0.0031 | ||
| 6 | Cu to N/O | 4 | 1.95 | 0.00956 | 0.37 |
| Cu to N/O | 1 | 2.45 | 0.00538 | ||
| Cu to N/C (MS) | 4 | 4.17 | 0.00305 | ||
| 7 | Cu to N/O | 4 | 1.95 | 0.00955 | 0.36 |
| Cu to N/O | 1 | 2.44 | 0.00539 | ||
| Cu to N/O | 1 | 3.28 | 0.00617 | ||
| Cu to N/C (MS) | 4 | 4.16 | 0.0029 | ||
| 8 | Cu to N/O | 3 | 1.95 | 0.00694 | 0.3 |
| Cu to N/O | 1 | 2.45 | 0.00486 | ||
| Cu to N/O | 1 | 3.28 | 0.00594 | ||
| Cu to N/C (MS) | 4 | 4.16 | 0.00299 | ||
| 9 | Cu to N/O | 1 | 1.94 | 0.00154 | 0.29 |
| Cu to N/O | 1 | 2.06 | 0.00246 | ||
| Cu to N/O | 1 | 1.91 | 0.00577 | ||
| Cu to N/O | 1 | 2.46 | 0.00495 | ||
| Cu to N/O | 1 | 3.28 | 0.00628 | ||
| Cu to N/C (MS) | 4 | 4.17 | 0.00323 |
Our data indicate only minor changes to the crystallographically determined and EXAFS-verified CuII structure. The largest of these appears to be an expansion of the Cu-O(G45) axial interaction from 2.35 to 2.45 Å. This bond lengthening suggests an electrostatic component to this interaction that is mitigated upon reduction of the Cu charge from +2 to +1. No significant changes in the Cu-N/O bond distances of the equatorial ligand set were found. These studies suggest that the higher ET reactivity of C112D/M121L azurin relative to C112D is attributable to lower active site reorganization during redox cycling.
EXAFS were fit in OPT20 using paths calculated by FEFF7.22–23 Coordination numbers (CN) were held constant while distances (R) and Debye-Waller factors (σ2) were allowed to float. Errors in distances were estimated to be 0.02–0.03 Å and 25% for coordination numbers. Fits were performed over the entire (0 to 6.0 Å) Fourier transform window. Goodness of fit is measured by F, defined as .
Reactivity
ET kinetics data were obtained from stopped-flow mixing experiments in which oxidized C112D and C112D/M121L azurins were mixed with the reduced wild-type protein (Figure 3). Direct measurements of electron self-exchange (ESE) values by a standard NMR method were not possible, owing to the longer electron spin relaxation time of type 2 copper;26 furthermore, low extinction coefficients led to unacceptable uncertainty in the determination of concentrations required for analysis.27–28
Figure 3.

Time courses of 630 nm absorption changes due to reactions of a) 14 μM CuI WT azurin mixed with 405 μM CuII C112D azurin and b) 13.5 μM CuI azurin mixed with 270 μM CuII C112D/M121L azurin. Both traces represent reactions at 25 °C in 100 mM sodium phosphate, pH 7.0. Fits to reversible bimolecular reactions are overlaid in black. Fitting parameters to 5 half-lives for a): 405 μM CuII C112D azurin mixed with 9.6 μM CuI WT azurin (14 μM by A280) at 298 K. k12 = 360 M−1s−1 with K12(298 K) = 0.0081. b): 270 μM CuII C112D/M121L azurin mixed with 13.5 μM CuI WT azurin (13.5 μM by A280) at 298 K. k12 = 36,200 M−1s−1 with K12(298K) = 0.41.
Equilibrium constants were calculated using the 298 K reduction potentials of C112D (180 mV) and C112D/M121L (281 mV) azurins determined as described previously3 by redox titrations with cytochrome c551 (Figure S1) and a value of 304 mV for WT azurin.19 These solution measurements were found to be more precise than electrode measurements, and it should be noted that the values obtained by this technique are within error of previously published values. These potentials give equilibrium constants at 298 K for the reduction of C112D by WT of 0.0082 and for the reduction of C112D/M121L of 0.41.
To ascertain pseudo-first-order kinetic conditions, excess concentrations of the mutant azurins were mixed with WT protein. Owing to the fast reaction times, lower concentrations of C112D/M121L azurin were required. Under certain conditions,29 the time courses may be described by single exponentials; however, such conditions were not met by the entire datasets. As such, data were fit by nonlinear least squares to an integrated second-order rate expression (Figure 3). Reactions were assumed to be fully reversible on the experimental timescale based on electrochemical data.14 Studies of the reverse reaction were not pursued on account of metal loss during reduction of the azurin mutants, lending an unacceptable uncertainty to concentration measurements. The reverse rate constants may, however, be calculated via Eq. (1):
| (1) |
Concentration dependences of the extracted rate constants are linear (Figure S2), indicating that the observed process is intermolecular ET.
Activation parameters were calculated from temperature dependences of the rate constants from 10 to 30° C (Table 2, Figure 4). Notably, the C112D/M121L protein displays a two order-of-magnitude increase in the rate constant for reaction with WT azurin over that for C112D at 298 K, with k12 = 30,800 M− 1s− 1 compared to 260 M−1s−1. The temperature dependences of these rate constants show that the greater reactivity of C112D/M121L azurin is attributable to a variation in activation enthalpy, which within error is decreased substantially (12 kJ mol−1) relative to the C112D protein. The activation entropies for ET reactions of the two proteins are virtually identical.
Table 2.
Intermolecular rate constants and activation parameters.a
| C112D | C112D/M121L | |
|---|---|---|
|
|
||
| k12 – 283 K, M−1s−1 | 80 (12,700) | 9700 (24,800) |
| k12 – 288 K, M−1s −1 | 120 (17,700) | 18100 (45,700) |
| k12 - 293 K, M−1s −1 | 170 (23,100) | 23400 (58,200) |
| k12 - 298 K, M−1s −1 | 260 (32,400) | 30800 (75,400) |
| k12 - 303 K, M−1s −1 | 460 (53,100) | 41200 (99,400) |
| ΔH‡ (kJ mol−1) | 58 ± 4 | 46 ± 5 |
| ΔS‡ (J mol−1 K−1) | −2 ± 13 | −3 ± 15 |
Reverse rate constants [Eq. (5)] are indicated in parentheses.
Figure 4.

Temperature dependences of the second-order rate constants for reactions of WT protein with C112D and C112D/M121L azurins.
Intramolecular electron transfer was triggered by a pulse radiolysis (PR) method. PR produced CO2− radicals that reduce the disulfide bridge as well as the CuII site of the two azurins. As the type 2 and type zero CuII sites exhibit relatively weak absorptions in the visible region, only formation and decay of the disulfide radical could be followed. A protein concentration dependent increase in absorption was monitored at 410 nm in the microsecond time range for both mutants, reflecting RSSR− radical anion formation attributable to second-order reduction by CO2− radicals. This diffusion controlled bimolecular reaction was followed by RSSR− reoxidation in the millisecond time range (Figure 5). The observed reoxidation rate constants were found to be independent of both protein and CO2− radical concentrations, as would be expected for intramolecular ET from the disulfide radical anion to CuII. In accord with this interpretation, the only reaction observed when ZnII azurin mutants were similarly reacted with CO2− radicals was bimolecular dismutation of the RSSR− radicals (Fig S3).
Figure 5.

Transient absorption monitored at 410 nm following 0.3 μs pulse of 10 mM sodium phosphate/100 mM sodium formate pH 7.0 solutions of a) 40.5 μM C112D azurin at 35 °C and b) 60 μM C112D/M121L azurin at 17 °C. Fits corresponding to formation of RSSR− and its subsequent decay by ET to CuII are overlaid in black.
The temperature dependences of RSSR− to CuII intramolecular ET rates were examined for both azurin mutants in the 4 to 45° C range at pH 7.0 (Table 3, Figure 6).
Table 3.
Intramolecular ET rate constants and activation parameters.
| C112D | C112D/M121L | |
|---|---|---|
|
|
||
| kPR – 281 K, s−1 | 35 | |
| kPR – 283 K, s−1 | 54 | 37 |
| kPR - 286 K, s−1 | 45 | |
| kPR - 290 K, s−1 | 112 | 52 |
| kPR - 297 K, s−1 | 123 | 61 |
| kPR - 309 K, s−1 | 228 | 99 |
| kPR - 315 K, s−1 | 329 | 110 |
| ΔH‡ (kJ mol− 1) | 34.8 ± 4.0 | 22.6 ± 1.0 |
| ΔS‡ (J mol−1 K− 1) | −88 ± 8 | −135 ± 4 |
Figure 6.

Temperature dependences of PR-triggered RSSR− to Cu(II) ET rates.
In contrast to rate constants obtained from stopped-flow and electrochemical14 experiments, ET from C3/C26 RSSR− is slower by a factor of two for C112D/M121L compared to C112D azurin. A marked drop is again observed in the activation enthalpy.
Discussion
The semiclassical ET theory for reactions between spatially fixed and oriented donors and acceptors provides a framework for analysis of rate constants, Eq. (2):30
| (2) |
In Eq. (2), h is Planck’s constant, kB is Boltzmann’s constant, T is the temperature (K), HAB is the electronic coupling between reactants, −ΔG° is the driving force for electron transfer, and λ is the reorganization energy. When the driving force of the reaction equals the total reorganization energy, the rate constant reaches its maximum value, kMAX. HAB2 decays exponentially with the separation distance; as such we can estimate kMAX from Eq. (3):
| (3) |
where r is the donor-acceptor distance and r0 is the value of r for donor and acceptor in direct (van der Waals) contact; the generally accepted value for r0 is 3.0 Å. A timetable for activationless electron tunneling in β-sheet proteins establishes a coupling decay constant of β = 1.1 Å−1.31 A much greater value, β = 1.6 Å−1, has been determined for tunneling through water molecules.32 λ for donors and acceptors can be determined by the Marcus cross-relation, Eq. (4):
| (4) |
where λTOT is the total reorganization energy for the ET reaction.
To obtain estimates of ET parameters from Eqs. (2) and (3) we first converted the second-order rate constants to first-order values Eq. (5):
| (5) |
where KA, the ET complex association constant, was taken to be 1 M−1.27 Extensive study has demonstrated that azurin electron self-exchange (ESE) occurs through H117, and that the ET complex is mediated by a hydrophobic patch surrounding this residue.33–34 The 3D structure of P. aeruginosa WT azurin exhibits interprotein crystallographic contacts in this region.35 Moreover, two water molecules that bridge the two H117 side chains have been shown to enhance the coupling between the copper centers.36 Since the ET reaction of reduced WT azurin with oxidized mutants should approximate ESE, we used Cα structural alignment of C112D and C112D/M121L azurins with WT protein to model the bimolecular ET complex (Figure 7). Importantly, the bridging water molecule is conserved in the mutant structures. Direct Cu-Cu distances are 14.68 and 14.75 Å from WT to C112D and C112D/M121L azurins, respectively.
Figure 7.

Model ET complex for reaction of the WT protein (PDBID: 4AZU) with a) C112D (PDBID: 3FQY) and b) C112D/M121L (PDBID: 3FPY) azurins. 2Fo-Fc electron density maps are contoured at 2σ over the active sites and corresponding bridging water molecules of the mutant azurins. Nitrogen atoms are blue, oxygen atoms are red.
Electron transfer rates were calculated with β = 1.0 to 1.65 Å−1 and variable λ values for the bimolecular ET reactions taking the Cu-Cu separations for r (Figure 8). A λ of 0.82 eV was used to calculate λTOT for WT azurin [Eq. (4)].37
Figure 8.

β-dependence of ET rate constants between WT and a) C112D azurin with λ = 1.6–2.4 eV (−ΔG° = 0.124 eV, r-ro = 11.68 Å) b) C112D/M121L azurin with λ = 0.4 – 1.2 eV (−ΔG° = 0.023 eV, r-ro = 11.75 Å) at 298 K. The red lines are the experimentally determined rate constants for ET through the encounter complex.
We make the reasonable assumption that β for ET between the two azurin molecules will fall in the range 1.1 to 1.2 Å−1,31 that is, somewhat higher than through the protein backbone (1.1 Å−1) but below the value for tunneling through water (1.6 Å−1).32 The value of β in each case is assumed to be invariant given identical (within error) values of ΔS‡ for the reactions. Within the 1.1 to 1.2 Å−1 range, agreement with experimentally determined rates requires λ = 1.7 – 2.0 eV for C112D and λ = 0.4 – 0.6 eV for the C112D/M121L protein. A lower λ for C112D/M121L is indicated by the lower ΔH‡ as well as the structural similarity of the CuII and CuI sites.
Alternatively, we can refine the ranges for λ using the Marcus cross-relationship to estimate ESE rates for the azurin mutants Eq. (6):30
| (6) |
In Eq. (6), k12 is the observed second-order rate constant for the reaction between species 1 and 2, K12 is the equilibrium constant for this reaction (calculated using the reduction potentials of the reactants), kii values are the self-exchange rate constants, and f12 is taken to be 1. A value of 1 × 10⁶ M−1s−1 was used for WT azurin ESE.27–28 Eq. (6) gives ESE rate constants of 8.2 M−1s−1 for C112D and 2.3 × 10³ M−1s−1 for C112D/M121L azurin. ESE among the WT protein and the two mutants will depend strongly on λ. Slight differences in coupling of H117 to Cu may also impact ESE; by EPR14 C112D was found to have greater electron delocalization out to its equatorial imidazoles than C112D/M121L, although C112D azurin ESE is very slow. Thus, the decreased ESE rate constant for C112D/M121L relative to WT azurin suggests a modestly elevated λ ~ 0.9 – 1.1 eV; in accord with this estimate, the dramatically reduced C112D ESE rate constant further supports a highly elevated λ. A λ of 0.9 – 1.1 eV for C112D/M121L best fits the experimental data with β ~ 1.0 Å−1, a value that requires a λ of 2.1 – 2.3 eV for the C112D protein. This relatively high λ is consistent with values for CuII/I reorganization in unconstrained complexes: for example, the λ for Cu II/I (1,10-phenanthroline)2 is 2.4 eV; and the λ for unfolded WT azurin is approximately the same.38–39
With estimates for λ, we now turn to the pulse radiolysis data. ET from the RSSR− radicals to CuII in WT azurin likely involves two coupling pathways (Figure 9).40 The first pathway follows the backbone from C3 to a hydrogen bond from N10 to H46 that is coordinated to CuII. Coupling along the second pathway, which involves several hydrogen bonds and a through-space jump from V31 to W48, is enhanced at its terminus by the relatively strong interaction to CuII through the C112 thiolate.41 Since the coupling along this pathway would be expected to be greatly diminished by the C112D mutation (the “Solomon weight” of the aspartate carboxylate oxygen to Cu coupling is approximately 10% that of the native cysteine thiolate),41–42 the rates of C112D and C112D/M121L ET reactions likely depend on the strengths of interactions among groups that make up the H46 route.
Figure 9.
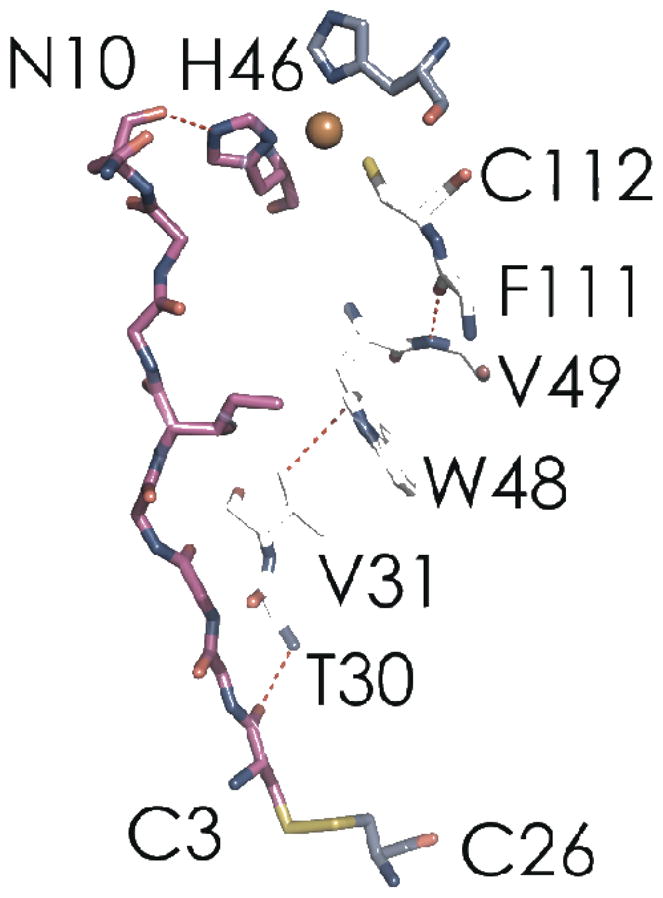
Calculated ET pathways from the C3 sulfur to copper in WT P. aeruginosa azurin (PDBID: 4AZU). The H46 pathway (magenta) likely is the major coupling route in C112D and C112D/M121L azurins. The W48 pathway, which features many noncovalent elements, could be competitive with the H46 route in WT azurin, owing to Cu-S(C112) covalency. Oxygen atoms are red; nitrogen atoms are blue; sulfur atoms are yellow.
The activation parameters determined for intramolecular ET lend further support to a lower λ for C112D/M121L azurin than for the C112D protein. λ has been estimated to be ~ 1.2 eV for the azurin disulfide.37 Using λ = 0.9 – 1.1 eV for C112D/M121L, with r-ro = 23.8 Å and −ΔG° = 0.691 eV, agreement with experimental data was found for β = 1.0 Å−1 (Figure 10). With λ = 2.1 – 2.3 eV for C112D, r-ro = 23.2 Å and −ΔG° = 0.590 eV, β = 0.8 Å−1 is required to match the observed rates. A larger β for C112D/M121L PR ET is consistent with the highly unfavorable ΔS‡ relative to that for C112D. At present we have no definitive explanation for the decreased coupling in the double mutant. Cα structural alignment of C112D with C112D/M121L reveals almost perfect superposition of the β-strands from C3 to N10. The N10 hydrogen bond to H46 is slightly longer in C112D/M121L (2.84 Å) than in C112D (2.58 Å), but such a small distance change would not be expected to dramatically attenuate the ET coupling. Differences in coupling of H46 to Cu may play a role. Another possible explanation is that there is destructive pathway interference from C3 to CuII in the double mutant, owing to realignment of D112-Cu coordination, thereby disfavoring distant electron transfer.41
Figure 10.

β-dependence of RSSR− to CuII ET: a) C112D azurin with λ = 2.1–2.3 eV (−ΔG° = 0.590 eV, r-ro = 23.2 Å); b) C112D/M121L azurin with λ = 0.8 – 1.0 eV (−ΔG° = 0.691 eV, r-ro = 23.8 Å) at 298 K. The red lines are the experimentally determined intramolecular ET rate constants.
Conclusions
The active site of type zero C112D/M121L azurin has D112 hydrogen bonded to N47 and F114 backbone amides. These hydrogen bonds form a network of outer-sphere structural constraints (the rack) that account for the low λ of the WT protein. This network is not present in the C112D mutant. In accord with rack predictions, EXAFS data demonstrate that the C112D/M121L active site geometry is virtually the same in both Cu oxidation states. In contrast, the C112D copper site undergoes ligand loss and a ~ 0.2 Å expansion in its inner coordination sphere upon reduction from CuII to CuI. Analysis of ET kinetics from stopped-flow and PR experiments indicates a much lower reorganization energy (0.9 – 1.1 eV) for the structurally constrained copper center in C112D/M121L azurin, compared to > 2 eV for the C112D protein.
Supplementary Material
Acknowledgments
We thank Jay Winkler and Bruce Brunschwig for helpful discussions, Serena DeBeer for XAS advice, Matt Sazinsky for use of an anaerobic chamber and Eran Gilad for valuable assistance with PR system operations. We also acknowledge several suggestions from a reviewer. Our research was supported by NIH DK019038 and Stanford GCEP. X-ray absorption spectroscopic experiments were carried out at the Stanford Synchrotron Radiation Lightsource, a national user facility operated by Stanford University on behalf of the U.S. Department of Energy, Office of Basic Energy Sciences. The SSRL Structural Molecular Biology Program is supported by the Department of Energy, Office of Biological and Environmental Research, and by the National Institutes of Health, National Center for Research Resources, Biomedical Technology Program.
Footnotes
C112D/M121L azurin redox titration, stopped-flow concentration dependence plots, and representative ZnII pulse radiolysis data. This material is available free of charge via the Internet at http://pubs.acs.org.
References
- 1.Banci L, Bertini I, Luchinat C, Turano P. In: Biological Inorganic Chemistry: Structure and Reactivity. Bertini I, Gray HB, Stiefel EI, Valentine JS, editors. University; Sausalito: 2007. pp. 229–277. [Google Scholar]
- 2.Marshall NM, Garner DK, Wilson TD, Gao YG, Robinson H, Nilges MJ, Lu Y. Nature. 2009;462:113–116. doi: 10.1038/nature08551. [DOI] [PMC free article] [PubMed] [Google Scholar]
- 3.Lancaster KM, Sproules S, Palmer JH, Richards JH, Gray HB. J Am Chem Soc. 2010;132:14590–14595. doi: 10.1021/ja105731x. [DOI] [PMC free article] [PubMed] [Google Scholar]
- 4.Gray HB, Malmström BG, Williams RJP. J Biol Inorg Chem. 2000;5:551–559. doi: 10.1007/s007750000146. [DOI] [PubMed] [Google Scholar]
- 5.Solomon EI. Inorg Chem. 2006;45:8012–8025. doi: 10.1021/ic060450d. [DOI] [PubMed] [Google Scholar]
- 6.Malmström BG. Eur J Biochem. 1994;223:711–718. doi: 10.1111/j.1432-1033.1994.tb19044.x. [DOI] [PubMed] [Google Scholar]
- 7.Yanagisawa S, Banfield MJ, Dennison C. Biochemistry. 2006;45:8812–8822. doi: 10.1021/bi0606851. [DOI] [PubMed] [Google Scholar]
- 8.Weigel M, Varotto C, Pesaresi P, Finazzi G, Rappaport F, Salamini F, Leister D. J Biol Chem. 2003;278:31286–31289. doi: 10.1074/jbc.M302876200. [DOI] [PubMed] [Google Scholar]
- 9.Solomon EI, Sundaram UM, Machonkin TE. Chem Rev. 1996;96:2563–2606. doi: 10.1021/cr950046o. [DOI] [PubMed] [Google Scholar]
- 10.Roberts SA, Weichsel A, Grass G, Thakali K, Hazzard JT, Tollin G, Rensing C, Montfort WR. Proc Natl Acad Sci USA. 2002;99:2766–2771. doi: 10.1073/pnas.052710499. [DOI] [PMC free article] [PubMed] [Google Scholar]
- 11.Potapov A, Pecht I, Goldfarb D. Phys Chem Chem Phys. 2010;12:62–65. doi: 10.1039/b919069d. [DOI] [PubMed] [Google Scholar]
- 12.Godden JW, Turley S, Teller DC, Adman ET, Liu MY, Payne WJ, LeGall J. Science. 1991;253:438–442. doi: 10.1126/science.1862344. [DOI] [PubMed] [Google Scholar]
- 13.Lancaster KM, Yokoyama K, Richards JH, Winkler JR, Gray HB. Inorg Chem. 2009;48:1278–1280. doi: 10.1021/ic802322e. [DOI] [PMC free article] [PubMed] [Google Scholar]
- 14.Lancaster KM, DeBeer George S, Yokoyama K, Richards JH, Gray HB. Nature Chem. 2009;1:711–715. doi: 10.1038/nchem.412. [DOI] [PMC free article] [PubMed] [Google Scholar]
- 15.van de Kamp M, Hali FC, Rosato N, Finazzi Agro A, Canters GW. Biochim Biophys Acta. 1990;1019:283–292. doi: 10.1016/0005-2728(90)90206-j. [DOI] [PubMed] [Google Scholar]
- 16.Nar H, Huber R, Messerschmidt A, Fillippou AC, Barth M, Jaquinod M, van de Kamp M, Canters GW. Eur J Biochem. 1992;205:1123–1129. doi: 10.1111/j.1432-1033.1992.tb16881.x. [DOI] [PubMed] [Google Scholar]
- 17.Russell BS, Zhong L, Bigotti MG, Cutruzolà F, Bren KL. J Biol Inorg Chem. 2003;8:156–166. doi: 10.1007/s00775-002-0401-z. [DOI] [PubMed] [Google Scholar]
- 18.Ianni JC. Kintecus, version 3.96. 2010 http://www.kintecus.com.
- 19.Rosen P, Pecht I. Biochemistry. 1976;15:775–786. doi: 10.1021/bi00649a008. [DOI] [PubMed] [Google Scholar]
- 20.George GN. EXAFSPAK. Stanford Synchrotron Radiation Lightsource, Stanford Linear Accelerator Center, Stanford University; [Google Scholar]
- 21.Tenderholt A. PySpline, version 1.1. 2006 http://sourceforge.net/projects/pyspline.
- 22.DeLeon JM, Rehr JJ, Zabinsky SI, Albers RC. Phys Rev B. 1991;44:4146–4156. doi: 10.1103/physrevb.44.4146. [DOI] [PubMed] [Google Scholar]
- 23.Rehr JJ, DeLeon JM, Zabinsky SI, Albers RC. J Am Chem Soc. 1991;113:5135–5140. [Google Scholar]
- 24.Klapper MH, Faraggi M. Q Rev Biophys. 1979;12:465–519. doi: 10.1017/s0033583500002791. [DOI] [PubMed] [Google Scholar]
- 25.DeBeer S, Kiser CN, Mines GA, Richards JH, Gray HB, Solomon EI, Hedman B, Hodgson KO. Inorg Chem. 1999;38:433–438. doi: 10.1021/ic9804622. [DOI] [PubMed] [Google Scholar]
- 26.Bertini I, Fernández CO, Karlsson BG, Leckner J, Luchinat C, Malmström BG, Nerissian AM, Pierattelli R, Shipp E, Valentine JS, Vila AJ. J Am Chem Soc. 2000;122:3701–3707. [Google Scholar]
- 27.Groeneveld CM, Canters GW. Eur J Biochem. 1985;153:559–564. doi: 10.1111/j.1432-1033.1985.tb09337.x. [DOI] [PubMed] [Google Scholar]
- 28.Groeneveld CM, Canters GW. J Biol Chem. 1988;263:167–173. [PubMed] [Google Scholar]
- 29.Darvey IG, Ninham BW. J Chem Phys. 1967;46:1626–1645. [Google Scholar]
- 30.Marcus RA, Sutin N. Biochim Biophys Acta. 1985;811:265–322. [Google Scholar]
- 31.Gray HB, Winkler JR. Biochim Biophys Acta. 2010;1797:1563–1572. doi: 10.1016/j.bbabio.2010.05.001. [DOI] [PubMed] [Google Scholar]
- 32.Ponce A, Gray HB, Winkler JR. J Am Chem Soc. 2000;122:8187–8191. [Google Scholar]
- 33.Van Pouderoyen G, Mazumdar S, Hunt NI, Hill HAO, Canters GW. Eur J Biochem. 1994;222:583–588. doi: 10.1111/j.1432-1033.1994.tb18900.x. [DOI] [PubMed] [Google Scholar]
- 34.van Amsterdam IMC, Ubbink M, Einsle O, Messerschmidt A, Merli A, Cavazzini D, Rossi GL, Canters GW. Nature Struct Biol. 2002;9:48–52. doi: 10.1038/nsb736. [DOI] [PubMed] [Google Scholar]
- 35.Nar H, Messerschmidt A, Huber R, van de Kamp M, Canters GW. J Mol Biol. 1991;221:765–772. doi: 10.1016/0022-2836(91)80173-r. [DOI] [PubMed] [Google Scholar]
- 36.Mikkelsen KV, Skov LK, Nar H, Farver O. Proc Natl Acad Sci USA. 1993;90:5443–5445. doi: 10.1073/pnas.90.12.5443. [DOI] [PMC free article] [PubMed] [Google Scholar]
- 37.Di Bilio AJ, Hill MG, Bonander N, Karlsson BG, Villahermosa RM, Malmström BG, Winkler JR, Gray HB. J Am Chem Soc. 1997;119:9921–9922. [Google Scholar]
- 38.Augustin MA, Yandell JK. Inorg Chem. 1979;18:577–583. [Google Scholar]
- 39.Winkler JR, Wittung-Stafshede P, Leckner J, Malmström BG, Gray HB. Proc Natl Acad Sci USA. 1997;94:4246–4249. doi: 10.1073/pnas.94.9.4246. [DOI] [PMC free article] [PubMed] [Google Scholar]
- 40.Farver O, Pecht I. J Biol Inorg Chem. 1997;2:387–392. doi: 10.1007/s00775-013-1080-7. [DOI] [PubMed] [Google Scholar]
- 41.Regan JJ, Di Bilio AJ, Langen R, Skov LK, Winkler JR, Gray HB, Onuchic JN. Chem Biol. 1995;2:489–496. doi: 10.1016/1074-5521(95)90266-x. [DOI] [PubMed] [Google Scholar]
- 42.Solomon EI, Lowery MD. Science. 1993;259:1575–1581. doi: 10.1126/science.8384374. [DOI] [PubMed] [Google Scholar]
Associated Data
This section collects any data citations, data availability statements, or supplementary materials included in this article.