Abstract
Mechano-transduction at cellular and tissue levels often involves ATP release and activation of the purinergic signalling cascade. In the lungs, stretch is an important physical stimulus but its impact on ATP release, the underlying release mechanisms and transduction pathways are poorly understood. Here, we investigated the effect of unidirectional stretch on ATP release from human alveolar A549 cells by real-time luciferin–luciferase bioluminescence imaging coupled with simultaneous infrared imaging, to monitor the extent of cell stretch and to identify ATP releasing cells. In subconfluent (<90%) cell cultures, single 1 s stretch (10–40%)-induced transient ATP release from a small fraction (≤1.5%) of cells that grew in number dose-dependently with increasing extent of stretch. ATP concentration in the proximity (≤150 μm) of releasing cells often exceeded 10 μm, sufficient for autocrine/paracrine purinoreceptor stimulation of neighbouring cells. ATP release responses were insensitive to the putative ATP channel blockers carbenoxolone and 5-nitro-2-(3-phenylpropyl-amino) benzoic acid, but were inhibited by N-ethylmaleimide and bafilomycin. In confluent cell cultures, the maximal fraction of responding cells dropped to <0.2%, but was enhanced several-fold in the wound/scratch area after it was repopulated by new cells during the healing process. Fluo8 fluorescence experiments revealed two types of stretch-induced intracellular Ca2+ responses, rapid sustained Ca2+ elevations in a limited number of cells and delayed secondary responses in neighbouring cells, seen as Ca2+ waves whose propagation was consistent with extracellular diffusion of released ATP. Our experiments revealed that a single >10% stretch was sufficient to initiate intercellular purinergic signalling in alveolar cells, which may contribute to the regulation of surfactant secretion and wound healing.
Key point
Translation of mechanical forces into biological effects often involves ATP release and activation of the purinergic signalling cascade.
In the lungs, stretch is an important physical stimulus but its impact on ATP release and intercellular signalling is poorly understood.
Here, we report that in the A549 alveolar cell model, a single stretch of more than 10% induces ATP release sufficient to stimulate purinergic receptors on neighbouring cells up to 150 μm away from the source cell.
Stretch-induced ATP release is significantly enhanced during healing in scratch-wound areas.
These results demonstrate that mechano-purinergic signalling may play an important role in modulating alveolar processes, including electrolyte transport, surfactant secretion and wound healing.
Introduction
Mechano-transduction at the cellular and tissue levels often involves the release of signalling molecules. Among them, purines appear to be the most primitive and widespread chemical messengers of local, autocrine and paracrine signalling and intercellular communication in most, if not all, organ and cell systems (Burnstock, 2006). The purinergic signalling system consists of a large family of G protein-coupled P2Y and adenosine receptors as well as ionotropic P2X receptors. Several families of extracellular enzymes contribute to signal diversification by converting/metabolizing one nucleotide species into another while, at the same time, providing a mechanism for the termination of purinergic signals (Abbracchio et al. 2009; Lazarowski & Boucher, 2009).
Extracellular nucleotides regulate a wide variety of physiological and pathophysiological processes in all organs and tissues. In the lungs, extracellular ATP and other nucleotides control surfactant secretion and mucocilliary clearance, but the release mechanisms are not fully understood (Burnstock, 2008; Praetorius & Leipziger, 2009; Lazarowski et al. 2011). In vitro studies have disclosed that nucleotide release from epithelial cells is exquisitely sensitive to mechanical perturbations, including cell culture plate tilting (Grygorczyk & Hanrahan, 1997; Lazarowski et al. 1997), shear stress (Tarran et al. 2006), cell distortion by tension forces at the air–liquid interface (Ramsingh et al. 2011) and hypotonic shock. Furthermore, cell stretch has been shown to elicit ATP release, e.g. from the urether epithelium of the bladder (Sadananda et al. 2012) and mammary epithelial cells (Furuya et al. 2008). Lung epithelial cells are subjected to many forms of mechanical stresses during the breathing cycle and coughing, including airflow shear stress, cell stretch and cell distortion by tension forces at the air–liquid interface, all of which may evoke ATP release.
Cell stretch is a particularly relevant physiological stimulus in the lungs (Edwards, 2001), where expansion of alveoli during the breathing cycle leads to significant thinning of the alveolar walls that involves stretch and deformation of the alveolar epithelium. Stretch is considered to be a physiological stimulus of surfactant secretion by alveolar type 2 (AT2) cells, which may require the release of ATP, a potent surfactant secretagogue, but the exact mechanisms of this process are not fully understood (Edwards, 2001; Dietl & Haller, 2005; Dietl et al. 2012).
ATP release from alveolar cells in response to stretch has not yet been investigated. Here, we considered whether physiologically relevant stretch provokes ATP release sufficient for auto/paracrine intercellular signalling in an alveolar A549 cell model. To address this question, we undertook real-time imaging of extracellular ATP to directly observe cellular ATP release and to characterize its local distribution at cellular level. Recent advances with high-sensitivity, low-light detection, cooled charge-coupled device (CCD) cameras and availability of bright, high numerical aperture (NA) objectives allow imaging of ATP-dependent luciferin–luciferase (LL) luminescence during cellular ATP release. This technology directly detects extracellular ATP at concentrations ≥10 nm and provides spatiotemporal information on its concentration and diffusion from release points after stimulation (Yamamoto et al. 2011). We combined luminescence imaging with IR cell imaging to simultaneously monitor the extent of cell stretch and to identify ATP releasing cells. We found that single stretch >10% resulted in transient ATP release from a limited number of cells, which was sufficient to activate P2 receptors on neighbouring cells up to 150 μm away. Single stretch also produced two types of intracellular Ca2+ ([Ca2+]i) responses, including Ca2+ waves, whose propagation between cells was consistent with ATP diffusion in extracellular spaces. Stretch-induced ATP release was significantly enhanced in wound areas, indicating its potential role in the wound-healing process.
Methods
Cells
Human lung carcinoma A549 cells were grown in Dulbecco's modified Eagle's medium (DMEM) containing 4.5 mg l−1 d-glucose, 2 mm l-glutamine, 110 mg l−1 sodium pyruvate (catalogue no. 11995; Gibco-Invitrogen, New York, NY, USA), supplemented with 10% fetal bovine serum. For real-time ATP release and [Ca2+]i imaging, the cells were seeded in 2 × 18 mm wells of a collagen-coated (Cellmatrix type 1a; Nitta Gelatin, Osaka, Japan) silicone stretch chamber (see below) and tested at 50–90% confluence (∼250–450 cells mm−2), i.e. typically 1–2 days after seeding.
Solutions and chemicals
Experiments were performed with cells bathed in DMEM without phenol red (Sigma-Aldrich Ltd, Tokyo, Japan), buffered with 10 mm Hepes (pH 7.4). High-sensitivity, glycine-buffered LL (Lucifer HS; Kikkoman, Tokyo, Japan) was reconstituted according to manufacturer's instructions and divided into aliquots that were kept frozen until used. The LL mix contained apyrase, which degrades ATP and thus terminates the ATP-dependent luminescence response after its release ceases (Fig. 1B). Before the experiments, osmolality of the LL stock was adjusted to that of DMEM (∼315 mosmol l−1) by adding an appropriate volume of concentrated (5×) physiological solution (PS). Isotonic (1×) PS contained (in mm): 152 NaCl, 5.4 KCl, 0.8 MgCl2, 1.8 CaCl2 and 10 Hepes, pH 7.4, adjusted with NaOH. All reagents, including N-ethylmaleimide (NEM), bafilomycin, carbenoxolone (CBX), and 5-nitro-2-(3-phenylpropyl-amino) benzoic acid (NPPB), were obtained from Sigma-Aldrich, Ltd. BAPTA-AM was sourced from Dojindo (Kumamoto, Japan). Osmolality of the solutions was checked with a freezing point OM801osmometer (Vogel, Giessen, Germany).
Figure 1. Calibration of the ATP imaging system.
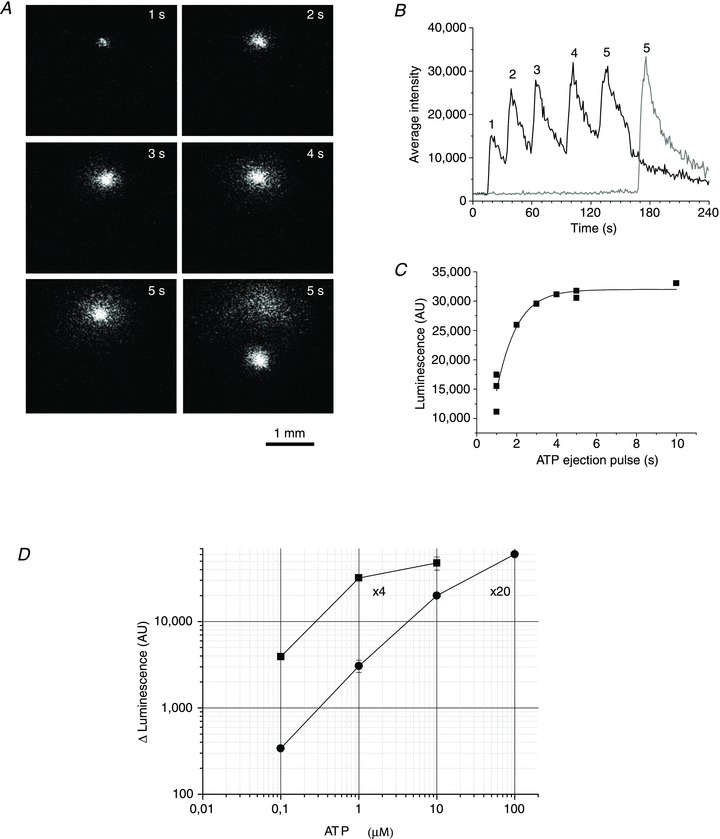
A, example of luminescence responses to 1 μm ATP ejections of increasing durations of 1, 2, 3, 4 and 5 s (indicated in the upper right corner). Images were captured at the peak of the luminescence response. B, full-time course of the responses is illustrated; 5 s ejection was repeated after moving the pipette tip to a different location in the chamber to assure reproducibility of the response, shown as a grey trace. C, dose–response relationship between 1 μm ATP standard ejection time and peak luminescence (the graph includes data reported in B). The solid curve represents a fit with sigmoid function by Origin Lab, v. 7.5. D, calibration curve showing steady-state luminescence (in AU) for different ATP standards, obtained with the same experimental approach as in A–C. Calibration of the imaging system was performed separately with 4× and 20× objectives.
Stretch chamber and stretching device
Stretch chambers were made of a Silpot 184 W/C silicone elastomer (Dow Corning, Midland, MI, USA). They consisted of a silicone block with a 2 mm wide groove in the centre where cells were seeded (Supplemental Fig. 1). For the experiments, a chamber with cell culture was attached to a stretching device (NS-600W, STREX, Osaka, Japan) mounted on the stage of an upright BX51WI Olympus microscope. The stretching device was connected to the control unit, which allowed the selection of stretch extent, speed and duration. In these experiments, cells were typically stimulated with a single 1 s duration stretch of nominal 20–70% extension. Actual distensions of individual chambers varied and were 50–80% of their nominal values. Therefore, for each applied stretch, real extension was evaluated from IR images acquired at 10 Hz during experiments. After each stretch, cells were allowed to recover for 30 min before application of the next stimulus. In a typical experiment, the cells underwent up to four sequential stretches, separated by 30 min recovery.
Real-time imaging of extracellular ATP
To visualize cell stretch-induced ATP release in real-time, we deployed a previously described imaging system that combines simultaneous high-sensitivity bioluminescence detection of ATP and IR images of cells in the chamber to monitor the exact location of ATP release sites and the amplitude of stretch applied (Furuya et al. 2008). Briefly, to detect cellular ATP release, 200 μl of osmolality adjusted (isotonic) LL stock was added to 300 μl of Hepes-buffered DMEM covering the cells and gently mixed. The cells were imaged with an upright BX51WI Olympus microscope via a 4×/340 Fluor XL (NA 0.28) objective or a 20× XLUM PlanFl (NA 0.95) water-immersion objective. With the 4× objective, the chamber was covered with a 22 × 22 mm glass coverslip to prevent evaporation. Luminescence produced by an ATP-dependent luciferin oxidation reaction was detected with a high-sensitivity cooled-CCD camera (Cascade 512F; Photometrics, Tucson, AZ, USA) equipped with a cooled image intensifier (Hamamatsu Photonics C8600-04, Hamamatsu, Japan). The imaging system and data acquisition were controlled by MetaMorph software (v. 7.5; Molecular Devices Inc., Downingtown, PA, USA). Images were acquired at 10 Hz frequency with 100 ms exposure time. Usually, sensitivity setting of the CCD camera was 3900/4096 (max) and gain setting of the image intensifier was 7–8.5/10 (max). Stacks of images, 2400 in a typical experiment, were streamed to hard disk and stored for later off-line analysis. All ATP imaging experiments were performed at 32 ± 3°C.
Data analysis
During MetaMorph analysis, a stack of acquired images was reduced in size by calculating an average of 10 sequential images (average-10). Thus, the intensity of each pixel in the average-10 image represented an average signal recorded during 1 s of the experiment. This approach gave smooth visualization of ATP release, facilitating the precise localization of ATP release sites. The number of ATP release sites induced by stretch was determined from such averaged images with the threshold/filtering option of MetaMorph software. In this work, the following arbitrary criteria defined release. (1) A ≥5-fold increase of luminescence intensity above background observed within the first 1–3 s after single stretch stimulation. With the 4× objective and typical background of 1700–2100 arbitrary units (AU) (∼30–50 nm ATP), it corresponds to responses ≥10,000 AU (≥0.3 μm ATP). (2) Release sites with an equivalent diameter of ≥3 pixels, corresponding to 16.5 μm for images acquired with the 4× objective of our imaging system. Typically, ATP release sites were identified in the first four sequential average-10 images after stretch. Images, acquired later than 4 s after stretch, had a diffuse appearance and significant signal overlap with neighbouring ATP release sites.
[Ca2+]i imaging
One to 2-day-old A549 cells grown in the stretch chamber were loaded with 1 μm Fluo-8 AM (AAT Bioquest, Sunnyvale, CA, USA) in the presence of 0.1–0.2% of the non-ionic solubilizer and emulsifier Cremophor EL (Sigma-Aldrich Ltd), for 40–60 min at room temperature. After washing with DMEM, the chamber with cells was mounted on the stretching device, the same as for ATP imaging, on the stage of an inverted confocal microscope (LSM510, Carl Zeiss, Jena, Germany). Time-lapse Fluo8 fluorescence and Nomarski differential interference contrast images were acquired at 1 s intervals. Ca2+ imaging experiments were performed at 31 ± 2°C.
Results
Calibration of the luminescence imaging system
To estimate extracellular ATP concentration during stimulated release, luminescence intensity was calibrated with ATP standards with the same gain settings of the CCD camera and image intensifier as in the cell experiments. To mimic cellular release closely, solutions of different ATP concentrations (0.1, 1, 10 and 100 μm) were pressure-ejected from micropipettes into the experimental chamber filled with the LL-containing DMEM solution. Short pressure pulses of increasing duration were applied to the pipettes via an electromagnetic valve and controller, and luminescence responses were recorded at the micropipette tips. An example of such an experiment with 1 μm ATP standard is illustrated in Fig. 1A. It presents luminescence images recorded at response peaks during sequential ATP ejections of increasing 1, 2, 3, 4 and 5 s duration. The time course of luminescence responses in this experiment is presented in Fig. 1B. For short ejection pulses, the response peak grew with increasing ejection time, but reached steady state with ejections longer than 3 s, which suggests that during ejection times >3 s, steady state was attained between locally-accumulating ATP available for LL reaction, and its diffusion and mixing with the surrounding LL solution at the pipette tips, producing maximal, steady-state luminescence responses. After background subtraction, the dose–response relationship obtained in such experiments was fitted with sigmoid function, from which maximal steady-state luminescence responses were determined (Fig. 1C). The same procedure, as illustrated in Fig. 1B and C was employed with all other ATP concentration standards. The results are plotted in Fig. 1D as a calibration curve showing the LL luminescence responses for different ATP concentrations. Calibration was undertaken with 4× and 20× objectives used in ATP release imaging experiments with cells. The data indicate that under our experimental conditions, the 4× objective produced brighter images and was more suitable for detecting low-level responses between ∼0.03 and 10 μm ATP, while the 20× objective allowed the detection of higher ATP concentrations up to 100 μm. ATP concentrations exceeding 10 μm for the 4× objective, or 100 μm for the 20× objective, produced luminescence responses that saturated image intensifier signal output at the gain settings in our experiments.
ATP release responses to single stretch
Figure 2A illustrates a typical stretch-induced ATP release experiment with A549 cells recorded at low magnification (4× objective), which allowed us to approximately observe the 2 × 3 mm area of cell culture in the stretch chamber. It reveals that, following 21% stretch of 1 s duration, release occurs only in a limited number of discrete sites, here ∼32 sites of ∼2500 cells in the field of view. Responses were rapid; some were visible in less than 1 s, i.e. during stretch (see top centre image in Fig. 2A). The full time course of the response is depicted in Supplemental Movie 1). ATP imaging experiments performed at higher magnification with a 20× objective disclosed that ATP release sites were single cells or groups of cells (Fig. 2B and Supplemental Movie 2). Interestingly, all cells actively releasing ATP were flat, although not all flat cells released ATP. The time course of ATP release after single stretch is depicted in Fig. 3A and Supplemental Movie 3. Images were recorded with the 4× objective, and ATP concentration is shown on a pseudo-colour scale with the calibration curve in Fig. 1D. After 37% stretch of 1 s duration, ATP was released from multiple sites and reached a peak within ∼10 s. At response peak, its local concentration often exceeded 10 μm. Extracellular ATP decayed to near-background level within 2–3 min (Fig. 3B and C). Saturation of the imaging system was noticeable at highly-active spots where ATP concentration exceeded 10 μm, producing flat, blunted peaks, as seen with some traces in Fig. 3B. The data demonstrate that stretch-induced ATP release produces extracellular ATP concentrations sufficient for autocrine/paracrine stimulation of purinoreceptors on neighbouring cells, with typical EC50 in the submicromolar to micromolar range (von Kügelgen I & Wetter, 2000).
Figure 2. Stretch-induced ATP release sites are single cells.
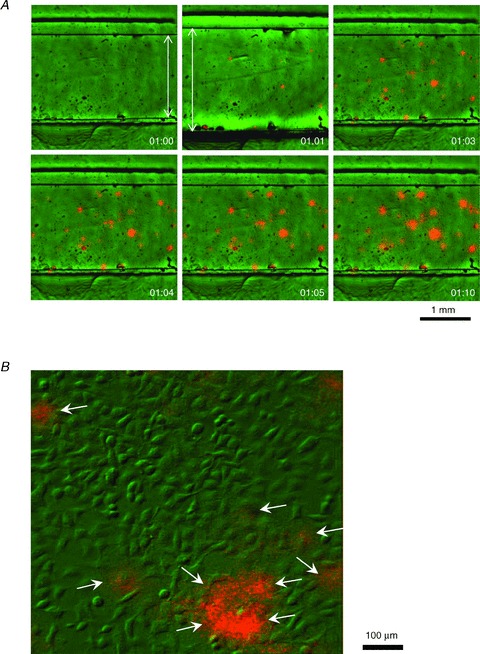
A, typical stretch-induced ATP release from A549 cell culture recorded at low magnification with 4× objective. Pictures in the panel reveal sequential overlay of luminescence (orange) and IR images (green) of the stretch chamber with cells growing in the 2 mm wide groove. Images were taken before, during and after 1 s stretch of 21%, at the elapsed times (min:s) indicated in the lower right corner. Note the displacement of chamber groove edges during stretch (elapsed time 01:00 versus 01:01), flagged by arrows. ATP-dependent luciferase luminescence is seen at several discrete sites of cell culture after stretch, although some responses are already detectable during 1 s stretch. B, stretch-induced ATP release recorded at higher magnification with 20× objective. The image overlay (green, differential interference contrast IR image; orange, ATP-dependent luminescence) reveals that ATP is released from single cells (indicated by arrows). The image was taken 3 s after a 25% stretch.
Figure 3. Time course of ATP release from A549 cells after a single stretch.
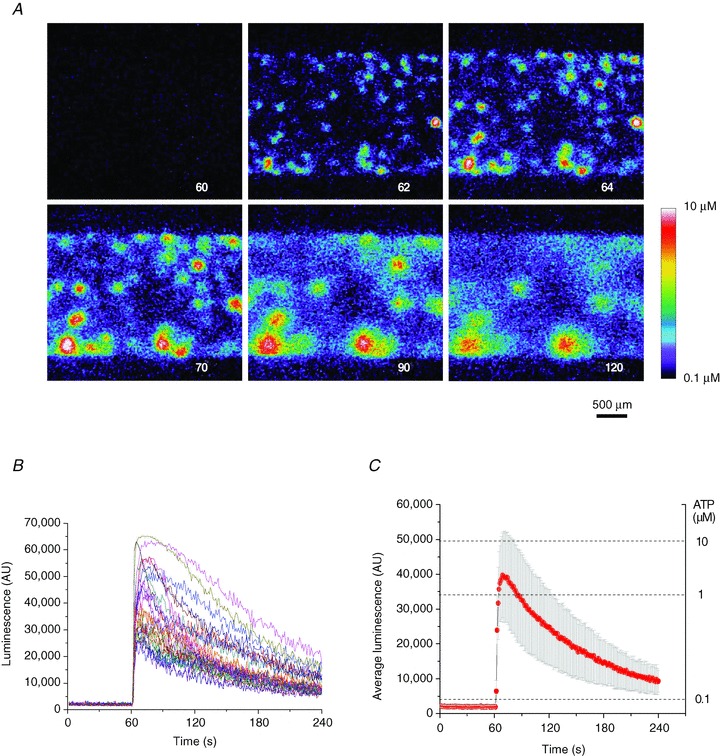
A, sequence of images showing ATP-dependent luminescence at different time points after 37% stretch of 1 s duration applied at 60 s. The experiment elapsed time (in seconds) is indicated in the lower right corner. A pseudo-colour scale of ATP concentration is shown on the lower right. Note the multiple ATP release sites and high (micromolar) ATP concentrations in their vicinity. The images disclose the cell culture area of approximately 3 × 2 mm. B, time course of local luminescence intensities at 37 release sites seen in A. Their average (±s.d.) is reported in C. Note the dual scale: luminescence intensity (left) and ATP concentration (right).
At the cellular level, stretch-induced ATP release responses showed significant variability between individual cells with respect to peak amplitude and release kinetics. In the example presented in Fig. 3B, single cell ATP release responses were further analysed by separating them into those with peak luminescence above the arbitrary threshold of 30,000 AU (approximately 1 μm ATP) or below 30,000 AU (Fig. 4A). Approximately half of the responses peaked above 1 μm ATP (20 of 37). Mean peak amplitudes (±s.d.) for the two groups were 45,300 ± 11,300 AU (∼8 μm), and 18,800 ± 4500 AU (∼0.6 μm respectively, statistically different at P < 0.05, two-sample t test, panel d in Fig. 4A). High-peak responses were further subdivided into those that show long-release duration, which resulted in half-peak width >30 s (six responses), and those of short duration, with half-peak width <30 s (14 responses) (panels a and b respectively in Fig. 4A). For more quantitative analysis of ATP release duration from individual cells, we examined the first time derivative of the luminescence signal, assuming that its maximum approximated the time when ATP release started, while its minimum represented termination of release (Fig. 4B). The ATP release responses fell into two separate groups with an average period of release of 55 s and 12 s respectively (panel c in Fig. 4B).
Figure 4. Peak amplitude and duration of ATP release from single cells.
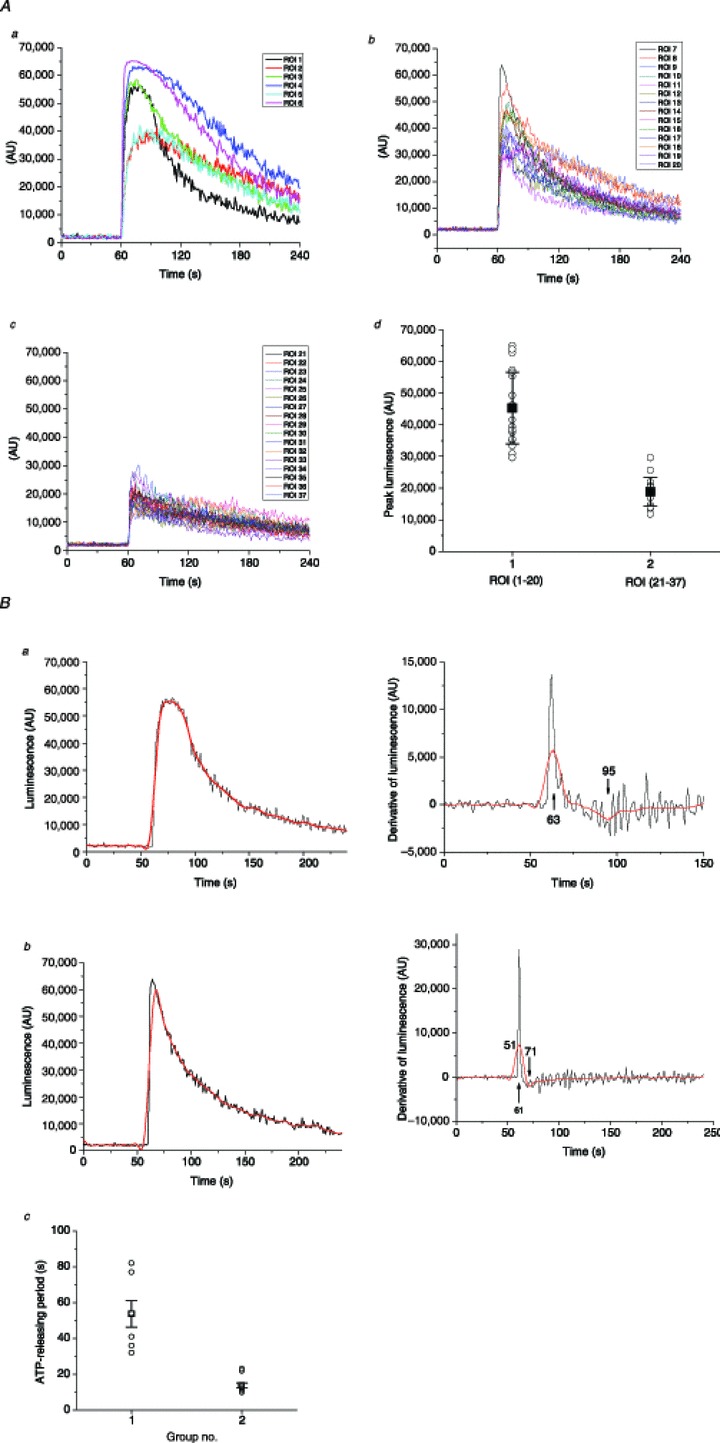
A, stretch-induced ATP release responses from individual cells observed in the Fig. 3 experiment were grouped according to peak amplitude and duration (see text for more details): panel a, high-peak (>1 μm) and long-duration responses (six of 37); panel b, high-peak and short-duration responses (14 of 37); panel c, low-peak responses (<1 μm, 17 of 37); panel d, peak amplitude histogram of all responses grouped into two categories: high-peak responses (ROI 1–20) and low-peak responses (ROI 21–37). Solid black squares indicate average peak amplitude (±s.d.) for the two groups; statistically, they were significantly different at P < 0.05 (two-sample t test). B, ATP release duration analysis. Two examples, one of long and one of short release responses, are shown as black traces on the left in panels a and b respectively. Red traces represent the same traces after smoothing the data with Origin Lab software. On the right of each trace are shown the first time derivative of responses, calculated with Origin Lab software without smoothing (black line) and with previous smoothing of the data (red line). Arrows indicate the derivative maximum and minimum, which correspond to the time when ATP release started and ended respectively. For the examples reported here, they were at 63 s and 95 s for long-duration release, and 61 s and 71 s for short-duration release. Panel c represents a histogram of ATP release periods of all 37 responses observed in this experiment, where they are separated into two groups of short and long duration (see text for more explanations). Black squares and error bars indicate the average ±s.d. for each group. The two groups were statistically different at P < 0.05 (two-sample t test). ROI, region of interest.
ATP release responses to multiple stretches
In this series of experiments, we investigated how cells respond to repetitive stretch stimulation. We evaluated the number of responding cells, the time course and peak amplitude of ATP release for each stretch. The reproducibility of cell responses to repeated stimulation was particularly important in subsequent investigations with ATP release blockers. Figure 5 gives such an example, where a sequence of four stretches of 29% amplitude was applied with a 30 min recovery period between them. The amplitude of the final fifth stretch was augmented to 36%. A surprising finding was that each stretch stimulus induced ATP release from different non-overlapping sets of cells. This is illustrated in Fig. 5A, which shows colour-coded responses to the first three stretches. The average time course of the ATP release-dependent luminescence response evoked by repetitive stretches appears in Fig. 5B. Typically, the first stretch produced longer-lasting responses compared to subsequent stretches. The average peak response and number of responding cells decreased gradually for each of the four sequential 29% stretches, but increased again when the amplitude of the fifth stretch was augmented to 36% (Fig. 5C and D). Thus, in later experiments, when the effect of, for example, different inhibitors was tested, the amplitude of each subsequent stretch was augmented by 5 ± 2% to maintain a comparable number and amplitude of ATP release responses.
Figure 5. ATP release responses to multiple stretches.
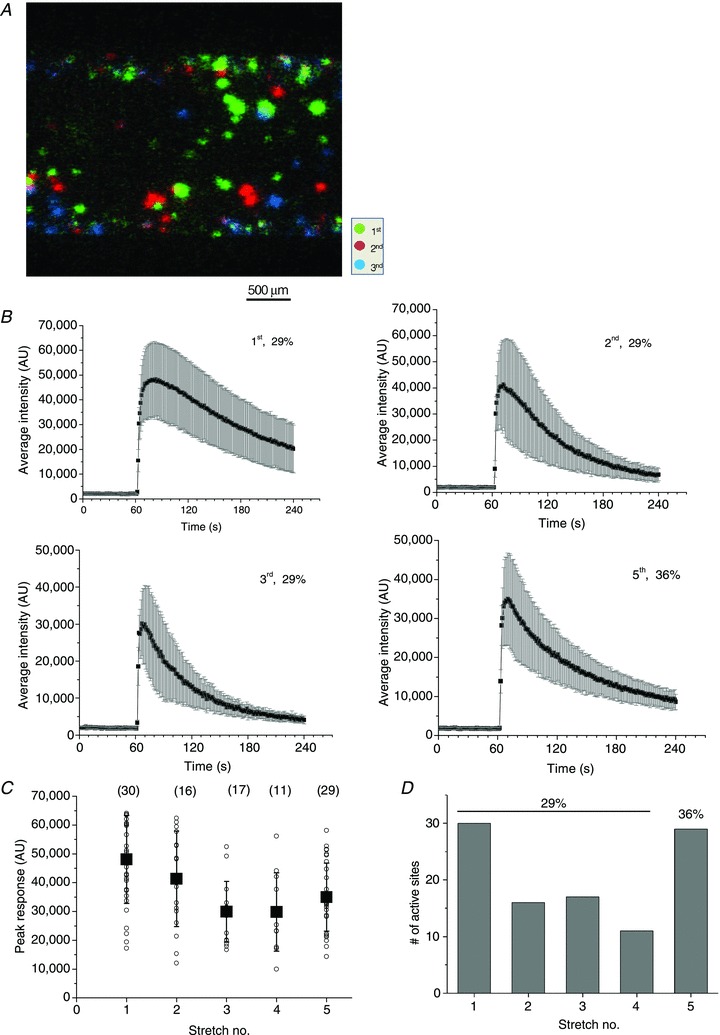
A, colour-coded responses to repeated stretches of the same magnitude (29%) separated by 30 min recovery. A sequence of four stretches was applied but, for clarity, only ATP release responses to the first three stretches are shown. Note that different groups of cells responded to each stretch stimulation. B, time course of ATP release responses to repeated stimulation. The data are from the same experiment reported in A, and each graph is the average (±s.d.) of ATP-dependent luminescence from all active sites after stretch. The sequential stretch number and its extent are indicated in the graphs. C, peak ATP release responses to repetitive stimulation in the experiment appearing in A and B. For each stretch, the symbol ○ represents peak ATP release from individual sites, and ▪ is the average ±s.d. for all responding sites (their numbers are indicated in parentheses). D, the number of responding cells decreased gradually from 30 for the first stretch to 15 for the fourth stretch, but increased to 29 when the amplitude of the fifth stretch was augmented to 36%.
The number of responding cells grows with increasing extent of stretch
Figure 6A reports the relationship between the number of cells responding to single stretch and the extent of stretch. It indicates that stretch of at least 10% is required to induce ATP release, and the number of responding cells grows with increasing stretch amplitude. At the highest extensions tested (∼40%), the number of responding cells exceeded ∼30 or ∼1% of all cells in the field of view (∼2500) under our standard experimental conditions, i.e. 4× magnification and near-confluent cell culture.
Figure 6. The number of responding cells grew with the extent of stretch.
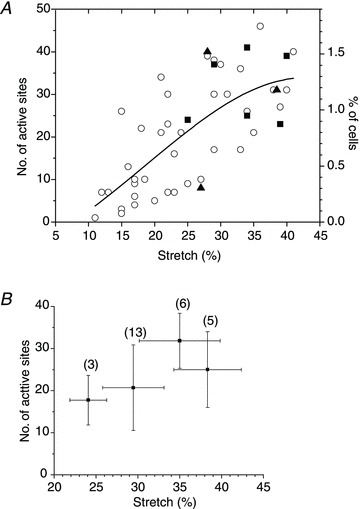
A, the graph shows the number of cells releasing ATP after a single 1 s stretch of different amplitudes. Cumulative data from 48 experiments with 24 cell cultures, performed at low magnification (4× objective) with typically 2000–3000 cells in the field of view. The graph also includes data from the same cell cultures subjected to sequential stretches of increasing amplitude. ○, control; ▴, presence of the anion channel inhibitor 5-nitro-2-(3-phenylpropyl-amino) benzoic acid (100 μm); ▪, presence of the pannexin channel inhibitor carbenoxolone (100 μm). The continuous line represents Gaussian fit to the data. B, average number of cells (±s.d.) responding to a sequence of four stretches of increasing amplitude. This stretch protocol was used typically when testing the effect of putative ATP release inhibitors. Horizontal error bars indicate the s.d. of average stretch in each group of the sequential stretch protocol, and the number of stretches in each group is indicated in parentheses.
Effect of ATP release inhibitors
Figure 6A also shows that the number of responding cells was not different from those under control conditions when stretch was applied in the presence of the pannexin channel inhibitor CBX (100 μm) or the anion channel inhibitor NPPB (100 μm). To test the effect of ATP release inhibitors more systematically, we adopted a stimulus protocol consisting of a sequence of four stretches of increasing amplitude, separated by 30 min recovery. The extent of each subsequent stretch was increased by 3–7%. The first one or two stretches were carried out in the absence of an inhibitor and served as controls, while the last two stretches were performed in the presence of an inhibitor. To obtain a sufficient number of ATP release sites for analysis, the first stretch stimulus was typically at least 20%. Figure 6B illustrates the average number of ATP release sites in response to four subsequent stretches under control conditions (no inhibitor), when such a stimulus protocol was employed. The average number of responding cells showed a tendency to increase modestly after each subsequent stretch. Figure 7 indicates that 100 μm CBX did not change the time course or the average amplitude of stretch-induced ATP release, and the number of responding cells remained comparable. In the depicted example, 11 cells responded to stretch under control conditions in comparison to 18 in the presence of 100 μm CBX, which was within the usual variability range observed between two consecutive stretches of increasing amplitude (22% and 28%).
Figure 7. Effect of CBX on ATP release.
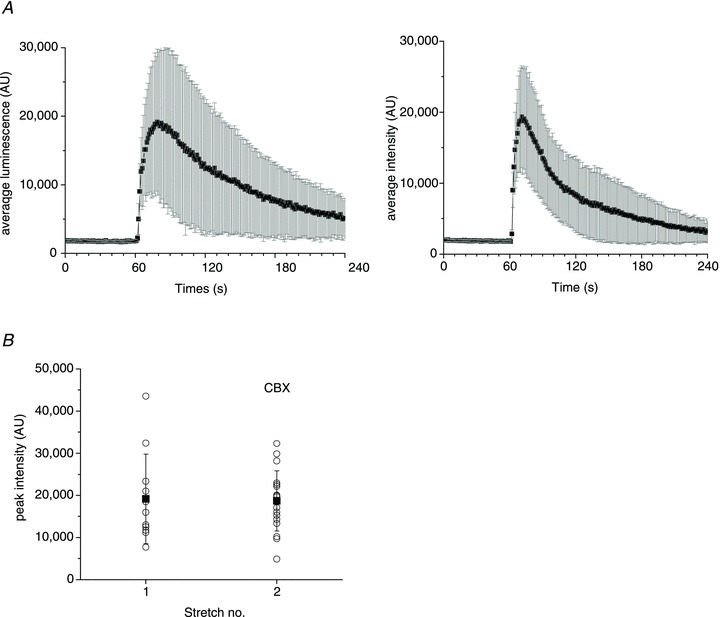
A, average (±s.d.) time course of ATP release from all responding sites induced by 22% stretch under control conditions, and 30 min later in response to 28% stretch in the presence of 100 μm CBX (left and right graphs respectively). B, peak ATP release responses from all active sites in the absence and presence of CBX. The data are from the same experiment as in A. For each stretch, the symbol ○ represents peak ATP release from individual release sites, and ▪ is the average ±s.d. for all responding sites. The data are representative of n= 10 experiments with five different cell cultures in the presence of 100 μm CBX. CBX, carbenoxolone.
Figure 8A shows the time course of stretch-induced ATP release under control conditions (first stretch) and after treatment with 1 mm NEM (second and third stretches). The second stretch, applied during NEM treatment, presents a dramatic change in the ATP release time course with ∼6-fold increment of the decay half time to approximately 6 min in comparison to control cells. Thirty minutes later, in response to the third stretch, release was significantly inhibited, with very transient (<1 min) responses of reduced amplitude and with only three cells responding, compared to 29 and 17 cells responding to the first and second stretches, respectively (Fig. 8A and B). Strong inhibition was particularly apparent when cumulative ATP release during the 3 min period after stretch stimulation was compared (Fig. 8C). The inhibitory effect was due to the NEM action on cells and not to interference with LL luminescence. NEM also did not affect the ATPase activity of apyrase present in the LL mix, verified in separate experiments where 1 mm NEM did not alter the sensitivity or decay kinetics of ATP-dependent LL luminescence measured in a luminometer (Supplemental Fig. 2).
Figure 8. Effect of NEM on ATP release.
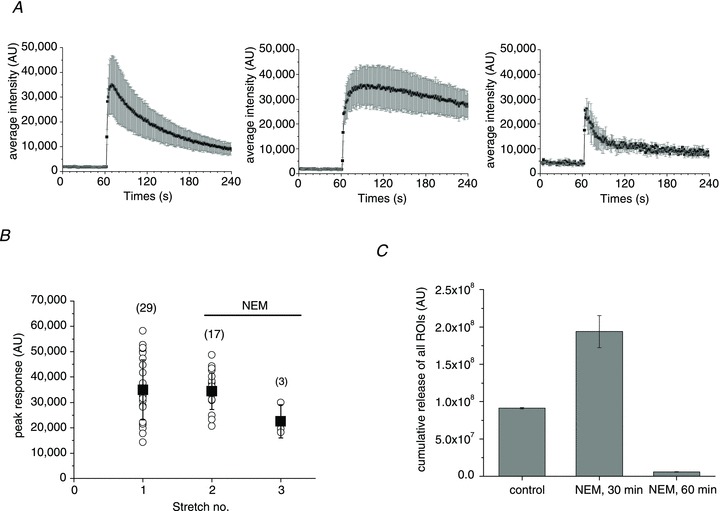
A, average (±s.d.) time course of ATP release from all responding sites under control conditions (left) and after treatment with 1 mm NEM for 30 and 60 min (centre and right graphs respectively). B, peak ATP release responses before and after NEM treatment. The data are from the same experiment as in A. For each stretch, the symbol ○ represents peak ATP release from individual release sites, and ▪ is the average ±s.d. for all responding sites (their number is indicated in parentheses). C, cumulative stretch-induced ATP release for all responding sites observed under control conditions and after 30 and 60 min of NEM treatment. Data are the average ±s.d. for the experiments in A and B. They are representative of n= 13 stretches in the presence of NEM with six different cell cultures. NEM, N-ethylmaleimide.
Bafilomycin (5 μm), an H+-ATPase inhibitor, did not significantly affect the number of responding cells or the time course of release, but the amplitude of ATP release from individual responding sites was significantly weaker, leading to overall ∼40% reduction of cumulative ATP release in these experiments (Fig. 9).
Figure 9. Effect of bafilomycin on ATP release.
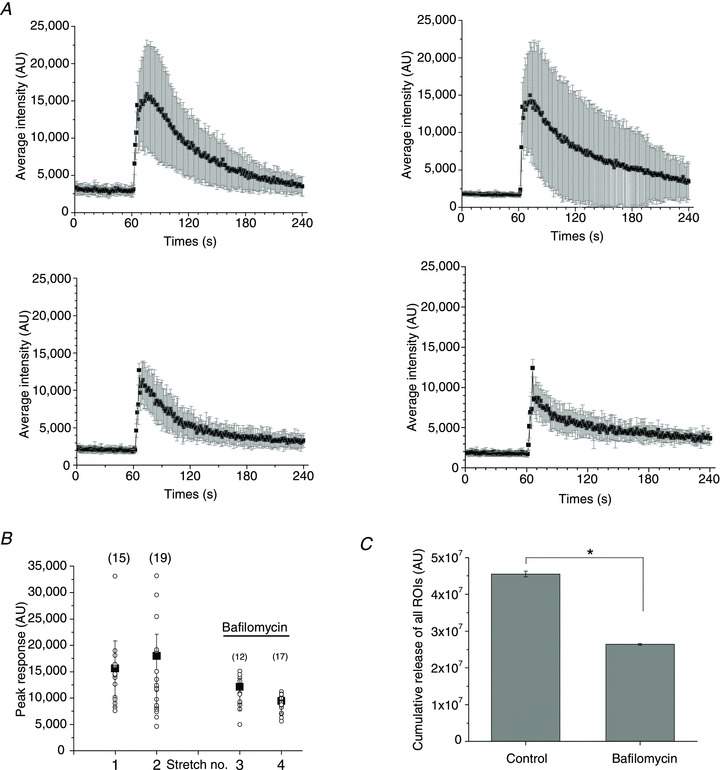
A, average (±s.d.) time course of ATP release from all responding sites under control conditions (two upper graphs) and after treatment with 5 μm bafilomycin for 30 and 60 min (left and right lower graphs respectively). The number of responding cells were similar for the two stretches under control conditions (15 and 19), compared to those observed in the presence of bafilomycin (12 and 17). B, peak ATP release responses before and after bafilomycin treatment. The data are from the same experiment as in A. For each stretch, the symbol ○ represents peak ATP release from individual release sites, and ▪ is the average ±s.d. for all responding sites (their number is indicated in parentheses). C, cumulative stretch-induced ATP release from all responding sites under control conditions and after treatment with bafilomycin. Data are the average ±s.d. of the experiments in A and B. They are representative of n= 6 stretches in the presence of bafilomycin with three different cell cultures. *Statistically significant difference (P < 0.05, two-sample t test).
ATP release from wound-healing areas
Subconfluent, typically 1–2-day-old cell cultures were tested in all experiments described above. Older cultures that reached full cell confluence displayed a significantly lower number of ATP release responses under our standard experimental conditions: <0.2% of cells in the field of view for stretches of >20%. Interestingly, when a scratch wound was created in such confluent cell cultures and allowed to ‘heal’ for 8–24 h, the wound area showed dramatically enhanced responses to stretch. Figure 10 illustrates such an example, where 16 h after the wound was created, its area was repopulated by migrating/proliferating cells. Cells in the wound area displayed significantly enhanced susceptibility to stretch compared to cells in the intact area, resulting in ATP release responses almost exclusively in the wound-healing area. On average, the number of stretch-responding cells was ∼3-fold higher in the wound area compared to intact areas of confluent cell cultures (Fig. 10C). Closer examination of wound area images revealed that the cells were more spread out and flat, resembling cells in subconfluent cell cultures as opposed to densely packed cells in intact areas (see inset in Fig. 10B).
Figure 10. Enhanced ATP release responses during wound healing.
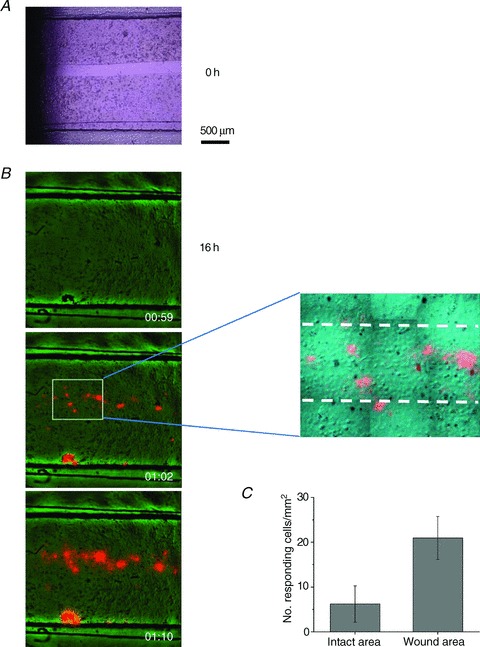
A, a ∼200 μm wide gap was created in a 2-day-old, fully confluent cell monolayer (t= 0) by removing a silicone strip that was attached to the bottom of the stretch chamber during cell seeding. The bright field image was taken with an inverted Nikon microscope, 20× objective. B, example of stretch-induced ATP release responses observed with cell cultures such as that appearing in A, after 16 h, when it was repopulated by new cells. The overlay of ATP-dependent luminescence (orange) and IR images (green) of cells in the stretch chamber are shown before stimulation, and 2 s and 10 s after 28% stretch. Note that almost all responses were within the wound-healing area, except for one artefact at the lower edge of the chamber, where some cells were agitated by debris visible in this spot on the image before stretch. The latter was excluded from the analysis. The zoomed region of the middle image discloses the ∼200 μm wide wound area, indicated by broken lines. Note that cells in the wound area are more spread out and flat compared to densely packed cells in the intact area, i.e. outside the broken lines. C, number of responding cells per mm2 in the wound-healing area was significantly enhanced when compared to the intact part of the same cell culture (P < 0.05, two-sample t test). Data are the average of five experiments/stretches with three different cell cultures.
Role of extracellular and intracellular Ca2+ in stretch-induced ATP release
Figure 11A, panels a and b, illustrates that extracellular Ca2+ removal had no effect on stretch-induced ATP release. The time course of release, its average amplitude and number of responding cells remained similar to those observed in the presence of extracellular Ca2+ (as shown above in Fig. 3). In contrast, [Ca2+]i chelation with BAPTA significantly reduced peak ATP responses and the number of responding cells, demonstrating that [Ca2+]i plays an important role in stretch-induced ATP release, (panel c in Fig. 11A and Supplemental Fig. 3).
Figure 11. Role of Ca2+ in stretch-induced ATP release.
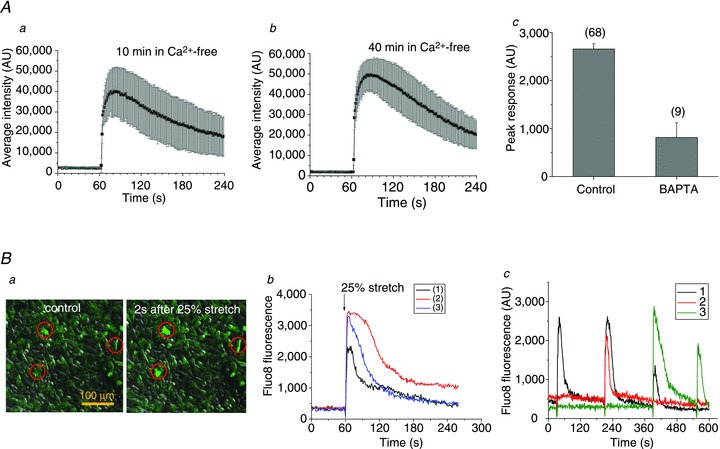
Aa and b show the average (±s.d.) time course of ATP release from all responding cells induced by stretch applied 10 min and 40 min, respectively, after removal of extracellular Ca2+. The two stretches were of 26% and 31% and the corresponding number of ATP releasing cells was 17 and 28. The responses were not different from those observed in the presence of extracellular Ca2+ (see Fig. 3). c, effect of a Ca2+ chelator BAPTA on stretch-induced ATP release. The graph shows average (±s.e.m.) of peak ATP release in control and BAPTA-loaded cells, and the number of responding cells appears in parentheses. Cells were loaded with 30 μm BAPTA-AM (80 min, 37°C). Ba, Fluo8 fluorescence and DIC overlay images of A549 cells in a stretch chamber before (control) and 2 s after 25% stretch, in left and right images respectively. The stretch-induced [Ca2+]i elevations seen as fluorescence increase in cells marked by red circles. b, example of time course of [Ca2+]i changes, recorded as Fluo8 fluorescence intensity, in three A549 cells, shown in a, that responded to single stretch. Stretch was applied at 60 s (indicated by the arrow). c, time course of [Ca2+]i responses to repetitive stimulation reported as Fluo8 fluorescence in three different cells in the field of view (indicated by black, green and red traces). A sequence of four stretches (28%, 34%, 34% and 39%) was applied at 30, 210, 390 and 550 s.
To investigate the effect of cell stretch on [Ca2+]i, Fluo8-loaded cells were subjected to stretch stimulation in a similar way as in the ATP release experiments. Panel a in Fig. 11B indicates that only a limited number of cells responded to the stimuli. The responses were rapid, peaking in ≤1 s, followed by a gradual decline to the background level in about 2 min (panel b in Fig. 11B). Similar responses were observed in Ca2+-free extracellular solutions, suggesting that they do not involve influx from the extracellular spaces but release from intracellular stores (data not included). Ca2+ responses to repetitive stimulation are depicted in Fig. 11B, panel c, showing that, in contrast to ATP release, here, the same cells may respond to repeated stimuli. Cell 1 responded to the first three of four stretches, while cell 2 only responded to the second stretch, and cell 3 responded to the last two stretches (third and fourth). Thus, when subjected to repeated stimuli, cells respond to some but not all stretches. Because stretch-induced Ca2+ responses may occur in the same cell, overall, they were observed more frequently than ATP release. When subjected to single stretch, in addition to rapid Ca2+ responses, such as those seen in Fig. 11, delayed responses could be observed, as illustrated in Fig. 12A, panel a. A rapid Ca2+ response was first triggered in cell 1 but, after a short delay, it propagated to neighbouring cells flagged by numbers 2–10. Compared to the rapid response in cell 1, these delayed responses were usually weaker and often displayed oscillations (Fig. 12A, panel b). The time delay of the Ca2+ response in cells 2–10 increased with distance from the source cell (as depicted in Fig. 12A, panel c), indicating that the process may involve extracellular diffusion of signalling molecules, such as ATP. Indeed, such Ca2+ waves were not observed in the presence of the ATP hydrolysing enzyme apyrase (20 U ml−1) or the non-specific purinoreceptor antagonist suramin (300 μm–1 mm), but were seen again after washing (Fig. 12B, panels a–c).
Figure 12. Ca2+ wave propagation induced by single stretch.
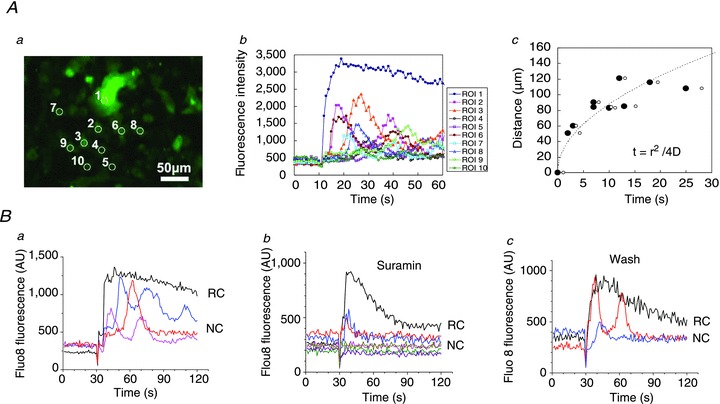
Aa, [Ca2+]i responses, reported as Fluo8 fluorescence, in A549 cells after 28% stretch. The [Ca2+]i response was first triggered in cell 1; after a short delay, it propagated to neighbouring cells flagged by numbers 2–10. The image is an average of 30 sequential images taken during 30 s after stretch. b, time course of stretch-induced [Ca2+]i responses in cells 1–10 shown in a. Note the two types of responses: rapid and sustained [Ca2+]i response in cell 1 (primary response, black trace), and delayed, often oscillatory responses (secondary responses) in cells 2–8 (coloured traces). c, time-dependent propagation of Ca2+ wave. For each cell, the time when [Ca2+]i started to rise (filled circles) and the time of half-maximum [Ca2+]i responses (open circles) were plotted against the distance from cell 1 (region of interest 1). The broken line represents a fit to data points of the diffusion equation t=r2/4D, where r is distance from the source, t is time of the response at position r, and D is the diffusion constant. Here, from the fitted curve, D= 192 μm2 s−1. Ba, under control conditions, rapid and sustained [Ca2+]i elevation in a stretch-responding cell (RC, black trace) was followed by a number of delayed and oscillatory [Ca2+]i responses in neighbouring cells (NC, coloured traces) located up to ∼100 μm from the RC, 25% stretch. b, in the presence of 1 mm suramin, only cells directly adjacent to the stretch-responding cell showed a weak response, but no oscillations and no responses were observed in more distant cells, 30% stretch. c, the inhibitory effect of suramin was reversible. After washing, delayed [Ca2+]i responses in distant cells and oscillatory responses could again be seen, 40% stretch.
Discussion
In this study, we imaged extracellular ATP by LL luminescence in real time. We found that a minimum of ∼10% stretch was required to induce ATP release from subconfluent A549 cell monolayers. ATP release hot spots, fulfilling the criteria of >5-fold increase of the luminescence signal above background and an equivalent diameter of at least 16.5 μm, were identified as single cells, although groups of closely located cells releasing ATP were also observed. The number of responding cells grew with increasing extent of stretch within the range 10–25%, but remained low, typically ≤1.5% of all cells in the field of view, even at the highest stretches tested (∼40%). Here, the stretches were in the physiologically relevant range. Estimates of linear distension in alveoli range from ∼10 to 33% during lung volume expansion at ∼40–80% of total lung capacity (Roan & Waters, 2011). Interestingly, direct measurement of rat alveolar wall deformation by optical sectioning microscopy revealed that distension, even within a single alveolus, was markedly non-uniform. Different segments within the same alveolus distended as little as 5% or as much as 25% of initial length at 82% total lung volume (Perlman & Bhattacharya, 2007).
Despite the low fraction of responding cells, the amount of released ATP induced by single 1 s stretch was high, often exceeding 10 μm in the immediate vicinity of the source cell. The area of micromolar ATP concentration, sufficient for autocrine/paracrine stimulation of purinoreceptors, extended at least ∼150 μm from the ATP releasing cell (Fig. 3). A similar range of autocrine/paracrine effects is also implicated by the extent of Ca2+ wave propagation that likely involves extracellular diffusion of released ATP (Fig. 12). Considering the relatively large extracellular volume in our experiments, even higher ATP concentrations might be expected in confined extracellular spaces in vivo, in a thin alveolar surface–liquid layer. Thus, physiologically relevant stretches might be expected to induce ATP release capable of initiating purinergic signalling cascades near the source cell and likely extending well beyond the 150 μm seen here. Therefore, it is possible that stretch-induced ATP release from a single cell might be sufficient to activate P2 receptors in almost entire human alveoli of average ∼200 μm radius (Ochs et al. 2004) and contribute to the regulation of alveoli surface liquid (Bove et al. 2010) and surfactant secretion (Rice, 1990).
At the single cell level, ATP responses to single stretch were highly non-uniform with respect to release amplitude and duration. Assuming that release involves vesicular exocytosis (see discussion below), it may be attributed to several factors, including different pools of ATP containing vesicles and their variable size in individual stretch-responding cells, different rates of vesicle recruitment, priming and fusion during the release process as well as different ATP concentrations in individual vesicles. In a recent study with A549 cells we found a highly variable number of vesicles fluorescently labelled with quinacrine or a fluorescent ATP analog BODIPY-ATP (Akopova et al. 2012). It would be interesting in future investigations to examine how different patterns of such staining correlate with stretch-induced single cell ATP responses.
To obtain information on ATP release kinetics from single cells, we analysed the time course of luminescence responses after stretch stimulation. In general, the time course of luminescence responses in our imaging experiments was complex and, in addition to time-dependent ATP release, it depended on several other processes, including (1) ATP diffusion from the release site, i.e. out of a region of interest (ROI) where luminescence was measured, and (2) the ATP degradation/consumption rate by luciferase and apyrase present in commercial LL mix. To assess the contribution of these two processes, we examined the luminescence responses to a brief step-like pulse of ATP ejected from micropipettes, as shown in Fig. 1, which closely mimics cellular ATP release. We found that the response observed within a ROI placed at the pipette tip terminates with a time constant of about 50 s, regardless of the ATP concentration ejected. This luminescence decay is due to both ATP diffusion out of the ROI and ATP consumption by luciferase and apyrase. To ascertain the rate of ATP consumption, we measured the response within a large ROI encompassing almost full image. With this approach, where the contribution of ATP diffusion was minimized, the luminescence signal decayed with a time constant of several hundred seconds. Thus, ATP diffusion away from a release point, pipette tip or cell, has the strongest impact on the luminescence decay rate. It also means that, during cellular ATP release, rapid luminescence decay with a time constant of ∼50 s should be indicative of release termination. The approach we chose to more precisely determine the duration of ATP release involved calculation of the first time derivative of luminescence responses, assuming that its maximum and minimum correspond to release onset and termination.
Our study revealed that, at the single cell level, stretch-induced ATP release depends on: (i) cell shape and (ii) the timing of stretch application, and (iii) may correlate with [Ca2+]i elevation.
IR images showed that most, if not all, responding cells were flat with large substrate attachment areas, demonstrating that cell shape and the extent of substrate attachment are important factors defining cell responsiveness to substrate distension. Sensing of mechanical forces at the single cell level depends on cell interactions with adjacent cells and the extracellular matrix. Focal adhesions are particularly important in transmitting forces during substrate distension on to cells by providing mechanical links between the actomyosin cytoskeleton and extracellular matrix (DuFort et al. 2011). Owing to large substrate contact areas, flat cells would display greater sensitivity to substrate distension than cells of similar size/volume but small substrate contact area. This is consistent with the observation that A549 cell responsiveness to stretch drops to <0.2% in fully confluent cell cultures, where cells have limited substrate space available, smaller base and assume a more cuboidal shape. Our observation that ATP release was significantly enhanced in the wound-healing area could be attributed, at least in part, to the fact that cells repopulating the cell-free wound area are usually flat with large substrate attachment (as illustrated in Fig. 10B). Morphologically, such cells may resemble alveolar type 1 (AT1) cells, consistent with the fact that AT2 cells serve as progenitors to replenish AT2 and AT1 cell populations after lung injury (Adamson & Bowden, 1975; Uhal, 1997; Crosby et al. 2011).
Although flat cells are present in large numbers in low confluence A549 cell cultures, not all such cells respond to stretch. We noticed that the timing of stretch application was important, as demonstrated by the fact that stretches repeated at 30 min intervals induced ATP release from different non-overlapping sets of cells. It suggests that not all cells are in a release ready state at all times. This might be expected because, in addition to architectural factors determining force transmission, mechano-sensitive ATP release is controlled by a series of downstream force-dependent biochemical reactions and activation of intracellular signalling pathways. Furthermore, consistent with the emerging view that interconnected signalling networks rather than discrete linear pathways encode the specificity of external stimuli, cellular responses will be determined by the spatial and temporal dynamics of downstream signalling (Kholodenko, 2006). Timing of the stimulus is also important for stretch-induced Ca2+ responses, where the same cell may respond to, e.g. the first two to three repeated stretches, while other cells may respond only to subsequent second or third stretches, as illustrated in Fig. 12. Thus, mechano-purinergic transduction in alveoli appears to be a highly complex and tightly regulated signalling system.
We have reported previously that ATP release in A549 cells, induced by hypotonic stress or cell deformation by tension forces at the air–liquid interface, is a Ca2+-dependent process likely involving exocytosis of ATP-loaded vesicles. Stress-induced [Ca2+]i elevations are mainly due to Ca2+ mobilization from intracellular stores, and both Ca2+ and ATP release responses are not affected by short-term Ca2+ removal from the extracellular spaces (Boudreault & Grygorczyk, 2004; Tatur et al. 2007; Ramsingh et al. 2011; Akopova et al. 2012). This was also confirmed in the present study of stretch-induced ATP release and Ca2+ responses (Fig. 11). Stretch-induced ATP release is also a Ca2+-dependent process, as indicated by its inhibition in BAPTA-loaded cells. Furthermore, after stretch both [Ca2+]i and ATP release responses showed similar rapid onset and were limited to ≤1.5% of cells, which suggests they may occur in the same cells. Direct proof, however, requires simultaneous real-time imaging of ATP release and [Ca2+]i responses, which was not possible with our current microscopy system. In addition to rapid stretch-induced primary [Ca2+]i responses, we also observed delayed responses, which were likely secondary to ATP release and may have resulted from P2Y receptor activation on neighbouring cells. The rate of such Ca2+ wave propagation is consistent with ATP diffusion in the extracellular spaces. The diffusion coefficient, D, of 192 μm2 s−1 found here is comparable to that of ATP diffusion in water (∼300 μm2 s−1) and cytoplasm (∼150 μm2 s−1) (Bennett et al. 1995; Macdonald et al. 2008). The number of cells releasing ATP was lower than those showing rapid [Ca2+]i elevation. This might be attributed to the fact that [Ca2+]i elevation alone is not sufficient to produce full ATP release responses, as observed previously when A549 cells were stimulated solely by [Ca2+]i elevation with the Ca2+ ionophore, ionomycin (Boudreault & Grygorczyk, 2004). It has been demonstrated that the full ATP release responses induced by receptor stimulation or hypotonic shock in A549 cells require concomitant activation of the Rho/Rho kinase signalling pathway (Seminario-Vidal et al. 2009, 2011).
The mechanisms of ATP release from non-excitable cells remain incompletely understood. Except for Ca2+-dependent vesicular exocytosis, alternative mechanisms involving different ATP-conducting channels have been proposed. Among them, pannexins, a family of proteins structurally homologous to connexins, are often implicated in cellular ATP release from a wide range of cell types, including A549 cells (Seminario-Vidal et al. 2011). However, in the present study, CBX, a specific inhibitor of pannexin channels, as well as NPPB, an inhibitor of volume-regulated anion channels, had no influence on stretch-induced ATP release. In contrast, ATP release was significantly inhibited by NEM and bafilomycin, indicating the involvement of vesicular exocytosis. This is consistent with an earlier study with A549 cells where disruption of the cytoskeleton, interference with vesicle formation and [Ca2+]i chelation, diminished ATP release (Tatur et al. 2007; Ramsingh et al. 2011; Akopova et al. 2012).
In summary, our data demonstrate that physiologically relevant cell distension of more than 10% may induce ATP release sufficient to activate the purinergic signalling system in alveoli. Such mechano-purinergic signalling could play an important role in alveoli physiology and pathophysiology, including regulation of electrolyte transport, surfactant secretion and wound healing.
Acknowledgments
This study was supported in part by the Canadian Institutes of Health Research,Natural Sciences and Engineering Council of Canada and Japan Society for the Promotion of Science (JSPS) (R.G.), by JSPS through the Funding Program for World-Leading Innovative R&D on Science and Technology (FIRST Program) initiated by the Council for Science and Technology Policy (K.F.), and by JSPS KAKENHI Grant 23300136 and 24590274.
Glossary
- AT1 and AT2
alveolar type 1 and type 2 cells
- AU
arbitrary units
- [Ca2+]i
intracellular calcium concentration
- CCD
charge-coupled device
- CBX
carbenoxolone
- DMEM
Dulbecco's modified Eagle's medium
- LL
luciferin–luciferase
- NA
numerical aperture
- NEM
N-ethylmaleimide
- NPPB
5-nitro-2-(3-phenylpropyl-amino) benzoic acid
- PS
physiological solution
- ROI
region of interest
Author contributions
R.G. and K.F. contributed to the design of the study, data collection, analysis and drafted the article. M.S. contributed to data interpretation and revising the article for important intellectual content. All authors revised and approved the final version of the manuscript.
Supplementary material
Supplemental Fig. 1
Supplemental Fig. 2
Supplemental Fig. 3
Supplemental Movie 1
Supplemental Movie 2
Supplemental Movie 3
References
- Abbracchio MP, Burnstock G, Verkhratsky A, Zimmermann H. Purinergic signalling in the nervous system: an overview. Trends Neurosci. 2009;32:19–29. doi: 10.1016/j.tins.2008.10.001. [DOI] [PubMed] [Google Scholar]
- Adamson IY, Bowden DH. Derivation of type 1 epithelium from type 2 cells in the developing rat lung. Lab Invest. 1975;32:736–745. [PubMed] [Google Scholar]
- Akopova I, Tatur S, Grygorczyk M, Luchowski R, Gryczynski I, Gryczynski Z, Borejdo J, Grygorczyk R. Imaging exocytosis of ATP-containing vesicles with TIRF microscopy in lung epithelial A549 cells. Purinergic Signal. 2012;8:59–70. doi: 10.1007/s11302-011-9259-2. [DOI] [PMC free article] [PubMed] [Google Scholar]
- Bennett MR, Farnell L, Gibson WG. Quantal transmission at purinergic synapses: stochastic interaction between ATP and its receptors. J Theor Biol. 1995;175:397–404. [PubMed] [Google Scholar]
- Boudreault F, Grygorczyk R. Cell swelling-induced ATP release is tightly dependent on intracellular calcium elevations. J Physiol. 2004;561:499–513. doi: 10.1113/jphysiol.2004.072306. [DOI] [PMC free article] [PubMed] [Google Scholar]
- Bove PF, Grubb BR, Okada SF, Ribeiro CM, Rogers TD, Randell SH, O’Neal WK, Boucher RC. Human alveolar type II cells secrete and absorb liquid in response to local nucleotide signaling. J Biol Chem. 2010;285:34939–34949. doi: 10.1074/jbc.M110.162933. [DOI] [PMC free article] [PubMed] [Google Scholar]
- Burnstock G. Purinergic signalling. Br J Pharmacol. 2006;147(Suppl 1):S172–S181. doi: 10.1038/sj.bjp.0706429. [DOI] [PMC free article] [PubMed] [Google Scholar]
- Burnstock G. Unresolved issues and controversies in purinergic signalling. J Physiol. 2008;586:3307–3312. doi: 10.1113/jphysiol.2008.155903. [DOI] [PMC free article] [PubMed] [Google Scholar]
- Crosby LM, Luellen C, Zhang Z, Tague LL, Sinclair SE, Waters CM. Balance of life and death in alveolar epithelial type II cells: proliferation, apoptosis, and the effects of cyclic stretch on wound healing. Am J Physiol Lung Cell Mol Physiol. 2011;301:L536–L546. doi: 10.1152/ajplung.00371.2010. [DOI] [PMC free article] [PubMed] [Google Scholar]
- Dietl P, Haller T. Exocytosis of lung surfactant: from the secretory vesicle to the air-liquid interface. Annu Rev Physiol. 2005;67:595–621. doi: 10.1146/annurev.physiol.67.040403.102553. [DOI] [PubMed] [Google Scholar]
- Dietl P, Haller T, Frick M. Spatio-temporal aspects, pathways and actions of Ca2+ in surfactant secreting pulmonary alveolar type II pneumocytes. Cell Calcium. 2012 doi: 10.1016/j.ceca.2012.04.010. [DOI] [PubMed] [Google Scholar]
- DuFort CC, Paszek MJ, Weaver VM. Balancing forces: architectural control of mechanotransduction. Nat Rev Mol Cell Biol. 2011;12:308–319. doi: 10.1038/nrm3112. [DOI] [PMC free article] [PubMed] [Google Scholar]
- Edwards YS. Stretch stimulation: its effects on alveolar type II cell function in the lung. Comp Biochem Physiol A Mol Integr Physiol. 2001;129:245–260. doi: 10.1016/s1095-6433(01)00321-x. [DOI] [PubMed] [Google Scholar]
- Furuya K, Harada K, Sokabe M. Three types of ATP-release in mammary epithelial cells revealed by ATP imaging. Purinergic Signal. 2008;(Suppl.5):S91. (Abstract) [Google Scholar]
- Grygorczyk R, Hanrahan JW. CFTR-independent ATP release from epithelial cells triggered by mechanical stimuli. Am J Physiol Cell Physiol. 1997;272:C1058–C1066. doi: 10.1152/ajpcell.1997.272.3.C1058. [DOI] [PubMed] [Google Scholar]
- Kholodenko BN. Cell-signalling dynamics in time and space. Nat Rev Mol Cell Biol. 2006;7:165–176. doi: 10.1038/nrm1838. [DOI] [PMC free article] [PubMed] [Google Scholar]
- Lazarowski ER, Boucher RC. Purinergic receptors in airway epithelia. Curr Opin Pharmacol. 2009;9:262–267. doi: 10.1016/j.coph.2009.02.004. [DOI] [PMC free article] [PubMed] [Google Scholar]
- Lazarowski ER, Homolya L, Boucher RC, Harden TK. Direct demonstration of mechanically induced release of cellular UTP and its implication for uridine nucleotide receptor activation. J Biol Chem. 1997;272:24348–24354. doi: 10.1074/jbc.272.39.24348. [DOI] [PubMed] [Google Scholar]
- Lazarowski ER, Sesma JI, Seminario-Vidal L, Kreda SM. Molecular mechanisms of purine and pyrimidine nucleotide release. Adv Pharmacol. 2011;61:221–261. doi: 10.1016/B978-0-12-385526-8.00008-4. [DOI] [PubMed] [Google Scholar]
- Macdonald CL, Yu D, Buibas M, Silva GA. Diffusion modeling of ATP signaling suggests a partially regenerative mechanism underlies astrocyte intercellular calcium waves. Front Neuroeng. 2008;1:1. doi: 10.3389/neuro.16.001.2008. [DOI] [PMC free article] [PubMed] [Google Scholar]
- Ochs M, Nyengaard JR, Jung A, Knudsen L, Voigt M, Wahlers T, Richter J, Gundersen HJ. The number of alveoli in the human lung. Am J Respir Crit Care Med. 2004;169:120–124. doi: 10.1164/rccm.200308-1107OC. [DOI] [PubMed] [Google Scholar]
- Perlman CE, Bhattacharya J. Alveolar expansion imaged by optical sectioning microscopy. J Appl Physiol. 2007;103:1037–1044. doi: 10.1152/japplphysiol.00160.2007. [DOI] [PubMed] [Google Scholar]
- Praetorius HA, Leipziger J. ATP release from non-excitable cells. Purinergic Signal. 2009;5:433–446. doi: 10.1007/s11302-009-9146-2. [DOI] [PMC free article] [PubMed] [Google Scholar]
- Ramsingh R, Grygorczyk A, Solecki A, Cherkaoui LS, Berthiaume Y, Grygorczyk R. Cell deformation at the air-liquid interface induces Ca2+-dependent ATP release from lung epithelial cells. Am J Physiol Lung Cell Mol Physiol. 2011;300:L587–L595. doi: 10.1152/ajplung.00345.2010. [DOI] [PubMed] [Google Scholar]
- Rice WR. Effects of extracellular ATP on surfactant secretion. Ann N Y Acad Sci. 1990;603:64–74. doi: 10.1111/j.1749-6632.1990.tb37662.x. [DOI] [PubMed] [Google Scholar]
- Roan E, Waters CM. What do we know about mechanical strain in lung alveoli. Am J Physiol Lung Cell Mol Physiol. 2011;301:L625–L635. doi: 10.1152/ajplung.00105.2011. [DOI] [PMC free article] [PubMed] [Google Scholar]
- Sadananda P, Kao FC, Liu L, Mansfield KJ, Burcher E. Acid and stretch, but not capsaicin, are effective stimuli for ATP release in the porcine bladder mucosa: Are ASIC and TRPV1 receptors involved. Eur J Pharmacol. 2012;683:252–259. doi: 10.1016/j.ejphar.2012.02.041. [DOI] [PubMed] [Google Scholar]
- Seminario-Vidal L, Kreda S, Jones L, O’neal W, Trejo J, Boucher RC, Lazarowski ER. Thrombin promotes release of ATP from lung epithelial cells through coordinated activation of rho- and Ca2+-dependent signaling pathways. J Biol Chem. 2009;284:20638–20648. doi: 10.1074/jbc.M109.004762. [DOI] [PMC free article] [PubMed] [Google Scholar]
- Seminario-Vidal L, Okada SF, Sesma JI, Kreda SM, Van Heusden CA, Zhu Y, Jones LC, O’Neal WK, Penuela S, Laird DW, Boucher RC, Lazarowski ER. Rho signaling regulates pannexin 1-mediated ATP release from airway epithelia. J Biol Chem. 2011;286:26277–26286. doi: 10.1074/jbc.M111.260562. [DOI] [PMC free article] [PubMed] [Google Scholar]
- Tarran R, Button B, Boucher RC. Regulation of normal and cystic fibrosis airway surface liquid volume by phasic shear stress. Annu Rev Physiol. 2006;68:543–561. doi: 10.1146/annurev.physiol.68.072304.112754. [DOI] [PubMed] [Google Scholar]
- Tatur S, Groulx N, Orlov SN, Grygorczyk R. Ca2+-dependent ATP release from A549 cells involves synergistic autocrine stimulation by coreleased uridine nucleotides. J Physiol. 2007;584:419–435. doi: 10.1113/jphysiol.2007.133314. [DOI] [PMC free article] [PubMed] [Google Scholar]
- Uhal BD. Cell cycle kinetics in the alveolar epithelium. Am J Physiol. 1997;272:L1031–L1045. doi: 10.1152/ajplung.1997.272.6.L1031. [DOI] [PubMed] [Google Scholar]
- von Kügelgen I, Wetter A. Molecular pharmacology of P2Y-receptors. Naunyn Schmiedebergs Arch Pharmakol. 2000;362:310–323. doi: 10.1007/s002100000310. [DOI] [PubMed] [Google Scholar]
- Yamamoto K, Furuya K, Nakamura M, Kobatake E, Sokabe M, Ando J. Visualization of flow-induced ATP release and triggering of Ca2+ waves at caveolae in vascular endothelial cells. J Cell Sci. 2011;124:3477–3483. doi: 10.1242/jcs.087221. [DOI] [PubMed] [Google Scholar]
Associated Data
This section collects any data citations, data availability statements, or supplementary materials included in this article.


