

Abstract
A novel electrochemical approach is described for redox-active membrane proteins. A total membrane extract (in the form of vesicles) of Bacillus subtilis is tethered onto gold surfaces modified with cholesterol based thiols. The membrane vesicles remain intact on the surface and do not rupture or fuse to form a planar bilayer. Oxidation/reduction signals are obtained of the natural co-enzyme, menaquinone-7, located in the membrane. The membrane protein, succinate menaquinone oxidoreductase (SQR), remains in the vesicles and is able to reduce fumarate using menaquinone as mediator. The catalysis of the reverse reaction (oxidation of succinate), which is the natural catalytic function of SQR, is almost absent with menaquinone. However, adding the co-enzyme ubiquinone, which has a reduction potential that is about 0.2 V higher, restores the succinate oxidation activity.
Introduction
Redox proteins, which are estimated to account for a quarter of all proteins[1], perform a myriad of functions in biology. They shuttle electrons and catalyse redox reactions in many vital processes, including photosynthesis and metabolism. Dynamic electrochemical techniques have proven to be powerful tools to study these proteins. The thermodynamics and kinetics can be studied in detail if they are electrochemically connected or ‘wired’ to the electrode surface[2]. Furthermore, these hybrid organic-inorganic systems form the basis for the development of biosensors and bio-fuel cells [3, 4]. The main challenge is to adsorb proteins in their native state on the electrode while efficiently exchanging electrons. To this purpose considerable effort has been dedicated to designing electrode surfaces that bind proteins (a) by electrostatic or hydrophobic/hydrophylic type interactions, (b) by selective (e.g. antibody) interactions and (c) by covalent bonds, either directly or via a co-factors of the target protein [3, 5]. In some cases the proteins themselves have been (re)designed [6, 1].
An important and large part of all redox proteins is membrane bound. Indeed, many redox proteins involved in photosynthesis and metabolism are located in the mitochondrial, chloroplast or plasma [7] membranes. However, because membrane proteins are more difficult to manipulate experimentally than globular proteins, less work has been reported on the electrochemistry of these proteins[8, 9, 10, 11, 12, 13, 14, 15, 16, 17]. One of the foregoing successful strategies is to reconstitute purified and detergent-solubilised proteins in a biomimicking membrane on the surface[12, 13, 14, 15, 16, 17]. In some of these cases, direct electron transfer between the electrode and the membrane protein is achieved[12, 13, 14], but more often mediators need to be used. For instance, Kinnear and Monbouquette have used membrane-bound ubiquinone-6 (UQ-6) as a mediator between the electrode and fructose hydrogenase[16]. Marchal et al. mediated electrons to the peripheral membrane protein pyruvate oxidase using its physiological co-enzyme, UQ-8[17].
Here, we report a novel approach in which a total membrane extract is used, with no other purification step than separating the membrane fraction from the cytoplasm. Membrane extracts of Bacillus subtilis, still containing all proteins and co-enzymes, are specifically bound to a gold electrode using cholesterol ‘tethers’ which are separated from the Au-thiol bond via a ethyleneoxy chain (EO3, Figure 1). These cholesterol tethers were initially designed, and successfully used, to prepare supported lipid bilayers[18, 19, 20, 21, 22, 23, 24], which are formed by self assembly of lipid vesicles. To form a lipid bilayer instead of a hybrid layer (a monolayer of phospholipids on top of a monolayer of cholesterol) the cholesterol tethers have been mixed with small spacer molecules (e.g., 2-mercaptoethenol or 6-mercaptohexanol), which allow phospholipids to enter both leaflets of the bilayer (Figure 1)[18, 19, 20, 21, 22, 23, 24].
Figure 1.
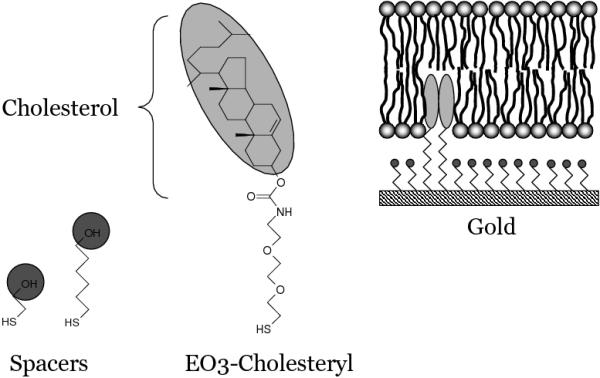
Chemical structures of (from left to right) 2-mercaptoethanol (spacer), 6-mercaptohexanol (spacer) and the cholesterol tether molecule (OE3-Cholesteryl). On the right is a graphical representation of a supported lipid bilayer on mixed self-assembled monolayer of EO3-cholesteryl and 2-mercaptoethanol.
We have used so-called inside-out vesicles of a B. subtilis strain that over-expresses the enzyme succinate:menaquinone oxidoreductase (SQR, also known as succinate dehydrogenase)[25, 26, 27, 28, 29]. B. subtilis is an aerobic Gram-positive bacterium that catalyses the oxidation of succinate (using SQR) to fumarate in the respiratory chain while reducing its co-enzyme menaquinone-7 (MQ-7). B. subtilis and some other Gram positive bacteria are exceptional in that they use menaquinone to oxidise succinate, rather than ubiquinonol (UQ) as most Gram negative bacteria and mitochondria[28, 29]. Contrary to UQ, MQ has a reduction potential that is about 0.1 V lower than that of the succinate/fumarate couple and would therefore be expected to serve as a co-enzyme in the reverse reaction (i.e., as an electron donor for fumarate reduction).
Here, we will show that the membrane vesicles adsorb on the cholesterol modified surface, but do not rupture/fuse to form a planar lipid bilayer as has been observed for other lipid vesicles. The MQ in the adsorbed membrane vesicles can be detected electrochemically and are used as a natural electron mediator for SQR which retains it catalytic activity upon adsorption.
Materials and Methods
Materials
EO3-cholesteryl (Figure 1) was made as previously described[18]. 2-Mercaptoethanol and 6-Mercaptohexanol (Sigma) were used without further purification. All solvents (2-Propanol, Methanol (MeOH) and Dichloromethanol (DCM)) were HPLC grade (Fisher) and used as received. Also Ubiquinone (Co-enzyme Q10) and Menaquinone-4 (Vitamin K2, Sigma) were used as received. All electrochemical experiments were performed in MOPS buffer (3-(N-Morpholino)propanesulfonic acid, Sigma) adjusted to pH 7.4 with NaOH at 20°C. Control experiments were carried out using vesicles prepared from Egg derived Phosphatidyl Choline (Egg PC) and E. coli derived total lipid extract (‘polar’) both from Avanti. Vesicles were prepared by extrusion through 50 or 100 nm Track-Edge nuclepore membrane (Avanti) using standard procedures.
Electrodes
150 nm Gold (Advent, 99.99% ) was evaporated through a mask on a 10 nm chromium adhesion layer on cleaned glass microscope slides (Deconex, sonication, methanol) with an Edwards Auto 306 evaporator at < 2×10⁻⁶ bar. The mask consisted of a circular ‘electrode’ area (∅ = 5 mm) with a 1 mm link for connection to the electrochemical equipment. The total area (circular + link) in contact with the electrolyte solutions is 0.25 ± 0.02 cm2. After evaporation the electrodes were stored until used. Before usage the slides were sonicated in DCM, rinsed with MeOH and dried under N2. Self-assembled monolayers (SAMs) were made by incubating the electrode slides for ~ 16 hours in a 2-proponal solution of pure - or mixtures of - EO3-cholesteryl, 2-mercaptoethanol and 6-mercaptohexanol (total thiol concentration 1 mM). The gold slides were thoroughly rinsed with DCM and MeOH, dried with N2 and used within a day. When mixtures of thiols were used, the ratio of the different thiols on the surface was checked for each electrode with impedance spectroscopy, assuming that the capacitance of a mixed SAM is equal to the summed capacitance of the pure SAMs times the area occupied. This assumption was checked and found to be correct with contact angle measurements. For a EO3-cholesteryl:2-mercaptoethanol (30:70) distribution on the surface a (4:96) ratio in solution is used. For a EO3-cholesteryl:6-mercaptohexanol (30:70) distribution on the surface a (10:90) ratio in solution is used. No differences were found between 2-mercaptoethanol and 6-mercaptohexanol except that the latter was more robust when applying potentials < −0.3 V vs. SCE and was therefore preferred for some of the electrochemical experiments. If a slide needed to be ‘pre-incubated’ (see Results) with UQ or MQ they were incubated either (a) for 4 min. in 10 μg/ml chloroform or (b) for 15 min. in 0.1 mg/ml in chloroform/methanol (10:90). (a) gave typically a coverage between 40 and 60 pmol·cm−2 for MQ and somewhat lower for UQ. (b) gave typically 10 times higher coverage.
Inside-out vesicles from B. subtilis
A B. subtilis strain over-expressing SQR (3G18/pBSD1200) was grown as described[25]. Inside-out vesicles were prepared with a French press (18000 lb·in−2) and further purified with a succrose gradient as described.[30] The yield was determined by weighing the ‘wet’ pellet after the last centrifugation step. This weight was used for all consequent steps. The concentration of SQR in the membrane vesicles was estimated by an DCPIP/PMS enzyme assay described in [25] using the therein reported activity of 116 s−1.
Membrane vesicles (0.5 mg/ml) were adsorbed on the surface for 1 hour in 20 mM MOPS, pH 7.4, 30 mM Na2SO4. With SPR and electrochemistry it was shown that most of the adsorption was completed after one hour. The vesicle solution was then replaced with fresh buffer. SPR results indicated that vesicles did not desorb after removing the the membrane vesicles from the solution.
AFM and SPR
For the AFM and force curve experiments, template stripped gold (TSG) surfaces were prepared by evaporating 150 nm gold on silicon wafers. The gold surface was then glued with EPO-TEK 377 to glass and cured for 120 min at 120° C. After cooling, the slides were detached from the silicon wafers to expose the TSG surface, which was directly immersed in the thiol solution (described in the ‘electrode’ section) for one hour. Further treatments were indentical to those described in the section ‘electrodes’. AFM height images and force curves were recorded under fluid (buffer) at 25° C using a Multimode AFM on a Nanoscope IV (Digital Instruments, Veeco Metrology Group, Inc., CA) controller and silicon nitride cantilevers (NP, Veeco Metrology Group). The cantilevers had a spring constant of approximately 0.18 or 0.52 N/m. The height images reported here are raw, unfiltered data obtained by tapping (dynamic) mode at a frequency in the range 8-9 kHz. Force curves (z-Piezo extension vs cantilever deflection) were recorder under indentical conditions and converted into true force-distance curves showing force in nN as a function of true tip-surface separation in nm.
SPR experiments were performed on prisms evaporated with 50 nm gold as described previously[19] and the results were fit by a Levenberg-Marquardt procedure[31, 32].
Electrochemistry
The thermostatted electrochemical cell was of all-glass construction, with the main compartment housing the gold working electrode (glass microscope slide), platinum wire counter electrode and the saturated calomel reference electrode (SCE, Radiometer). All potentials are quoted versus SCE. The cell was enclosed in a Faraday cage to minimize electrical noise and purged with Argon to remove oxygen.
Electrochemical impedance spectroscopy (EIS) and cyclic voltammetry (CV) were recorded using an Autolab electrochemical analyzer (Eco-chemie, Utrecht, The Netherlands) equipped with PGSTAT30 potentiostat and FRA2 frequency analyser. CV data were recorded in the analogue mode with a fast analogue scan generator (SCANGEN). To create ‘baseline subtracted peaks’, the voltammograms were Fourier-filtered to remove remaining noise, then the background (non-Faradaic) current was subtracted using a program (developed by Dr. H.A. Heering and Dr C. Léger) which fits a cubic spline function[33] to the baseline in regions sufficiently far from the peak, and extrapolates it throughout the peak region.
Results
Figure 2 shows the AFM height images of cholesterol modified surfaces before and afer incubation with a total membrane extract (membrane vesicles) of B. subtilis, which have been prepared with French Press. The AFM image immediately suggests that most or all membrane vesicles remain intact when adsorbed on the surface. The height of the vesicles is less than 90 nm with the majority 25 - 35 nm high. The diameter ranges from 50 - 150 nm (French Press treatment of EggPC produces vesicles of 26 - 63 nm[34]), suggesting membrane vesicles are ‘flatttened’ upon adsorption, or alternatively are being compressed due to force applied by the tapping AFM probe.
Figure 2.
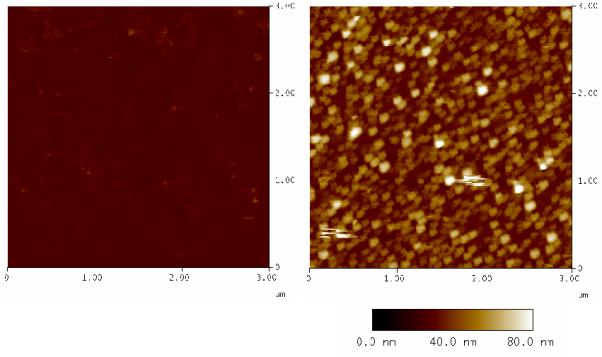
AFM images of template stripped gold, modified with EO3-cholesteryl:6-mercaptohexanol (30:70) before (left) and after (right) incubation with B. subtilis membrane extract.
To investigate whether a supported or planar lipid bilayer was present underneath the vesicles we performed a series of force measurements (Figure 3). After incubation with membrane vesicles two distinct type of force curves were observed (Figure 3b-3d). Individual force curves were extracted from a force map acquired in the same area as the higher resolution tapping mode image of Figure 3e (imaged prior to the force map). Figures 3c and 3d are typical of force curves on the smallest and largest vesicles, and were acquired at the positions indicated in Figure 3e. First contact with the vesicle occurred between 20 and 70 nm above the gold surface, depending upon vesicle size, after which the vesicle is steadily compressed. In many cases the bilayer is pierced by the AFM tip when the vesicle was compressed to 1-2 nN, and this tip breakthrough event is indicated by an arrow in the force-distance curves. High-resolution height images of the vesicles before and after the force measurements indicate that this breakthrough event is associated with vesicle collapse. Piercing of the larger vesicles is not followed by an immediate snap to the surface, it occurs 10-15 nm above the surface, and is followed by a more gradual deflating, presumably as the fluid within the vesicle is squeezed out. Membranes remaining of the larger vesicles form doughnuts, or toroidal shapes, where water remains trapped in the outer ring (Figure 3f). Force curves or areas without vesicles never showed the typical force signal obtained when piercing a bilayer[35], confirming that no planar bilayer is present underneath the vesicles (Figure 3b). This force response, however, is distinctly different from those obtained on the mixed SAM/EO3 treated surface (Figure 3a). This is most likely due to a combination of factors, such as proteins and lipids that might absorb to the Si3N4 tip.
Figure 3.
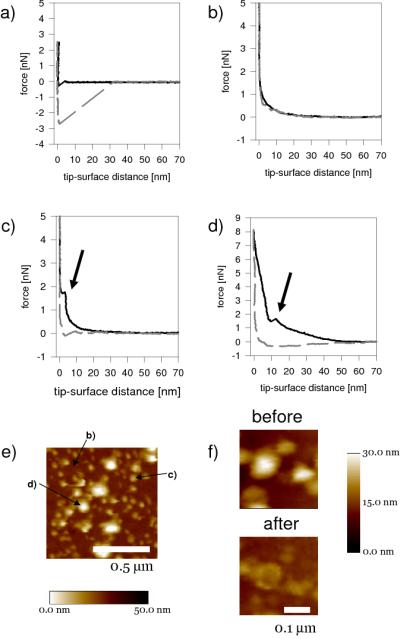
(a-d) Force measurements of template stripped gold, modified with EO3-cholesteryl:6-mercaptohexanol (30:70) before (a) and after (b - d) incubation with B. subtilis membrane vesicles. (b) is recorded in a region free of vesicles and (c) and (d) are force curves of vesicles; (c) is an example of one of smallest vesicles and (d) an example of a particularly large vesicle. The arrow indicates a typical signal obtained when the AFM tip protrudes throught the phospholipid bilayer. Solid lines are for tips approaching the surface. Dashed line are for receding tips. (e) Tapping mode AFM image (prior to force measurements) indicating the positions where force curves were acquired. (f) AFM pictures before and after the force measuments.
Figure 4 shows the electrochemical impedance (EIS) results. As a control, surfaces were incubated with vesicles prepared from a lipid extract (i.e., free of proteins) from E. coli with and without the fusagen, Ca(II). Without Ca(II) the vesicles adsorb on the surface, but do not fuse to form an ion blocking bilayer, which results in a small descrease in capacitance [Figure 4 (left). In Cole-Cole plots the capacitance is equal to the diameter of the half circle.]. However, when calcium ions are present, the vesicles fuse and a planar bilayer is formed, indicated by a large drop in capacitance. Typical values determined from fitting the results after bilayer formation are: capacitance 0.6 - 0.8 μF · cm−2 and resistance ≥ 10 kΩ·cm2.[36]. Figure 4 (right) shows the results obtained with the membrane vesicles from B. subtilis and confirms that these vesicles remain intact on the surface. Addition of up to 100 mM calcium ions or 30% poly(ethyleneglycol) (PEG) did not change the impedance significantly. Finally, also results from Surface Plasmon Resonance (SPR) experiments are consistent with the membrane vesicles adsorbing intact, since the measured thickness is higher than that of a single phospholipid bilayer (on a 30% EO3-cholesterol surface the vesicles give rise to a 62 ± 2 Å thick layer instead of ~ 40 Å as expected for a planar bilayer[19]).
Figure 4.
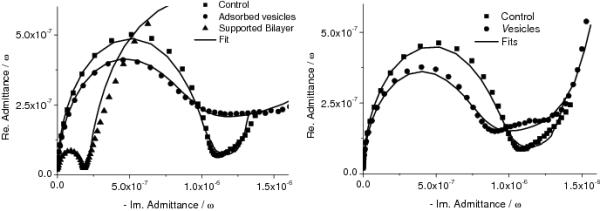
(left) Cole-Cole plots of a electrode (area = 0.25 ± 0.02 cm2) modified with EO3-cholesteryl:2-mercaptoethanol (65:35) with and without vesicles prepared from total lipid extracts from E. coli in the absence and presence of 10 mM CaCl2. (right) Electrode modified with EO3-cholesteryl:6-mercaptohexanol (30:70) with membrane vesicles of B. subtilis (20° C).
Figure 5 (left) shows cyclic voltammograms (CV) of adsorbed membrane vesicles at different temperatures. One set of signals is visible, although the reducing peak is partly obscured by a downward slope at low potentials which signifies the onset of the reductive deadsorption of the self-assembled thiol monolayer.[38] Based on the resemblance of these signals with that of menaquinol-4 (MQ-4, see below) and other quinones[39] they are assigned to menaquinol-7 (MQ-7), the natural co-enzyme of B. subtilis. The normalised peak areas are indepedent of scan rate (except at low temperature, see below), confirming the MQ-7 is adsorbed on the surface in a thin film. From the areas under the peaks, the coverage of MQ-7 is determined to be (Γ = peakarea ÷ nFAν) 1 - 2 pmol·cm−2. Figure 5 (right) shows the peak positions as a function of scan rate. The increasing peak separation at higher scan rates indicates that the electron transfer is kinetically controlled[40, 37]. The kinetic control is partly due to the high co-operativity of the two-electron reaction of the quinones, which is described in more detail for other quinones by Marchal et al.[39] (∣ΔE0∣ ~ 0.6 V at pH 7.4). The electron transfer kinetics might be further decreased by diffusion of MQ-7 through the vesicle membrane. This suggestion is supported by the observed decrease in electron-transfer rate at lower temperature (i.e., larger peak splitting, Figure 5). Futhermore, at 5° C the normalised peak areas (especially of the oxidation peak) start to diminish at scan rates above 100 mV s−1, which could be due to quinone diffusion becoming rate limiting. The MQ-7 signals are stable up to at least 40° C, although at these temperatures an additional small signal appears at around −350 mV vs SCE. The origin of this signal is unknown, but it could be an artefact due to protein denaturation (e.g. free Fe-porphyrins).
Figure 5.
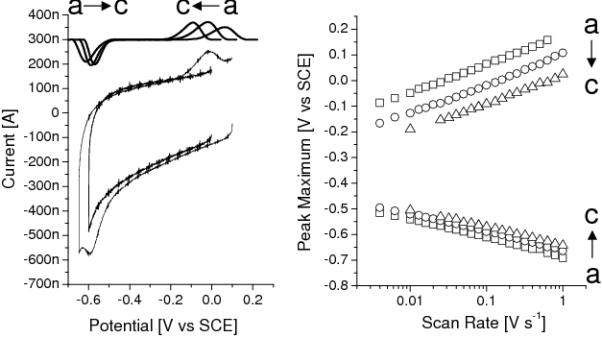
(left) CV (100 mV/s) of a electrode modified with EO3-cholesteryl:6-mercaptohexanol (30:70) before and after adsorbtion of membrane vesicles (20° C). (left, top) Background subtracted signals (offset 300 nA) at different temperatures. (right) Peak positions at different scan rates (i.e., a ‘Trumpetplot’)[37]. [(a) 5, (b) 20 and (c) 35° C]
When fumarate is added to the cell solution, the fumarate is reduced by MQ-7 as shown by: (a) disappearance of the MQ-7 oxidation peak (MQ-7 is oxidised by fumarate instead) and (b) a reductive current at low potentials. Control experiments using adsorbed MQ-4, with or without egg PC lipids, do not show an effect upon adding fumarate, indicating that fumarate is enzymatically reduced by succinate-menaquinone oxidoreducase (SQR). The electrocatalytic activity of SQR is significantly enhanced when additional MQ is provided, which is done by pre-incubating the gold surface with a dilute MQ-4 solution. The resulting MQ-4 signals are larger than the natural occuring MQ-7 signals, but located at approximately the same potentials. Figure 6 shows the catalytic signals obtained with these electrodes and saturating concentrations of fumarate (Left) and succinate (Right)[41]. As is clear from Figure 6, the catalytic activity of SQR differs greatly between fumarate reduction and succinate oxidation, the latter being about 20 times lower. As mentioned in the Introduction and in line with these results, the reduction potential of MQ is lower than that of the succinate/fumarate couple, making it an unfavourable electron receptor for succinate oxidation. When MQ-4 is replaced with ubiquinone-10 (UQ-10), which has a higher reduction potential, significant succinate oxidation by SQR is observed (Figure 7).
Figure 6.
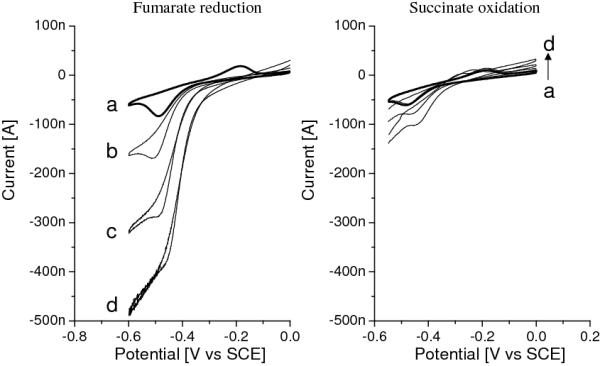
CVs (1 mV/s) of a electrode modified with EO3-cholesteryl:6-mercaptohexanol (30:70), preincubated for 4 min. in 10 μg/ml MQ in chloroform with adsorbed membrane vesicles in the absence (a) and presence (b - d) of 2 mM fumarate (left) or 10 mM succinate (right) at different temperatures, (b) 20, (c) 30 and (d) 40° C. The surface coverages of MQ-4 are ~56 (left) and 41 (right) pmol·cm−2.
Figure 7.
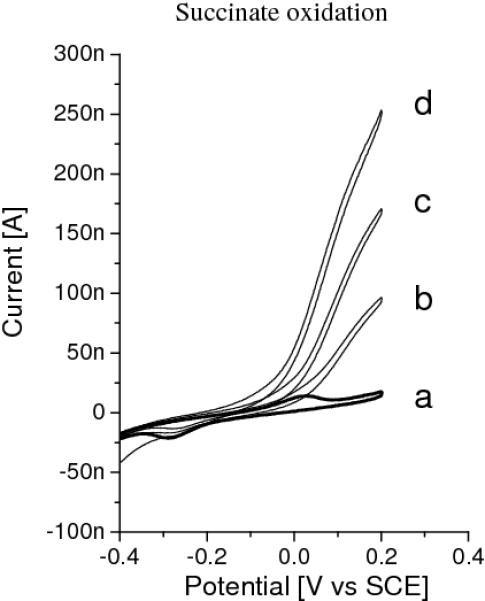
CVs (1 mV/s) of a electrode modified with EO3-cholesteryl:6-mercaptohexanol (30:70), preincubated for 4 min. in 10 μg/ml UQ in chloroform with adsorbed membrane vesicles in the absence (a) and presence (b - d) of 10 mM succinate at different temperatures, (b) 20, (c) 30 and (d) 40° C. The surface coverages of UQ-10 is ~16 pmol·cm−2.
Finally, Figure 8 illustrates the effects of EO3-cholesteryl which is used to tether the membrane vesicles to the electrode surface (note that vesicles will also adsorb on hydrophilic surfaces without EO3-cholesteryl tethers). When no EO3-cholesteryl is present on the surface - or only a small amount - not all the quinone interacts with the membrane vesicles. To illustrate this we have prepared electrodes with a relatively high UQ coverage for which the addition of succinate does not completely remove the UQ reduction peak for surfaces with < 10 % EO3 cholesterol (Figure 8). This indicates that a fraction of the UQ that is adsorbed on the surface does not exchange electrons with SQR within the timespan of the experiment. Contrary, when about 30% of the surface is occupied by EO3-cholesteryl the reduction peak of UQ disappears completely. When even higher ratios of EO3-cholesteryl are used the electron transfer kinetics reduce significantly which results in an increased peak separation. As a result, no UQ signals are visible within the potential window when the surface is fully occupied by EO3-cholesteryl (Figure 8). This shows that EO3-cholesteryl promotes the electrochemical communication between the quinones adsorbed on the surface and the SQR within the membrane vesicles. EO3-cholestryl also influences the amount of natural MQ-7 detected electrochemically after adsorption of the membrane vesicles (i.e., when no MQ or UQ is pre-adsorbed on the surface). Maximum electroactive coverage of MQ-7 from membrane vesicles is achieved at 10 - 30% EO3-cholesteryl. This effect is not due to differences in the amount of adsorbed membrane vesicles. To the contrary, SPR results indicates that more vesicles adsorb at a surface without EO3-cholesteryl. Combining these results, the optimal amount of EO3-cholesteryl on the surface is ~30%, which is the ratio used for most of the experiments described here.
Figure 8.
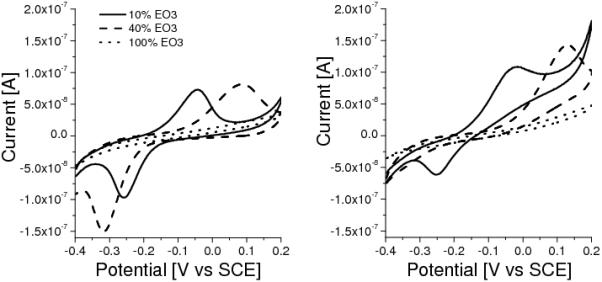
CVs (1 mV/s) of a gold electrode modified with EO3-cholesteryl:6-mercaptohexanol in ratios given, preincubated for 15 min. in 0.1 mg/ml UQ in chloroform:methanol (10:90) with adsorbed membrane vesicles, without (left) and with (right) 10 mM succinate. UQ coverage (for 10 and 40% EO3-Cholesterol) is ~150 pmol·cm−2.
Discussion
EO3-cholesteryl and other lipid derivatives have been developed to aid the formation of stable supported planar bilayers on gold.[18, 19, 20, 21, 22, 23, 24] In contrast, our AFM, SPR and EIS results all indicate that the inside-out vesicles of B. subtilis do not fuse on the surface to form a planar bilayer.[23] Table 1 gives the lipid composition of B. subtilis and E. coli membranes, which both contain a net negative charge. Most work on planar bilayers has been done with zwitterionic lipids (e.g. phosphotidylcholate), but the vesicles from ‘polar’ E. coli lipid extracts as well as B. subtilis membrane vesicles are negatively charged. For vesicles prepared from E. coli lipid extracts, the fusagen Ca(II) is able to counteract the negative charge and promote planar bilayer formation.[42] Contrary, in the case of B. subtilis membrane vesicles, addition of Ca(II) up to 100 mM does not promote planar bilayer formation. Still, B. subtilis membranes are significantly more negatively charged (Table 1) than E. coli, which could explain why no planar bilayers are formed. Alternatively, the large amount of membrane proteins in vesicles might change the way the lipids interact with the surface. Granéli et al. reported that supported bilayer formation on SiO2 is hampered when proteoliposomes are used that contain proteins with large hydrophilic (extramembranous) domains.[43] Although EO3-cholesteryl does not induce planar bilayer formation of the B. subtilis membrane vesicles, it enhances the electrochemical contact between the electrode and the MQ-7 present in the membrane vesicles (Figure 8), suggesting that the cholesterol headgroups insert into the phospholipid bilayer.
Table 1.
Lipid composition (in percentages) of B. subtilis and E. coli
| B. subtilis a | E. Coli CMb | E. Coli ‘Polar’c | |
|---|---|---|---|
| Phosphatidylethanolamine (PE) | 10 | 82 | 67 |
| Phosphatidylglycerol (PG) | 29 | 6 | 23 |
| Cardiolipin | 47 | 12 | 10 |
| LysineAcylPG | 7 | - | - |
| Other | 6 | - | - |
Values taken from reference [44].
CM, Cytoplasmic membrane. Values taken from reference [45].
Values taken from http://www.avantilipids.com.
The enzymes located in the membrane vesicles remain active upon adsorption onto the surface. Here, we have used SQR as an probe for enzyme activity in the membrane vesicles, which were harvested from a strain that over-expresses SQR. It was determined that 0.1 - 1.0% of the ‘wet weight’ of the membrane vesicles consisted out of SQR (see Materials and Methods). Lemma et al. previously determined the succinate oxidation kinetics of SQR in reconstituted proteoliposomes and found that SQR was 5 times more active with UQ as co-enzyme than MQ.[27] Similar results were obtained here and corroborate the previous suggestions that the reduction potential of natural co-enzyme MQ-7 (~−74 mV vs SCE) is too low to act as a efficient electron donor for succinate oxidation (E0’ ~ 30 mV vs. SCE)[26, 28]. It has been suggested that B. subtilis uses the transmembrane electrical and proton gradients to supply additional energy to reduce MQ (at the outer leaflet of the membrane bilayer) concurrent succinate oxidation (at the inside of the membrane)[26, 27, 29, 28, 46]. Of course, the electrical and proton gradients are lost in the preparation of the membrane vesicles used for the electrochemical experiments described here. We are currently investigating the influence of artificially induced gradients on the catalytic activity of SQR.
Finally, the fact that almost no succinate oxidation is detected unless UQ is added to the membrane vesicles indicates that UQ (or MQ) is an obligatory electron mediator between the electrode and SQR. This is not surprising given the fact that in the adsorbed inside-out membrane vesicles, the large soluble domains of SQR will mostly be located on the outside of the vesicles blocking a direct electron-transfer route from the electrode to SQR[47]. The succinate oxidation activity of SQR in membrane vesicles containing UQ has been determined at k = 15 s−1 at 37° C[27]. Assuming this activity is maintained in the vesicles adsorbed on the electrode, the SQR coverage can be estimated from the current measured at high overpotential (during which SQR has maximum turn-over, see Figure 6) and is in the order of (Γ = 200nA ÷ (nF Ak) =) 0.3 pmol·cm−2. This value corresponds to estimates based on the vesicle coverage (see note [48]). This means that it cannot be excluded that part of the total electrochemical signal in Figure 5 (Γ = 1 - 2 pmol·cm−2) might actually be due to to indirect electron transfer to SQR, especially considering the fact that SQR can take up 7 electrons (compared to 2 for menaquinone). Note that the interfacial electron transfer to MQ-7 is kinetically controlled and, therefore, consequent electron exchange of MQ-7 to membrane proteins has only a marginal effect on the actual peak positions.
Some electrochemical systems have been reported in which a film of a detergent-solubilised membrane proteins is created on a electrode without the need of a biomimicking membrane on the surface or detergents in the electrolyte solution[8, 9, 10]. Regretfully, no data is available on the orientation of these membrane protein on the electrode or how the membrane spanning domains are accommodated without detergents in solution (or, alternatively, whether detergents are co-adsorbed with the membrane proteins) and it remains unclear why these systems are successful for some proteins and not for others. In contrast, Haas et al. performed a thorough characterisation of different protein films of cytochrome c oxidase (using detergents in solution), which provides insights into how a successful membrane-protein electrode cn be designed[11]. Although these systems are potentially very powerful, they need to be optimised for each membrane protein and some (or even many) proteins might not be able to interact with electrodes at all. Furthermore, these systems miss the natural membrane, which is an important and intergral part of the function of a membrane protein. To solve these problems, surface-attached biomimicking systems have been designed[12, 13, 14, 15, 16, 17] and we have elaborated on this work by adsorbing intact membrane vesicles on the surface.
Adsorbing membrane proteins on electrode surfaces via intact vesicles has several advantages over biomimicking membrane systems reported previously. Systems based on hybrid bilayers can only be used for membrane proteins that are peripheral bound[15, 17], because the lower leaflet of the bilayer is bound tightly to the surface and cannot accommodate transmembrane proteins. This problem can be solved by modifying surfaces only partly with long hydrophobic molecules, leaving gaps for the membrane proteins to adsorb[16, 14, 13]. However, these systems are still not ideal in that they do not have a hydrophylic space between the biomimicking membrane and the electrode surface to accommodate extramembranous domains. Using intact vesicles as described here, in principle any membrane protein can be used, with a very similar membrane environment to that in vivo. A second major advantage is that no protein purification and reconstitution is necessary (although this can still be done if required). In principle any crude membrane extracts can be used as long as the electrochemistry is sensitive enough to detect the catalytic activity. The only requirement is that the catalytic reaction is (directly or indirectly) linked to the quinone pool, which serves as an obligatory electron mediator.
Conclusion
We have shown that vesicles prepared from total membrane extracts of B. subtilis can be tethered onto cholesterol modified surfaces and, unlike vesicles prepared from pure phospholipids, do not form planar lipid bilayers. The redox-active membrane proteins in the tethered vesicles remain active and can be studied electrochemically using the native and non-native co-enzymes as mediators. Because the vesicles remain intact, it is in principle possible to use standard biochemical tools to generate electrical and proton gradients across the membrane and study their effects on enzyme activity. We are currently extending our research to explore this. In conclusion, these modified surfaces allow the study of bacterial membrane proteins in their native membranes and because the preparation of bacterial membrane vesicles is relatively simple (no protein purification and reconstitution is required) this method can easily be extended to other organisms.
Acknowledgements
The strain 3G18/pBSD1200 was generously provided by Dr. Celicia Hägerhäll, whom we also thank for her advice on B. subtilis and SQR. This research was supported by the UK BBSRC David Phillips fellowship, (24/JF/19090).
Abbreviations
- AFM
Atomic Force Microscopy
- SPR
Surface Plasmon Resonance
- EIS
Electrochemical Impedance Spectroscopy
- CV
Cyclic Voltammetry
- UQ
UbiQuinone
- MQ
MenaQuinone
- SQR
Succinate menaQuinone oxidoReductase
- PC
PhosphotidylCholine
- F
Faraday constant
- A
Electrode area
- n
number of electrons
- ν
scan rate
Footnotes
Publisher's Disclaimer: This document is the unedited Author's version of a Submitted Work that was subsequently accepted for publication in Langmuir, copyright © American Chemical Society after peer review. To access the final edited and published work see http://dx.doi.org/10.1021/la047732f.
References
- [1].Wong TS, Schwaneberg U. Curr. Opin. Biotech. 2003;14:590–596. doi: 10.1016/j.copbio.2003.09.008. [DOI] [PubMed] [Google Scholar]
- [2].Léger C, Elliott SJ, Hoke KR, Jeuken LJC, Jones AK, Armstrong FA. Biochemistry. 2003;42:8653–8662. doi: 10.1021/bi034789c. [DOI] [PubMed] [Google Scholar]
- [3].Willner I, Katz E. Angew. Chem. Int. Ed. 2000;39:1180–1218. doi: 10.1002/(sici)1521-3773(20000403)39:7<1180::aid-anie1180>3.0.co;2-e. [DOI] [PubMed] [Google Scholar]
- [4].Ikeda T, Kano K. J. Biosci. Bioeng. 2001;92:9–18. doi: 10.1263/jbb.92.9. [DOI] [PubMed] [Google Scholar]
- [5].Schuhmann W. Rev. Mol. Biotech. 2002;82:425–411. doi: 10.1016/s1389-0352(01)00058-7. [DOI] [PubMed] [Google Scholar]
- [6].Gilardi G, Fantuzzi A, Sadeghi S. Curr. Opin. in Struct. Biol. 2001;11:491–499. doi: 10.1016/s0959-440x(00)00238-4. [DOI] [PubMed] [Google Scholar]
- [7].Ly JD, Lawen A. Redox report. 2003;8:3–21. doi: 10.1179/135100003125001198. [DOI] [PubMed] [Google Scholar]
- [8].Elliott SJ, Hoke KR, Heffron K, Palak M, Rothery RA, Weiner JH, Armstrong FA. Biochemistry. 2004;43:799–807. doi: 10.1021/bi035869j. [DOI] [PubMed] [Google Scholar]
- [9].Ikeda T, Miyaoka S, Matsushita F. Chem. Let. 1992:847–850. [Google Scholar]
- [10].Razumiene J, Niculescu M, Ramanavicius A, Laurinavicius V, Csöregi E. Electroanalysis. 2002;14:43–49. [Google Scholar]
- [11].Haas AS, Pilloud DL, Reddy KS, Babcock GT, Moser CC, Blasie JK, Dutton PL. J. Phys. Chem. B. 2001;105:11351–11362. [Google Scholar]
- [12].Kinnear KT, Monbouquette HG. Langmuir. 1993;9:2255–2257. [Google Scholar]
- [13].Burgess BK, Rhoten MC, Hawkridge FM. Langmuir. 1998;14:2467–2475. [Google Scholar]
- [14].Rhoten MC, Burgess JD, Hawkridge FM. Electrochim. Acta. 2000;45:2855–2860. [Google Scholar]
- [15].Devadoss A, Burgess JD. Langmuir. 2002;18:9617–9621. [Google Scholar]
- [16].Kinnear KT, Monbouquette HG. Anal. Chem. 1997;69:1771–1775. doi: 10.1021/ac960665c. [DOI] [PubMed] [Google Scholar]
- [17].Marchal D, Pantigny J, Laval JM, Moiroux J, Bourdillon C. Biochemistry. 2001;40:1248–1256. doi: 10.1021/bi002325y. [DOI] [PubMed] [Google Scholar]
- [18].Boden N, Bushby RJ, Clarkson S, Evans SD, Knowles PF, Marsh A. Tetrahedron. 1997;53:10939–10952. [Google Scholar]
- [19].Williams LM, Evans SD, Flynn TM, Marsh A, Knowles PF, Bushby RJ, Boden N. Langmuir. 1997;13:751–757. [Google Scholar]
- [20].Cheng Y, Boden N, Bushby RJ, Clarkson S, Evans SD, Knowles PF, Marsh A, Miles RE. Langmuir. 1998;14:839–844. [Google Scholar]
- [21].Jenkins ATA, Bushby RJ, Boden N, Evans SD, Knowles PF, Liu Q, Miles RE, Ogier SD. Langmuir. 1998;14:4675–4678. [Google Scholar]
- [22].Jenkins ATA, Boden N, Bushby RJ, Evans SD, Knowles PF, Miles RE, Ogier SD, Schönherr H, Vancso GJ. J. Am. Chem. Soc. 1999;121:5274–5280. [Google Scholar]
- [23].Jenkins ATA, Bushby RJ, Evans SD, Knoll W, Offenhäusser A, Ogier SD. Langmuir. 2002;18:3176–3180. [Google Scholar]
- [24].Becucci L, Guidelli R, Liu Q, Bushby RJ, Evans SD. J. Phys. Chem. B. 2002;106:10410–10416. [Google Scholar]
- [25].Hägerhäll C, Aasa R, von Wachenfeldt C, Hederstedt L. Biochemistry. 1992;31:7411–7421. doi: 10.1021/bi00147a028. [DOI] [PubMed] [Google Scholar]
- [26].Lemma E, Unden G, Kröger A. Arch. Microbiol. 1990:1990. doi: 10.1007/BF00291276. [DOI] [PubMed] [Google Scholar]
- [27].Lemma E, Hägerhäll C, Geisler V, Brandt U, von Jagow G, Kröger A. Biochim. Biophys. Acta. 1991;1059:281–285. doi: 10.1016/s0005-2728(05)80213-0. [DOI] [PubMed] [Google Scholar]
- [28].Lemos RS, Fernandes AS, Pereira MM, Gomes CM, Teixeira M. Biochim. Biophys. Acta-Bioenerg. 2002;1553:158–170. doi: 10.1016/s0005-2728(01)00239-0. [DOI] [PubMed] [Google Scholar]
- [29].Schirawski J, Unden G. Eur. J. Biochem. 1998;257:210–215. doi: 10.1046/j.1432-1327.1998.2570210.x. [DOI] [PubMed] [Google Scholar]
- [30].Zhang B, Hofmeister A, Kroos L. J. Bact. 1998;180:2434–2441. doi: 10.1128/jb.180.9.2434-2441.1998. [DOI] [PMC free article] [PubMed] [Google Scholar]
- [31].Press WH, Teukolsky SA, Vetterling WT, Flannery BP. Numerical recipes in C. Second edition ed Cambridge University Press; Cambridge: 1992. [Google Scholar]
- [32].Hansen W. J. Opt. Soc. Am. 1968;58:380–390. [Google Scholar]
- [33].Press W, Flannery B, Teukolsky S, Vetterling W. Numerical Recipes in Pascal. Cambridge University Press; New York: 1989. [Google Scholar]
- [34].Barenholzt Y, Amselem S, Lichtenberg D. FEBS Lett. 1978;99:210–214. doi: 10.1016/0014-5793(79)80281-1. [DOI] [PubMed] [Google Scholar]
- [35].Dufrêne YF, Boland T, Schneider JW, Barger WR, Lee GU. Faraday Discuss. 1998:79–94. doi: 10.1039/a807637e. [DOI] [PubMed] [Google Scholar]
- [36].Equivalent circuits of supported lipid bilayers can be complicated (see [21]). To minimize the amount of free parameters, the data are fitted using simplified circuits containing constant phase elements (CPE). Without planar bilayers (this includes the surfaces in which vesciles are adsorbed intact), the equivalent circuit used is R(RQ), in which Q stands for the CPE and the elements within brackets are paralel. When a planar bilayer is present the equivalent circuit used is R(RbQb)(RQs), in which Qb represents the bilayer capacitance (Rb is the bilayer resistance) and Qs that of the underlying surface. The exponent in the CPE element, α (sometimes also called ϕ), are found to be ~0.9. Therefore, the capacitance measured is strongly dependent on the frequency. The values reported in the text are for frequencies which give rise to the datapoints in the half circle of the Cole-Cole plots of Figure 3 (corresponding to frequencies for which the phase shift of the impedance is ~ −45°).
- [37].Hirst J, Armstrong FA. Anal. Chem. 1998;70:5062–5071. doi: 10.1021/ac980557l. [DOI] [PubMed] [Google Scholar]
- [38].Repeated cycling or prolonged exposure to low potentials, especially at higher temperatures, results in a general deterioration of the cyclic voltammograms.
- [39].Marchal D, Boireau W, Laval JM, Bourdillon C, Moiroux J. J. Electroanal. Chem. 1998;451:139–144. [Google Scholar]
- [40].Laviron E. Voltammetric Methods for the Study of Adsorbed Species. In: Bard AJ, editor. Electroanalytical Chemistry. Vol. 12. Marcel Dekker; New York: 1982. [Google Scholar]
- [41].We note that the electrochemical experiments are performed with stationary electrodes and that the cyclic voltammograms show qualitatively similar behaviour to that previously described for pyruvate oxidase (see reference [17]).
- [42].Stelzle M, Weissmüller G, Sackmann E. J. Phys. Chem. 1993;97:2974–2981. [Google Scholar]
- [43].Granéli A, Rydström J, Kasemo B, Höök F. Langmuir. 2003;19:842–850. [Google Scholar]
- [44].O’Leary W, Wilkinson SG. Gram-positive bacteria. In: Ratlegde C, Wilkinson SG, editors. Microbial Lipids. Vol. 1. Academic Press; London: 1988. [Google Scholar]
- [45].Wilkinson SG. Gram-negative bacteria. In: Ratlegde C, Wilkinson SG, editors. Microbial Lipids. Vol. 1. Academic Press; London: 1988. [Google Scholar]
- [46].Hederstedt L. Biochim. Biophys. Acta. 2002;1553:74–83. doi: 10.1016/s0005-2728(01)00231-6. [DOI] [PubMed] [Google Scholar]
- [47].The large soluble domain of SQR in B. subtilis is located in the cytoplasma. During the French press procedure, most vesicles will obtain an inside-out configuration resulting in the soluble domain pointing outwards into the solution.
- [48].To estimate the SQR coverage from the vesicle coverage (SPR data, 62 ± 2 Å) we assume an average density of the organic material of 1.2 g/ml (the membranes were isolated with a sucrose density gradient from 1.1 to 1.3 g/ml) and that 50% of the weight of the vesicles consists of proteins. For an area of 1 cm2, this gives, 6.2 × 10−7cm×1.2g/cm3×50% = 3.7×10⁻⁷g total protein. For the B. subtilis strain used the concentration of SQR in the membranes has been determined at 1.2 nmol/mg of total membrane protein[25], giving 3.7 × 10⁻⁷ g/cm2 × 1.2 × 10−6 mol/g = 0.44 pmol/cm2.