Abstract
The effects of the deprotonation of coordinated imidazole on the dynamics of five-coordinate high-spin iron(II) porphyrinates have been investigated using nuclear resonance vibrational spectroscopy. Two complexes have been studied in detail with both powder and oriented single-crystal measurements. Changes in the vibrational spectra are clearly related to structural differences in the molecular structures that occur when imidazole is deprotonated. Most modes involving the simultaneous motion of iron and imidazolate are unresolved but the one mode that is resolved is found at higher frequency in the imidazolates. These out-of-plane results are in accord with earlier resonance Raman studies of heme proteins. We also show the imidazole vs. imidazolate differences in the in-plane vibrations that are not accessible to resonance Raman studies. The in-plane vibrations are at lower frequency in the imidazolate derivatives; the doming mode shifts are inconclusive. The stiffness, an experimentally determined force constant that averages the vibrational details to quantify the nearest-neighbor interactions, confirms that deprotonation inverts the relative strengths of axial and equatorial coordination.
Introduction
One of the intriguing features of the hemoproteins, which carry out a wide variety of biological processes, is that they do so with a common prosthetic group and a small number of differing axial ligands. This includes a large number of proteins with the same proximal histidyl ligand (equivalent to imidazole). Although the histidyl group is nominally a neutral ligand, the presence of an N–H group permits modification of the nature of the histidyl ligand by way of a hydrogen bonding acceptor near the heme.1-7 The possible hydrogen bond strengths in the proteins range from a very weak hydrogen bond in myoglobin to a very strong one in horse radish peroxidase. Complete donation in hydrogen bond formation leads to an imidazolate ligand and we have been examining the issue of imidazolate as a ligand for some time. As described below, this led us to recognize the existence of two classes of five-coordination high-spin iron(II) porphyrinates.8
The possible effects of hydrogen bonding to imidazole (leading to the limiting state of imidazolate) in heme proteins has been studied by structure determinations,9, 10 experimental vibrational studies,11-22 and theoretical studies.23-26 It has long been recognized that there is a distinct difference in the hydrogen bonding properties to the coordinated histidine in many dioxygen-binding globins where ν(Fe–NIm) is typically in the range of 218-221 cm−1 compared to many (but not all) peroxidases where ν(Fe–NIm) is in the range of >240 cm−1. An especially interesting case is given by cytochrome c peroxidase where the native form has ν(Fe–NIm) at 233 and 246 cm−1, which decreases to 205 cm−1 when the hydrogen bonding residue (Asp235) is mutated to the nonhydrogen bonding asparagine.12, 13 The two higher frequency bands are attributed to hydrogen bond tautomers, whereas the lowest frequency is that of the “isolated” histidine. The imidazolate nature of the proximal histidine is considered to facilitate the peroxide O–O bond cleavage.27, 28 A theoretical study suggests that hydrogen bonding effects have distinct influences on excited states that lead to whether the heme protein is an O2 carrier or whether O2 is utilized in an oxidative reaction.23 However, there are globins where the histidine is thought to be imidazolate-like (251 cm−1)21 and peroxidases where the histidine is thought to be imidazole-like (220-233 cm−1).22 Hydrogen bonding effects are also known to affect the imidazole binding strength to isolated iron(III) porphyrinates.29
This paper is a continuation of our efforts at examining the differences between the two classes of five-coordinate high-spin iron(II) porphyrinates, both of which have an S = 2 (quintet) ground state.8 One class is represented by those species with a neutral nitrogen donor, primarily imidazoles30-35 but also including pyrazoles.36 The other class is represented by anionic ligands, including imidazolate (deprotonated imidazole).37 Differences between the two classes include structural,37 Mössbauer, magnetic circular dichroism, and even-spin EPR properties.8 All differences appear to result from the differing populations of the d orbitals with the sixth electron having distinct character in the two classes. This has been confirmed by DFT studies that correctly predicted the sign of the Mössbauer quadrupole splitting constant for the two classes;8 derivatives with neutral nitrogen donors have a negative value of the quadrupole splitting constant whereas the anionic class have positive values. The structural and Mössbauer differences are readily seen in the experimental results.
In this study, we examine the differences in the vibrational spectra of two imidazole and imidazolate iron(II) porphyrinate pairs. We have used the synchrotron-based technique nuclear vibrational resonance spectroscopy (NRVS) to obtain the complete vibrational spectrum of these heme derivatives and to compare differences in the vibrational spectra of the two classes. We have previously reported the vibrational spectra of the imidazole derivatives,38 for which we were able to make complete assignments of the iron modes. We now describe similar measurements for two imidazolate species and report the systematic shifts in the vibrational frequencies between imidazole and imidazolate species.
Experimental Section
Porphyrin Synthesis
57Fe-enriched porphyrinates were prepared using a small-scale metalation procedure described by Landergren and Baltzer.39 The 95% 57Fe2O3 used in the 57Fe labeled complexes was purchased from Cambridge Isotopes. All imidazoles were purchased from Sigma-Aldrich. The syntheses and crystallization of K(222)[Fe(TPP)(2-MeIm−)] and K(222)[Fe(OEP)(2-MeIm−)] were described previously.37, 40 The complexes for investigation, [Fe(TPP)(2-MeIm−)]− and [Fe(OEP)(2-MeIm−)]−, were prepared as single-crystal specimens.37 Crushed crystals were used for the powder samples.
NRVS Measurements and Analysis
NRVS measurements were performed at sector 3-ID-D of the Advanced Photon Source at Argonne National Laboratory. The sample was placed in a monochromatic X-ray beam, whose energy was scanned through the 14.4 keV 57Fe resonance using a high resolution monochromator41 with an energy bandwidth (full width at half-maximum) of ~8 cm−1 (1.0 meV). X-rays were distributed across a 4 × 1 mm2 beam cross section and arrived as a train of pulses 70 ps wide at 154-ns intervals, with an average flux of 2 × 10⁹ photons/s =4.6 μW incident on the sample. An avalanche photodiode detected photons emitted by the excited 57Fe atoms, which arrive with a delay on the order of the 140 ns 57Fe excited-state lifetime. The counter was disabled during a time interval containing the arrival time of the X-ray pulse, to suppress the large background of electronically scattered 14.4 keV photons, which arrive in coincidence with the X-ray pulse.
Both powder and single crystal samples have been measured. Polycrystalline powders were prepared by immobilization of the crystalline material in Apiezon M grease, and loaded into polyethylene sample cups and mounted on a cryostat cooled by a flow of liquid He, with X-ray access through a beryllium dome. Single crystals were isolated and mounted in an inertatmosphere dry box. Crystals were mounted in 2-mm-diameter, thin-walled (0.01 mm), boronrich, X-ray diffraction capillaries purchased from the Charles Supper Company. The crystals were immobilized in the capillary tube with a small amount of Dow Corning high-vacuum grease. The capillary tube was sealed and secured to a small length of 18-gauge copper wire with epoxy. The copper wire was then secured with epoxy to a brass mounting pin. Bending the copper wire allowed for enough flexibility to make minor adjustments in the orientation of the crystal. The brass mounting pin, holding the crystal, was then mounted on a eucentric goniometer head to allow for further fine adjustments in the orientation of the crystal. Crystal orientations were verified by X-ray diffraction before and after NRVS measurements. A stream of cold N2 gas from a commercial cryocooler controlled crystal temperature during NRVS measurements.
Both [K(222)][Fe(TPP)(2-MeIm−)] and [K(222)][Fe(OEP)(2-MeIm−)]37 crystallize in space group P2(1)/n with a single porphyrin in the asymmetric unit. Because the screw-axis-related porphyrin planes lie 85° and 78° apart, respectively, it is not possible to simultaneously orient porphyrin planes orthogonal to the X-ray beam as required for measuring out-of-plane spectra. Only data for a general in-plane orientation can be recorded in which the X-ray beam is parallel to all porphyrin planes in the crystal. For [K(222)][Fe(TPP)(2-MeIm−)], a single crystal with dimensions 1.0 × 0.25 × 0.2 mm3 was oriented with the {2, 0, 1} plane parallel to the plane defined by the X-ray beam and the goniometer rotation axis, with the X-ray beam parallel to the planes of all porphyrins, while the {11, 0, −3} plane was chosen for a single crystal of [K(222)][Fe(OEP)(2-MeIm−)] with dimensions 2.0 × 1.0 × 0.9 mm3.
A spectrum recorded as a function of X-ray energy consists of a central resonance, due to recoilless excitation of the 57Fe nuclear excited state at E0 = 14.4 keV, together with a series of sidebands corresponding to creation or annihilation of vibrational quanta of frequency , which have an area proportional to the mean squared displacement of the Fe and are displaced from the recoilless absorption by an energy .42, 43 Normalization of this spectrum according to Lipkin’s sum rule44 yields the excitation probability , with peak areas for each mode representing the mean square amplitude of the Fe. Subtraction of the central resonance results in a vibrational excitation probability .
The program PHOENIX45 removes temperature factors, multiphonon contributions, and an overall factor proportional to inverse frequency from to yield an Fe-weighted vibrational density of states (VDOS), which defines the vibrational properties at all temperatures for a harmonic system. Within the harmonic approximation, the Fourier-log deconvolution procedure employed by PHOENIX is rigorous for a single 57Fe site in an oriented sample or in a randomly oriented sample that is vibrationally isotropic.
Measurements were recorded at low temperatures to minimize multiphonon contributions. The requirement that the ratio equal the Boltzmann factor yields the sample temperature. Temperatures determined in this way are more reliable than the readings from a sensor mounted below the sample, which are at least 15 K lower. For randomly oriented powder samples, the determined temperature is 18 K for [K(222)][Fe(OEP)(2-MeIm−)], 16 K for [K(222)][Fe(TPP)(2-MeIm−)]. For single crystal samples, we found 97 K for the in-plane orientation of the [K(222)][Fe(OEP)(2-MeIm−)] crystal, and 120 K for the in-plane orientation of the [K(222)][Fe(TPP)(2-MeIm−)] crystal.
The stiffness
| (1) |
determined by the Fe mass mFe and the VDOS-weighted mean square frequency is an effective force constant that measures the average strength of nearest neighbor interactions.46, 47 The normalization N of the VDOS has a value 1 for oriented single crystals and 3 for polycrystalline powder samples.
Vibrational Predictions and Predicted Mode Composition Factors e2
All calculations including structure optimizations and frequency analysis have been performed on the [Fe(TPP)(2-MeIm−)]− and [Fe(OEP)(2-MeIm−)]− complexes using the Gaussian 09 program package.48 The reported structures with high-spin (HS, S = 2) states were used as the initial geometries for structure optimizations. The GGA functional BP8649 and the triple-ζ valence basis set with polarization (TZVP)50 for iron and 6-31G* for H and C atoms were used.51 As in our prior work52 for calculating anion systems, a basis set with diffuse function 6-31+G* was added to the N atoms, the more negatively-charged atoms, in both the porphyrin and 2-MeIm−. Frequency calculations were performed on the fully optimized structures at the same basis level to obtain the vibrational frequencies with an 57Fe isotope set. The comparisons of the optimized geometry with the observed data are given in Results. .pdf The G09 output files from the DFT calculation can be used to generated predicted mode composition Factors with our scripts.53 The mode composition factors for atom j and frequency mode α are the fraction of a total kinetic energy contributed by atom j (here: 57Fe, a NRVS active nucleus). The normal mode calculations are obtained from the atomic displacement matrix together with the equation: where the sum over i runs over all atoms of the molecule, mi is the atomic mass of atom i and ri is the absolute length of the Cartesian displacement vector for atom i. The polarized mode composition factors are defined in terms of an averaged porphyrin plane as in-plane, which can be calculated from a projection of the atomic displacement vector x and y (eq. 2). The out-of-plane atomic displacement perpendicular to the resulting porphyrin plane for a normal mode is obtained from a projection of the atomic displacement vector z (eq. 3). The x, y and z components of iron normal mode energies for [Fe(TPP)(2-MeIm−)]− and [Fe(OEP)(2-MeIm−)]− (HS) with are given in Table S1.
| (2) |
| (3) |
We also carried out analogous DFT calculations for the neutral species [Fe(TPP)2-MeHIm)] and [Fe(OEP)2-MeHIm)] in an identical fashion to the imidazolates except that the basis set 6-31G* was used for all H, C, and N atoms. As noted earlier,8 the nature of the β-HOMO and the LUMO are quite dissimilar for the neutral imidazole complexes compared to the anionic imidazolate complexes. Diagrams illustrating these orbitals are given in the SI.
Results
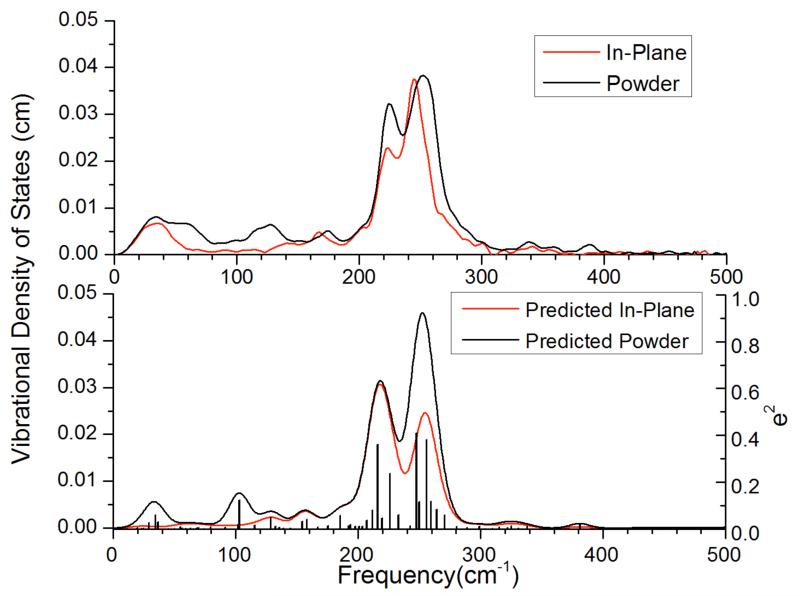
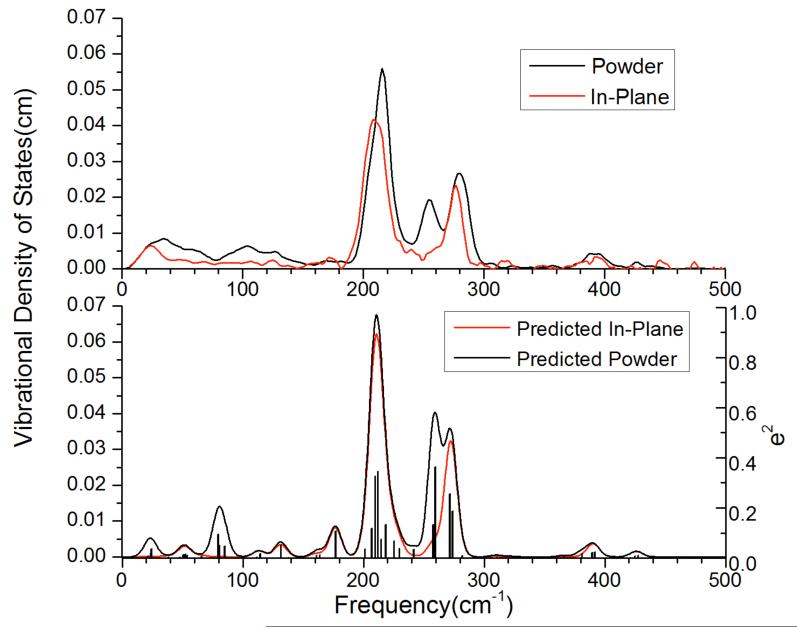
NRVS spectra have been measured for [K(222)][Fe(OEP)(2-MeIm−)] and [K(222)][Fe(TPP)(2-MeIm−)]. Observed powder spectra and generalized in-plane spectra are displayed in the top panel of Figures 1 and 2. The generalized in-plane spectra were measured at arbitrary orientations in the porphyrin plane and hence may contain unequal contributions for the x and y components. This is because the porphyrin species in the observed monoclinic space group will not in general have their x and y directions aligned. As we have shown,54 the in-plane x and y contributions may be affected by the axial ligand orientation and not be equivalent. Hence the in-plane spectra may have anisotropic character.
Figure 1.
NRVS spectra for [K(222)][Fe(OEP)(2-MeIm−)] taken as a powder and as an oriented crystal in a generalized in-plane direction (top panel). DFT-calculated Fe e2 values are shown as the black bars in the bottom panel and the scale is given on the right. The predicted powder and in-plane spectra are shown as the black and red lines, respectively. These are based on convolved Gaussians with widths of 14 cm−1 at FWHH.
Figure 2.
NRVS spectra for [K(222)][Fe(TPP)(2-MeIm−)] taken as a powder and as an oriented crystal in a generalized in-plane direction (top panel). DFT-calculated Fe e2 values are shown as the black bars in the bottom panel and the scale is given on the right. The predicted powder and in-plane spectra are shown as the black and red lines, respectively. These are based on convolved Gaussians with widths of 10 cm−1 at FWHH.
DFT calculations have been performed to aid in the spectral assignments of the spectra which, as can be readily seen in Figures 1 and 2, show substantial overlap. The bottom panels of these figures display the predicted powder and in-plane spectra. In the predicted in-plane spectra, the x and y directions are taken to have equal contributions; this may not be true for the measured in-plane spectra. The calculations predict the overall features expected for high-spin iron(II) derivatives,55 including long Fe–Np bonds and a large displacement of the iron out of the porphyrin plane. Table 1 compares the calculated energy-minimized structural parameters with those observed in the crystal structures. It can be seen that the predicted in-plane Fe–Np distances are slightly longer than the experimentally observed values and the predicted axial distances slightly shorter compared to those observed. The out-of-plane displacement values are in very good accord with the experimental ones. The predicted axial ligand orientations are slightly larger than those observed, a feature that is likely due to the gas phase calculations in order to achieve the minimum intramolecular steric interactions.
Table 1.
Comparison of calculated and experimental structural parameters of imidazolate derivatives.
| Complex | Fe–Npa,b | Fe–Nimb | ΔN4b,c | Δ b,d | ϕ e,f | ref. |
|---|---|---|---|---|---|---|
| [K(222)][Fe(TPP)(2-MeIm−)] (calcd.) |
2.118(13) | 2.056(5)g | 0.56 | 0.66 | 37.4 | 37 |
| 2.14 | 2.048 | 0.59 | 0.66 | 39.8 | tw | |
| [K(222)][Fe(OEP)(2-MeIm−)] (calcd.) |
2.113(4) | 2.060(2) | 0.56 | 0.65 | 23.4 | 37 |
| 2.146 | 2.051 | 0.59 | 0.68 | 42.9 | tw |
Averaged value.
in Å.
Displacement of iron from the mean plane of the four pyrrole nitrogen atoms.
Displacement of iron from the 24-atom mean plane of the porphyrin core.
Value in degrees.
Dihedral angle between the plane defined by the closest Np–Fe–NIm and the imidazole plane in degrees.
Disorder with averaged value given.
Discussion
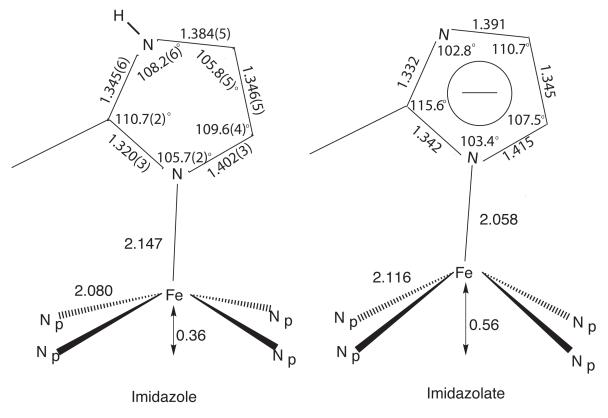
The major emphasis of this spectroscopic investigation is to evaluate the differences in the iron vibrational dynamics between imidazole- and imidazolate-ligated five-coordinate high-spin iron(II) porphyrinates. The expected spectroscopic differences might be predicted based on the structural differences illustrated in Figure 3. These suggest that three major groups of iron-based vibrations will be affected. The first is the out-of-plane vibrations involving the Fe-Im stretch, the second is the in-plane vibrations of iron, and the third is the out-of-plane doming modes. At this simplest level of analysis, based solely on bond distance differences, the Fe-Im stretches would be expected to be at higher frequency for imidazolate derivatives, whereas the in-plane iron vibrations and the doming modes would be expected to be found at lower frequency for the imidazolate derivatives. Possible differences in mixing of iron vibrations with porphyrin modes may also have an effect, although the differences in frequencies are not expected be so large as to lead to this having a significant effect.
Figure 3.
Comparison of the coordination group parameters of the averaged structures of [Fe(Porph)(2-MeHIm)] and [K(222)][Fe(Porph)(2-MeIm−)].
However, vibrational spectral differences might also be modulated by the differences in the electronic structure of the two series of high-spin iron(II) porphyrinates. In an earlier study of imidazole/imidazolate differences,8 we detailed that the electronic structures of the two species are quite distinct and which led to distinctly differing physical properties. The electronic structure differences can be described by the variation in the character of the highest occupied β-MO. In the imidazolate case, this highest occupied orbital is in the heme plane with dxy and dx2–y2 character whereas in the imidazole case the highest occupied orbital is perpendicular to the heme plane and near to the imidazole plane. These differences are schematically depicted in the orbital diagrams given in the SI. But, we show herein that the possible electronic effects on the vibrational spectra do not appear to be a significant factor.
We have shown that the assignment of the iron vibrations in heme complexes can been greatly aided by the measurement of oriented single-crystal spectra. Such measurements thus allow the relatively straightforward assignment of modes in such systems with either in-plane or out-of plane character. Unfortunately, the imidazolate species are in crystallographic space groups that prevent a complete set of oriented single-crystal measurements. Only generalized in-plane measurements are possible for both the TPP and OEP systems. This fact, along with the fact that the iron vibrational spectra have many overlapped peaks, hinders assignments. Fortunately, some important modes are resolved in one or the other system and permits the examination of the questions posed above. Finally, note that because the generalized in-plane spectrum is not isotropic in x and y, the difference between the (normalized) powder spectrum and the in-plane spectrum does not yield a pure z (out-of-plane) spectrum.56
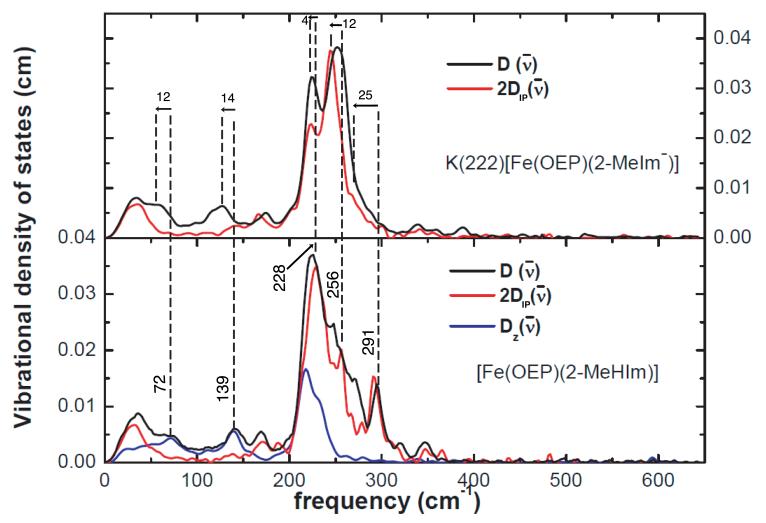
It can reasonably be expected that the general features of the vibrational spectra of imidazole and imidazolate derivatives would be similar. Indeed, the spectra of all are dominated by strong signals in the 200 – 300 cm−1 region. Moreover with the same porphyrin, the powder spectra envelopes of imidazole/imidazolate pairs are closely similar. The spectral differences between porphyrins are, for the same axial ligand, quite distinct, which is in keeping with the earlier observations of the importance of the peripheral groups on the spectra.57, 58 We can however expect strong similarities within the same porphyrin families; the lack of complete orientational data for the imidazolates is a relatively minor problem.
Vibrational assignments for the imidazolate derivatives have been made based on the (partial) oriented crystal data and the DFT predictions. Comparison of these predictions and experimental observations along with the analogous imidazole derivatives are given in Table 2. We limit entries in the table to those that have clearly observed features in the experimental spectra. Given the fact of unresolved peaks, not all modes will be entered. In particular, some modes involving the simultaneous motion of iron and imidazole(ate) cannot be compared. Note that Table 2 also gives the mode description for both imidazole and imidazolate derivatives.
Table 2.
Comparison of Calculated and Observed Normal Modes of the Imidazole and Imidazolate Derivatives.a
| Type | [Fe(TPP)(2-MeHIm)] Observed (Calculated) |
[K(222)][Fe(TPP)(2-MeIm−)] Observed (Calculated) |
[Fe(OEP)(2-MeHIm)] Observed (Calculated) |
[K(222)][Fe(OEP)(2-MeIm−)] Observed (Calculated) |
Description |
|---|---|---|---|---|---|
| ip | 212, 221 (220, 212, 228, 222) | 208 (207, 210, 212, 218) | |||
| ip | 294(292, 295) | 277 (272, 274) | 228 (220, 224, 230b) | 224 (216, 226) | ν 53 |
| ip | 408 (407, 411) | 394 (390, 392) | 256, 291 ( 263, 288, 289) | 244, 266(sh) (250, 256, 260, 271) | ν50 |
|
| |||||
| oop | 216, 226 (197, 201, 203, 212) | ||||
| oop | 248 (266) | 254 (260) | 218, 230 (220, 230b) | ~260 (248, 256, 264) |
γ6 (inverse doming) νFe–NIm |
|
| |||||
| oop | 83, 116 (83, 87) | 58, 103, 127 (80, 85) | 72, 139 (116) | 60, 115, 125 (103) | (9 (doming) |
|
| |||||
| Reference | 38 | this work | 38 | this work | |
All frequencies are expressed in cm−1.
230 cm−1 mode has both ip and oop character.
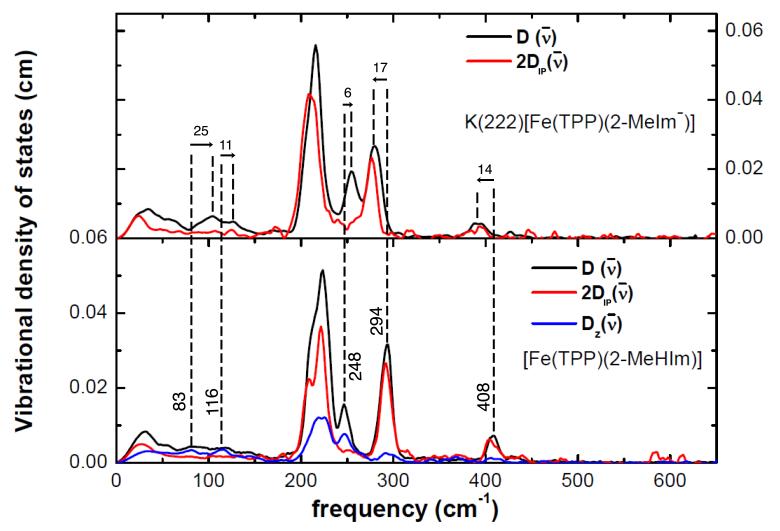
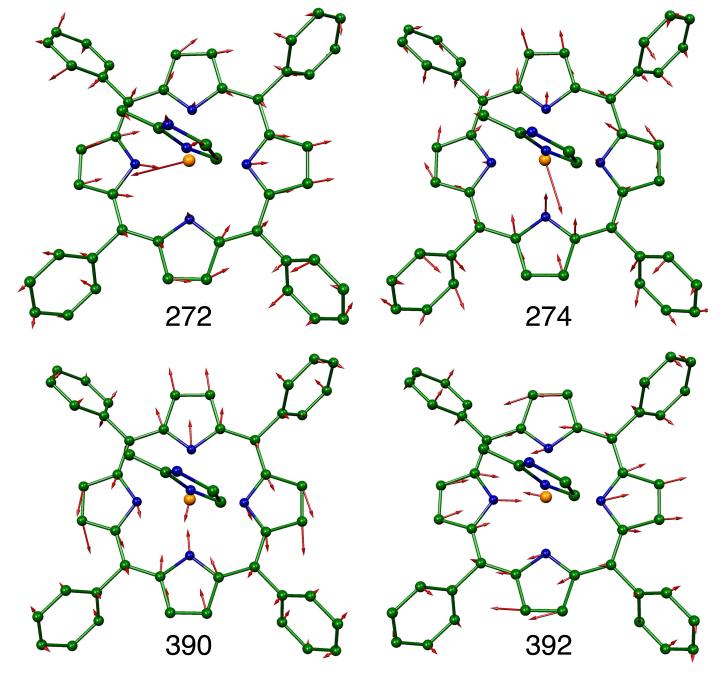
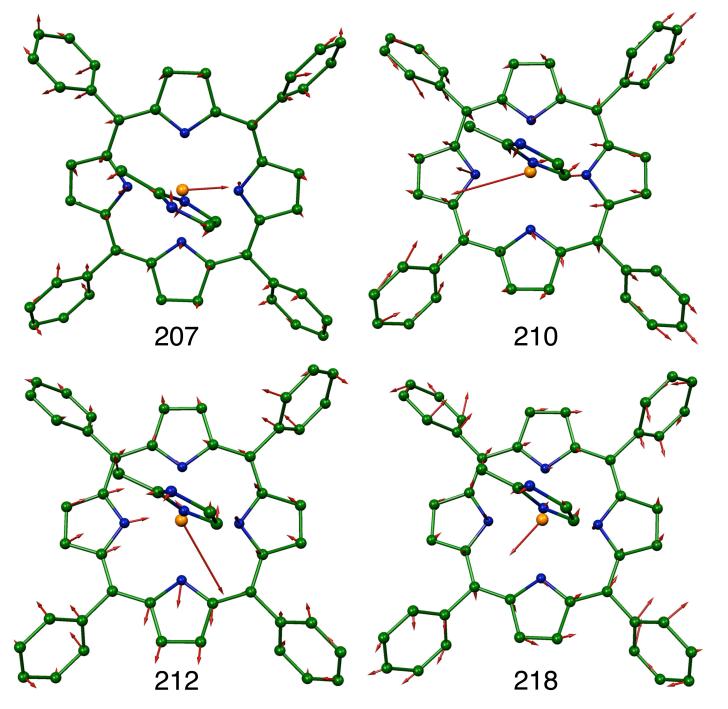
Figures 4 and 5 display pictorial comparisons of the vibrational spectra of the 2-MeHIm and 2-MeIm− complexes with [Fe(OEP)] and [Fe(TPP)]. To further facilitate comparison of the vibrational spectra of the imidazole/imidazolate derivatives, we display MOLEKEL depictions59 of the imidazolates that are closely related to the imidazole illustrations presented previously in reference 38. The in-plane modes in the tetraphenylporphyrin derivative illustrated in Figures 6 and 7 and represent four distinct pairs of near-degenerate modes. They are closely related in character to the in-plane modes of the imidazole derivatives (depicted previously in Figures 4 and 5 of reference 38). All of these comparable modes (predicted and experimental) are shifted to lower values for the imidazolate derivative. Depictions of the modes of the octaethylporphyrin derivatives are given in the SI. A comparison of Figures S5 and S6 of this paper with Figures S1 and S2 of the imidazoles38 again reveal the close similarity.
Figure 4.
Comparison of the vibrational spectra of [Fe(TPP)(2-MeHIm)] and [K(222)][Fe(TPP)(2-MeIm−)]. The dashed lines and arrows display the shifts in selected vibrations. We have entered along the vertical dashed lines, the value of the observed frequency (in cm−1) for the imidazole species. Note that all values of observed frequencies are given in Table 2 along with the mode assignments. The value of the frequency shift, along with an arrowhead showing the direction of the shift, is entered for each correlated pair.
Figure 5.
Comparison of the vibrational spectra of [Fe(OEP)(2-MeHIm)] and [K(222)][Fe(OEP)(2-MeIm−)]. The dashed lines and arrows display the shifts in selected vibrations. We have entered along the vertical dashed lines, the value of the observed frequency (in cm−1) for the imidazole species. Note that values of observed frequencies are given in Table 2 along with the mode assignments. The values of the frequency shift, along with an arrowhead showing the direction of the shift, is entered for each correlated pair.
Figure 6.
Two DFT-predicted pairs of in-plane Fe modes contributing to the pair of experimental features at 277 and 394 cm−1 in [K(222)][Fe(TPP)(2-MeIm−)]. Arrows represent the mass-weighted displacements of the individual atoms. For ease of visualization each arrow is 100 (mj/mFe)1/2 times longer than the zero-point vibration amplitude of atom j. Color scheme: cyan = iron, green = carbon, blue = nitrogen. In this and other figures, hydrogens are omitted for clarity. Except for the predicted 272 cm−1 mode, which has a small amount of out-of-place iron motion, all iron motion is completely in-plane.
Figure 7.
Four DFT-predicted in-plane Fe modes contributing to the strong experimental feature at 208 cm−1 in [K(222)][Fe(TPP)(2-MeIm)−]. All predicted modes, except the mode predicted at 218 cm−1, have a small amount of out-of-plane iron motion.
The predicted character of the very low frequency out-of-plane modes that includes the doming mode are illustrated in Figures S7 and S8. The experimental spectra are not as well resolved as might be wished, but the observed spectra do shift to lower frequencies in the imidazolate derivatives (Table 2) for the TPP derivative but not for the OEP derivative. As we have noted, we would have expected with the larger iron atom displacement in the imidazolate species that the doming mode would have systematically shifted to lower frequency.
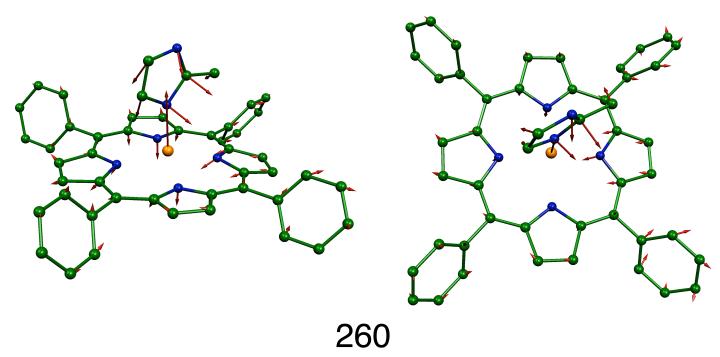
Only a single out-of-plane mode with predicted simultaneous iron and imidazole motion is well-resolved in the measured spectra, especially in the TPP derivative. This mode also has significant γ6 (inverse doming) character as shown in Figure 8. For this mode, the imidazolate derivatives display a higher frequency than the imidazole species. Although it cannot be ascertained from the experimental data, it is likely that this pattern would also be observed for the remaining oop modes with significant simultaneous motion of iron and imidazole. Experimental verification would require the measurement of the oop spectra with an appropriate single crystal, which despite substantial effort, we have not been able to prepare.
Figure 8.
The out-of-plane Fe mode, predicted at 260 cm−1, contributing to the experimental feature at 254 cm−1 in [K(222)][Fe(TPP)(2-MeIm−)].
In summary, we observe that the frequency of the in-plane vibrations are shifted lower in both of the imidazolate complexes. On the other hand, the observable out-of-plane mode shifts to higher frequency (Table 2). The magnitude of the shifts appear substantially different with the OEP derivative showing larger shifts than the TPP derivative (and which are more di cult to assess). It would appear that the Fe–NIm stretch may show differences in mode mixing and in sensitivity to the environment. The lowest out-of-plane frequencies, which include the doming mode, appear to shift in the opposite direction in the two complexes.
Finally, an analysis of the overall molecular stiffness47 provides additional information. The stiffness is an effective force constant, first described by Lipkin,46 that quantifies the strength of the Fe coordination sphere, even in cases where vibrational congestion impedes identification of individual Fe-ligand vibrations.60 Specifically, the stiffness measures the force required to displace the Fe along the direction of the X-ray beam with the other atoms fixed at their equilibrium positions.47 The measured vibrational density of states provides a way to experimentally determine the stiffness, with measurements on randomly oriented molecular ensembles yielding an orientationally averaged value.
The stiffness of the Fe environment determined from measurements on polycrystalline powders of either [K(222)][Fe(TPP)(2-MeIm−)] or [K(222)][Fe(OEP)(2-MeIm−)] is slightly but meaningfully lower than the 188 pN/pm value determined from measurements on the neutral [Fe(TPP)(2-MeHIm)] complex with a neutral imidazole ligand38 (Table 3). All stiffnesses fall in the range of values reported for other high-spin porphyrins and heme proteins, and well below the 280 – 340 pN/pm range reported for low-spin heme proteins.47, 58, 60, 61 In particular, the 190 pN/nm stiffness determined for deoxygenated myoglobin60 agrees well with that determined for [Fe(TPP)(2-MeHIm)], reflecting the similar coordination of the Fe, in spite of variations in the detailed vibrational structure.38
Table 3.
Experimental stiffness values (in pN/pm) characterize the effect of imidazole deprotonation on nearest neighbor interactions with the iron in imidazole ligated porphyrins. NRVS measurements on oriented single crystals with the X-ray beam direction parallel and perpendicular to the porphyrin plane determined equatorial and axial stiffnesses, respectively, while measurements on polycrystalline powders average stiffness over all orientations.
| compound | powder | equatorial | axial |
|---|---|---|---|
| [K(222)][Fe(TPP)(2-MeIm−)] | 171 ± 5 | 166 ± 23 | n.d.a |
| [K(222)][Fe(OEP)(2-MeIm−)] | 178 ± 3 | 167 ±7 | n.d.a |
| [Fe(TPP)(2-MeHIm)] | 188 ± 1 | 209 ± 6 | 153 ± 9 |
n.d. = not determined.
Measurements on oriented single crystals reported here (Figs. 1 and 2) characterize the Fe coordination sphere more completely by distinguishing the equatorial contribution to the stiffness. In particular, the substantial decrease, from 209 to 166 pN/pm, in the equatorial stiffness upon deprotonation of [Fe(TPP)(2-MeHIm)] (Table 3) reflects the increased Fe–Np bond lengths (Table 1). Although crystal packing did not permit measurements with the X-ray beam perpendicular to the porphyrin plane, we deduce that the axial stiffness must be larger than the isotropically averaged 170 pN/pm stiffness to compensate for an equatorial value slightly smaller than the isotropic value. Thus, this observation indirectly confirms the increased axial stiffness of [K(222)][Fe(TPP)(2-MeIm−)] with respect to the 153 pN/pm value observed for the neutral [Fe(TPP)(2-MeHIm)] complex, as expected in light of the reduced Fe–NIm bond length. Imidazolate protonation thus inverts the relative strength of axial and equatorial coordination.
In contrast, the stiffnesses (both isotropic and equatorial) are identical, within uncertainty, for the imidazolate complexes [K(222)][Fe(TPP)(2-MeIm−)] and [K(222)][Fe(OEP)(2-MeIm−)] (Table 3), despite significant differences in the detailed vibrational dynamics of these complexes (Figs. 1 and 2). We have previously observed that peripheral substitutions on the porphyrin ring strongly influence the detailed vibrational dynamics of the Fe.57, 58 The stiffness is insensitive to these variations, and thus provides a robust probe of Fe coordination.
Summary
The pattern of iron dynamics of the imidazolate derivatives are very similar to those of the neutral analogues. Despite differences in the electronic structure between the two classes, the frequency shifts of the in-plane and out-of-plane vibrations are qualitatively predicted by noting the differences in the bond distances of the two sets of derivatives. This is shown by comparison of the frequencies of individual modes, when available, and by the effective force constants describing the stiffness of the Fe coordination.
Supplementary Material
Acknowledgments
We thank the National Natural Science Foundation of China (No. 21271133) for support of this research to CH, the National Institutes of Health Grant GM-38401 to WRS and the NSF under CHE-1026369 to JTS. Use of the Advanced Photon Source, an O ce of Science User Facility operated for the US Department of Energy (DOE) O ce of Science by Argonne National Laboratory, was supported by the U.S. DOE under Contract No. DE-AC02-06CH11357. We thank the reviewers for their helpful comments on improving this paper.
Footnotes
Supporting Information Available: Figures S1–S4 depicting the frontier β MO-s for [Fe(TPP)(2-MeHIm], [Fe(TPP)(2-MeIm−)]−, [Fe(OEP)(2-MeHIm)], and [Fe(OEP)(2-MeIm−)]−. Figures S5–S8 give MOLEKEL depictions of selected modes. Table S1 provides predicted frequencies and the ip, oop and total values for the two imidazolate derivatives and Table S2 gives the orthogonal coordinates for the optimized imidazolate structures.
References and Notes
- (1).Peisach J, Blumberg WE, Adler A. Ann. N.Y. Acad. Sci. 1973;206:310. doi: 10.1111/j.1749-6632.1973.tb43219.x. [DOI] [PubMed] [Google Scholar]
- (2).Nicholls P. Biochim. Biophys. Acta. 1962;60:217. doi: 10.1016/0006-3002(62)90397-9. [DOI] [PubMed] [Google Scholar]
- (3).Mincey T, Traylor TG. J. Am. Chem. Soc. 1979;101:765. [Google Scholar]
- (4).Teroaka J, Kitagawa T. Biochem. Biophys. Res. Commun. 1980;93:674. doi: 10.1016/0006-291x(80)91133-x. [DOI] [PubMed] [Google Scholar]
- (5).Morrison M, Schonbaum GR. Annu. Rev. Biochem. 1976;45:861. doi: 10.1146/annurev.bi.45.070176.004241. [DOI] [PubMed] [Google Scholar]
- (6).Peisach J. Ann. N.Y. Acad. Sci. 1975;244:187. doi: 10.1111/j.1749-6632.1975.tb41531.x. [DOI] [PubMed] [Google Scholar]
- (7).Valentine JS, Sheridan RP, Allen LC, Kahn P. Proc. Natl. Acad. Sci. U.S.A. 1979;76:1009. doi: 10.1073/pnas.76.3.1009. [DOI] [PMC free article] [PubMed] [Google Scholar]
- (8).Hu C, Sulok CD, Paulat F, Lehnert N, Twigg AI, Hendrich MP, Schulz CE, Scheidt WR. J. Am. Chem. Soc. 2010;132:3737. doi: 10.1021/ja907584x. [DOI] [PMC free article] [PubMed] [Google Scholar]
- (9).Vojtechovsky J, Chu K, Berendzen J, Sweet RM, Schlichting I. Biophys. J. 1999;77:2153. doi: 10.1016/S0006-3495(99)77056-6. [DOI] [PMC free article] [PubMed] [Google Scholar]
- (10).Berglund GI, Carlsson GH, Smith AT, Szoke H, Henriksen A, Hajdu J. Nature. 2002;417:463. doi: 10.1038/417463a. [DOI] [PubMed] [Google Scholar]
- (11).Spiro TG, Smulevich G, Su C. Biochemistry. 1990;29:4497. doi: 10.1021/bi00471a001. [DOI] [PubMed] [Google Scholar]
- (12).Smulevich G, Hu S, Rodgers KR, Goodin DB, Smith KA, Spiro TG. Biospectroscopy. 1996;2:365. [Google Scholar]
- (13).Smulevich G, Feis A, Howes BD. Acc. Chem. Res. 2005;38:433. doi: 10.1021/ar020112q. [DOI] [PubMed] [Google Scholar]
- (14).Smulevich G, Feis A, Focardi C, Tams J, Welinder KG. Biochemistry. 1994;33:15425. doi: 10.1021/bi00255a024. [DOI] [PubMed] [Google Scholar]
- (15).Argade PV, Sassaroli M, Rousseau DL, Inubushi T, Ikeda-Saito M, Lapidot A. J. Am. Chem. Soc. 1984;106:6593. [Google Scholar]
- (16).Teraoka J, Kitagawa T. J. Biol. Chem. 1981;256:3969. [PubMed] [Google Scholar]
- (17).Goodin DB, McRee DE. Biochemistry. 1993;32:3313. [PubMed] [Google Scholar]
- (18).Hashimoto S, Tatsuno Y, Kitagawa T. Proc. Natl. Acad. Sci. U.S.A. 1986;83:2417. doi: 10.1073/pnas.83.8.2417. [DOI] [PMC free article] [PubMed] [Google Scholar]
- (19).Dasgupta S, Rousseau D, Anni H, Yonetani T. J. Biol. Chem. 1989;264:654. [PubMed] [Google Scholar]
- (20).Argade PV, Ching Y-C, Rousseau DL. Science. 1984;255:329. doi: 10.1126/science.6330890. [DOI] [PubMed] [Google Scholar]
- (21).Shepherd M, Barynin V, Lu C, Bernhardt PV, Wu G, Yeh S-R, Egawa T, Sedelnikova SE, Rice DW, Wilson JL, Poole RK. J. Biol. Chem. 2010;285:12747. doi: 10.1074/jbc.M109.084509. [DOI] [PMC free article] [PubMed] [Google Scholar]
- (22).Franzen S, Roach MP, Chen Y-P, Dyer BR, Woodruff WH, Dawson JH. J. Am. Chem. Soc. 1998;120:4658. [Google Scholar]
- (23).Jensen KP, Ryde U. Molecular Physics. 2003;101:2003. [Google Scholar]
- (24).Jensen KP, Ryde U. J. Biol. Chem. 2004;279:14561. doi: 10.1074/jbc.M314007200. [DOI] [PubMed] [Google Scholar]
- (25).Heimdal J, Rydberg P, Ryde U. J. Phys. Chem. B. 2008;112:2501. doi: 10.1021/jp710038s. [DOI] [PubMed] [Google Scholar]
- (26).Derat E, Cohen S, Shaik S, Altun A, Thiel W. J. Am. Chem. Soc. 2005;127:13611. doi: 10.1021/ja0534046. [DOI] [PubMed] [Google Scholar]
- (27).Dawson JH. Science. 1988;240:433. doi: 10.1126/science.3358128. [DOI] [PubMed] [Google Scholar]
- (28).Poulos TL. J. Biol. Inorg. Chem. 1996;1:356. [Google Scholar]
- (29).Walker FA, Lo M-W, Ree MT. J. Am. Chem. Soc. 1976;98:5552. doi: 10.1021/ja00434a024. [DOI] [PubMed] [Google Scholar]
- (30).Ellison MK, Schulz CE, Scheidt WR. Inorg. Chem. 2002;41:2173. doi: 10.1021/ic020012g. [DOI] [PubMed] [Google Scholar]
- (31).Collman JP, Kim N, Hoard JL, Lang G, Radonovich LJ, Reed CA. Abstracts of Papers; 167th National Meeting of the American Chemical Society; Los Angeles, CA. Washington, D. C.: American Chemical Society; Apr, 1974. INOR 29. (b) Hoard, J. L., personal communication to WRS. In particular, Prof. Hoard provided a set of atomic coordinates for the molecule.
- (32).Hu C, Roth A, Ellison MK, An J, Ellis CM, Schulz CE, Scheidt WR. J. Am. Chem. Soc. 2005;1(27):5675. doi: 10.1021/ja044077p. [DOI] [PMC free article] [PubMed] [Google Scholar]
- (33).Hu C, An J, Noll BC, Schulz CE, Scheidt WR. Inorg. Chem. 2006;45:4177. doi: 10.1021/ic052194v. [DOI] [PMC free article] [PubMed] [Google Scholar]
- (34).Hu C, Noll BC, Piccoli PMB, Schultz AJ, Schulz CE, Scheidt WR. J. Am. Chem. Soc. 2008;130:3127. doi: 10.1021/ja078222l. [DOI] [PMC free article] [PubMed] [Google Scholar]
- (35).Hu C, Noll BC, Schulz CE, Scheidt WR. Inorg. Chem. 2008;47:8884. doi: 10.1021/ic8009496. [DOI] [PMC free article] [PubMed] [Google Scholar]
- (36).Hu C, Noll BC, Schulz CE, Scheidt WR. Inorg. Chem. 2010;49:10984. doi: 10.1021/ic101469e. [DOI] [PMC free article] [PubMed] [Google Scholar]
- (37).Hu C, Noll BC, Schulz CE, Scheidt WR. J. Am. Chem. Soc. 2005;1(27):15018. doi: 10.1021/ja055129t. [DOI] [PMC free article] [PubMed] [Google Scholar]
- (38).Hu C, Barabanschikov A, Ellison MK, Zhao J, Alp EE, Sturhahn W, Zgierski MZ, Sage JT, Scheidt WR. Inorg. Chem. 2012;51:1359. doi: 10.1021/ic201580v. [DOI] [PMC free article] [PubMed] [Google Scholar]
- (39).Landergren M, Baltzer L. Inorg. Chem. 1990;29:556. [Google Scholar]
- (40).The following abbreviations are used in this paper: VDOS, vibrational density of states; TPP, dianion of meso-tetraphenylporphyrin; OEP, dianion of octaethylporphyrin; 2-MeHIm, 2-methylimidazole; 2-MeIm−, 2-methylimidazolate; 1,2-Me2Im, 1,2-dimethylimidazole; Np, porphyrinato nitrogen; NIm, nitrogen atom of imidazole; Kryptofix-222 or 222, 4,7,13,16,21,24-hexaoxo-1,10-diazabicyclo[8.8.8]hexacosane; MCD, magnetic circular dichroism; EPR, electron paramagnetic resonance..
- (41).Toellner TS. Hyperfine Interact. 2000;125:3. [Google Scholar]
- (42).Sage JT, Paxson C, Wyllie GRA, Sturhahn W, Durbin SM, Champion PM, Alp EE, Scheidt WR. J. Phys. Condens. Matter. 2001;13:7707. [Google Scholar]
- (43).Sturhahn W, Kohn GV. Hyperfine Interact. 1999;123/124:367. [Google Scholar]
- (44).Lipkin HJ. Ann. Phys. (NY) 1962;18:182. [Google Scholar]
- (45).Sturhahn W. Hyp. Int. 2000;125:149. [Google Scholar]
- (46).Lipkin HJ. Phys. Rev. B. 1995;52:10073. doi: 10.1103/physrevb.52.10073. [DOI] [PubMed] [Google Scholar]
- (47).Leu BM, Sage JT. Hyperfine Interact. 2013 in press. [Google Scholar]
- (48).Frisch MJ, Trucks GW, Schlegel HB, Scuseria GE, Robb MA, Cheeseman JR, Scalmani G, Barone V, Mennucci B, Petersson GA, Nakatsuji H, Caricato M, Li X, Hratchian HP, Izmaylov AF, Bloino J, Zheng G, Sonnenberg JL, Hada M, Ehara M, Toyota K, Fukuda R, Hasegawa J, Ishida M, Nakajima T, Honda Y, Kitao O, Nakai H, Vreven T, Montgomery JA, Jr., Peralta JE, Ogliaro F, Bearpark M, Heyd JJ, Brothers E, Kudin KN, Staroverov VN, Kobayashi R, Normand J, Raghavachari K, Rendell A, Burant JC, Iyengar SS, Tomasi J, Cossi M, Rega N, Millam JM, Klene M, Knox JE, Cross JB, Bakken V, Adamo C, Jaramillo J, Gomperts R, Stratmann RE, Yazyev O, Austin AJ, Cammi R, Pomelli C, Ochterski JW, Martin RL, Morokuma K, Zakrzewski VG, Voth GA, Salvador P, Dannenberg JJ, Dapprich S, Daniels AD, Farkas O, Foresman JB, Ortiz JV, Cioslowski J, Fox DJ. Gaussian 09, Revision A. 02. Gaussian, Inc.; Wallingford CT: 2009. [Google Scholar]
- (49).(a) Becke AD. Phys. Rev. 1988;A38:3098. doi: 10.1103/physreva.38.3098. [DOI] [PubMed] [Google Scholar]; (b) Perdew JP. Phys. Rev. B. 1986;33:8822. doi: 10.1103/physrevb.33.8822. [DOI] [PubMed] [Google Scholar]
- (50).Scḧafer A, Horn H, Ahlrichs R. J. Chem. Phys. 1992;97:2571. [Google Scholar]
- (51).We have found that there can be wide variation in the DFT results for frequency predictions. We discuss this in two articles.52, 57 Especially for high-spin systems, we have found di culties with spin contamination with B3LYP compared to BP86 and other hybrid functionals.
- (52).Peng Q, Pavlik JW, Scheidt WR, Wiest O. J. Chem. Theory Comput. 2012;8:214. doi: 10.1021/ct2006456. [DOI] [PMC free article] [PubMed] [Google Scholar]
- (53).Li J-F, Peng Q, Barabanchikov A, Pavlik JW, Alp EE, Sturhahn W, Zhao J, Sage JT, Scheidt WR. Inorg. Chem. 2012;51:11769. doi: 10.1021/ic301719v. [DOI] [PMC free article] [PubMed] [Google Scholar]
- (54).Pavlik JW, Barabanchikov A, Oliver AG;, Alp EE, Sturhahn W, Zhao J, Sage JT, Scheidt WR. Angew. Chem., Int. Ed. 2010;49:4400. doi: 10.1002/anie.201000928. [DOI] [PMC free article] [PubMed] [Google Scholar]
- (55).Scheidt WR, Reed CA. Chem. Rev. 1981;81:543. [Google Scholar]
- (56).In previous work,54 Pavlik et al. demonstrated for [Fe(OEP)(NO)] that the orientation of the axial ligand led to control of the in-plane iron motion and a loss of x and y degeneracy. Unfortunately, such measurements can not always be performed.
- (57).Leu BM, Zgierski MZ, Wyllie GRA, Scheidt WR, Sturhahn W, Alp EE, Durbin SM, Sage JT. J. Am. Chem. Soc. 2004;126:4211. doi: 10.1021/ja038526h. [DOI] [PMC free article] [PubMed] [Google Scholar]
- (58).Barabanschikov A, Demidov A, Kubo M, Champion PM, Sage JT, Zhao J, Sturhahn W, Alp EE. J. Chem. Phys. 2011;135:015101. doi: 10.1063/1.3598473. [DOI] [PMC free article] [PubMed] [Google Scholar]
- (59).Portmann S, Lúthi HP. MOLEKEL: an interactive molecular graphics tool. Chimia (Aarau) 2000;54:766. [Google Scholar]
- (60).Leu BM, Ching TH, Zhao J, Sturhahn W, Alp EE, Sage JT. J. Phys. Chem. B. 2009;113:2193. doi: 10.1021/jp806574t. [DOI] [PubMed] [Google Scholar]
- (61).Adams KL, Tsoi S, Yan J, Durbin SM, Ramdas AK, Cramer WA;, Sturhahn W, Alp EE, Schulz CE. J. Phys. Chem. B. 2006;110:530. doi: 10.1021/jp053440r. [DOI] [PubMed] [Google Scholar]
Associated Data
This section collects any data citations, data availability statements, or supplementary materials included in this article.


