

Abstract
A simple and sensitive UV spectrophotometric method was developed and validated for the determination of pregabalin in bulk, pharmaceutical formulations and in human urine samples. The method was linear in the range of 0.5–5.0 μg/ml. There is no generally accepted method for the determination of pregabalin. The absorbance was measured at 210 nm. The method was validated with respect to accuracy, precision, specificity, ruggedness, and robustness, limit of detection and limit of quantitation. This method was used successfully for the quality assessment of five pregabalin drug products and in human urine samples with good precision and accuracy. This is found to be simple, specific, precise, accurate, reproducible and low cost UV Spectrophotometric method.
Keywords: pregabalin, validation, bulk drug, pharmaceutical formulations, human urine samples, uv
INTRODUCTION
Pregabalin (PGB) is a new active substance known chemically as (S)–3–amino methyl–5–methyl hexanoic acid and is structurally related to the naturally occurring amino acids L – leucine and gamaa aminobutyric acid (GABA) (Fig. 1). It is a white to off – white crystalline, non – hygroscopic and water soluble (freely soluble below pH–3.7) powder. It contains one chiral centre, but is synthesized as the single enantiomer S. PGB exists as a single anhydrous and not solvated crystal form.
Figure 1.
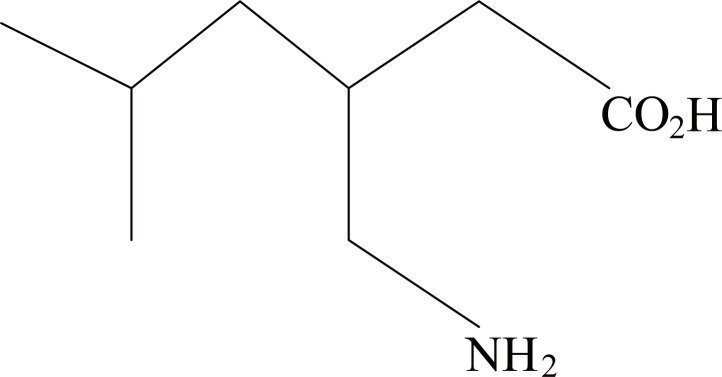
Structure of Pregabalin.
PGB is a new anticonvulsant and analgesic medication that was recently approved for adjunctive treatment of partial seizures in adults (1–4) in both the United States and Europe and for the treatment of neuropathic pain from postherpetic neuralgia and diabetic neuropathy. It is both structurally and pharmacologically related to the anticonvulsant and analgesic medication gabapentin (Fig. 2).
Figure 2.
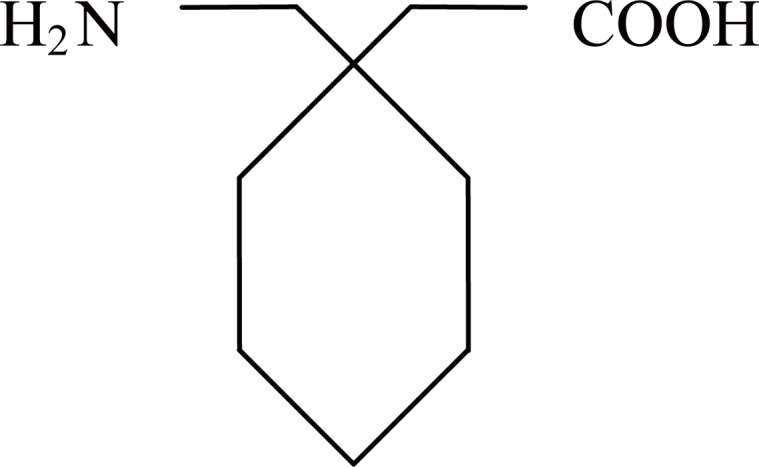
Structure of Gabapentin.
The mechanism of action is still unclear, pregabalin decreases central neuronal excitability by binding to an auxiliary subunit (α2–δ protein) of a voltage – gated calcium channel on neurons in the central nervous system. PGB reduces the release of several neurotransmitters include glutamate, norepinephrine, Substance P, and calcitonin gene related peptide from certain brain tissues and also reduce calcium influx in synaptosomes.
Pregabalin undergoes minimal metabolism in human with unchanged parent representing the majority (≥90 %) of drug – derived material (5). This contrasts with gabapentin, which is absorbed via a capacity limited L – amino acid transport system from the proximal small bowel into the blood stream (6–7).
The therapeutic importance of Pregabalin was behind the development of numerous methods for its determination. The methods adapted to the analysis of PGB include high – performance liquid chromatography (HPLC) (8), liquid chromatography – mass spectrophotometry (LC–MS) (9–10) and spectrofluorimetry (11). In addition, these methods require long and tedious pretreatment of the samples and laborious clean up procedures prior to analysis. An official monograph of PGB does not exist in any pharmacopoeia and determination of PGB in bulk and pharmaceutical formulations has not been yet described. Therefore, it is very imperative to develop a simple and suitable analytical method for the determination of PGB in bulk and pharmaceutical formulations. UV – Visible spectrophotometry is the technique of choice in research laboratories, hospitals and pharmaceutical industries due to its low cost and inherent simplicity.
This paper reports a simple, sensitive and accurate spectrophotometric method for the determination of PGB. The method is based on the direct measurement of native absorbance of the drug at 210 nm against the reagent blank. The proposed method was extended to the determination of PGB in bulk, pharmaceutical formulations and in human urine samples.
EXPERIMENTAL
Apparatus
Spectral runs were made on UV 3000+ UV/VIS spectrophotometer (LABINDIA®, Mumbai, India) with 1 cm matched glass cell.
Materials and Reagents
Pregabalin (Vardhman Chemtech Ltd, Punjab, India) was used as working standard.
Pharmaceutical formulations of PGB such as Gabanext 75 (Nicholas Piramal India Ltd, Mumbai, India), Pregalin 75 (Torrent Pharmaceutical Ltd, Baddi, India), Neugaba 75 (Sun Pharmaceutical Industries, Jammu, India), Mahagaba 75 (Mankind Pharma Ltd, New Delhi, India) and Maxgalin 75 (Sun Pharmaceutical Industries, Jammu, India) were purchased from local markets.
Sodium carbonate was purchased from Qualigens fine chemicals (Mumbai, India).
Sodium bicarbonate was purchased from Qualigens fine chemicals (Mumbai, India).
Urine samples were obtained from healthy volunteers.
Carbonate buffer of pH 9.4 was prepared by dissolving 26.5 gm sodium carbonate and 21.0 gm sodium bicarbonate in 500 ml distilled water.
Determination of appropriate UV wavelength
A suitable wavelength was required for the determination of Pregabalin. The appropriate wavelength for the determination of PGB was determined by wavelength scanning over the range 190–450 nm with a UV 3000+ UV/VIS spectrophotometer (LABINDIA®, Mumbai, India).
Standard PGB Solution
A stock solution of PGB (50 μg/ml) was prepared by dissolving 5 mg PGB in 100 ml volumetric flasks with double distilled water. The stock solution (50 μg/ml) was used to prepare the working solutions by suitable dilutions with distilled water. The solutions were stable at least 10 days in room temperature.
METHODS
Procedure for the determination of PGB
Aliquots of stock solution (50 μg/ml) were transferred into a set of 50 ml volumetric flasks and volumes were completed to the mark with distilled water to produce solutions in the concentration range 0.5–5.0 μg/ml. Absorbance was measured at 210 nm (Fig. 3) against the reagent blank. Calibration graphs were constructed by plotting absorbance against the final concentration of PGB.
Figure 3.

Absorption spectra of Pregabalin (5.0 μg/ml).
Procedure for determination of PGB in pharmaceutical formulations
One capsule (claiming 75 mg of Pregabalin) was accurately weighed and finely powdered. A quantity of the powder equivalent to 5 mg of PGB was extracted by shaking with 20 ml of distilled water, followed by another two extractions each with 10 ml distilled water. After passing through a 0.45 μm Millipore filter, the solution was diluted with distilled water to obtain a concentration of about 50 μg/ml. It was further diluted according to the need and then analyzed following the proposed procedures. The nominal content of the capsule was calculated either from the previously plotted calibration graphs or using regression equation.
Procedure for determination of PGB in human urine samples
Aliquot volumes of human urine samples were transferred into small separating funnel. 10 ml of carbonate buffer pH–9.4 was added and solution was mixed well. The solution was then extracted with 2 × 10 ml diethyl ether. The ether extract was collected and evaporated. The residue was dissolved in 10 ml distilled water and above general procedure was then followed. The amount of PGB was obtained from the calibration graphs or corresponding regression equation.
METHOD VALIDATION
The method was validated for selectivity, linearity, precision, accuracy, recovery and stability according to the principles of the Food and Drug Administration (FDA) industry guidance (12). Validation of analytical procedures is a vital aspect not just for regulatory purposes, but also for their efficient and reliable long – term application. The ICH guidelines achieved a great deal in harmonizing the definitions of required validation parameters, their calculation and interpretation. It is the responsibility of the analyst to identify parameters which are relevant to the performance of given analytical procedure as well as to design proper validation protocols including acceptance criteria and to perform an appropriate evaluation. The International Conference on the Harmonization of the Technical Requirements for Registration of Pharmaceuticals for Human Use has harmonized the requirements in two guidelines (13, 14). The first one summarizes and defines the validation characteristics needed for various types of test procedures, the second one extends the previous test to include the experimental data required and some statistical interpretation. These guidelines serve as a basis worldwide both for regulatory authorities and industry and bring the importance of a proper validation to the attention of all those involved in the process of submission. Nowadays, the validation characteristics needed for the various test procedures and their general requirements are well understood. The essential question to be answered is on the suitability of the calibration mode to be used in the test procedure. It should be noted that in most cases only a qualitative statement is needed.
The stability of the working PGB sample solutions at room temperature was evaluated with the help of UV spectra. The specificity and selectivity of the proposed method was evaluated by estimating the amount of PGB in the presence of common excipients lactose monohydrate, corn, starch, talc and methyl cobalamin.
The linearity of the proposed method was constructed for Pregabalin reference standard solution by plotting concentration of the compound versus the absorbance. The linearity was evaluated by linear regression analysis, which was calculated by the least square regression method. The parameters LOD and LOQ were determined on the basis of response and slope of the regression equation. The accuracy and precision of the method was evaluated within the linear range based on the analysis of PGB reference standard samples and pharmaceutical formulations at 2.0, 3.5 and 5.0 μg/ml. Five independent analysis were performed at each concentrations level within one day (intraday precision) as well as for five consecutive days (interday precision). The accuracy was ascertained by recovery studies using the standard addition method. The proposed method was used for estimation of PGB from capsules after spiking with 50, 200 and 350 % additional pure drug. The amount of PGB was determined from the regression equation.
RESULTS AND DISCUSSIONS
In order to investigate the appropriate wavelength for the determination of PGB, solution of PGB was scanned by UV spectrophotometer in the range of 190 – 450 nm. The maximum absorbance was observed at 210 nm and this wavelength was fixed for the analysis of Pregabalin.
The absorbance – concentration plot for the proposed method was found to be rectilinear over the range of 0.5–5.0 μg/ml. Linear regression analysis of calibration data gave the regression equation cited in Table 1 with correlation coefficients close to unity. Statistical analysis of regression lines were made regarding the standard deviation of residuals (Sx/y), standard deviation of slopes (Sb) and standard deviation of intercepts (Sa) and the values are summarized in Table 1.
Table 1.
Summary of optical and regression characteristics of the proposed method
| Parameters | Pregabalin |
|---|---|
| Linear dynamic range (μg/ml) | 0.50–5.00 |
| Regression equationa | Y = 5.02 × 10⁻²X – 1.8 × 10⁻³ |
| Sa | 9.17 × 10⁻⁴ |
| t Sab | 2.04 × 10⁻³ |
| Sb | 2.62 × 10⁻⁴ |
| t Sbb | 5.84 × 10⁻⁴ |
| Correlation coefficient (r) | 0.9999 |
| LOD (μg/ml) | 2.47 × 10⁻¹ |
| LOQ (μg/ml) | 8.15 × 10⁻² |
| Variance (So2) of calibration line | 1.54 × 10⁻⁶ |
With respect to Y = a + b X, where X is the concentration in μg/ml, Y is Absorbance;
Confidence interval of the intercept and slope at 95% confidence level and ten degrees of freedom (t=2.228).
The within day precision assays were carried out through replicate analysis (n=5) of PGB corresponding to 2.0, 3.5 and 5.0 μg/ml. The interday precision was evaluated through replicate analysis of the pure drug samples for five consecutive days at the same concentration levels as used in within day precision. The results of these assays are reported in Table 2. As can be seen from Table 2 that the recovery and RSD values for within day precision were always lower than 100.057 % and 0.891 %; recovery and RSD values for interday precision were lower than 100.056% and 0.968 %. The precision results are satisfactory. The intraday and interday precision assays were also carried for PGB in pharmaceutical formulations. The results are summarized in Table 3. As can be seen from Table 3 that the recovery and RSD values were in the ranges 99.920 to 100.171 %; 0.258 to 0.968 % and 99.801 to 100.199 % ; 0.203 to 1.136 % respectively for intraday and interday precision.
Table 2.
Summary of accuracy and precision results of the proposed method in pure form
| Proposed methods | Amount (μg/ml) |
RSD (%) | REC. (%) | SAEb | C.L.c | |
|---|---|---|---|---|---|---|
| Taken | Found ± SDa | |||||
| Intra day assay | 2.00 | 2.000 ± 0.018 | 0.891 | 99.990 | 8.0 × 10⁻³ | 6.7 × 10⁻² |
| 3.50 | 3.502 ± 0.014 | 0.402 | 100.057 | 2.8 × 10⁻³ | 7.8 × 10⁻³ | |
| 5.00 | 4.999 ± 0.017 | 0.333 | 99.999 | 7.5 × 10⁻³ | 2.1 × 10⁻³ | |
| Inter day assay | 2.00 | 1.999 ± 0.019 | 0.968 | 99.924 | 8.7 × 10⁻³ | 2.4 × 10⁻² |
| 3.50 | 3.502 ± 0.024 | 0.697 | 100.056 | 1.1 × 10⁻² | 3.0 × 10⁻² | |
| 5.00 | 4.996 ± 0.020 | 0.399 | 99.920 | 8.9 × 10⁻³ | 2.5 × 10⁻² | |
Mean for 5 independent analyses;
SAE, standard analytical error;
C.L., confidence limit at 95% confidence level and 4 degrees of freedom (t=2.776).
Table 3.
Summary of accuracy and precision results of the proposed method in pharmaceutical formulations
| Proposed methods | Amount (μg/ml) |
RSD (%) | REC. (%) | SAEb | C.L.c | |
|---|---|---|---|---|---|---|
| Taken | Found ± SDa | |||||
| Intra day assay | ||||||
| Gabanext-75 | 2.00 | 2.000±0.018 | 0.891 | 100.000 | 0.0070 | 0.0221 |
| Gabanext-75 | 3.50 | 3.498±0.017 | 0.477 | 99.943 | 0.0075 | 0.0201 |
| Gabanext-75 | 5.00 | 4.999±0.017 | 0.333 | 99.999 | 0.0074 | 0.0206 |
| Pregalin-75 | 2.00 | 1.999±0.006 | 0.258 | 99.980 | 0.0023 | 0.0064 |
| Pregalin-75 | 3.50 | 3.498±0.017 | 0.476 | 99.943 | 0.0074 | 0.0207 |
| Pregalin-75 | 5.00 | 4.996±0.032 | 0.630 | 99.920 | 0.0141 | 0.0391 |
| Neugaba-75 | 2.00 | 1.999±0.011 | 0.569 | 99.970 | 0.0051 | 0.0142 |
| Neugaba-75 | 3.50 | 3.502±0.031 | 0.899 | 100.057 | 0.0141 | 0.0391 |
| Neugaba-75 | 5.00 | 5.004±0.023 | 0.454 | 100.080 | 0.0102 | 0.0282 |
| Maxgalin-75 | 2.00 | 1.999±0.011 | 0.569 | 99.970 | 0.0051 | 0.0142 |
| Maxgalin-75 | 3.50 | 3.506±0.026 | 0.741 | 100.171 | 0.0117 | 0.0322 |
| Maxgalin-75 | 5.00 | 4.996±0.020 | 0.399 | 99.940 | 0.0089 | 0.0247 |
| Mahagaba-75 | 2.00 | 1.999±0.019 | 0.968 | 99.924 | 0.0087 | 0.0240 |
| Mahagaba-75 | 3.50 | 3.498±0.030 | 0.845 | 99.943 | 0.0132 | 0.0367 |
| Mahagaba-75 | 5.00 | 5.000±0.022 | 0.436 | 100.000 | 0.0098 | 0.0271 |
| Inter day assay | ||||||
| Gabanext-75 | 2.00 | 1.996±0.011 | 0.547 | 99.801 | 0.0049 | 0.0136 |
| Gabanext-75 | 3.50 | 3.494±0.018 | 0.510 | 99.829 | 0.0079 | 0.0221 |
| Gabanext-75 | 5.00 | 4.996±0.024 | 0.488 | 99.920 | 0.0109 | 0.0303 |
| Pregalin-75 | 2.00 | 1.999±0.011 | 0.569 | 99.970 | 0.0051 | 0.0142 |
| Pregalin-75 | 3.50 | 3.499±0.012 | 0.341 | 99.967 | 0.0053 | 0.0172 |
| Pregalin-75 | 5.00 | 4.997±0.010 | 0.203 | 99.940 | 0.0045 | 0.0125 |
| Neugaba-75 | 2.00 | 2.004±0.016 | 0.832 | 100.199 | 0.0075 | 0.0020 |
| Neugaba-75 | 3.50 | 3.498±0.012 | 0.331 | 99.943 | 0.0052 | 0.0144 |
| Neugaba-75 | 5.00 | 4.997±0.013 | 0.264 | 99.940 | 0.0059 | 0.0164 |
| Maxgalin-75 | 2.00 | 2.000±0.022 | 1.136 | 99.999 | 0.0102 | 0.0282 |
| Maxgalin-75 | 3.50 | 3.498±0.017 | 0.476 | 99.943 | 0.0074 | 0.0207 |
| Maxgalin-75 | 5.00 | 4.997±0.013 | 0.264 | 99.940 | 0.0059 | 0.0164 |
| Mahagaba-75 | 2.00 | 2.000±0.018 | 0.891 | 100.000 | 0.0070 | 0.0221 |
| Mahagaba-75 | 3.50 | 3.502±0.031 | 0.899 | 100.057 | 0.0141 | 0.0391 |
| Mahagaba-75 | 5.00 | 4.997±0.010 | 0.203 | 99.940 | 0.0045 | 0.0125 |
Mean for 5 independent analyses;
SAE, standard analytical error;
C.L., confidence limit at 95% confidence level and 4 degrees of freedom (t=2.776).
The proposed method was used for estimating of PGB from capsules after spiking with 50, 200 and 350 % of additional pure drug. The results are reported in Table 4. As can be seen from Table 4 that the recovery and RSD values were in the ranges 99.920 to 100.027 % and 0.152 to 0.923 %. The selectivity of the propose method was ascertained by analyzing standard PGB in the presence of excipients such as lactose monohydrate, corn, starch, talc and methyl cobalamin. It was observed that the excipients did not interfere with the proposed method.
Table 4.
Summary of data for the determination of pregabalin in pharmaceutical preparations by standard addition method
| Formulations | Amount (μg/ml) |
Recovery (%) | RSD (%) | SAEb | ||
|---|---|---|---|---|---|---|
| Taken | Added | Found ± SDa | ||||
| Capsules | ||||||
| Gabanext-75 | 1.00 | 0.50 | 1.499 ± 0.008 | 99.920 | 0.503 | 0.0034 |
| 1.00 | 2.00 | 3.001 ± 0.012 | 100.026 | 0.399 | 0.0054 | |
| 1.00 | 3.50 | 4.499 ± 0.011 | 99.982 | 0.233 | 0.0047 | |
| Neugaba-75 | 1.00 | 0.50 | 1.499 ± 0.004 | 99.973 | 0.238 | 0.0016 |
| 1.00 | 2.00 | 2.999 ± 0.011 | 99.987 | 0.350 | 0.0047 | |
| 1.00 | 3.50 | 4.498 ± 0.008 | 99.965 | 0.176 | 0.0035 | |
| Maxgalin-75 | 1.00 | 0.50 | 1.500 ± 0.009 | 99.973 | 0.590 | 0.0040 |
| 1.00 | 2.00 | 2.999 ± 0.014 | 99.960 | 0.474 | 0.0064 | |
| 1.00 | 3.50 | 4.500 ± 0.008 | 100.001 | 0.175 | 0.0035 | |
| Pregalin- 75 | 1.00 | 0.50 | 1.499 ± 0.014 | 99.947 | 0.923 | 0.0062 |
| 1.00 | 2.00 | 2.999 ± 0.009 | 99.973 | 0.284 | 0.0038 | |
| 1.00 | 3.50 | 4.498 ± 0.010 | 99.946 | 0.220 | 0.0044 | |
| Mahagaba-75 | 1.00 | 0.50 | 1.499 ± 0.008 | 99.973 | 0.473 | 0.0032 |
| 1.00 | 2.00 | 3.001 ± 0.007 | 100.027 | 0.242 | 0.0033 | |
| 1.00 | 3.50 | 4.496 ± 0.006 | 99.920 | 0.152 | 0.0031 | |
Mean for 5 independent analyses;
SAE, standard analytical error.
The proposed method was further extended to the in vitro determination of PGB in spiked human urine samples. In neuropathic patients, PGB is orally given in doses of 150 to 600 mg per day, with an associated mean of around 123 μg.hr/ml. Pregabalin undergoes minimal metabolism in human with unchanged parent representing ≥90% of drug derived in urine. This concentration fell well within working range of proposed method. The calibration graphs were constructed by plotting absorbance versus increasing concentrations of PGB in spiked human urine samples over the concentration range 0.5–5.0 μg/ml. The results (Table 5) are satisfactorily accurate and precise.
Table 5.
Application of the proposed UV method to the determination of pregabalin in human urine samples
| Amount added (μg/ml) | Amount found (μg/ml) | Recovery (%) |
|---|---|---|
| 1.00 | 0.9721 | 97.210 |
| 2.00 | 1.9681 | 98.405 |
| 3.00 | 2.9641 | 98.803 |
| 4.00 | 3.9801 | 99.503 |
| 5.00 | 4.9960 | 99.920 |
| X | 98.768 | |
| RSD | 1.065 | |
CONCLUSIONS
The proposed method does not require any laborious clean up procedure before measurement. In addition, the method has wider linear dynamic range with good accuracy and precision. The method shows no interference from the common excipients and additives. Since in human unchanged parent representing ≥ 90% of drug is derived in urine, this method can be used for estimating unabsorbed PGB in urine samples by very simple, cost affective, fast and efficient method. This may help in analyzing affectivity of this drug in human beings during treatment. Therefore, it is concluded that the proposed method is simple, sensitive and rapid for the determination of pregabalin in bulk, pharmaceutical formulations and in human urine samples.
REFERENCES
- 1.Tassone DM, Boyce E, Guyer J, Nuzum D. Clin. Ther. 2007;29:26–48. doi: 10.1016/j.clinthera.2007.01.013. [DOI] [PubMed] [Google Scholar]
- 2.Hamandi K, Sander JW. Seizure. 2006;15:73–78. doi: 10.1016/j.seizure.2005.11.005. [DOI] [PubMed] [Google Scholar]
- 3.Freynhagen R, Strojek K, Griesing T, Whalen E, et al. Pain. 2005;115:254–263. doi: 10.1016/j.pain.2005.02.032. [DOI] [PubMed] [Google Scholar]
- 4.Sharma U, Young J, LaMoreaux L. Pain. 2005;6:S29. [Google Scholar]
- 5.Wesche D, Bockbrader H. Pain. 2005;6:29. [Google Scholar]
- 6.Stewart BH, Kugler AR, Thompson PR, Bockbrader HN. Pharm. Res. 1993;10:226–228. doi: 10.1023/a:1018951214146. [DOI] [PubMed] [Google Scholar]
- 7.Turck D, Vollmer KO, Bockbrader H. Eur. J. Clin. Pharmacol. 1989;36:310. [Google Scholar]
- 8.Vermeij TAC, Edelborek PM. J. Chromatogr. B. 2004;810:297–303. doi: 10.1016/j.jchromb.2004.08.018. [DOI] [PubMed] [Google Scholar]
- 9.Mandal U, Sarkar AK, Gowda KV, Agarwal S, et al. Chromatogra. 2008;67:237–243. [Google Scholar]
- 10.Oertel R, Arenz N, Pietsch J, Kirch W. J. Sep. Sci. 2008;32:238–243. doi: 10.1002/jssc.200800461. [DOI] [PubMed] [Google Scholar]
- 11.Önal A, Sagirli O. Spectrochim. Acta Part A: Molecular and Biomol. Spectros. 2009;72:68–71. doi: 10.1016/j.saa.2008.08.009. [DOI] [PubMed] [Google Scholar]
- 12.Food and Drug Administration of the United States. Guidance for industry – Bioanalytical Method Validation, U.S. Department of Health and Human Services. Centre for Drug Evaluation and Research (CDER), Center for Veterinary Medicine (CVM) 2001 http://www.fda.gov/cder/guidance/index.htm .
- 13.International Conference on the Harmonization of the Technical Requirements for Registration of Pharmaceuticals for Human Use (ICH) Q2A: Validation of Analytical Methods (Definitions and Terminology).1994. [Google Scholar]
- 14.ICH: Q2B Analytical Validation – Methodology. 1996 [Google Scholar]